SMILES Transformer: Pre-trained Molecular Fingerprint
for Low Data Drug Discovery
Abstract
In drug-discovery-related tasks such as virtual screening, machine learning is emerging as a promising way to predict molecular properties. Conventionally, molecular fingerprints (numerical representations of molecules) are calculated through rule-based algorithms that map molecules to a sparse discrete space. However, these algorithms perform poorly for shallow prediction models or small datasets. To address this issue, we present SMILES Transformer. Inspired by Transformer and pre-trained language models from natural language processing, SMILES Transformer learns molecular fingerprints through unsupervised pre-training of the sequence-to-sequence language model using a huge corpus of SMILES, a text representation system for molecules. We performed benchmarks on 10 datasets against existing fingerprints and graph-based methods and demonstrated the superiority of the proposed algorithms in small-data settings where pre-training facilitated good generalization. Moreover, we define a novel metric to concurrently measure model accuracy and data efficiency.
1 Introduction
Recently, deep learning has emerged as a powerful machine learning technology. When applied to big data, deep learning can show equal or even better performance than humans in many domains such as computer vision (?), natural language processing (NLP) (?; ?), making decisions (?), and medicine (?). Based on projected performance benchmarks, deep learning is expected to be useful a tool to handle time-consuming tasks.
Drug discovery is a process to find a new drug for a disease of interest from a chemical library and validate its efficacy and safety in clinical trials. This process usually takes more than a decade and is costly, and therefore may be improvable by deep learning methods. Indeed, deep learning has been applied to the process of drug discovery including quantitative structure-property relationships (QSPR) prediction (?; ?), molecule generation and lead optimization (?; ?), retrosynthesis planning (?; ?), and compound-protein affinity prediction (?).
In order to apply machine learning to drug discovery, molecular data must be transformed into a readable format for machine learning. One major approach is to transform molecular data into a simplified molecular input line entry system (SMILES), a text representation of molecules that is commonly used in many databases (?; ?). Recently, graph-based approaches (?; ?) have been proposed, which usually show better performance than text-based approaches, such as SMILES, in QSPR tasks. In these studies, the models are designed for large fully-labeled training data settings, which requires huge labeled datasets and a QSPR model for one-shot learning (?). However, in most cases, it is difficult to prepare large labeled datasets of experimentally validated molecular properties or affinities to proteins, so that graph-based approaches might have limited application. Therefore, the development of a high-performing algorithm for small datasets will be required.
Given recent progress in the NLP field (?; ?; ?), a pre-training approach may be a promising way to address this challenge. Language model pre-training can exploit huge unlabeled corpora to learn the representations of words and sentences and then the pre-trained model is fine-tuned to downstream tasks using a relatively smaller set of labeled data. Indeed, pre-training approaches have been implemented in the cheminformatics field: a pre-trained sequence-to-sequence learning models (seq2seq) composed of RNNs (?) or variational autoencoders (VAE) (?) by decoding SMILES from the learned representations (?; ?; ?; ?; ?; ?). However, these studies did not demonstrate performance in small data settings. In other words, the performance on small data settings of pre-training approaches in the cheminformatics field has not been evaluated yet. In this study, by applying the latest pre-training method in the NLP field to cheminformatics, we propose a new approach called SMILES Transformer (ST) that shows higher performance on small data settings than other approaches. ST is based on a Transformer (?) pre-trained in an unsupervised way that produce continuous, data-driven fingerprints of molecules given SMILES. These fingerprints grasp the semantics of molecules and can be fed to arbitrary predictive models for many downstream tasks.
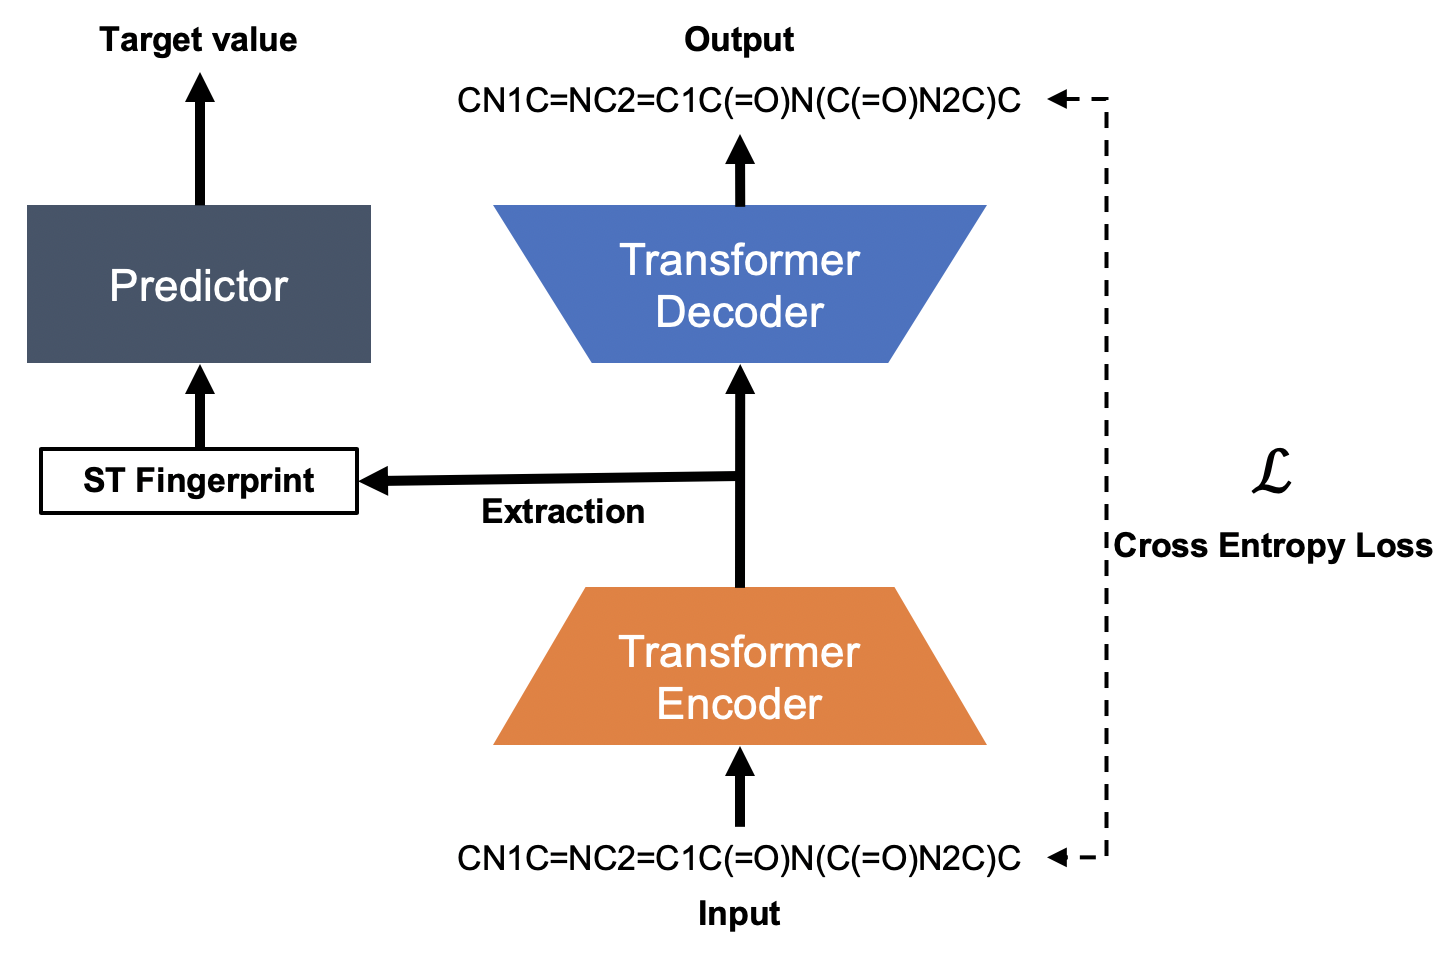
In order to evaluate the QSPR performance on small data settings, we focused on data efficiency. However, because there are few works focusing on data efficiency, which metric should be used is elusive. The most related work may be done by (?), where model performance is evaluated against the size of the training set and data efficiency is emphasized as well as the best score. In this study, we propose a novel scalar metric to evaluate data efficiency. Our proposed model is described in Figure 1.
To sum up, our contributions include the following:
-
•
We propose a data-driven fingerprinting model, SMILES Transformer, which works well with simple predictors and enables state-of-the-art data efficiency in 5 out of 10 datasets in MoleculeNet.
-
•
We pre-train Transformers with unlabeled SMILES to learn their representations and show the potential of text-based models compared to baseline models including graph convolutions.
-
•
We propose a scalar metric for data efficiency that measures model performance under different sizes of training data.
In the first section, we will explain how ST is trained and the fingerprints are extracted. In the second section, we define the metric for data efficiency. In the third section, we will compare the performance of ST fingerprints against other methods using 10 different datasets from MoleculeNet and more deeply inspect the pre-trained ST including latent space visualization. Finally, we discuss possible future directions.
2 Methods
In this section, we introduce the SMILES Transformer architecture, pre-training settings, and how to design ST fingerprints. We then propose a novel metric for data efficiency.
2.1 SMILES Transformer
Model Architecture
Unlike RNNs, Transformers (?) do not have recurrent connections and are therefore more stable and faster to converge. Moreover, they empirically show better featurization performance on long sequences and complicated problems than RNNs. Hence, they are chosen as the de facto standard models in NLP (?; ?).
We built an encoder-decoder network with 4 Transformer blocks for each with PyTorch (?). Each Transformer block has 4-head attentions with 256 embedding dimensions and 2 linear layers.
Pre-training settings
We pre-trained ST with 861,000 unlabeled SMILES randomly sampled from ChEMBL24, a dataset of bioactive and real molecules (?). The SMILES was split into symbols (e.g., ’c’, ’Br’, ’=’, ’(’, ’2’) and then the symbols were one-hot encoded to input to the network. To alleviate bias for the canonical representation of SMILES, we randomly transformed them every time they were used by the SMILES enumerator (?). Following the original paper (?), we used the sum of token encoding and positional encoding to input to the network. The network was trained for 5 epochs to minimize the cross entropy between the input SMILES and the output probability by the Adam optimizer (?). After convergence, the network achieved a perplexity of 1.0, meaning perfect decoding from the encoded representations.
| Category | Dataset | Tasks | Type | Mols | Metric | Description |
| Physical chemistry | ESOL | 1 | R | 1128 | RMSE | Aqueous solubility |
| FreeSolv | 1 | R | 643 | RMSE | Hydration free energy | |
| Lipophilicity | 1 | R | 4200 | RMSE | Octanol/water distribution coefficient (logD) | |
| Biophysics | MUV | 17 | C | 93 127 | PRC-AUC | 17 tasks from PubChem BioAssay |
| HIV | 1 | C | 41 913 | ROC-AUC | Ability to inhibit HIV replication | |
| BACE | 1 | C | 1522 | ROC-AUC | Binding results for inhibitors of human BACE-1 | |
| Physiology | BBBP | 1 | C | 2053 | ROC-AUC | Blood-brain barrier penetration |
| Tox21 | 12 | C | 8014 | ROC-AUC | Toxicity measurements | |
| SIDER | 27 | C | 1427 | ROC-AUC | Adverse drug reactions on 27 system organs | |
| ClinTox | 2 | C | 1491 | ROC-AUC | Clinical trial toxicity and FDA approval status |
| Dataset | ESOL | FrSlv | Lipo | MUV | HIV | BACE | BBBP | Tox21 | Sider | ClinTox |
|---|---|---|---|---|---|---|---|---|---|---|
| ST+MLP (Ours) | 1.144 | 2.246 | 1.169 | 0.009 | 0.683 | 0.719 | 0.900 | 0.706 | 0.559 | 0.963 |
| ECFP+MLP | 1.741 | 3.043 | 1.090 | 0.036 | 0.697 | 0.769 | 0.760 | 0.616 | 0.588 | 0.515 |
| RNNS2S+MLP | 1.317 | 2.987 | 1.219 | 0.010 | 0.682 | 0.717 | 0.884 | 0.702 | 0.558 | 0.904 |
| GraphConv | 1.673 | 3.476 | 1.062 | 0.004 | 0.723 | 0.744 | 0.795 | 0.687 | 0.557 | 0.936 |
Fingerprint extraction
As the outputs of the Transformers are contextualized word-level representations, ST outputs a sequence of symbol-level (atom-level) representations. Therefore, we need to pool them to obtain the molecule-level representations (fingerprints). We concatenated the four vectors to get the fingerprints: mean and max pooled output of the last layer, the first output of the last and the penultimate layer. Now we have a 1024-dimensional fingerprint for each molecule from ST. This fingerprint is designed to have the same dimensionality with the baseline we use for, the extended-connectivity fingerprint (ECFP) (?).
2.2 Data Efficiency Metric (DEM)
Here we discuss how to measure the data efficiency of a predictive model in terms of the metric . Intuitively, data efficiency can be measured by averaging the metric of the model trained with different sizes of the training data.
More formally, let denote the whole available dataset and denote the test data sampled from at the rate of . Then, the training data and the model trained with them can be represented as and , respectively. The metric should be chosen to be suitable for the tasks. That is, in classification tasks should be the area under the receiver operation characteristics (ROC-AUC) or the F1 score and in regression tasks should be the R2 score or the root mean squared error (RMSE).
Now the proposed Data Efficiency Metric (DEM) is formulated as:
| (1) |
Since we used various datasets with a wide range of sizes in the experiment described below, the percentage of the training data should be increased exponentially. Therefore, is doubly increased from 1.25% to 80%, i.e., .
3 Experiments
We conducted five experiments to see how SMILES Transformer works from different perspectives. First, we evaluated the performance of ST against other baseline models on 10 chemical datasets. Second, we visualized the latent space to answer the question: why do ST fingerprints work well for certain datasets? Third, we applied linear models to ST and other fingerprints in order to validate that ST maps molecules to a good latent space by minimizing the contribution of the models themselves. Fourth, we evaluated our ST and baseline models on a stratified dataset by the lengths of SMILES to see when ST provides an advantage. Finally, we compared the maximum performance of ST against state-of-the-art models under large data settings.
3.1 Performance on Downstream Tasks
Datasets
We evaluated the performance of our pre-trained SMILES Transformer on 10 datasets from MoleculeNet (?), a benchmark for molecular property prediction. These datasets were chosen because they do not use 3D information and the sizes are not too large. The datasets are different from each other in their domains, task types, and sizes.
-
•
Physical chemistry: ESOL, FreeSolv, and Lipophilicity
-
•
Biophysics: MUV, HIV, and BACE
-
•
Physiology: BBBP, Tox21, SIDER, and ClinTox
The information about each dataset is summarized in Table 1. For the evaluation metrics, we used the root mean squared error (RMSE) for the regression tasks and the area under the receiver operating characteristic curve (ROC-AUC) or the area under the precision-recall curve (PRC-AUC) for the classification tasks as suggested in (?).
Baseline models
We compared our pre-trained SMILES Transformer to the following three baseline models for molecular property prediction tasks:
-
•
ECFP4 (?) is a hand-crafted fingerprint. It hashes multi-scaled substructures to integers and makes a fixed-length binary vector where 1 indicates the existence of the assigned substructure and 0 for the absence. ECFP4 counts substructures with the diameters up to 4.
-
•
RNNS2S (?) is another text-based pre-trained fingerprint that adopts RNN Seq2seq for the model architecture.
-
•
GraphConv (?) learns and predicts the target value directly through graph convolution operations, rather than extracting fingerprints and building another model for supervised downstream tasks. Although GraphConv is not a task-agnostic fingerprint, we include it here as the state-of-the-art model.
We used RDKit (?) to compute ECFP4 and DeepChem (?) implementation of GraphConv (with the default hyperparmeters). For RNNS2S, we implemented it with PyTorch (?) and pre-trained it with the same dataset as ST. The encoder and the decoder are both 3-layer bidirectional gated recurrent units (GRUs) (?) with 256 hidden vector dimensions. We obtained the same dimension of fingerprint as ST by concatenating two outputs from the last and the penultimate layer.
Experiment settings
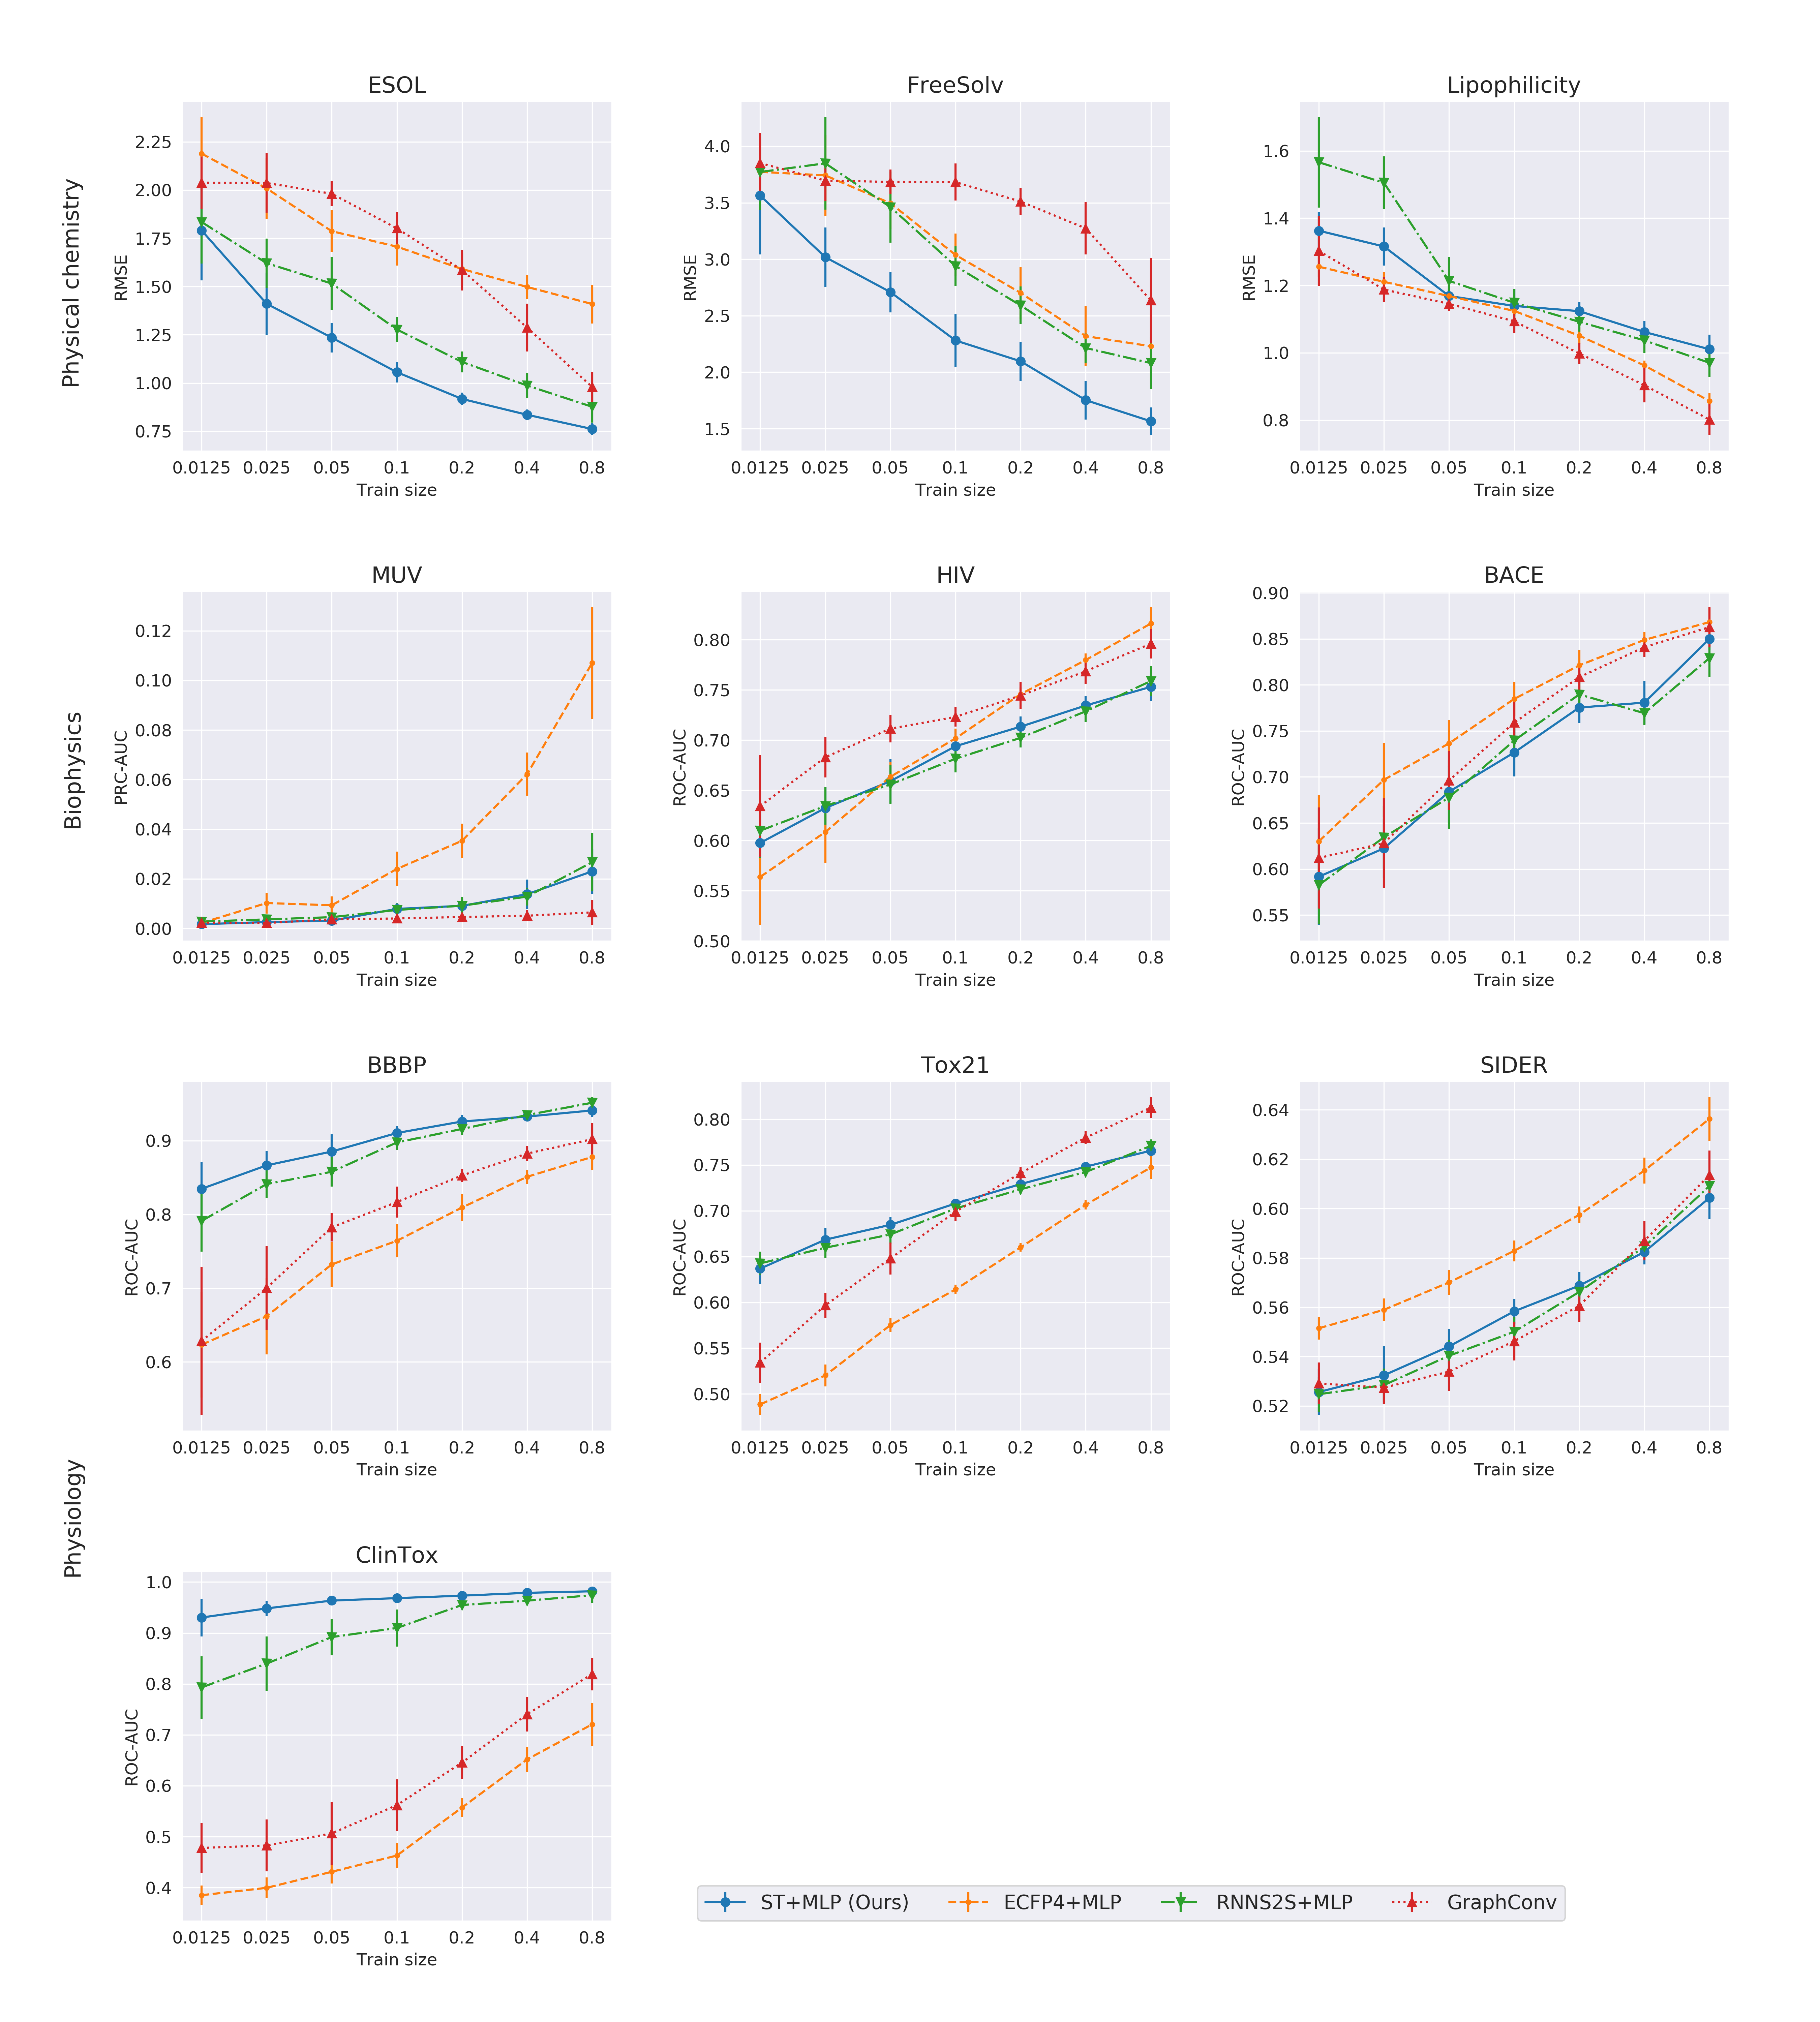
In the downstream tasks, we used simple models, such as multilayer perceptron (MLP) classifiers and regressors with the same default hyperparameters in scikit-learn (?) in order to evaluate the performance of the three fingerprints, themselves as much as possible. All of these fingerprints have 1,024 dimensions. The datasets were randomly split (stratified for classification) to train sets and test sets by the percentage . Note that we did not use a scaffold split suggested in (?). We ran 20 trials for each split and report the mean score and standard deviation in Figure 2 and DEM in Table 2. The metrics were chosen as recommended in MoleculeNet.
Results
Table 2 shows DEM of the 4 models. ST achieves the best score in 5 out of 10 datasets, followed by ECFP and GraphConv.
See Figure 2 for the performance change against the train size. In ESOL, FreeSolv, BBBP, and ClinTox, ST performs the best at almost all points by a significant margin and especially high scores when the train size is small compared to the other models. In Tox21, ST supports good prediction along RNNS2S, but is beaten by GraphConv as the train size increase. In Lipophilicity, MUV, BACE, and SIDER, ECFP or GraphConv can predict better than ST.
3.2 Visualization of the Latent Space
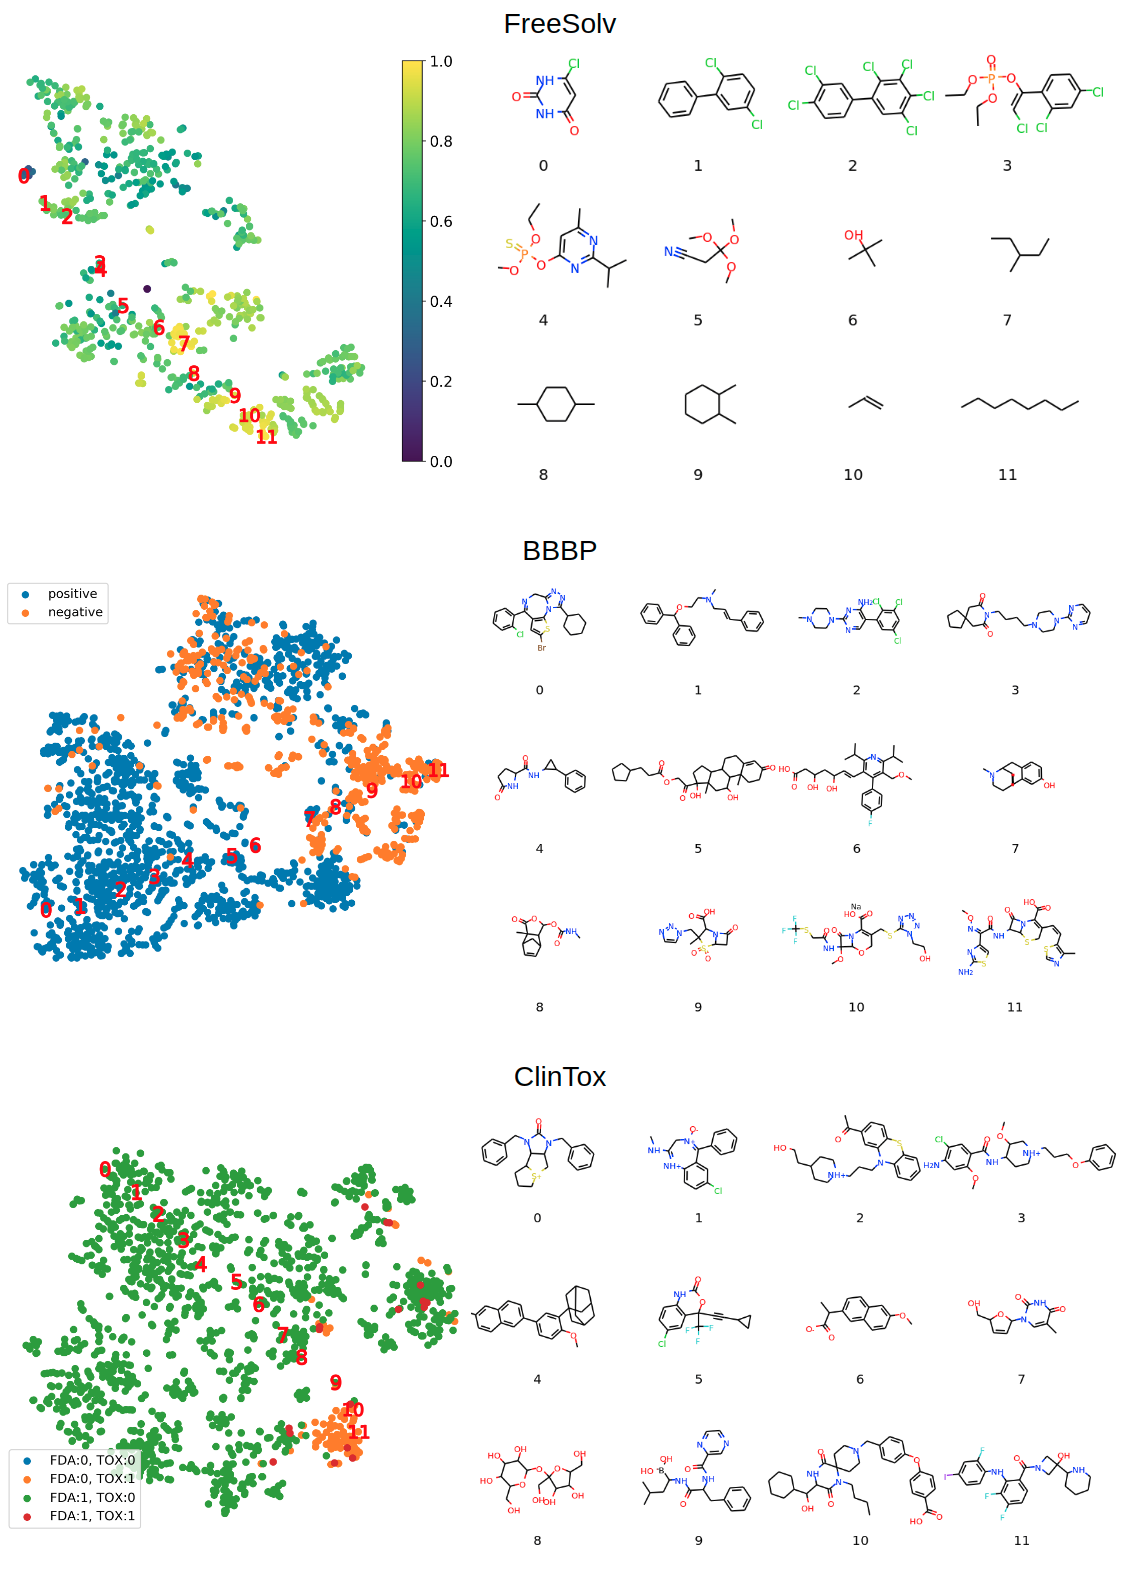
To inspect why our ST fingerprints lead to good predictive performance, we visualized the latent space and decode some samples from it. For each dataset in MoleculeNet, we conducted the following procedure:
-
1.
Calculate the ST fingerprint (1024-dimension) of each molecule.
-
2.
Reduce their dimensions to 2 with t-SNE (?).
-
3.
Plot the reduced features into a 2-dimensional space coloring by the target value.
-
4.
Choose a trajectory in the 2-dimensional space and divide it into 12 points.
-
5.
Find the nearest neighbors of the 12 points and draw the corresponding molecules.
We show the result of the three datasets where ST fingerprints work especially well in Figure 3, that is, FreeSolv, BBBP, and ClinTox. In FreeSolv, it can be seen that there is a clear gradation from upper left to lower right, and the molecule becomes simpler (i.e., less loops and branches) along the trajectory. In BBBP and ClinTox, the categorical target values are successfully separated, but there is no clear trends in the decoded molecules.
3.3 Application of Simple Predictive Models
In Section 3.1, we used MLP for the predictive model to ST, RNNS2S, and ECFP, expecting that combining it with these fingerprints would work comparably or better than GraphConv. Here we used the simplest models to measure the pure effect of the fingerprints. To be specific, adding L2 regularization to avoid overfitting, we used ridge regression for regression tasks and logistic regression with L2 penalty for classification tasks. We excluded MUV and SIDER from this experiment because their highly imbalanced columns caused errors in the solver and ROC-AUC functions implemented in scikit-learn (?). We followed the same procedure as in Section 3.1 except for the model selection and datasets and the results are shown in Table 3.
| Dataset | ESOL | FrSlv | Lipo | HIV | BACE | BBBP | Tox21 | ClinTox |
|---|---|---|---|---|---|---|---|---|
| ST (Ours) | 1.140 | 2.452 | 1.213 | 0.696 | 0.720 | 0.895 | 0.711 | 0.958 |
| ECFP | 1.678 | 2.843 | 1.174 | 0.727 | 0.790 | 0.825 | 0.710 | 0.704 |
| RNNS2S | 1.288 | 2.881 | 1.194 | 0.688 | 0.727 | 0.884 | 0.709 | 0.915 |
| Dataset | ESOL | FrSlv | Lipo | HIV | BACE | BBBP | Tox21 | ClinTox |
|---|---|---|---|---|---|---|---|---|
| Splitting | random | random | random | scaffold | scaffold | scaffold | random | random |
| ST (Ours) | 0.72 | 1.65 | 0.921 | 0.729 | 0.701 | 0.704 | 0.802 | 0.954 |
| ECFP | 0.99 | 1.74 | 0.799 | 0.792 | 0.867 | 0.729 | 0.822 | 0.799 |
| GraphConv | 0.97 | 1.40 | 0.655 | 0.763 | 0.783 | 0.690 | 0.829 | 0.807 |
| Weave | 0.61 | 1.22 | 0.715 | 0.703 | 0.806 | 0.671 | 0.820 | 0.832 |
Our ST fingerprints with linear models achieved the best scores in 5 out of 8 datasets, indicating that the ST fingerprint is a strong fingerprint that leads to the best performance regardless of model selection.
3.4 Stratified Scores by the Size of Molecules
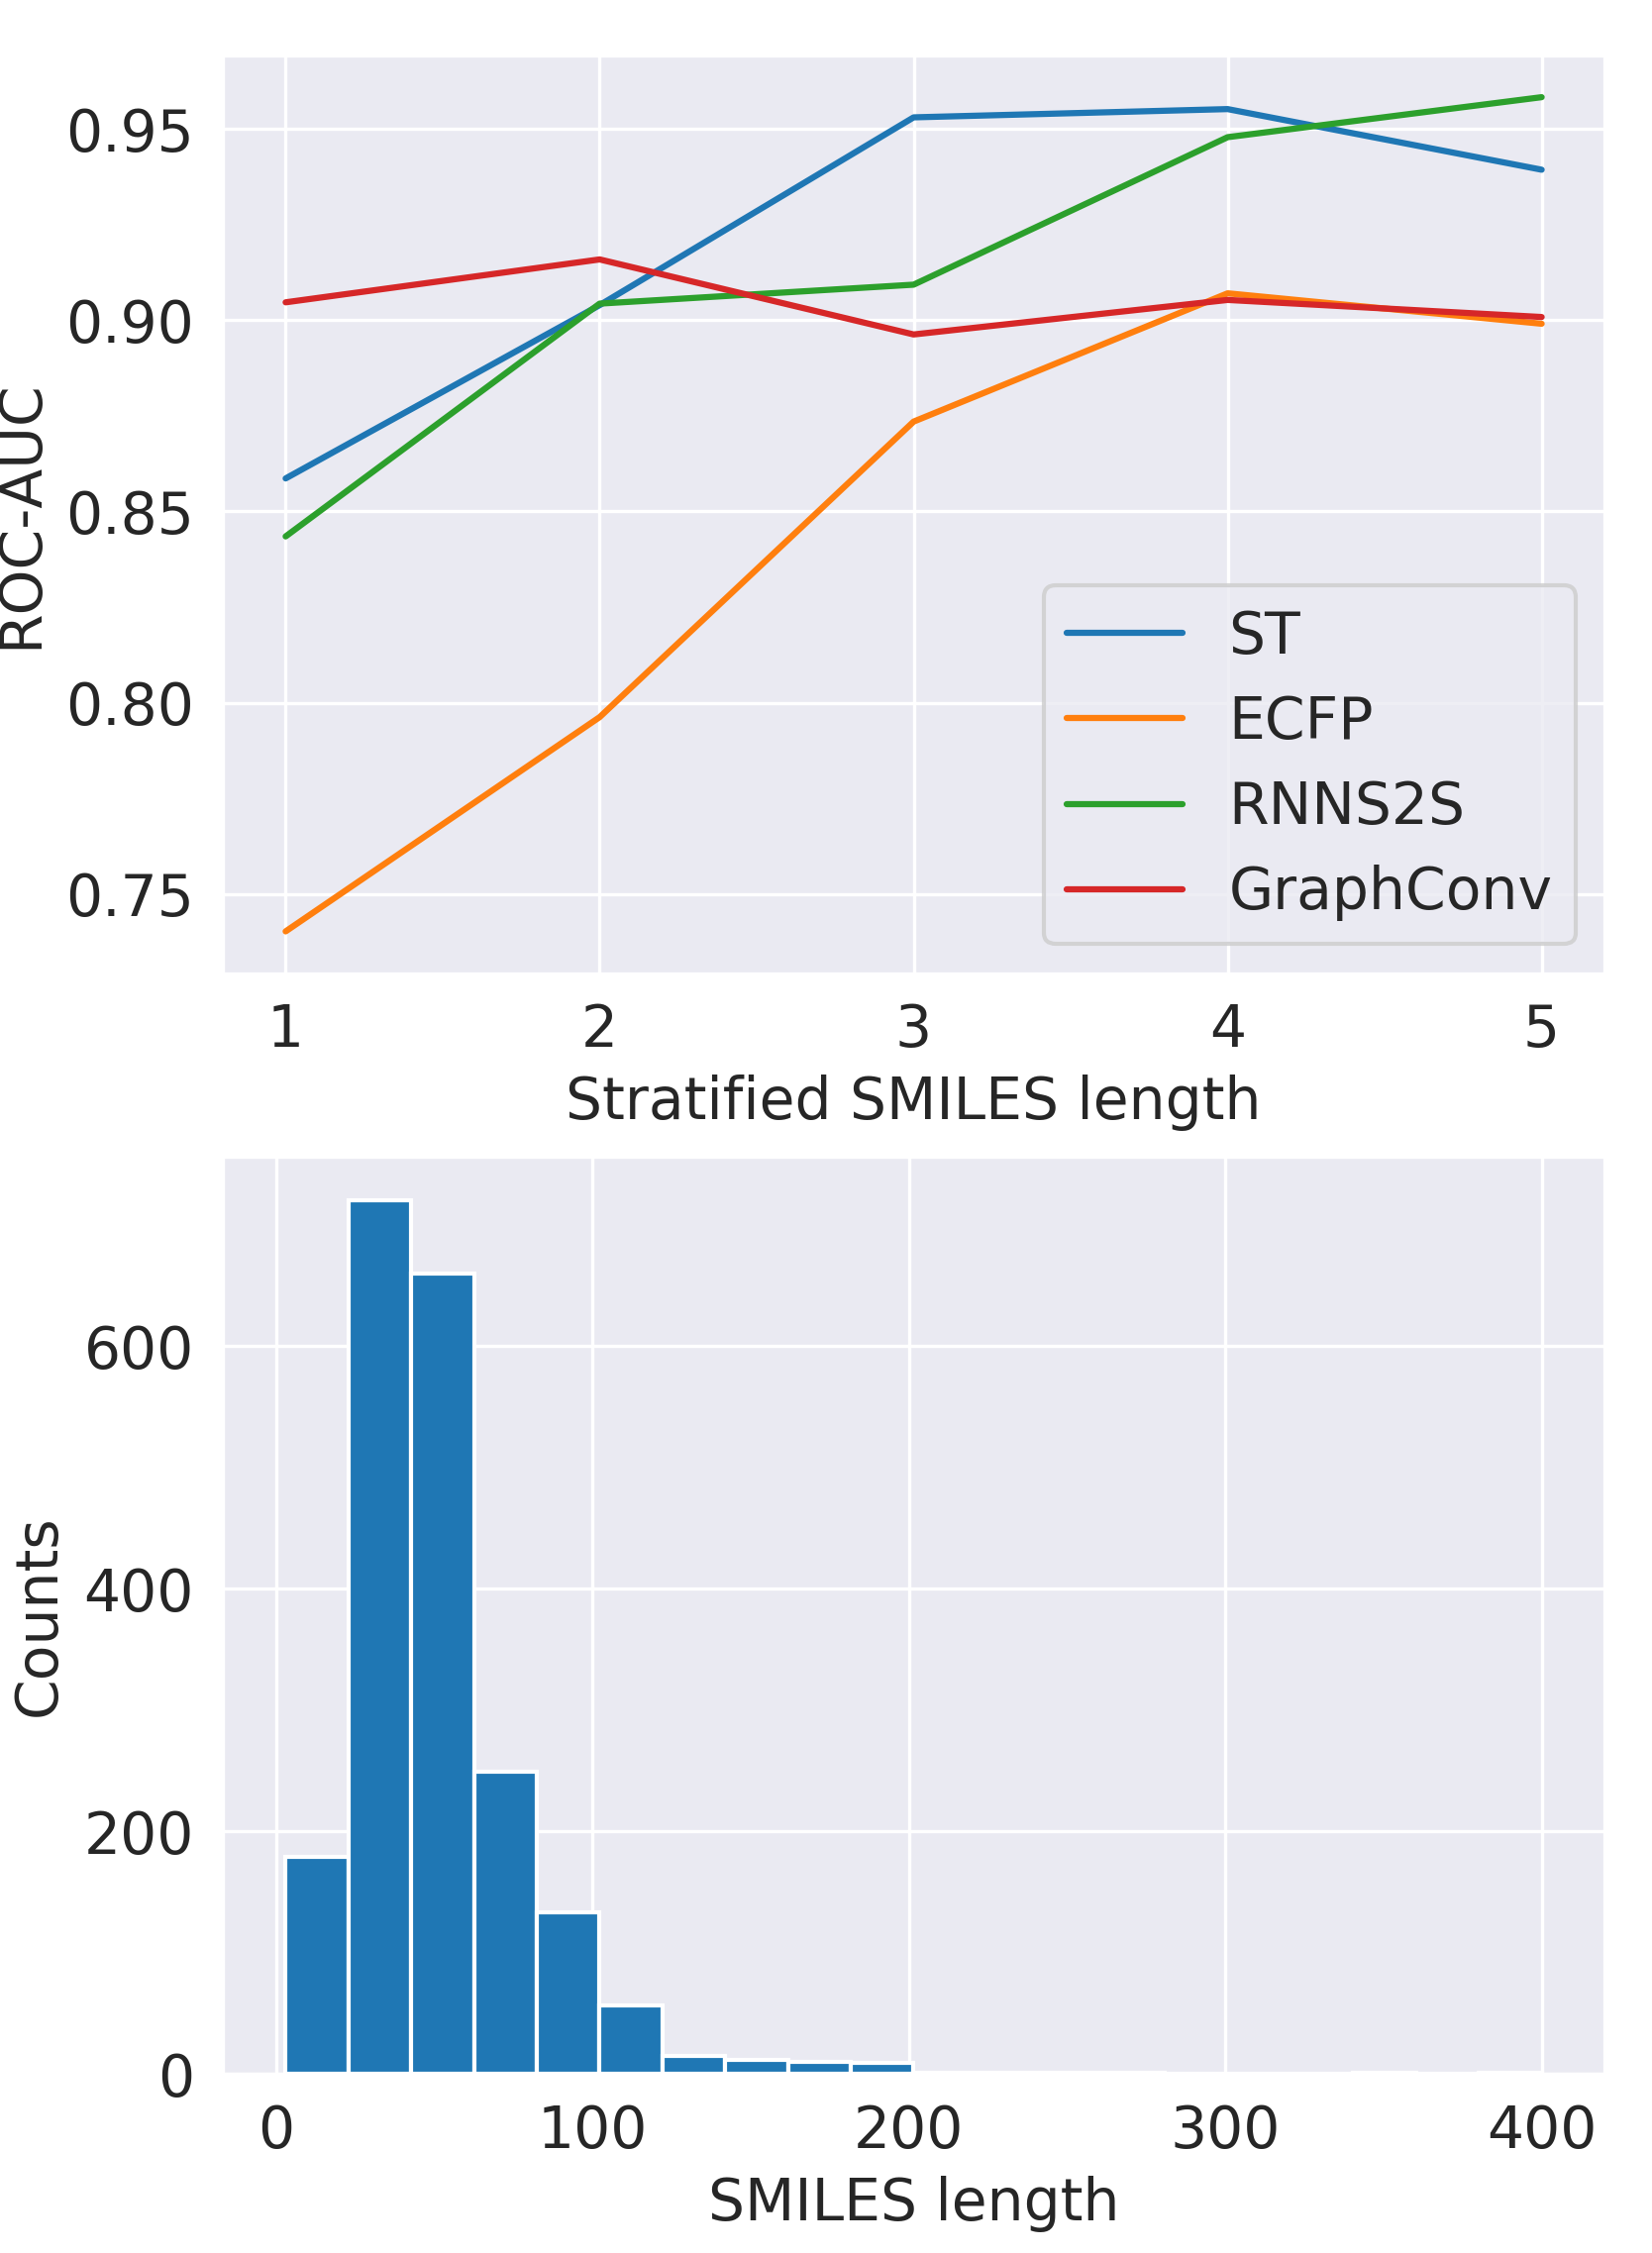
We conducted another study to inspect when ST has an advantage against other models. We stratified the BBBP dataset by the lengths of SMILES (similar to the sizes of the molecules) into 5 groups and evaluated within each group. The scores and the distributions of the lengths of SMILES are shown in Figure 4.
Figure 4 indicates that the ROC-AUC score of ST increases along the length of SMILES, which is a similar trend to the other text-based fingerprint, RNNS2S. On the other hand, GraphConv shows more or less the same performance regardless of the SMILES lengths. These results suggest that longer SMILES give ST richer information for better discrimination.
3.5 Comparison with Record Scores
Finally, we compared the maximum performance of ST under the large data setting with the reported scores in MoleculeNet. Since the ST fingerprint is proven to be better than the RNNS2S fingerprint, we omitted it and instead added another graph-based model named Weave (?) to the baselines. In this experiment, the datasets were split into train, validation, test sets with the proportion of 80%, 10%, 10%. The validation sets were used for hyperparameter tuning and the test sets were only used for calculating the scores. To fairly compare with the reported scores, the datasets HIV, BACE, BBBP used a scaffold split and the others were split randomly. We choose the model and hyperparameter set achieving the best validation score with optuna (?), from a linear model with L2 penalty, MLP, and LightGBM (?). We conducted three independent runs and reported the average scores in Table 4
ST achieves first place only in ClinTox, but performs comparable to ECFP and graph-based models in the other datasets. We can conclude that our ST fingerprints, if carefully tuned, are still useful even when the large number of labels are available.
4 Conclusions
In this paper, we propose SMILES-Transformer, a data-driven molecular fingerprint produced by a Transformer-based seq2seq pre-trained with a huge set of unlabeled SMILES. ST fingerprints were shown to work well with any predictive model in MoleculeNet downstream tasks and is effective especially when there is not enough labeled data. When large labeled data are available, ST fingerprints work comparable to other state-of-the-art baselines such as GraphConv. We also propose DEM, a novel metric for data efficiency. In terms of DEM, the ST fingerprint is better than existing methods in 5 out of 10 downstream tasks.
Future work can continue in three directions. First, replacing the Transformer in ST with Transformer-XL, an extended model that can handle much longer sequences, will alleviate the length limit of ST. Second, ST will be even stronger when trained in a multi-task fashion as done in ChemNet (?): predicting automatically-calculated molecular descriptors (e.g., molecular weight, LogP) as well as decoding the input SMILES. This will help the model to learn more chemistry-relevant representations. Finally, making use of the information of enumerated SMILES is one of the keys to improving text-based molecular representations. As done in (?), a set of different SMILES of the same molecule can be used to restrict the latent space.
Our implementation for SMILES-Transformer is available at https://github.com/DSPsleeporg/smiles-transformer
References
- [Akiba et al. 2019] Akiba, T.; Sano, S.; Yanase, T.; Ohta, T.; and Koyama, M. 2019. Optuna: A next-generation hyperparameter optimization framework. In ACM SIGKDD, 2623–2631. ACM.
- [Altae-Tran et al. 2017] Altae-Tran, H.; Ramsundar, B.; Pappu, A. S.; and Pande, V. 2017. Low data drug discovery with one-shot learning. ACS Cent. Sci. 3(4):283–293.
- [Bjerrum and Sattarov 2018] Bjerrum, E., and Sattarov, B. 2018. Improving chemical autoencoder latent space and molecular de novo generation diversity with heteroencoders. Biomolecules 8(4):131.
- [Bjerrum 2017] Bjerrum, E. J. 2017. Smiles enumeration as data augmentation for neural network modeling of molecules. arXiv preprint arXiv:1703.07076.
- [Cho et al. 2014] Cho, K.; van Merrienboer, B.; Gulcehre, C.; Bahdanau, D.; Bougares, F.; Schwenk, H.; and Bengio, Y. 2014. Learning phrase representations using rnn encoder–decoder for statistical machine translation. In EMNLP, 1724–1734.
- [Devlin et al. 2019] Devlin, J.; Chang, M.-W.; Lee, K.; and Toutanova, K. 2019. BERT: Pre-training of deep bidirectional transformers for language understanding. In NAACL-HLT, 4171–4186.
- [Duvenaud et al. 2015] Duvenaud, D. K.; Maclaurin, D.; Iparraguirre, J.; Bombarell, R.; Hirzel, T.; Aspuru-Guzik, A.; and Adams, R. P. 2015. Convolutional networks on graphs for learning molecular fingerprints. In NeurIPS, 2224–2232.
- [Gaulton et al. 2016] Gaulton, A.; Hersey, A.; Nowotka, M.; Bento, A. P.; Chambers, J.; Mendez, D.; Mutowo, P.; Atkinson, F.; Bellis, L. J.; Cibrián-Uhalte, E.; et al. 2016. The chembl database in 2017. Nucleic acids research 45(D1):D945–D954.
- [Goh et al. 2018] Goh, G. B.; Siegel, C.; Vishnu, A.; and Hodas, N. 2018. Using rule-based labels for weak supervised learning: a chemnet for transferable chemical property prediction. In ACM SIGKDD, 302–310. ACM.
- [Gómez-Bombarelli et al. 2018] Gómez-Bombarelli, R.; Wei, J. N.; Duvenaud, D.; Hernández-Lobato, J. M.; Sánchez-Lengeling, B.; Sheberla, D.; Aguilera-Iparraguirre, J.; Hirzel, T. D.; Adams, R. P.; and Aspuru-Guzik, A. 2018. Automatic chemical design using a data-driven continuous representation of molecules. ACS Cent. Sci. 4(2):268–276.
- [He et al. 2016] He, K.; Zhang, X.; Ren, S.; and Sun, J. 2016. Deep residual learning for image recognition. In CVPR, 770–778.
- [Jin, Barzilay, and Jaakkola 2018] Jin, W.; Barzilay, R.; and Jaakkola, T. 2018. Junction tree variational autoencoder for molecular graph generation. In ICML, 2328–2337.
- [Ke et al. 2017] Ke, G.; Meng, Q.; Finley, T.; Wang, T.; Chen, W.; Ma, W.; Ye, Q.; and Liu, T.-Y. 2017. Lightgbm: A highly efficient gradient boosting decision tree. In NeurIPS, 3146–3154.
- [Kearnes et al. 2016] Kearnes, S.; McCloskey, K.; Berndl, M.; Pande, V.; and Riley, P. 2016. Molecular graph convolutions: moving beyond fingerprints. J. Comput. Aided Mol. Des. 30(8):595–608.
- [Kingma and Ba 2015] Kingma, D. P., and Ba, J. 2015. Adam: A method for stochastic optimization. In ICLR.
- [Kingma and Welling 2014] Kingma, D. P., and Welling, M. 2014. Auto-encoding variational Bayes. In ICLR.
- [Kusner, Paige, and Hernández-Lobato 2017] Kusner, M. J.; Paige, B.; and Hernández-Lobato, J. M. 2017. Grammar variational autoencoder. In ICML, 1945–1954. JMLR. org.
- [Landrum 2016] Landrum, G. 2016. Rdkit: Open-source cheminformatics.
- [Maaten and Hinton 2008] Maaten, L. v. d., and Hinton, G. 2008. Visualizing data using t-sne. J. Mach. Learn. Res. 9(Nov):2579–2605.
- [Öztürk, Özgür, and Ozkirimli 2018] Öztürk, H.; Özgür, A.; and Ozkirimli, E. 2018. Deepdta: deep drug–target binding affinity prediction. Bioinformatics 34(17):i821–i829.
- [Paszke et al. 2017] Paszke, A.; Gross, S.; Chintala, S.; Chanan, G.; Yang, E.; DeVito, Z.; Lin, Z.; Desmaison, A.; Antiga, L.; and Lerer, A. 2017. Automatic differentiation in pytorch. In NIPS.
- [Pedregosa et al. 2011] Pedregosa, F.; Varoquaux, G.; Gramfort, A.; Michel, V.; Thirion, B.; Grisel, O.; Blondel, M.; Prettenhofer, P.; Weiss, R.; Dubourg, V.; et al. 2011. Scikit-learn: Machine learning in python. J. Mach. Learn. Res. 12(Oct):2825–2830.
- [Peters et al. 2018] Peters, M. E.; Neumann, M.; Iyyer, M.; Gardner, M.; Clark, C.; Lee, K.; and Zettlemoyer, L. 2018. Deep contextualized word representations. In NAACL-HLT, 2227–2237.
- [Ramsundar et al. 2019] Ramsundar, B.; Eastman, P.; Walters, P.; Pande, V.; Leswing, K.; and Wu, Z. 2019. Deep Learning for the Life Sciences. O’Reilly Media. https://www.amazon.com/Deep-Learning-Life-Sciences-Microscopy/dp/1492039837.
- [Rogers and Hahn 2010] Rogers, D., and Hahn, M. 2010. Extended-connectivity fingerprints. J. Chem. Inf. Model. 50(5):742–754.
- [Schwaller et al. 2018] Schwaller, P.; Laino, T.; Gaudin, T.; Bolgar, P.; Bekas, C.; and Lee, A. A. 2018. Molecular transformer for chemical reaction prediction and uncertainty estimation. arXiv preprint arXiv:1811.02633.
- [Segler, Preuss, and Waller 2018] Segler, M. H.; Preuss, M.; and Waller, M. P. 2018. Planning chemical syntheses with deep neural networks and symbolic ai. Nature 555(7698):604.
- [Silver et al. 2017] Silver, D.; Schrittwieser, J.; Simonyan, K.; Antonoglou, I.; Huang, A.; Guez, A.; Hubert, T.; Baker, L.; Lai, M.; Bolton, A.; et al. 2017. Mastering the game of go without human knowledge. Nature 550(7676):354.
- [Sutskever, Vinyals, and Le 2014] Sutskever, I.; Vinyals, O.; and Le, Q. V. 2014. Sequence to sequence learning with neural networks. In NeurIPS, 3104–3112.
- [Vaswani et al. 2017] Vaswani, A.; Shazeer, N.; Parmar, N.; Uszkoreit, J.; Jones, L.; Gomez, A. N.; Kaiser, Ł.; and Polosukhin, I. 2017. Attention is all you need. In NeurIPS, 5998–6008.
- [Winter et al. 2019] Winter, R.; Montanari, F.; Noé, F.; and Clevert, D.-A. 2019. Learning continuous and data-driven molecular descriptors by translating equivalent chemical representations. Chem. Sci. 10(6):1692–1701.
- [Wu et al. 2018] Wu, Z.; Ramsundar, B.; Feinberg, E. N.; Gomes, J.; Geniesse, C.; Pappu, A. S.; Leswing, K.; and Pande, V. 2018. Moleculenet: a benchmark for molecular machine learning. Chem. Sci. 9(2):513–530.
- [Xu et al. 2017] Xu, Z.; Wang, S.; Zhu, F.; and Huang, J. 2017. Seq2seq fingerprint: An unsupervised deep molecular embedding for drug discovery. In ACM BCB, 285–294. ACM.
- [Yang et al. 2019] Yang, Z.; Dai, Z.; Yang, Y.; Carbonell, J.; Salakhutdinov, R.; and Le, Q. V. 2019. Xlnet: Generalized autoregressive pretraining for language understanding. arXiv preprint arXiv:1906.08237.