Star formation histories of the LEGUS dwarf galaxies (III):
the non-bursty nature of 23 star forming dwarf galaxies
Abstract
We derive the recent star formation histories of 23 active dwarf galaxies using HST observations from the Legacy Extragalactic UV Survey (LEGUS). We apply a color-magnitude diagram fitting technique using two independent sets of stellar models, PARSEC-COLIBRI and MIST. Despite the non-negligible recent activity, none of the 23 star forming dwarfs show enhancements in the last 100 Myr larger than three times the 100-Myr-average. The unweighted mean of the individual SFHs in the last 100 Myr is also consistent with a rather constant activity, irrespective of the atomic gas fraction. We confirm previous results that for dwarf galaxies the CMD-based average star formation rates (SFRs) are generally higher than the FUV-based SFR. For half of the sample, the 60-Myr-average CMD-based SFR is more than two times the FUV SFR. In contrast, we find remarkable agreement between the 10-Myr-average CMD-based SFR and the H-based SFR. Finally, using core helium burning stars of intermediate mass we study the pattern of star formation spatial progression over the past 60 Myr, and speculate on the possible triggers and connections of the star formation activity with the environment in which these galaxies live. Approximately half of our galaxies show spatial progression of star formation in the last 60 Myr, and/or very recent diffuse and off-center activity compared to RGB stars.
Subject headings:
stellar evolution - star forming region, galaxies: stellar content1. Introduction
What is true for massive large galaxies may not be true for dwarf galaxies. Typically, large galaxies have formed a major fraction of their stars in the first Gyr, whereas dwarf galaxies exhibit a variety of star formation histories (SFHs, see, e.g., Tolstoy et al. 2009; McQuinn et al. 2011; Weisz et al. 2011; Gallart et al. 2015) and specific star formation rates, ranging from totally inactive, as in present-day dwarf spheroidal galaxies, to extremely active, as in blue compact dwarfs (BCDs). This heterogeneity, probably a consequence of the lack of global mechanisms like spiral arms or other organized gas motions, leads to the question of how the star formation in one part of a dwarf inhibits or enhances the formation of stars in another part. A popular model, the Stochastic Self-Propagating Star Formation (SSPSF, Gerola et al. 1980), predicts that a burst of star formation in a region (“cell”) of the galaxy could trigger secondary SF bursts in other adjacent cells. The newborn massive young stars can disturb the gas in an adjacent region with stellar winds, ionization and other energetic activities. The gas then collapses and begins its own starburst. The process continues until a stage is reached where no residual gas is in the condition to be affected by the young stars.
Despite the success of the model in producing a coherent physical scenario and matching several observed properties of star forming dwarfs (e.g. the apparent random distribution of star forming sites), the exact understanding of what sparked the initial starburst activity remains elusive. How starbursts are activated is an important question for large galaxies as well as dwarfs, and there are probably different answers for different galaxies. Potential mechanisms for promoting star formation (SF) in dwarfs can be broadly categorized as either internally-driven or externally-driven events. BCDs show star forming regions kinematically decoupled from the rest of the galaxy (Koleva et al. 2014), suggesting that giant star forming clumps in dwarf irregular galaxies could spiral-in towards the center (see Elmegreen et al. 2012), feeding intense star formation. This is because in such small galaxies, star forming clumps could be sufficiently massive to exceed a few percent of the galaxy mass enclosed inside their orbital radii, therefore producing dynamically significant torques on dark matter halo particles, halo stars, and the surrounding disk to lose their angular momentum with a timescale of 1 Gyr. Moreover, massive triaxial dark haloes or bars made of dark matter (Hunter & Elmegreen 2004) could promote the migration of a significant fraction of gas from the periphery to the center of the dwarf (Bekki & Freeman 2002), eventually igniting the starburst.
External processes must also be important (see e.g. Lahén et al. 2019). Low-mass galaxies are more fragile with respect to perturbations of various origins (interactions, inflows, mergers), hence their evolution is most sensitive to various kinds of galaxy encounters (e.g., distant tidals, close pass-byes, major and minor mergers). Indeed, the best-studied starburst dwarfs (e.g. IC10, NGC5253, NGC1569, II Zw 40, and others) seem to be interacting with, or absorbing, other structures (like gas clouds). For example, there is evidence for active accretion onto IC10 in the form of two in-moving streams of neutral gas with velocity gradients of several km/s/kpc (Ashley et al. 2014). These gradients correspond to accretion rates of the same order of the star formation rate, suggesting that the impact of this gas on the disk of this dwarf irregular is what is triggering the current starburst. NGC5253 is another interesting object: its highly efficient star formation might be caused by a streamer of gas (containing M⊙ extending -300 pc along the minor axis, entering the galaxy at a rate of pc/Myr) force-fed into the star-forming region by the galactic potential (Turner et al. 2015). The prototypical starburst dwarf NGC1569 shows copious gas infall (Stil & Israel 2002, Mühle et al. 2005) and, along the minor axis, hot gas outflow. The dwarf II Zw 40 appears to be the merger remnant of two colliding smaller gas rich dwarf galaxies. In general, dwarfs accreting dwarfs have been observed (see e.g. Tully et al. 2006; Martínez-Delgado et al. 2012; Rich et al. 2012; Annibali et al. 2016; Sacchi et al. 2016) and dwarf groups have been recently observed by Stierwalt et al. (2017) using the panchromatic TiNy Titans (TNT; Stierwalt et al. 2015) survey, a systematic study of SF in interacting dwarf galaxies. According to this study, the interaction between dwarf galaxies could be quantitatively different as compared to more massive counterparts. In fact, both paired dwarfs and paired massive galaxies show enhanced SF out to separations of kpc (e.g. Patton et al. 2013; Stierwalt et al. 2015), but the effect in dwarfs is stronger by a factor of 1.3 and involves a larger fraction of the virial radius.
In this context, the goal of this paper is to answer the following questions: 1) Is the starburst process characterised by long lived ( 10 Myr) bursts or short lived (a few Myr) bursts? 2) How does the SF spatially progress in these galaxies? 3) Is the SF activity causally connected to the environment? To quantify the strength of the starburst we choose a birthrate parameter b , where is the average star formation rate (SFR) over the longest look-back time that can be investigated in this paper (generally 60100 Myr). We call a galaxy with b a starburst galaxy.
The best place to look for answers is the sample of nearby star forming galaxies. The high spatial resolution and the high signal to noise multi-wavelength information which can be achieved for these systems is crucial to resolve and measure individual stars, and to draw their color-magnitude diagrams (CMDs). The CMD of a stellar system is in fact a fundamental tool to investigate its recent and past SF activity. In the distance range 4-12 Mpc, the exquisite spatial resolution of HST is necessary for a conclusive census, even for the most luminous stars, because they are usually formed in the dense cores of star-forming clouds, and therefore are found in compact groups. Another key advantage of HST with respect to ground-based data is its access to UV wavelengths. From a more general perspective, understanding the formation, evolution, and mass distribution of massive stars is critical for interpreting the integrated light of distant galaxies, for correctly modeling the chemical evolution of galaxies, and ultimately to unravel the history of star formation in the Universe, in terms of stellar mass formed and energy balance. A by product of our analysis is a robust test for stellar models of intermediate and massive stars.
While all studies of SFHs performed so far (e.g. Tolstoy et al. 2009 and references therein, Weisz et al. 2011) aimed at covering the longest possible look-back time and infer the SFH back to the earliest epochs, in this series of papers (Cignoni et al. 2018, hereafter Paper I) we take a different approach. We use a combination of UV and optical photometry provided by the Legacy ExtraGalactic UV Survey (LEGUS; Calzetti et al. 2015) to build and study the UV color-magnitude diagrams for a sample of 23 star forming dwarf galaxies (hereafter SFDs; see Table 1) at distances of 4-12 Mpc, and infer, at the highest temporal resolution possible (a few Myr in the last 20 Myr), the SFHs over the last 100 Myr. All these CMDs allow us to isolate samples of He-burning stars of intermediate mass, which are recognized as good chronometers (this age indicator was pioneered by Dohm-Palmer et al. 1997 on the dwarf irregular galaxy Sextans A and recently applied to several other SFDs by, e.g., McQuinn et al. 2011, 2012). Tracing these stars allows us to infer how the SF percolates, helping to shed light on the cause of such SF enhancements.
| Name aaGalaxy name and morphological type as listed in NED, the NASA Extragalactic Database. | Morph. aaGalaxy name and morphological type as listed in NED, the NASA Extragalactic Database. | Dist.bbDistances from Sabbi et al. (2018). | SFR60 ccCMD-based average SFR in the last 60 Myr derived in this work (PARSEC-COLIBRI and MIST solutions are equally weighted). It should be noted our CMDs generally miss compact star forming regions and clusters. | SFR10 ddCMD-based average SFR in the last 10 Myr derived in this work (PARSEC-COLIBRI and MIST solutions are equally weighted). It should be noted our CMDs generally miss compact star forming regions and clusters. | SFR(FUV) eeSFR calculated from the GALEX FUV imaging, normalized to the area of the HST/WFC3 footprint and corrected for extinction following the prescriptions of Hao et al. (2011). | SFR(Hα) ffSFR calculated from ground-based H, normalized to the area of the HST/WFC3 footprint and corrected for extinction following the prescriptions of Calzetti et al. (2007). | E(BV) ggForeground reddening derived in this work. | E(BV)R hhDifferential reddening derived in this work. | M∗iiM∗ and HI masses are taken from Calzetti et al. (2015). | M(HI) iiM∗ and HI masses are taken from Calzetti et al. (2015). | Class llGalaxy classification from this work (see Section 5). The first letter describes how the HeB stars of different ages are arranged with respect to one another:“S” stands for similar distributions, “O” for offset. The second letter compares the centroids of HeB and RGB stars: “S” stands for similar centroids (namely closer than 250 pc), “O” for offset centroids. The third letter describes the sparseness of HeB and RGB stars on the map: if HeB stars are far more concentrated than the RGB stars the third letter is “C” (concentrated), otherwise we assign a letter “D” (diffuse). We also add the suffix “t” if the HeB distributions are twisted with respect to the RGB ones. |
|---|---|---|---|---|---|---|---|---|---|---|---|
| Mpc | M⊙ yr-1kpc-2 | M⊙ yr-1kpc-2 | M⊙ yr-1kpc-2 | M⊙ yr-1kpc-2 | mag | mag | M⊙ | M⊙ | |||
| (1) | (2) | (3) | (4) | (5) | (6) | (7) | (8) | (9) | (10) | (11) | (12) |
| NGC5253 | Im | 3.32 | 51.0 | 26.1 | 40.8 | 52.3 | 0.100 | 0.30 | 2.2E08 | 1.0E08 | SSCt |
| UGC5139 | IABm | 3.83 | 1.09 | 0.48 | 0.66 | 0.59 | 0.050 | 0.05 | 2.5E07 | 2.1E08 | OOD |
| UGC4459 | Im | 3.96 | 0.48 | 0.72 | 0.45 | 0.71 | 0.050 | 0.05 | 6.8E06 | 6.8E07 | SSC |
| NGC4449 | IBm | 4.01 | 42.1 | 37.3 | 33.1 | 40.0 | 0.060 | 0.35 | 1.1E09 | 2.1E09 | OOC |
| UGC0685 | SAm | 4.37 | 0.60 | 0.19 | 0.18 | 0.33 | 0.100 | 0.05 | 9.5E07 | 9.7E07 | OSC |
| NGC5238 | SABdm | 4.43 | 0.73 | 0.53 | 0.46 | 0.65 | 0.050 | 0.05 | 1.4E08 | 2.9E07 | SSCt |
| NGC3738 | Im | 5.09 | 8.83 | 5.31 | 2.19 | 2.11 | 0.025 | 0.25 | 2.4E08 | 1.5E08 | OSC |
| IC4247 | S? | 5.11 | 0.46 | 0.21 | 0.25 | 0.08 | 0.050 | 0.05 | 1.2E08 | 4.0E07 | SSC |
| UGCA281 | Sm | 5.19 | 0.40 | 0.54 | 0.74 | 1.55 | 0.050 | 0.10 | 1.9E07 | 8.3E07 | SSC |
| NGC1705 | SA0/BCG | 5.22 | 1.70 | 3.46 | 2.76 | 3.21 | 0.080 | 0.04 | 1.3E08 | 9.4E07 | OSC |
| UGC7242 | Scd | 5.67 | 0.36 | 0.18 | 0.16 | 0.20 | 0.025 | 0.05 | 7.8E07 | 5.0E07 | SOC |
| UGC4305 | Im | 6.40 | 3.13 | 2.42 | 2.81 | 3.98 | 0.080 | 0.00 | 2.3E08 | 7.3E08 | SOD |
| UGC1249 | SBm | 6.40 | 5.93 | 3.67 | 1.93 | 1.19 | 0.100 | 0.15 | 5.5E08 | 9.9E08 | OOD |
| NGC5474 | SAcd | 6.60 | 4.26 | 3.73 | 2.52 | 1.86 | 0.075 | 0.10 | 8.1E08 | 1.3E09 | SOD |
| NGC5477 | SAm | 6.70 | 1.00 | 0.96 | 0.57 | 0.59 | 0.025 | 0.15 | 4.0E07 | 1.3E08 | SOD |
| NGC4248 | S? | 6.82 | 0.48 | 0.32 | 0.14 | 0.34 | 0.125 | 0.10 | 9.8E08 | 6.1E07 | OOC |
| UGC0695 | Sc | 7.80 | 0.49 | 0.41 | 0.07 | 0.10 | 0.100 | 0.10 | 1.8E08 | 1.1E08 | SSC |
| NGC4656 | SBm | 7.90 | 22.6 | 8.50 | 6.40 | 5.52 | 0.050 | 0.15 | 4.0E08 | 2.2E09 | OOD |
| NGC4485 | IBm | 8.80 | 9.41 | 5.66 | 3.08 | 3.87 | 0.100 | 0.25 | 3.7E08 | 4.0E08 | OOD |
| ESO486 | S? | 9.09 | 0.48 | 0.34 | 0.49 | 0.45 | 0.025 | 0.05 | 7.2E08 | 2.8E08 | SSD |
| IC0559 | Sc | 10.0 | 0.30 | 0.17 | 0.09 | 0.15 | 0.075 | 0.05 | 1.4E08 | 3.7E07 | SSC |
| NGC3274 | SABd | 10.0 | 4.43 | 3.21 | 1.23 | 1.32 | 0.075 | 0.20 | 1.1E08 | 5.5E08 | SOD |
| UGC5340 | Im | 12.7 | 0.92 | 0.17 | 0.38 | 0.66 | 0.025 | 0.05 | 1.0E07 | 2.4E08 | OOD |
The paper is structured as follows. The galaxy sample used in this work is presented in Section 2. The method used to extract the SFHs from the CMDs is outlined in Section 3. We present the SFHs in Section 4. Section 5 shows the spatial distribution of the SF, and Section 6 discusses these results.
2. Observations
The observations were performed for the LEGUS survey (Calzetti et al. 2015), an HST Treasury Program for a panchromatic photometric survey of 50 nearby (within Mpc) star forming dwarf and spiral galaxies. The goal of the survey is to investigate scales and modes of SF using the leverage of the UV imaging. Scientific objectives and the data reduction are described in Calzetti et al. (2015), while stellar photometry111The stellar photometry catalogs have been publicly released through MAST and are available at: https://archive.stsci.edu/prepds/legus/dataproducts-public.html is described in detail in Sabbi et al. (2018). The observations were obtained with the Wide Field Camera 3 (WFC3) and complemented with archival data from the Advanced Camera for Surveys (ACS), in a set of broad bands over the range 0.27 - 0.81 m, namely in the filters F275W, F336W, F438W, F555W and F814W (equivalent to NUV, U, B, V, and I, respectively). Resolved stellar photometry was performed using the DOLPHOT package version 2.0 downloaded on 12 December 2014 from the website http://americano.dolphinsim.com/dolphot/ (Dolphin 2000). DOLPHOT performs point-spread function (PSF) fitting on all the flat-fielded and CTE-corrected images (FLC) per field, simultaneously. The output photometry from DOLPHOT is on the calibrated VEGAMAG scale.
In order to reject non-stellar objects and to have a clean final sample of stars for our CMDs, we applied quality cuts. The DOLPHOT output was filtered to retain only objects classified as stars with signal-to-noise in both filters. The list was further culled using sharpness () and crowding ().
3. SFH method
The SFHs of the LEGUS SFDs were determined using the population synthesis routine SFERA (Star Formation Evolution Recovery Algorithm), which employs a synthetic CMD method, along the lines pioneered by Tosi et al. (1991). We provide here only a short description of SFERA’s approach, while the procedure details are described in Cignoni et al. (2015, 2016, 2018).
As a first step, a basis of synthetic CMDs is generated using isochrones from an adopted library of stellar models. To test the systematic uncertainties and physical assumptions behind the stellar models, the synthetic CMDs are generated adopting two independent and widely used sets, either the PARSEC-COLIBRI (Bressan et al., 2012; Marigo et al., 2017) or the MIST (MESA Isochrones and Stellar Tracks) isochrones (Paxton et al. 2011, 2013, 2015; Choi et al. 2016; Dotter 2016). The two sets differ both in the input physics and in the assumptions about the efficiency of macroscopic mechanisms, like rotation (PARSEC-COLIBRI models are static, the MIST ones are rotating with . The differences between the PARSEC-COLIBRI and the MIST results should be considered as a lower limit to the actual differences between data and models.
All basic synthetic CMDs are Monte Carlo realizations of all possible combinations of 9 equal logarithmic age bins between and (corresponding to the age range of our UV data), and 20 metallicity bins222We adopt the approximation [M/H], with for PARSEC-COLIBRI models and for MIST models. between and 0.0. A Kroupa (2001) initial mass function (IMF) between 0.1 and 300 M⊙ is then used to fully populate the CMDs. Unresolved binaries are also considered and 30% of synthetic stars are coupled with a stellar companion sampled from the same IMF. Concerning the distance modulus, given the relatively low sensitivity of the UV SFH to this parameter (mainly due to the rapid evolutionary phases populating the UV CMD), we opted to use the distances (Sabbi et al. 2018) derived using the tip of the red giant branch (RGB), a robust feature missing in the UV CMDs but clearly visible in optical CMDs. On the other hand, the UV color is very sensitive to extinction, therefore extinction distribution and SFH are simultaneously fitted to the data. Extinction is parametrized with two free parameters: a foreground value, applied evenly to all stars, AV, and a differential value, dAV333Each star receives a random additional extinction between 0 and dAV., that is applied in addition to AV. We adopted the extinction law of Cardelli et al. (1989) and assumed a normal total-to-selective extinction value of R.
The observational conditions were simulated in the synthetic CMDs by using the results of extensive artificial star tests. “Fake” sources are injected (one at a time) onto the actual images and the source detection routine used for our science images is applied to the fields containing the combined science images and the fake sources. Counting how many fake stars are lost as a function of magnitude and position provides the map of the local incompleteness. Each synthetic CMD is convolved with incompleteness as well as with the photometric errors derived from the cumulative magnitude distribution of magout-maginput of the fake stars. Since our targets are young stars, and young stars tend to crowd in associations and filaments (hence, most of them will be affected by more significant errors and incompleteness than the average in the field), we implemented the procedure described in Cignoni et al. (2016), which is more appropriate for crowded fields. As a first step, fake stars are evenly distributed over the galaxy field of view (FoV). The observed density of stellar sources (plagued by incompleteness) is then corrected for the local incompleteness, restoring the “true” profile of the galaxy. As a second step, fake stars are injected following the reconstructed profile. The resulting incompleteness, being weighted with the real stars, will be a less biased estimate of the actual incompleteness suffered by the young stars.
For deriving the SFH and identifying the best-fit model, the basic synthetic CMDs are linearly combined and the best combination of coefficients (minimizing a Poissonian likelihood function of the data-model residuals) is searched with the hybrid-genetic algorithm SFERA. Our typical approach is to explore the entire age-metallicity space. However, given the low dependence upon metallicity in the quoted range of ages ( Myr), with the only significant effect concerning the color extension of the He-burning loop (which shrinks with increasing metallicity), we opted to use the available spectroscopic information together with the photometry to provide additional constraints on the SFH. In particular: 1) the metallicity in the last 10 Myr was fixed at the literature444Metallicities are taken from Table 1 of Calzetti et al. (2015) spectroscopic value (within the measured errors); 2) we limited the number of free parameters by imposing that the metallicity was an increasing function of time. Throughout this work, we adopt the nebular oxygen abundance derived from HII region observations as a tracer of the overall metallicity in the last 10 Myr.
The whole process is performed using the PARSEC-COLIBRI and MIST stellar models independently. At fixed metallicity, the differences between PARSEC-COLIBRI and MIST synthetic CMDs are indicative of the different underlying stellar physics. When deriving the SFH in the next Section, these differences will serve as an indication of the potential differences between a given model and the “truth”.
4. SFHs
4.1. Bursting or continuous?
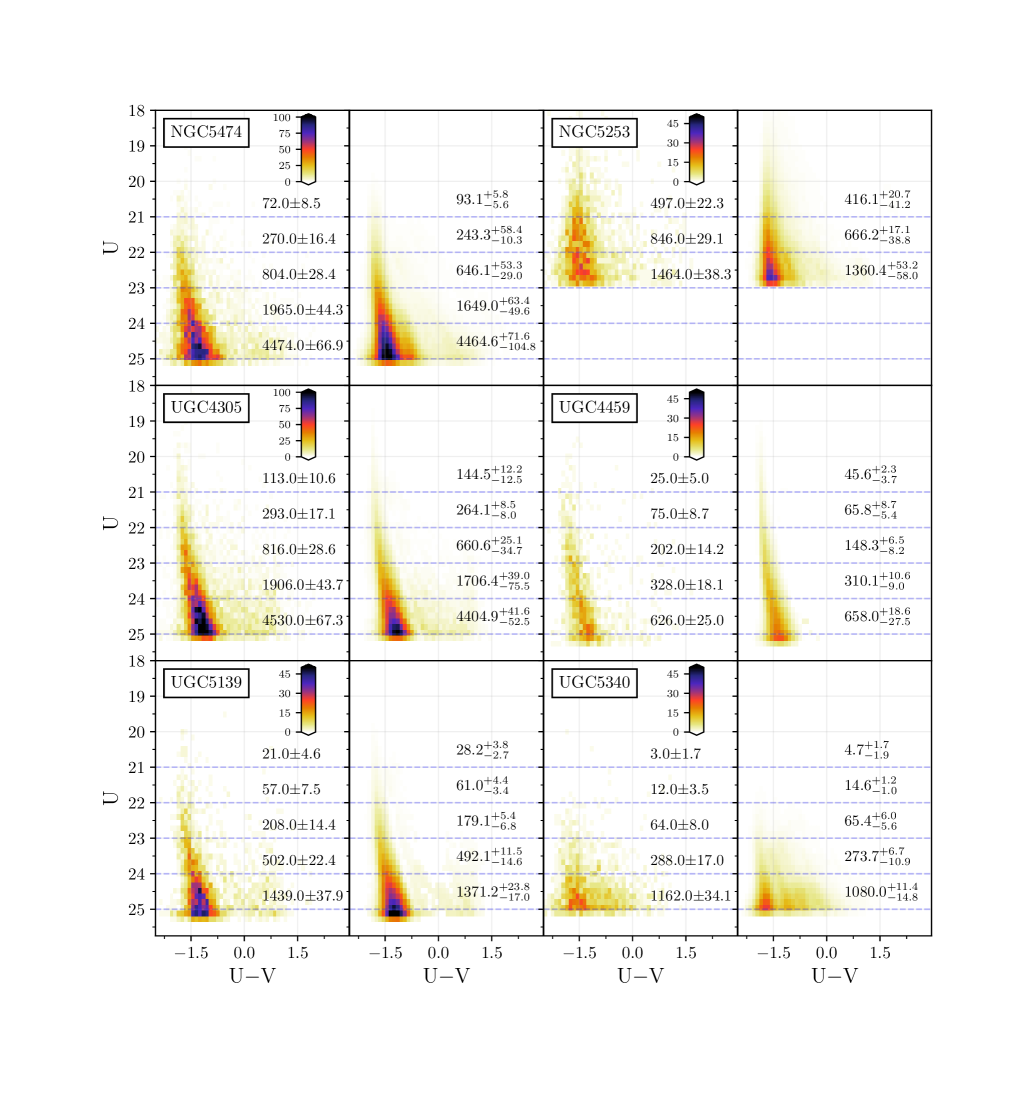
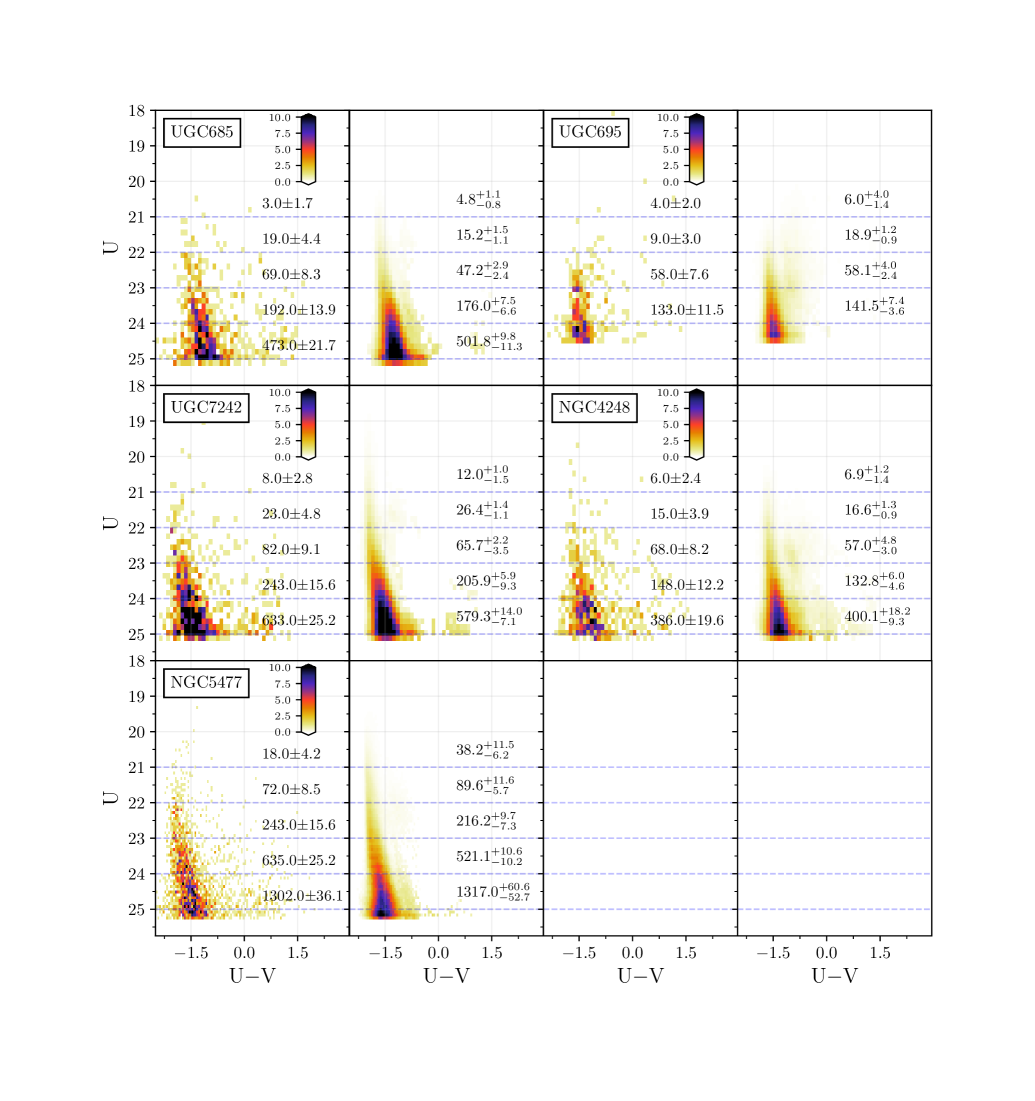
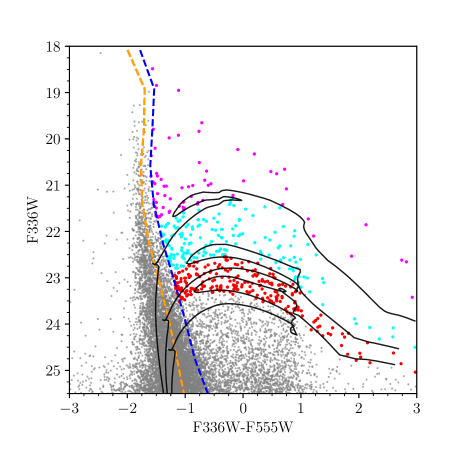
The SFHs during the last 100 Myr of 23 SFDs are investigated using the UV CMD, specifically the F336W vs F336W-V555In some galaxies V stands for the F555W band, in others for the F606W one, depending on the availability of archival data. CMD obtained from the LEGUS survey. This filter combination enables us to focus on the youngest populations in our galaxies, mostly traced by main sequence (MS) and core He-burning (HeB) stars more massive than 5 M⊙. HeB stars monotonically fade as the population age increases, providing an advantage over the MS in the age dating of the regions, since subsequent generations of HeB stars do not overlap with each other as they do on the MS. Moreover, the HeB sequence is on average brighter than the coeval MS turn-off. However, since the MS evolutionary times are much longer than post-MS times, star-counts along the MS are statistically more robust. This property becomes crucial when the SFR is very low and the sample of post-MS stars is poor. For this reason HeB and MS stars are used in synergy to infer the recent SFHs. The bluest LEGUS filter available, the F275W filter, would have improved the age resolution in the last 50 Myr, but exacerbated the effect of reddening, thus canceling the resolution gain. Moreover, it would have shortened the look-back time reachable by the photometry due to the much lower sensitivity of this filter. At any rate, most of the SFHs available in the literature are derived using wavelengths longer than the B-passband, hence the implementation of the F336W vs F336WV (hereafter U vs UV) CMD permits us to investigate the recent SFH with unprecedented detail.
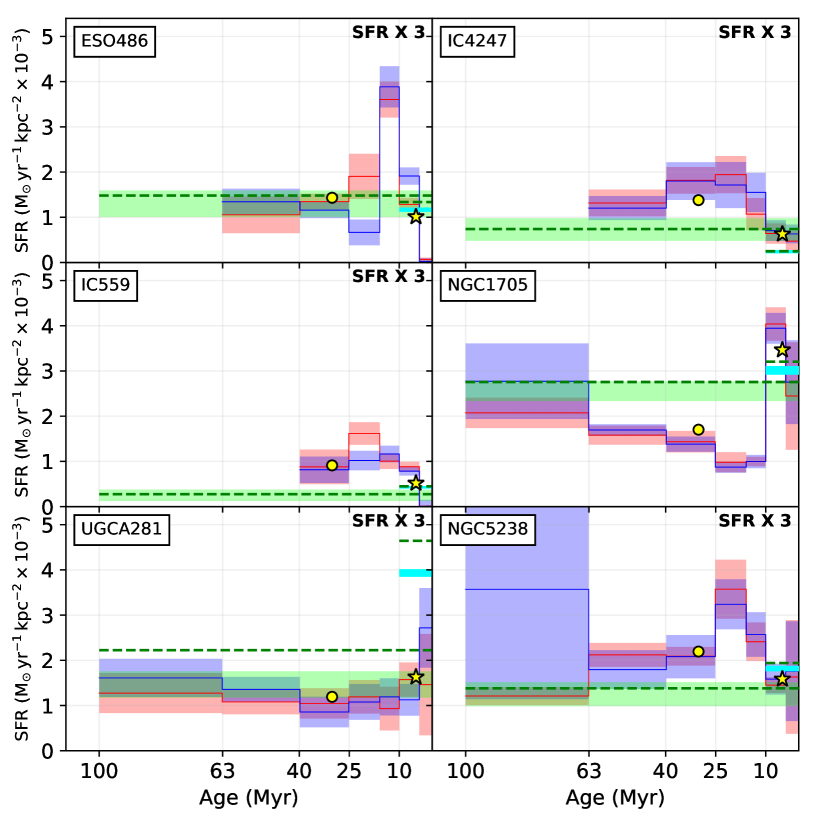
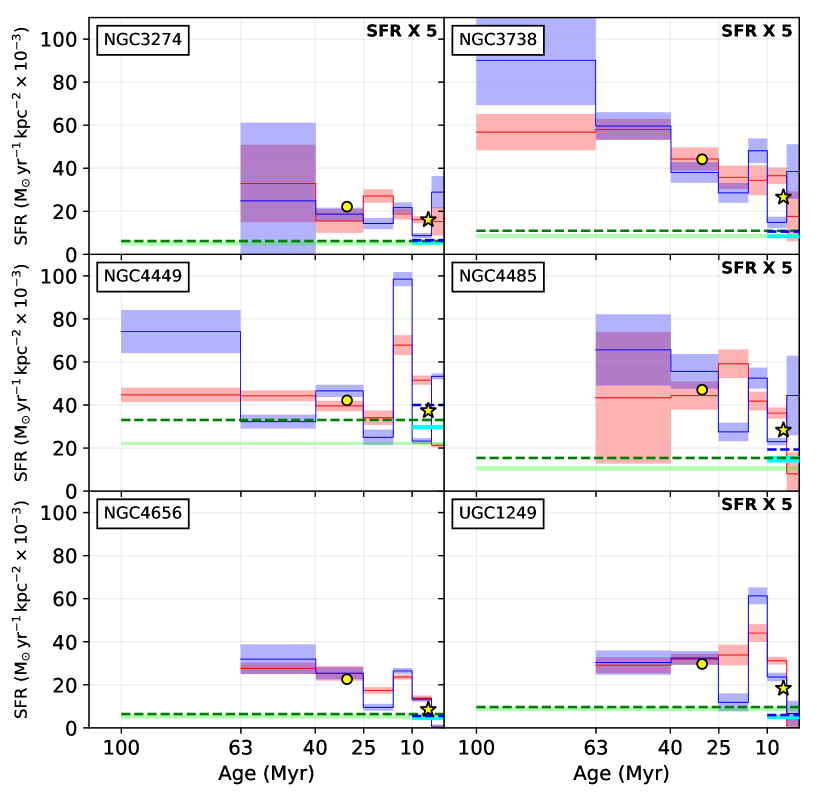
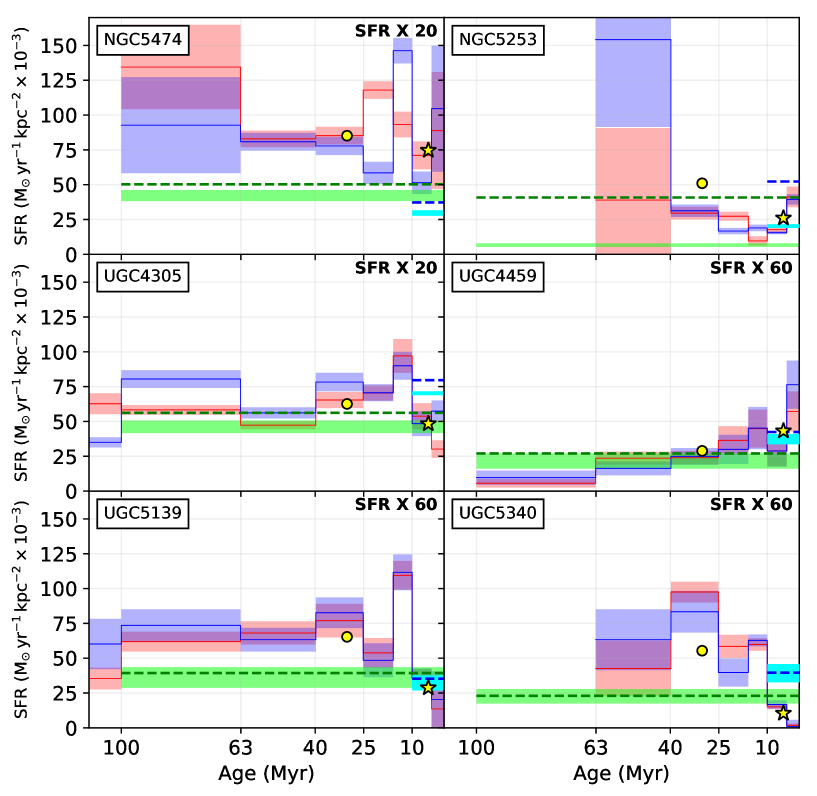
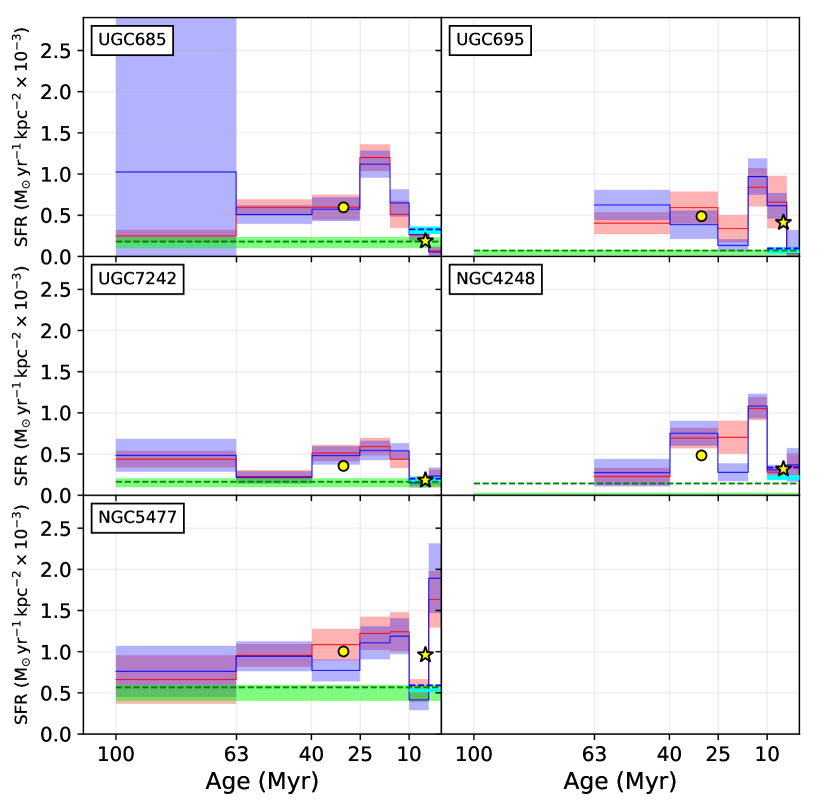
Figures 1, 2, 3, and 4 show the detailed SFHs (red for the PARSEC-COLIBRI solution, blue for the MIST solution) normalized to the area of the field of view. The average SFR densities in the last 60 and 10 Myr (PARSEC-COLIBRI and MIST solutions are equally weighted) are shown with yellow filled circles and stars, respectively. Horizontal continuous and dashed lines represent average SFR densities from integrated photometry (FUV and H), which are extensively discussed in Section 4.2. For each galaxy, Table 1 summarizes the adopted distance (Sabbi et al. 2018), the average666i.e. resulting from an equal-weight combination of the values obtained with the PARSEC-COLIBRI and MIST solutions. SFR density in the last 60 and 10 Myr, the SFR density from FUV and H calibrations, the inferred reddening and differential reddening, the stellar mass and HI mass taken from the literature, and our new galaxy classification (see Section 5).
The look-back time reached in each galaxy depends on a combination of factors, such as the galaxy distance, stellar density, and extinction. A common feature in all targets is the existence of a non-zero (at 1 level) SFR activity at all ages. While the SFHs present galaxy-to-galaxy variations, particularly at the youngest epochs, the general trend is a relatively flat SF as a function of time, with no major bursts. Even the most “extreme” events exceed the average by only a factor of three. Overall, these results confirm the general behavior seen in the last 100 Myr of many high resolution optical studies involving SFDs (see e.g. McQuinn et al. 2010; Weisz et al. 2008), whose SFHs are characterised by spikes and lulls a few times higher or lower than the 100-Myr average SFR. It is important to point out, however, that the time resolution at older ages gets progressively worse, hence SF enhancements similar to those detected in the last 30 Myr could be indistinguishable from a constant activity 100200 Myr ago. All targets show SF enhancements in the last 50 Myr, but the SF is not always continuing to the present time at a similar rate.
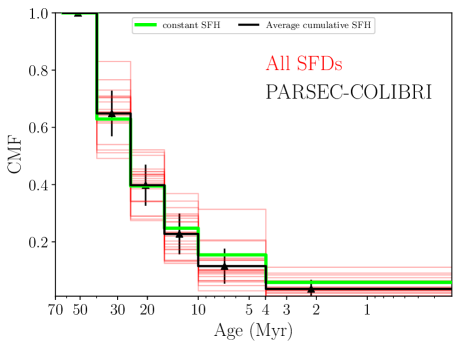
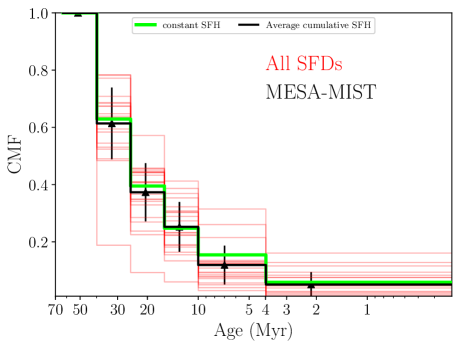
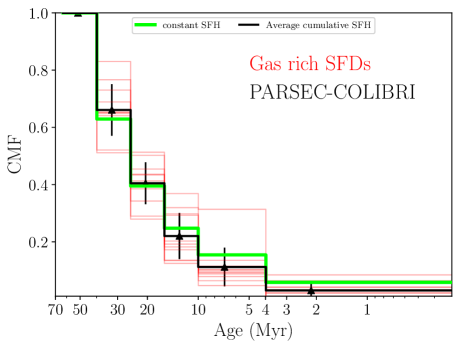
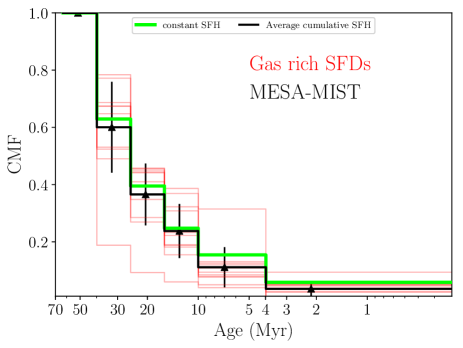
In order to compare the SFHs with each other, we adopt the cumulative distribution visualization, which gives the fraction of stellar mass formed up to a given time. This representation allows galaxies of different masses to be directly compared, and cumulative SFH measurements are not subject to covariant SFRs in adjacent time bins. Notice that the stellar mass is summed up as a function of lookback time and not time, as usually done, to give more emphasis to the SF behavior in the most recent time bins, which are the focus of this paper. Figure 5 shows the cumulative functions of the recovered SFHs in the last 60 Myr (PARSEC solutions on the left, MESA-MIST on the right). The black thick line is the average cumulative SFH, which is the unweighted mean777Arithmetic average. of the individual cumulative SFHs (the errors are the standard deviation around the average). This scheme weights all galaxies equally, so that the resulting SFH indicates what is “typical”, without the influence of the most massive galaxies that might dominate a time bin. The green line depicts the cumulative SFH resulting from a constant SF activity. Independently of the adopted stellar models, the “typical” LEGUS SFD has a SFH that is compatible with a constant activity in the last 60 Myr. A possible explanation is that the epoch of the peak activity in each galaxy is randomly distributed across the sample, hence the average activity is necessarily flat.
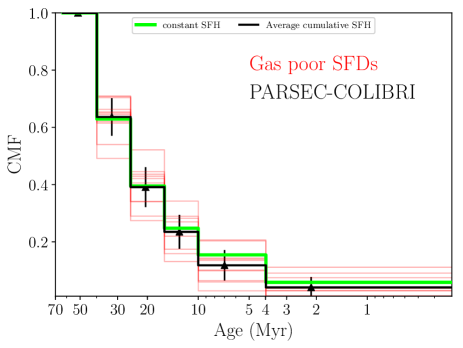
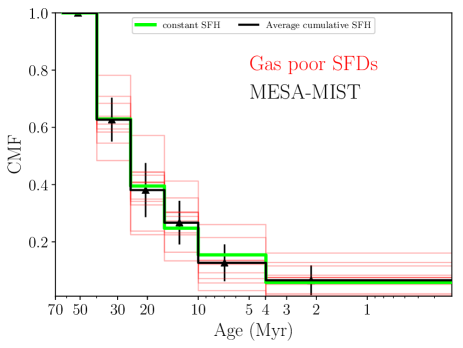
In order to explore the impact of the gas fraction on this result, Figure 6 shows the same plot dividing gas poor and gas rich galaxies. To do this, we consider all galaxies with a ratio between MHI and MM⋆ smaller than 50% gas poor, and the others as gas rich (stellar and HI masses are taken from the literature). This separation should be taken with caution since the amount of molecular hydrogen is not accounted for, and some galaxies in the two samples have similar gas fractions. With these caveats in mind, the plots suggest that, in the last 60 Myr, gas poor galaxies experienced a typical SFH that is similar to the typical SFH of gas rich ones.
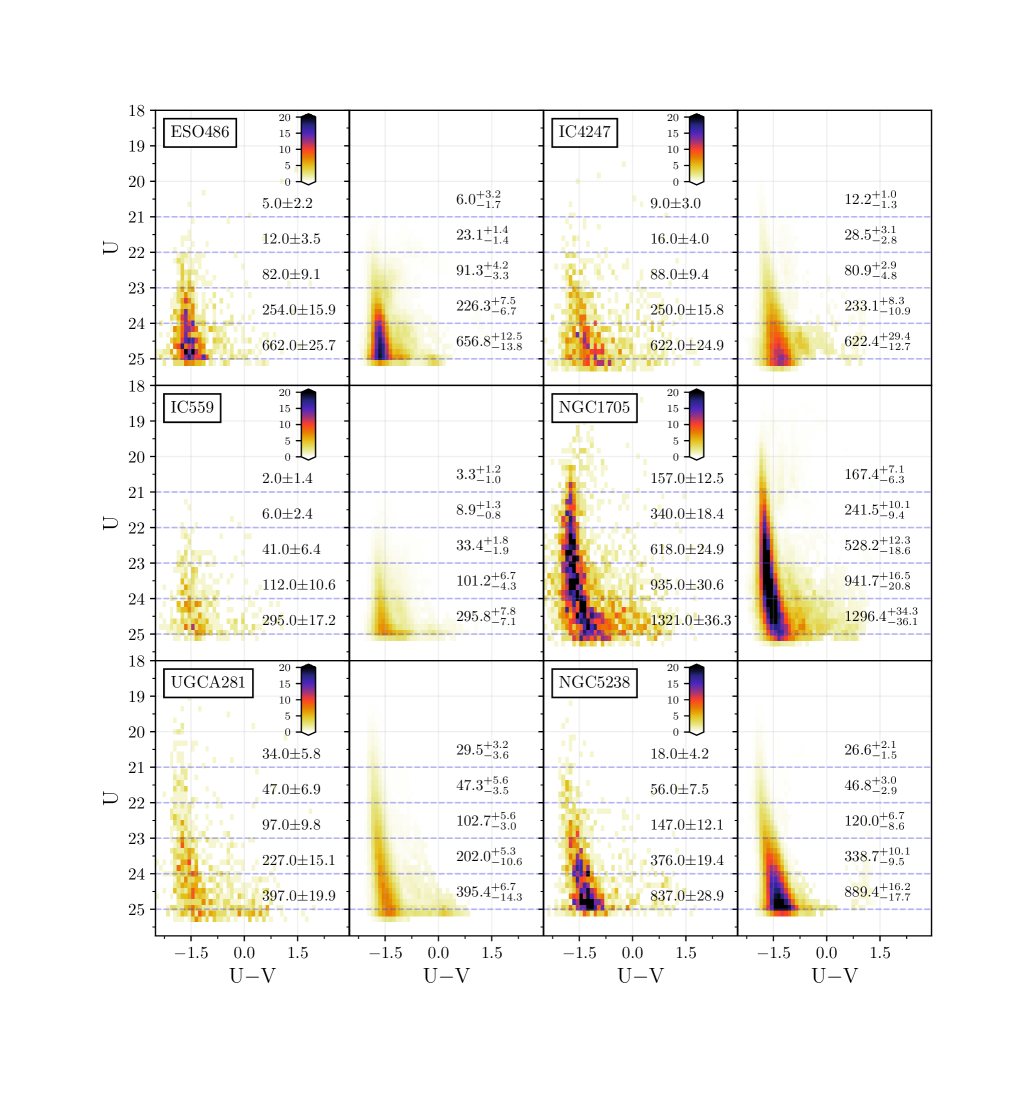
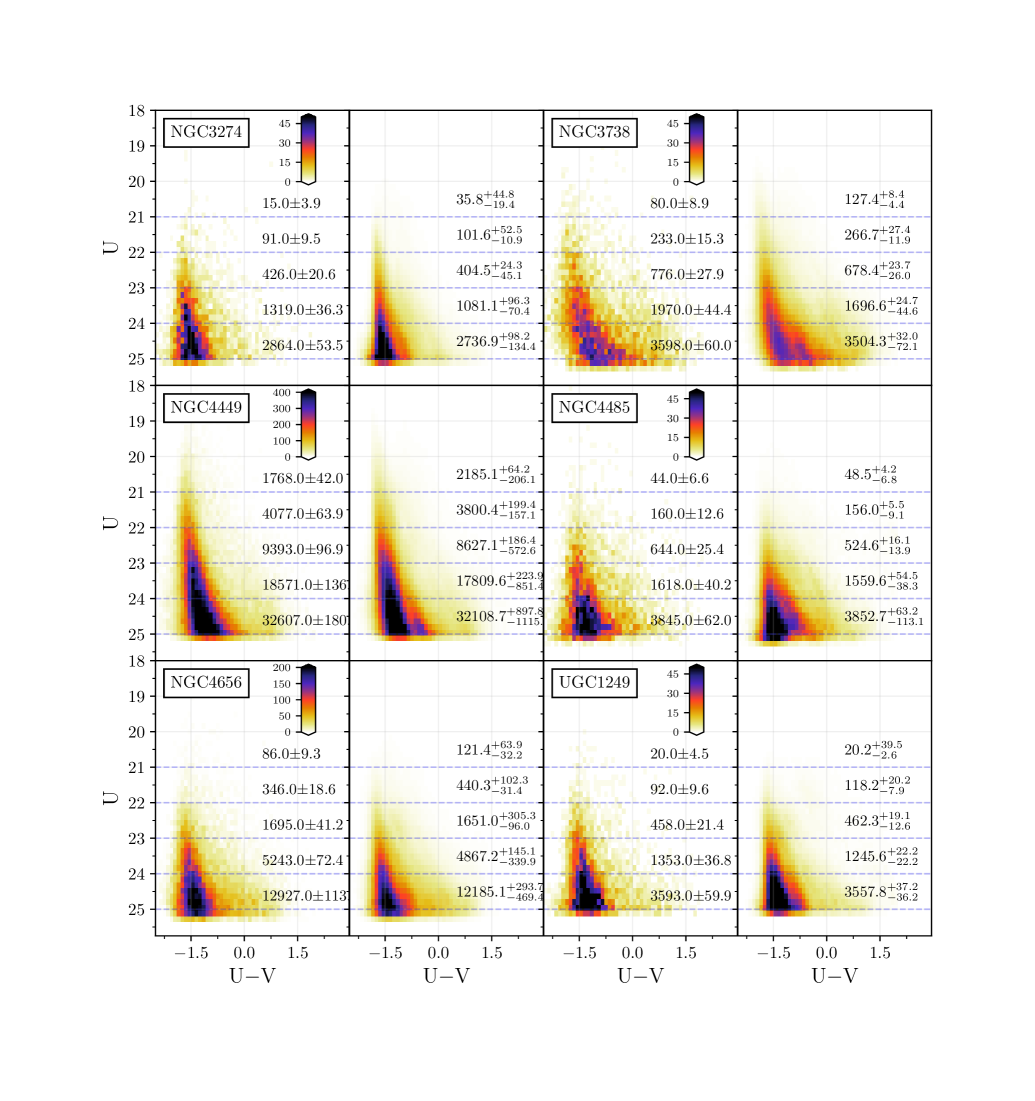
4.2. Data vs model CMDs
The most basic check on the reliability of the recovered SFH is to compare synthetic and observed CMDs. In Figures 7, 8, 9, and 10 we compare the observational Hess diagrams (i.e. the density of points in the CMD) with the corresponding synthetic ones. The latter are obtained by averaging several mock CMDs generated from the PARSEC-COLIBRI and MESA-MIST solutions equally weighted. This allows us to consider the systematic errors related to the adopted sets of stellar evolution models. The observed ( 1 standard deviation) and predicted number (median, 25 and 75 percentiles) of stars are also shown in bins of one magnitude. Overall, the simulations are in agreement with the observations, with a few exceptions like NGC4449, NGC5253, NGC3738, and NGC4656, where significant mismatches between the data and the models are found, both in terms of star-counts and color spread. These exceptions are not fully surprising, since these galaxies are the most crowded ones in the sample, and/or strongly affected by differential reddening. In fact, when the sample is locally very incomplete, the reconstructed density profile is based on small numbers of detected stars, hence it is inherently more uncertain. This problem is exacerbated in those regions where the incompleteness is also highly spatially variable. Moreover, in dense systems unresolved clusters could be contaminating the brighter end of the CMD. Concerning crowding, NGC5253 is the worst case in the sample: most of its vigorous SF is concentrated in the central 500 pc (this is also the part of the galaxy shown in Fig. 9) and the completeness of its CMD drops by several magnitudes from the periphery to the central kpc. Extinction can have a complex distribution, which may depend on the age of the population (e.g., the youngest stars are likely still embedded in their dust-rich cocoons), while in our parametrization it is modeled with two parameters (foreground and differential extinction) with no dependence on time in the last 200 Myr. Moreover, the adopted extinction law is Cardelli et al. (1989) with Rv= 3.1, while the actual law may vary from galaxy to galaxy (see, e.g., De Marchi et al. 2016).
On the side of stellar evolution modelling, stellar models for massive stars are inherently uncertain (see, e.g., de Mink et al. 2012). Significant mass-loss may cause a star to lose over half its mass during its lifetime. This mass loss occurs via stellar winds and strongly affects the stellar evolution of a star (however, at low metallicities, we expect a major reduction in wind feedback from single massive stars; see e.g. Ramachandran et al. 2019). Moreover, massive stars are often found to be rapid rotators and have a significant preference to be binaries with orbital periods of less than a few days (Sana & Evans 2011). Theoretically speaking, about 15-40% of massive early-type stars are expected to be products of binary mass transfer (de Mink et al. 2014), i.e. they have accreted mass in a past mass exchange episode and/or merged with a former binary companion. Binary mass transfer can produce a surplus of massive stars (adding a tail of binary products, blue stragglers) or can rejuvenate stars via mass accretion.
The transition from MS and post-MS is especially problematic in NGC4449 and NGC3738, with the synthetic CMDs showing a gap between the MS and the post-MS phase, which is completely absent in the observed CMD. A similar dip was already noticed by Tang et al. (2014) in several dwarf galaxies. These authors showed that this discrepancy is overcome by extending the overshooting at the base of the convective envelope.
Finally, we cannot exclude that real variations of the IMF are occurring in some dense star forming regions. In Paper I, we already found that an IMF flatter than Salpeter’s () provides a better fit to the data of NGC4449, and a similar variation has been recently found by Schneider et al. (2018) for 30 Doradus, a giant star forming region in the Large Magellanic Cloud; this system has produced stars up to very high masses ( 200 M⊙), with a statistically significant excess of stars above 30 M⊙, and an IMF shallower than a Salpeter one above 15 M⊙.
4.3. Comparison with integrated FUV and H rates
In this section, we compare our SFHs with integrated-light SFR density measurements using H and GALEX FUV imaging, respectively. While H photons are produced by gas ionized by young hot stars, tracing the SF in the last few million years, the FUV flux stems from the photospheres of O- through later-type B-stars, and thus traces the SF in the last 100 Myr.
The data are taken from the Local Volume Legacy survey (LVL; Hao et al. 2011; Dale et al. 2009; Lee et al. 2011) where deep GALEX FUV, ground-based H, and Spitzer 24 imaging were obtained for all of the galaxies studied here. We perform photometry within the HST WFC3 footprint on the H, FUV, and 24 images, and combine the resulting fluxes to derive dust-corrected SFRs (flux measurements and SFR calculations will be described in detail in Cook et al. 2019, in prep.). The SFRs are calculated using the prescription of Murphy et al. (2011) which assumes a Kroupa IMF. The dust correction is calculated for H+24 and FUV+24 following the prescriptions of Calzetti et al. (2007) and Hao et al. (2011), respectively.
Green and cyan horizontal stripes (their width reflects the SFR uncertainty) in Figures 1, 2, 3, and 4 stand for the average SFRs derived from the FUV and from the H emission, respectively. Dashed lines show the same rates corrected for extinction. All rates have been normalized to the area of the HST/WFC3 field. The average SFR densities in the last 60 and 10 Myr (PARSEC-COLIBRI and MIST solutions are equally weighted) are shown with yellow filled circles and stars, respectively. Table 1 summarizes all rates for all galaxies.
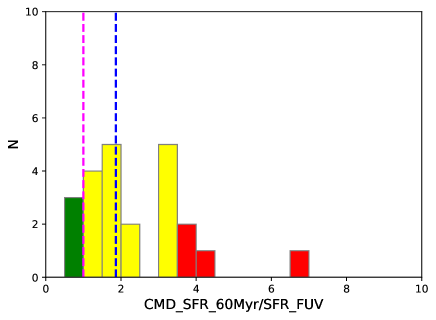
For most of the galaxies in the sample, the FUV-based SFRs (corrected for extinction ) are systematically lower than the CMD-based SFRs by up to a factor of five. This is even more striking in light of the fact that, because of crowding, our CMDs generally miss compact star forming regions and clusters. Fig. 11 shows the histogram of the distribution of the ratio between CMD-based SFRs (averaged over the last 60 Myr and different stellar models) and FUV SFR (corrected for extinction) for the entire sample. Blue and magenta dashed lines indicate median and unit (ratio) values, respectively. Objects with ratios lower than the 25th percentile are displayed in the histograms in green, those higher than the 75th percentile are in red and those in between in yellow. It is clear from the plot that the median () and unit values are significantly offset. Moreover, two galaxies show a ratio of 4 or higher.
A similar result was also found by McQuinn et al. (2015) when they compared optical CMD-based SFRs with integrated FUV counterparts for a sample of SFDs within 6 Mpc (STARBurst IRregular Dwarf Survey, STARBIRDS; McQuinn et al. 2015). As in our sample, most of their optical CMD-based SFRs were higher than the FUV-GALEX SFRs by up to a factor of four.
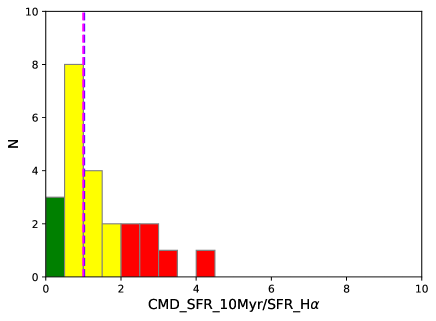
Different explanations for this discrepancy can be envisaged. One cause could arise from the short time-scale ( Myr) used to average our rates, in contrast with the FUV which is sensitive to the whole flux of OB stars. As found by Johnson et al. (2013) for a sample of 50 dwarf galaxies, the mean age of the stellar population contributing to the FUV emission is strongly dependent on the SFH of a system, ranging from 50% of the FUV flux produced by stars younger than 16 Myr (for 25% of the sample galaxies) to 50% of the flux produced by stars older than 100 Myr (for 20% of the sample galaxies). While this may possibly indicate that some of these galaxies were much less active prior to 60 Myr ago, such a synchronised enhancement seems unlikely for all these systems. Moreover, 1) the CMD-based SFHs of McQuinn et al. (2015) offer a longer look-back time, 2) if we use the average rate over 100 Myr, which is indeed available in some of our galaxies, we do not find a significant difference. Extinction could be also important, since the FUV is extremely sensitive to the total extinction and extinction law. However, a systematic difference seems to affect the sample irrespective of the amount of extinction. Binaries are not considered in the FUV SFR calibration, while our CMD-based SFRs assume a 30% of binaries. However, although this may cause a systematic bias, the overall effect is probably modest (see, e.g., Cignoni et al. 2016). Another important point concerns the IMF. In low-mass systems the upper end of the IMF might be not fully sampled due to the low SFR. However, if stochasticity was important, we should see the same discrepancy using H, while the distribution of the ratio between our CMD-based SFRs in the last 10 Myr and the H SFRs (shown in Figure 12 with the same conventions adopted in Figure 11) peaks very close to 1, and only a couple of galaxies have a ratio greater than three. As a further support to this point, McQuinn et al. (2015) found good agreement between NUV fluxes (as predicted by their CMD-based SFHs) and measured NUV-GALEX fluxes, hence suggesting that stochasticity has a minor role. Another issue involves the adopted upper mass limit of the IMF (100M⊙ for the FUV and H SFR calibrations, 300 M⊙ for the CMD-based SFHs) : although this choice has a negligible effect for the CMD-based SFRs, the impact on the integrated SFRs could be relevant (for example, lowering the adopted upper mass limit would increase the mass to light ratio, hence the inferred SFR). Indeed, some authors have argued that dwarf galaxies have a mass limit (see e.g. Weidner, & Kroupa 2005) lower than the populations of the solar vicinity.
Finally, as pointed out by McQuinn et al. (2015), a likely cause for the discrepancy could rest in the stellar evolutionary libraries and/or stellar atmospheric models used to calibrate the FUV SFR relation. Interestingly, if models are the culprit, the effect does not seem related to metallicity, since among the most discrepant dwarfs in the sample there are UGC1249 and UGC5340, which are rather metal rich and extremely metal poor, respectively.
5. SF spatial patterns
The spatial distribution of HeB stars of different ages provides unique information on how the recent SF has occurred in space and time. In order to take full advantage of this stellar phase, it is thus mandatory to select HeB samples as pure as possible. This task is facilitated in the U vs U-V CMD, since the blue edge of the HeB phase is well detached from the MS, avoiding confusion between the two stellar phases unlike in purely optical CMDs. Furthermore, the temporal resolution is higher than that achievable using MS stars, because the blue edge of the HeB phase provides a one to one relation between age and luminosity. On the other hand, there are some complications due to the more complex morphology of the post-MS evolution in the U vs U-V CMD (as visible in Fig. 13, where PARSEC-COLIBRI isochrones of the labelled age are overlaid to the CMD of UGC4305). The HeB phase is not completely horizontal (the red part is fainter) and its red edge (a mixture of HeB and early AGB stars), which is promptly visible in the optical CMDs as a red plume above the RGB tip, is strongly tilted and stretched to the red. Moreover, the color extension of the theoretical HeB phase is generally too short in the models, even at the lowest metallicities. Indeed, observations show a continuity between MS and HeB stars, while a gap between them is often visible in the models.
For this task we used the PARSEC-COLIBRI isochrones for the observational metallicities listed in Table 1 of Calzetti et al. (2015). Distance moduli are also taken from the literature (Table 1), whereas the average extinctions are those resulting from the synthetic CMD approach.
In order to cope with the mismatch between data and models for the color of the HeB stars, we opted for the following procedure:
-
•
we bin the range of F336W magnitudes in intervals of 0.25 mag;
-
•
for each interval, we choose the value of the 75% percentile of the U-V color distribution;
-
•
we use this value as the corresponding lower bound of the range of color values allowed for bona-fide HeB stars;
-
•
we iterate over all magnitude intervals;
-
•
we finally slice the full HeB sample in terms of age, using the PARSEC-COLIBRI HeB models for the assumed spectroscopic metallicity. More specifically, since HeB stars of a given age cross twice the same color at two different luminosities (the so called “blue loop”), we chose to select ages using the redward excursion (the fainter crossing) of each theoretical HeB.
Throughout this paper, we select bona-fide HeB stars from three different age bins, namely Myr (older epochs are only accessible for a handful of galaxies in the sample), Myr, and Myr . Figure 13 shows an example of such a selection applied to UGC4305.
We also tested the procedure using larger percentiles (minor chance of MS contamination) and different models (MESA-MIST). We found that the major changes regard the statistics of the HeB samples, while the corresponding spatial distributions are qualitatively similar. Our samples will be mostly composed of HeB stars at the blue edge, plus minor contributions of redder HeB (in the UV CMD the central part of the optical HeB is tilted toward fainter magnitudes and redder colors, while the red edge is too faint to be detected in the U-band), sub-giants from the Hertzsprung gap, and MS interlopers (pushed to the right by differential reddening).
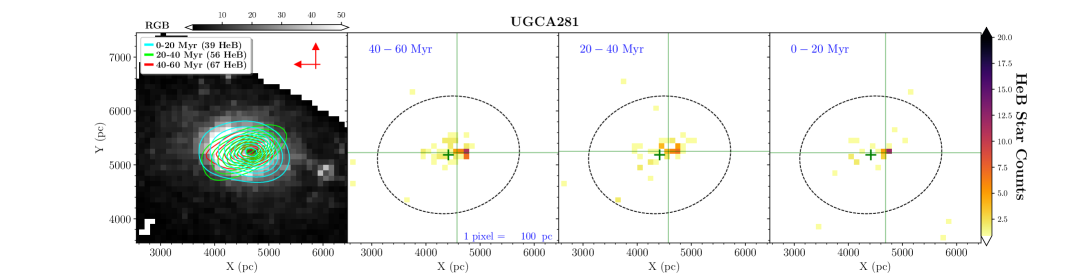
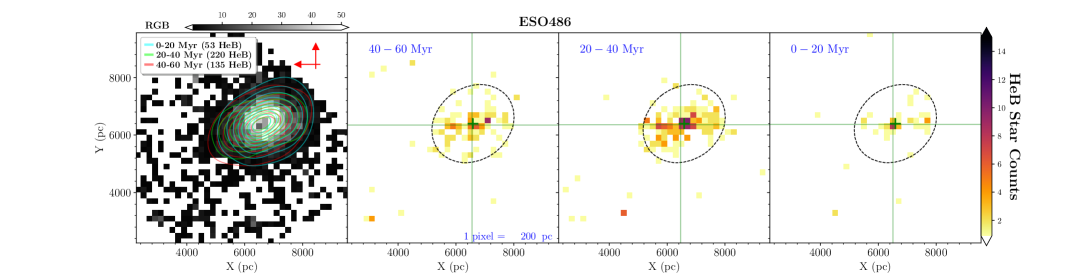
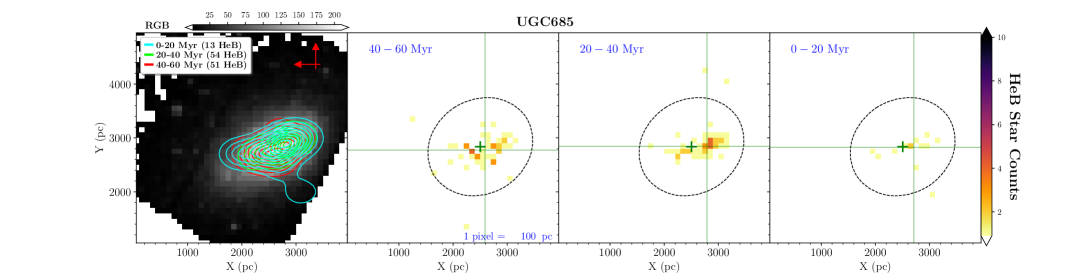
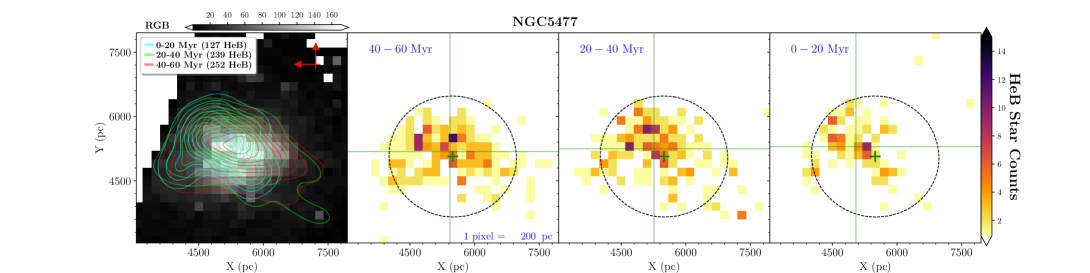
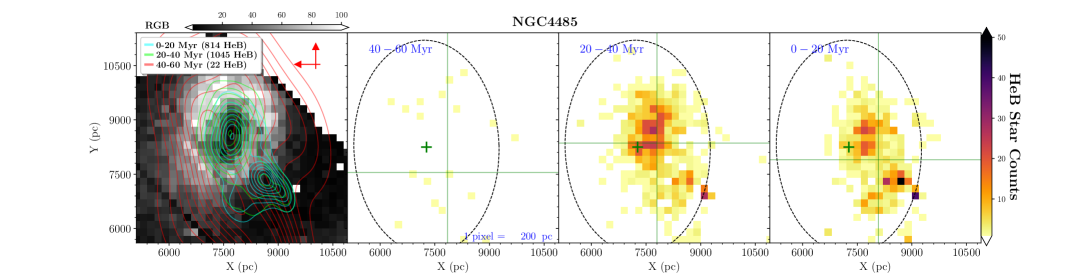
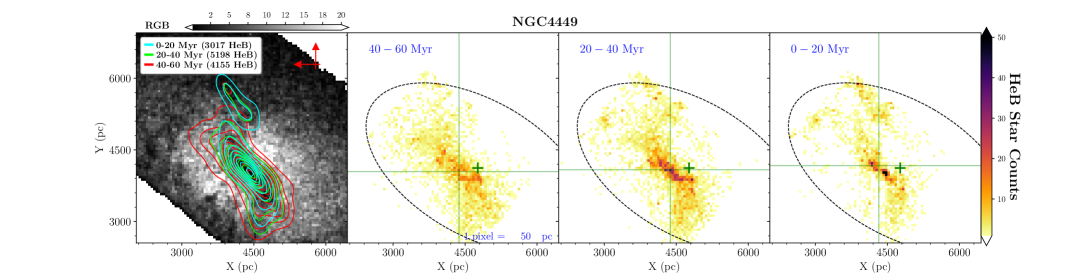
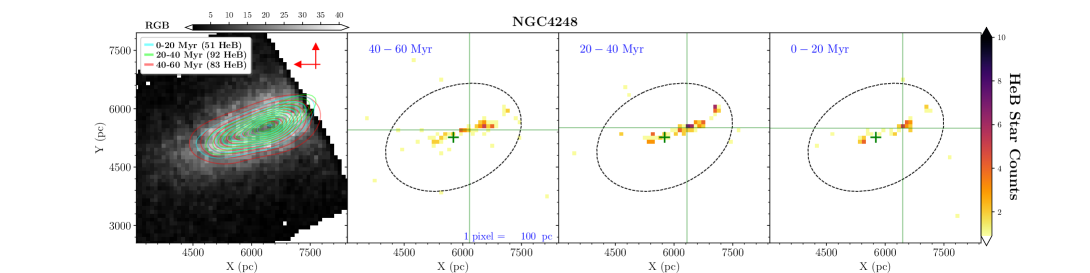
The HeB spatial distributions for all LEGUS SFDs are shown in Fig.14, 15, 16, 17, 18, 19. For comparison, we also plotted the distribution of RGB stars as taken from the optical CMDs (thus including also ACS archival fields, Sabbi et al. 2018). In order to minimize incompleteness effects, only RGB stars down to 2 mag fainter than the RGB tip are used. In contrast to the HeB stars, these objects measure the average activity prior to 1 Gyr ago, so they trace the stellar mass cumulated in time and space by our galaxies.
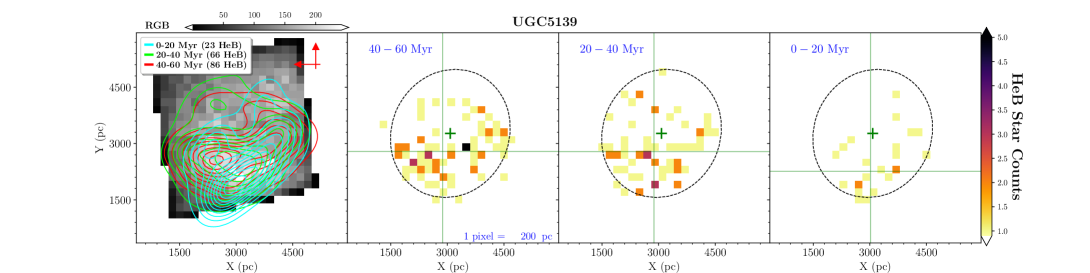
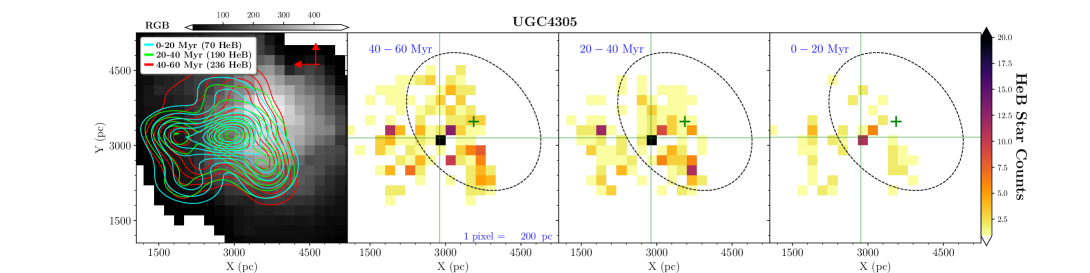
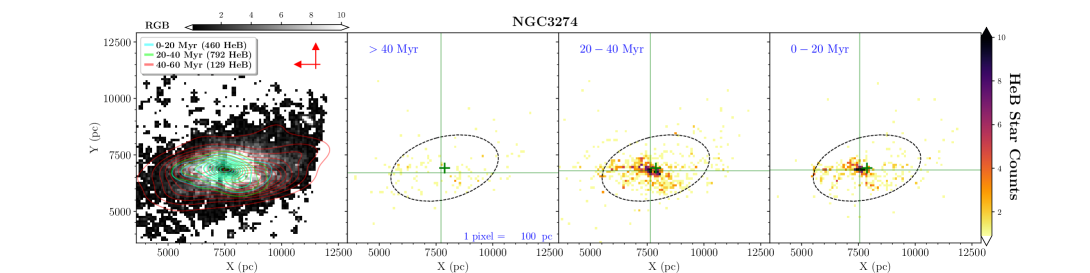
For each galaxy, the leftmost panel shows the RGB distribution, while the HeB distributions for the three age bins are shown in the second, third. and fourth panel, respectively. To facilitate the comparison, we also overplot on the RGB distribution a Gaussian kernel estimation of the HeB stars from the three age bins (red is the oldest, cyan the youngest; the contour levels are uniformly chosen between 0 and the highest density point). The dashed ellipses in the HeB density maps show the region where 68% of the RGB stars are contained (assuming that the underlying distribution for the RGB stars is a bivariate Gaussian), while the little green crosses are their centroids. Finally, the long green dotted lines locate the centroids of the HeB stars of the labelled age bin.
It is worth emphasize that the distribution of HeB stars of different ages reflects the combination of SFR and IMF, since stars of progressively brighter magnitudes are not only younger, but also more massive. The same is true for the RGB, which is generally composed of low mass stars, which are far more frequent (given an IMF) than intermediate and massive HeB stars younger than 50 Myr. Moreover, while HeB stars of the age bins 0-20 Myr and 20-40 Myr are not severely affected by incompleteness in any of our galaxies, the age bin 40-60 Myr and the RGB stars are frequently lost in very crowded (and generally young) regions, giving the false impression of a lower SF activity. For these reasons, the ratio of star counts from different stellar species should not be taken as a measure of their SFR ratio. For the same reason, the centroid of the oldest HeB distribution can be biased, while the RGB centroid is generally less affected since only minor areas are plagued by significant incompleteness. Finally, we warn that centroids and 68% ellipses can be of limited use in those galaxies that are only partially covered by LEGUS observations, since boundary effects can have a significant impact on the geometry of the galaxy. Moreover, many dwarfs in general have irregular shapes and clumpy structures.
Despite these caveats, the age uncertainty (due to photometric errors) of HeB stars is generally low, % at 20 Myr (higher in very reddened galaxies), so the distribution of HeB stars from different epochs reliably traces the direction where the SF is proceeding.
A first inspection of these figures reveals intriguing features and some similarities:
-
•
RGB stars generally occupy broader regions and their distribution is smoother. This is a non-surprising consequence of genuine in-situ star formation combined with secular dynamical evolution (due to internal processes induced by a galaxy’s spiral arms, bars, galactic winds, and dark matter) and enviromental effects.
-
•
The HeB stars are mainly distributed in clumps, with the youngest being the most clumped. Clumps of different age can be concentrated in the same place or be completely detached from each other. From a dynamical point of view, our HeB stars are younger than the estimated dynamical age of the large-scale interaction between the host galaxy and its neighbors, suggesting that these HeB clumps are not simply detached from the main body of the host galaxy but instead formed in situ.
-
•
With respect to the RGB population, the centroid and dispersion of the HeB spatial distributions varies from galaxy to galaxy. There are galaxies where the HeB clumps coincide with the central concentration of RGB stars, and others where the HeB clumps are completely detached with or without a significant RGB population counterpart. In most cases the HeB stars are far more concentrated than the RGB stars, whereas in a few cases they are equally extended.
In order to qualitatively classify these features we assign a short code of three capital letters to our SFDs. Depending on how the HeB clumps are arranged with respect to one another, we assign a first letter “S” (similar distributions) or “O” (if an offset is present). The second and third letters describe how the overall HeB population is arranged relatively to the RGB population. If the centroids’ distance of the two species is shorter than 250 pc (in order to avoid completeness biases, HeB stars older than 40 Myr were not included while calculating the HeB centroid), we assign a letter “S” (similar centroids), otherwise we assign a letter “O” (offset). The third letter refers to the spatial dispersion of the clumps relatively to the dispersion of the RGB population. If clumps are far more concentrated than the RGB stars we assign a letter “C” (concentrated), otherwise we assign a letter “D” (diffuse). Finally, we add the suffix “t” if the HeB distributions are twisted with respect to the RGB one.
Figure 14 shows, from top to bottom, the spatial maps for the galaxies IC4247, NGC3738, NGC5253 and NGC5474.
IC4247: As listed in NED888The NASA Extragalactic Database., IC4247 is likely a small spiral, part of the Centaurus A group (see e.g. Banks et al. 1999). Following our notation, IC4247 can be classified as SSC, since most of the HeB clumps are nested and mainly located in the central parts of the RGB distribution. However, the oldest HeB stars shows also a hint of wings that are reminiscent of a spiral structure. Such structures are not visible in the RGB stars, suggesting that they may not be density waves but star forming regions stretched by differential rotation.
NGC3738: Listed as Im in NED, it is roughly located in the Canes Venatici I group (Karachentsev et al. 2003). According to Hunter & Elmegreen (2004) the closest companion is NGC4068, at a distance of 490 kpc. Despite this isolation, the HI component of NGC 3738 is morphologically and kinematically disturbed, with a kinematically distinct gas cloud in the line of sight of the HI disk. They suggest that NGC3738 is the result of an advanced merger or ram pressure stripping. From this point of view, the lack of any recent burst in our SFH for NGC3738 may indicate that the merging event is older than 100 Myr. In our notation NGC3738 can be classified as OSC, since most of its HeB stars are in the central part of the RGB distribution, with no significant offset in their centroids, and the HeB stars systematically progress towards the North-West (by about half a kpc) as their age decreases. Hunter et al. (1998) found a similar dichotomy, with roughly half of the inner part of the optical galaxy undergoing an intense star formation episode, with pressure and gas density enhanced by 30%70% with respect to the other side. They also found that the HI velocity fields exhibit significant deviations from ordered rotation and there are large regions of high-velocity dispersion, suggesting that such larger-scale conditions could have resulted from the merger of two SFDs.
NGC5253: Listed as Im in NED, NGC5253 is a member of the Centaurus A group. The H images (Martin 1998; Calzetti et al. 2004; Meurer et al. 2006) show multiple filamentary and bubble-like structures perpendicular to the optical major axis and extending beyond the stellar distribution, in contrast with the outer optical isophotes that resemble an elliptical galaxy. The behaviour of the neutral gas within NGC 5253 is also very complex. Lelli et al. (2014) modelled the HI emission with a disk dominated by radial motions and derived an inflow/outflow timescale of Myr (consistent with the starburst time scale inferred by McQuinn et al. 2010). In addition, shadowing of the diffuse X-ray emission by the cooler disk gas (Ott et al. 2005) may suggest that the radial motions are an inflow. A similar conclusion was reached by Miura et al. (2018) analyzing CO(2–1) observations taken with ALMA. López-Sánchez et al. (2012) analyzed deep HI data proposing that the very peculiar HI morphology and kinematics of NGC 5253 could be explained by an interaction scenario.
In our classification NGC5253 is a SSCt, although a small fraction of HeB stars are also located very far from the central region. Centroids of HeB stars coincide with the centroid of the RGB population. In general, the HeB and RGB distributions share elliptical shapes, but the major axes of the HeB stars are clearly twisted compared to the major axis of the RGB stars. Clearly, most of the last 50 Myr activity of NGC5253 is taking place in the central part of the galaxy, possibly triggered by gas falling in.
NGC 5474: Classified as SAcd in NED, this galaxy is part of the M101 Group, 90 kpc to the south of the grand design spiral M101. Deep 21-cm mapping shows gas between the two galaxies at intermediate velocities (Mihos et al. 2013), a possible feature of a close passage of the two. The most prominent feature of NGC 5474 is its bulge, which exhibits a significant offset from the disk of the galaxy (van der Hulst, & Huchtmeier 1979; Kornreich et al. 1998). At odds with this asymmetry, the HI velocity field indicates normal differential rotation (Rownd et al. 1994), with a distribution following that of the optical disk (and significantly warped beyond it).
In our classification it is an SOD. Indeed, all young generations are similarly distributed, significantly offset, and similarly diffuse compared to the RGB distribution. In addition, young stars have a complex distribution characterised by a major central concentration and a diffuse component. Interestingly, the central component shows three large substructures where the SF process has been continuous in the last 60 Myr (or more).
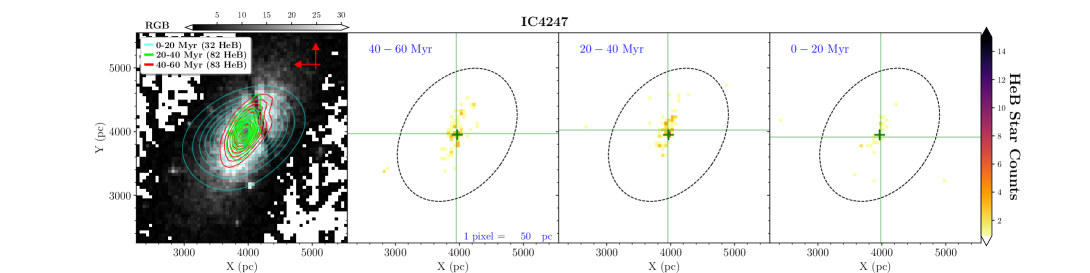
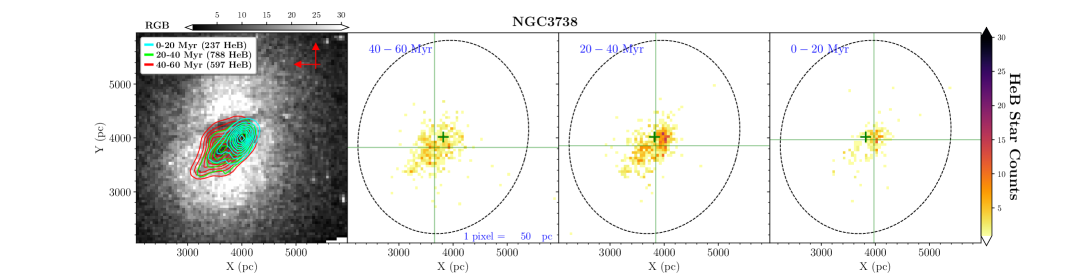
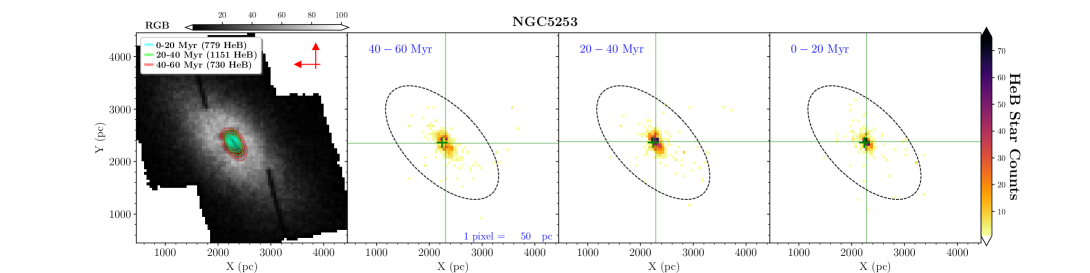
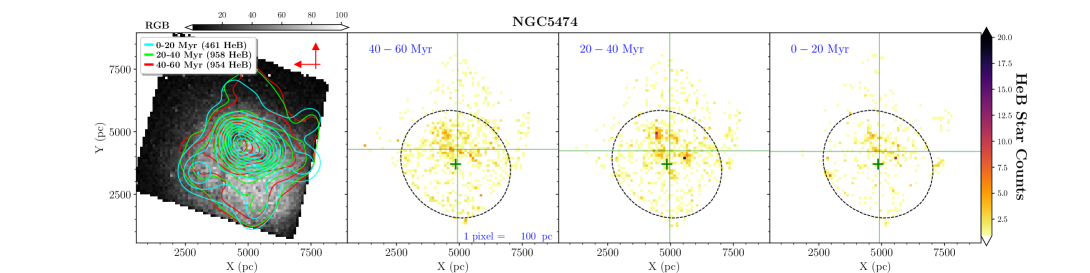
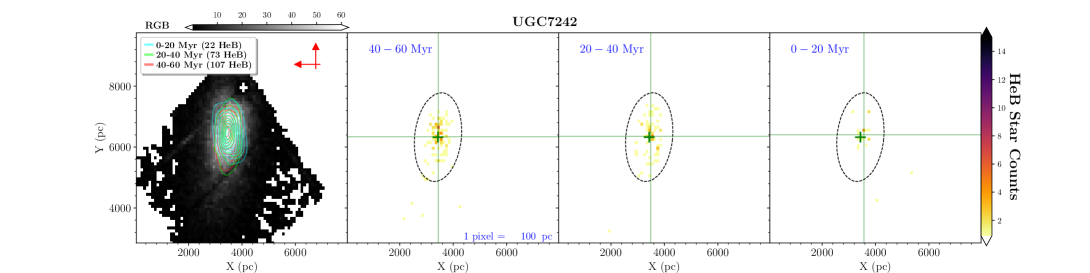
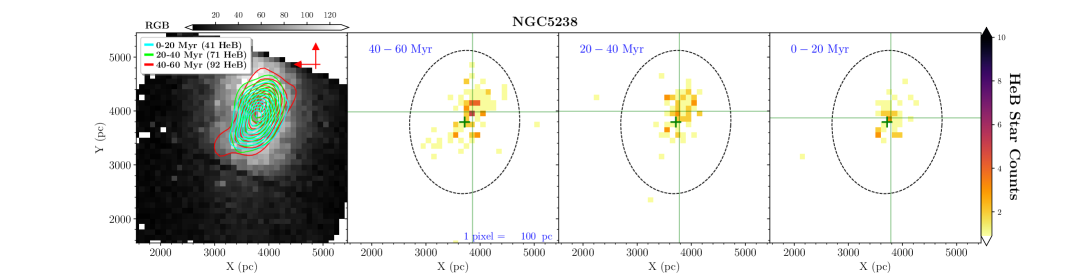
Figure 15 shows from top to bottom the galaxies NGC1705, UGC7242, NGC5238 and UGCA281.
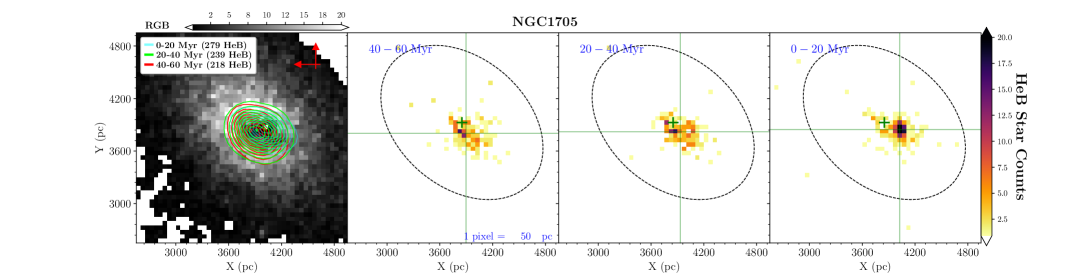
NGC1705: Classified as SA0/BCG in NED, this galaxy is rather isolated, with its closest neighbour at more than 500 kpc (LSBG F157-089). Its HI disk (Meurer et al. 1998) is warped and significantly offset compared to the stellar component. Moreover, Meurer et al. (1992) studied the H emission line kinematics, detecting the presence of a kpc-scale expanding super-shell of ionised gas centered on the central nucleus with a blue-shifted emission component at 540 km s-1, most likely a galactic wind powered by SN explosions from its super star cluster (see also Annibali et al., 2003).
As already discussed in Paper I, NGC 1705 shows a slightly declining activity for the past 100 Myr. This behavior changed drastically 10 Myr ago, when the SFR increased by a factor of two or more over the 100 Myr averaged SFR. After the peak, the SFR remained constant and no drop is detected.
NGC1705 can be classified as OSC. Most of the recent activity is confined to the inner part of the RGB ellipse, 100-200 pc offset from the RGB centroid, with a striking pattern of SF progressing from East to West. Most of the oldest HeB stars are in a filamentary structure near the RGB centroid, whereas the youngest HeBs are highly concentrated in the super star cluster to the West of the RGB centroid. Despite this recent concentration, some SF is also continuing in the previously most active region.
UGC7242: Classified as Scd in NED, this galaxy is located in the eastern part of the M81 group. The distribution of HeB stars exhibits two major concentrations: a prominent central clump and a minor spur in the South direction. The latter feature tends to disappear moving at young ages, but low-number statistics prevent us from robustly exploring this effect. Overall HeB stars cover a large fraction of the RGB ellipse and no significant offset is found. In our scheme it can be classified as SOC.
NGC5238: Classified as SABdm in NED, this galaxy belongs to the Canes Venatici I group. From the HI perspective, Cannon et al. (2016) found that the HI disk is asymmetric in the outer regions, and the HI surface density maximum is not coincident with the central optical peak, but rather is offset to the North-East by pc. Our maps suggest that the iso-contours of the young population are also twisted with respect to the RGB ellipse. All our HeB samples have their centroids offset compared to the RGB one and cover a significant fraction of the RGB ellipse. In our classification NGC5238 is SSCt, although a South-East spur that is clearly visible among the older HeB stars tends to disappear in the youngest HeBs.
UGCA281: Classified as Sm in NED, this galaxy is isolated and located in the Canes Venatici I group. Viallefond, & Thuan (1983) explored the HI distribution and discovered a core-halo structure, with the visible star-forming regions located near that core, but slightly shifted with respect to the peak in HI. From Fig. 15 it is visible that the HeB distributions show a major clump and a significant diffuse component, with the former slightly offset compared to the RGB centroid (note that the lack of RGB stars near the HeB major concentration is due to photometric incompleteness). Overall, UGCA281 can be classified as SSC.
Figure 16 shows from top to bottom the galaxies UGC5340, ESO486, UGC685, and UGC695.
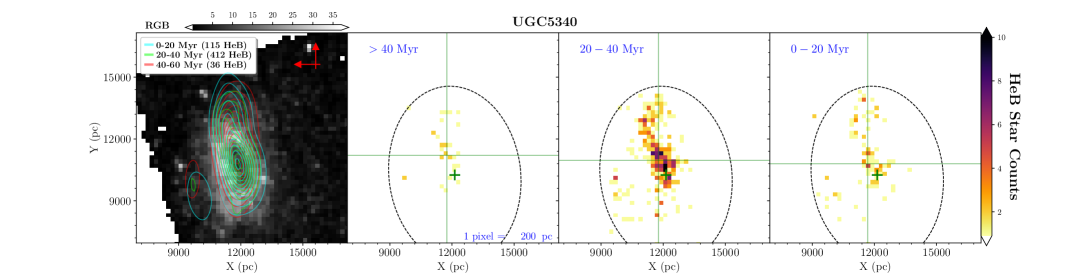
UGC5340: Classified as Im in NED and located in the Lynx Cancer void (Pustilnik, & Tepliakova 2011), this galaxy exhibits a very distorted morphology, with a cometary tail (pointing to the South in our maps) populated by stars of all ages (Tikhonov et al. 2014; Sacchi et al. 2016) and particularly rich in H II regions, which extend from the main body of the galaxy for a projected length of 5 kpc, and is most likely an accreted secondary body (Tikhonov et al. 2014; Sacchi et al. 2016; Annibali et al. 2016). This galaxy is clearly interacting. Indeed, combining HST/ACS and LBT/LBC images, Sacchi et al. (2016) and Annibali et al. (2016) discovered another substructure/satellite. Being at 12.7 Mpc, UGC5340 is among the most distant galaxies in our survey, hence the oldest HeB bin is highly incomplete (as well as the central portion of the RGB spatial distribution). Although the centroids of HeB stars have similar coordinates, it is clear that 20-40 Myr ago the galaxy was much more active in the main body than in the cometary tail, while in the last 20 Myr the main body and the cometary tail appear similarly populated. Compared to RGBs, HeBs centroids are significantly offset and their overall distribution much more elongated. In particular, no significant RGB counterpart is visible in the tail, whereas the northern side shows the opposite. A significant fraction of the 68% ellipse is occupied by HeB stars, suggesting that current SF is globally involving this galaxy. In conclusion, we suggest a type OOD for UGC5340.
ESO486-G021: This galaxy is classified as a likely spiral in NED. In our map the HeBs follow an elongated structure extending from the SE to the NW, with no significant differences in the the three age bins. Avoiding the oldest bin of HeBs, because poorly populated, centroids of the younger HeBs match well the RGB’s centroid. HeB stars tend to fill the RGB 68% ellipse with several of them being located outside. In conclusion, our classification is SSD.
UGC685: Classified as SAm in NED, UGC685 is quite isolated in space. Located at 1.3 Mpc from the centroid of the 17+6 Association (Tully et al. 2006), it hosts a few HII regions that are all concentrated to the South-East of the center of the galaxy (Hopp 1999). Using NIR imaging data, Hopp (1999) found little signs of irregularities, while the HI distribution is much more extended than the optical (stellar) light distribution (see also Roychowdhury et al. 2011).
In our HeB maps, UGC685 appears as an arc whose centroid is only slightly offset from the RGB one. We also see a clear progression of SF, with the main overdensity of HeB stars moving from East to West. RGBs cover a larger field of view than HeBs. We classify this galaxy as OSC.
UGC695: UGC695 is an Sc type galaxy in the Eridanus Void. Most of its current SF shows no trends as a function of time and is concentrated in a single clump, roughly coincident with the RGB centroid. The RGB stars are far more diffuse. Our classification for this system is therefore SSC.
Figure 17 shows from top to bottom the galaxies IC559, NGC5477, NGC4485, and UGC4459.
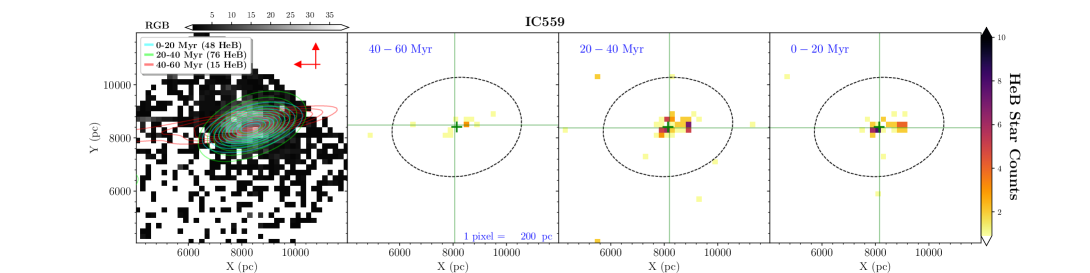
IC559: Classified as Sc, this galaxy is located in the Lynx-Cancer Void. The paucity of HeB stars makes our classification difficult. Overall, the HeB centroids coincide with that of the RGB stars and no SF trend is visible. The RGB distribution is far more extended than that of the HeBs. We suggest a classification SSC.
NGC5477: Classified as SAm in NED, NGC 5477 belongs to the M101 group. Our maps indicate that HeBs extend across much of the RGB 68% ellipse, without showing any age-related change in their overall distribution. Compared to the RGB centroid, the HeB centroids are slightly offset towards the North-East, hence opposite to the direction of M101, where, instead, a possible connecting bridge seems to exist. All together, these features suggest a classification SOD.
NGC 4485: Classified as IBm in NED, this galaxy forms with NGC4490 an isolated bright pair of interacting galaxies. With stellar masses of, respectively, vs M⊙ (Pearson et al. 2018), and a projected distance of 7.7 kpc (Elmegreen et al. 1998), they represent a more massive analogue of the Magellanic Clouds. Both galaxies show signs of tidal disruption, as suggested by the presence of an extended HI envelope (about 50 kpc in projection; Huchtmeier et al. 1980) surrounding the system, a dense bridge of gas connecting the pair, and most of the ongoing star formation taking place primarily between the two galaxies (as indicated by H imaging; Thronson et al. 1989). Pearson et al. (2018) modelled the system using N-body and test-particle simulations, simultaneously reproducing the observed present day morphology and kinematics. According to this study, the tidal forces from NGC 4490 alone are sufficient to match the observed gas properties as long as NGC4485’s spin is prograde with respect to its orbit and has a high inclination orbit with respect to NGC 4490. The 50 kpc (projected) envelope would consist of material from NGC 4485, lost during the first pericentric encounter of the two galaxies ( 1.4 Gyr ago). This suggests that tidal interactions between two low mass galaxies can push the gas to large distances, producing a massive envelope of neutral HI, without invoking stellar feedback (see Clemens et al. 1998) or perturbations from a massive host (like the Milky Way for the Magellanic Clouds).
In our classification, NGC4485 is OOD. Compared to the RGB stars the current SF is shifted to the West, and appears to be progressing to the SW (in the direction of the companion NGC4490), with the most recent SF event taking place in the periphery of the galaxy, at a projected distance larger than 1.5 kpc from the 20-40 Myr old population. This reminds one of the activity of the 30 Doradus region, the most active place in the LMC, located just north of the eastern tip of the LMC bar. The activity between NGC4485 and NGC4490 is probably caused by NGC4490, which is pulling the gas, promoting SF. Interestingly, our recovered SFH (see Fig. 2) does not show a significant recent SF enhancement, corroborating the conclusion of Thronson et al. (1989) that the interaction between NGC 4490 and NGC 4485 may have rearranged the ISM in the two galaxies, causing regions of active star formation to be re-distributed, but without affecting too much the rate of star formation averaged over the entire galaxy.
UGC4459: Classified as Im in NED, UGC 4459 is a quite isolated member of the M81 group, with its nearest neighbour UGC 4483 at a projected distance of about 223 kpc. From the point of view of the gas component, the HI distribution shows two major peaks (Walter et al. 2007; Begum et al. 2006), with a large scale velocity gradient aligned along the line connecting the two (Begum et al. 2006). Moreover, the south-eastern half of the galaxy is receding with a rapid change in velocity with galacto-centric distance, while the approaching (northwestern) half of the galaxy shows a smoother gradient. Begum et al. (2006) reject as unlikely the hypothesis that the peculiar kinematics of the galaxy is due to ram pressure.
In our maps the RGB stars show a rather asymmetric distribution, with a major lobe extending in the East direction. Centroids of RGB and HeB stars are similar, but the highest concentration of HeB stars is elongated and aligned with the line connecting the HI peaks (along the direction North West-South East). In our classification UGC4459 is SSC.
As discussed in Weisz et al. (2008), asymmetries of RGB stars and isolation of UGC4459 may indicate a late-stage merger between two fainter dwarfs. However, the disturbed kinematics and the evidence that the young populations do not follow the distribution of RGB stars maybe also point to a recent gravitational disturbance with a minor satellite that has not been detected yet.
Figure 18 shows from top to bottom the galaxies UGC1249, UGC5139, UGC4305, and NGC3274.
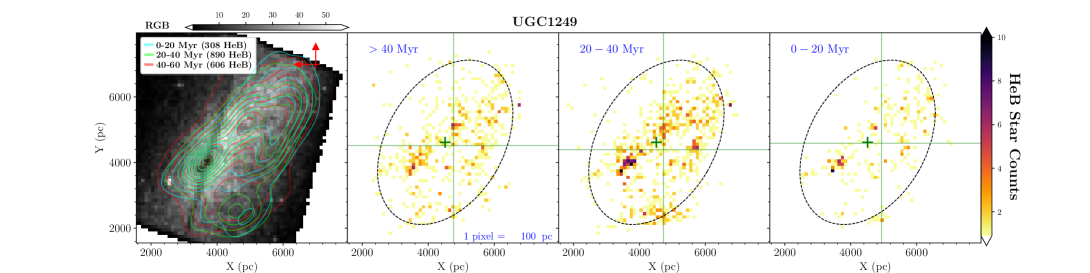
UGC1249: Classified as SBm in NED, UGC1249 is a dwarf spiral galaxy that is in interaction with the barred spiral NGC 672, located at a linear projected separation of 16.3 kpc (Heald, & HALOGAS Team 2011). The HI distribution shows a clear connection between the two galaxies, with the outskirts and interface region more disturbed than optical region. Moreover, a tidal arm trailing behind NGC 672 also suggests an ongoing tidal interaction. The pair seems to be in an early stage of interaction (Heald, & HALOGAS Team 2011). Tikhonov et al. 2014 studied the luminosity functions of red supergiants and peripheral AGB stars in both galaxies, suggesting that simultaneous enhancements of star formation in the two galaxies occurred in the intervals 20–30 and 450–700 Myr ago.
In our maps the RGB stars show an asymmetric distribution, with a major concentration (incomplete in its center) and a diffuse component. The HeB stars are offset with respect to the RGB stars, with at least three major sub-structures: an elongated structure extending from North-West to South-East, visible at all ages, two southern minor clumps, one of which (the southeast one, located partially outside the 68% RGB ellipse) is mostly visible in the range of ages 20-40 Myr. These findings suggest a strong off-center activity at these epochs, corroborating the result of Tikhonov et al. (2014). Overall, the HeB stars fill much of the RGB ellipse, although the higher concentration is on one side (south-west). Interestingly, this side points in the opposite direction with respect to NGC672. Using our notation, UGC1249 is OOD.
UGC5139: Classified as IABm in NED, this galaxy is a member of the M81 group. Ott et al. (2001) combined HI maps with UBV(RI)c and H observations, revealing the presence of a supergiant shell with a diameter of 1.7 kpc covering half of the optical extent. They suggested that in the past this galaxy could have been a BCD, and an intense episode of SF and subsequent SN explosions may have blown the supergiant HI shell. H emission is predominantly found in the south–east side of the galaxy.
The paucity of HeB stars and the little spatial coverage of our observations prevent a firm classification for this galaxy. HeBs occupy most of the 68% RGB ellipse. A tentative classification could be OOD, since the HeB stars are significantly offset compared to the RGB distribution, and a mild spatial trend with age is also visible (younger HeBs are progressively shifted to the south-west). Interestingly, the south–eastern region of UGC5139 points to the M81 triplet (M81, M82, and NGC3077) and shows a steep gradient in the HI distribution, whereas the opposite side (north–west) shows systematically higher velocity dispersions (Ott et al. 2001). All of these asymmetries may indicate that ram pressure stripping and/or tidal forces may be at work in this galaxy.
UGC4305: Classified as Im in NED, UGC4305 belongs to the M81 group and is rather isolated. Despite its isolation, the HI distribution is characterised by numerous holes (Puche et al. 1992), whose origin has been associated with stellar feedback from massive stars (Puche et al. 1992) or stellar feedback from multiple generations of SF spread out over tens or hundreds of Myr (Weisz et al. 2009). The SFH solutions from our work previously presented in Paper I are consistent with an almost constant SF activity over the last 180 Myr, with mild enhancements whose intensity is at most 1.5 times higher than the 100 Myr averaged SFR.
Compared to the ACS pointings, our WFC3 observations cover only part of the galaxy, making it difficult to compare RGB and HeB distributions. However, it is clear from the maps that in the East direction HeB stars extend well beyond the 68% RGB ellipse, with no obvious trend with age. This may suggest a classification of SOD. Using deep H images, Egorov et al. (2016) performed a detailed analysis of the star forming regions in the supergiant H i shell also targeted by our WFC3 field; on the eastern side, where we find the centroids of HeB stars, they measured a less dense medium that is allowing a faster expansion of the ionized gas in the center of the complex. They indeed found 3 faint expanding ionized superbubbles there, which possibly interact with each other, and 3 superbubbles located at the periphery of the complex.
NGC3274: NGC3274 is classified as SABd in NED. To date, no studies have been performed on the stellar population of this galaxy. Our maps do not suggest a clear age dependence of the HeB spatial distributions. The overall structure of the HeB stars younger than 40 Myr is rather elongated, resembling a bar or a spiral arm. Compared to RGB stars, centroids of HeB stars are offset, especially the oldest ones. Our tentative classification is SOD.
Figure 19 shows from top to bottom the galaxies NGC4656, NGC4449 and NGC4248.
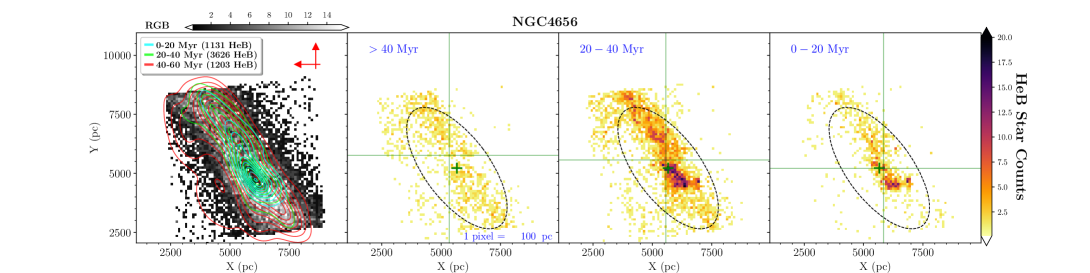
NGC4656: Classified as SBm in NED, NGC4656 is a distorted edge-on spiral galaxy in the NGC4631 group. The first studies (see, e.g., de Vaucouleurs, & de Vaucouleurs 1964; Nilson 1973) of this galaxy concluded that the bright “hook” shaped northeast end of NGC4656 is a separate galaxy from NGC4656, hence, some papers still refer to this system as NGC 4656/4657. Moreover, NGC 4656 was thought to be interacting with its closer neighbour, NGC 4631, an edge-on spiral galaxy at a projected distance of 71 kpc, as suggested by a bridge of neutral hydrogen (Roberts 1968) extending from NGC4656 to NGC 4631. However, a later study focusing on surface brightness profiles (Stayton et al. 1983) concluded that NGC 4656 and NGC 4657 are part of the same galaxy, with no obvious feature indicating an interaction with NGC 4631. In this direction, Martínez-Delgado et al. (2015) discovered a giant stellar tidal stream in the halo of NGC 4631, partially extending between NGC 4631 and NGC 4656. However, orbital considerations made these authors suggest that the stream around NGC 4631 is likely due to interactions between this galaxy and its dwarf satellites. Rand (1994) noted disturbances in the HI kinematics, suggesting that NGC 4656 could be a system with two loosely wrapped tidal arms, or a ring galaxy of the Cartwheel type seen almost edge-on (which may suggest a collision with a companion near the center, causing a radially propagating density wave). More recently, Schechtman-Rook, & Hess (2012) discovered a candidate tidal dwarf in the NGC 4656 system, which was dubbed NGC 4656UV. They compared the spectral energy distribution of all regions of NGC 4656 and NGC 4656UV with a set of stellar population synthesis models, concluding that the metallicity of NGC 4656UV is too low ( 10 times lower than that of NGC 4656) to be a tidal dwarf, which are typically metal rich objects (see, e.g., Weilbacher et al. 2003), and proposed that NGC4656UV formed out of gas stripped from the outskirts of NGC 4656 during an encounter between NGC 4656 and NGC 4631. From dynamical arguments, they estimate the age of this event about 200-300 Myrs ago. de Mello et al. (2012) found eight UV sources younger than 100 Myr in the area of NGC4656UV, corroborating the tidal dwarf hypothesis. Finally, by using Fabry-Perot and GMOS multi-slit data, Muñoz-Elgueta et al. (2018) found that NGC 4656UV has a low metallicity (12+log(O/H), very similar to that of NGC 4656), which places this galaxy on the mass metallicity relation for normal dwarf galaxies (contrary to what is expected for tidal dwarfs). Moreover, through the analysis of the radial velocity profiles and by fitting a kinematic model to the observed velocity field, they confirmed that NGC 4656 is consistent with one single body instead of two objects (NGC 4656 and NGC 4657). Based on these results, Muñoz-Elgueta et al. (2018) suggested that NGC 4656 and NCG 4656UV are a pair of interacting galaxies, with NGC4656UV being a normal dwarf not of tidal origin. Interestingly, their H SFRs also indicate an enhancement in the star formation at the north region (the “hook”), which is the closest to NGC 4656UV. NGC4656UV is beyond our field of view, in the north-east direction.
In our maps, the oldest HeB bin is very incomplete, while the younger HeBs are statistically robust and show interesting features. First, we clearly see two different concentrations. A clustered component, whose centroid is closer to the RGB centroid, and a very elongated tail, extending from the clustered component to the north-east (the “hook”). Moreover, in the last 0-20 Myr the clustered component has become more active with respect to the tail, suggesting that the SF is progressing toward the south-west, in apparent contrast with the result of Muñoz-Elgueta et al. (2018). However, their finding is that the very recent SFR is more intense in the north-east region, compared to the central and south-west one. Our result is that the north-east region is older than the central clustered component. In other words, if the hook region has been caused by the interaction with NGC4656UV, this interaction may be not happening right now. From these characteristics, a tentative classification for NGC4656 is OOD.
NGC 4449: Classified as SBm in NED, NGC4449 is located in the Canes Venatici I group. It is similar in size and mass to the Large Magellanic Cloud, with ongoing and intense star formation distributed along a bar-like structure (Hill et al. 1994). Its closest neighbours are the gas rich dwarf galaxy DDO 125, at a projected distance of 40 kpc, and a tidally distorted, old and a very low surface brightness dwarf, NGC4449B (Martínez-Delgado et al. 2015; Rich et al. 2012), located at a projected distance of 9 kpc from NGC4449.
The gas component shows a variety of morphological features like filaments, arcs, and loops extending for several kpc (Hunter, & Gallagher 1997), well beyond the optical galaxy. Hunter et al. (1998) found a strong condensation of gas centered on the optical galaxy with a diameter of about 9 kpc, in turn embedded in an elongated ellipse of lower column density with a major axis of 35 kpc. Beyond the ellipse the gas distribution is dominated by streamers, with the longest originating from the eastern side of the ellipse and extending south-west for 25 kpc toward a large HI concentration. Kinematically, the inner and outer parts of the neutral gas form two separate systems that are counter-rotating (Hunter et al. 1998), which generally signals the recent accretion of gas.
Despite these asymmetries, it is not clear whether the observed streamers are tidal tails caused by dynamical interaction (Hunter et al. 1998). Toloba et al. (2016) studied the internal stellar kinematics and metallicities of NGC4449 and NGC4449B, finding similar radial velocities to within measurement uncertainties, consistent with what may be expected if NGC4449B were gravitationally bound to NGC 4449.
NGC4449 was a challenging galaxy to model in both Paper I and Sacchi et al. (2017), where we analyzed the optical (F555W/F814W) counterpart of the LEGUS catalog for this galaxy. Its high levels of differential reddening (the highest we find in the 23 dwarfs analyzed here) make the CMD harder to interpret, smearing its features exacerbating the separation between MS and post-MS stars. In the UV case, we also needed an IMF flatter than a Salpeter one () to provide a better fit to the data, even though the degeneracy between mass and age for very massive stars prevents us from making strong claims in this regard.
In our spatial maps, the young component of NGC4449 shows a prominent bar, with two streams stemming from its extremities. Compared to the RGB distribution, these features occupy a modest fraction of the ellipse. The stream extending to north is also connected to another stellar overdensity. Moving to younger ages, the bar becomes thinner and the ratio between the number of HeB stars in the overdensity and in the bar grows. All centroids are significantly offset. We classify this galaxy as OOC.
NGC4248: Classified as a likely spiral in NED, NGC4248 is a member of the Canes Venatici II Group (Fouque et al. 1992), whose brightest member, M106, can be considered a Milky Way analogue. Using deep, wide-field surface photometry, Watkins et al. (2016) found extremely boxy and offset outer isophotes, a clear evidence of tidal distortion. Our HeBs maps show an elongated structure which moves to north-east with time. Compared to the RGB distribution, HeB stars occupy a tiny region and are clearly offset with respect to the RGB centroid. Following our scheme, NGC4248 can be classified as OOC.
6. Discussion and conclusions
Following our previous work on the star formation history of NGC4449, NGC1705, and NGC 4305 (Holmberg II), presented in Paper I, we have investigated the stellar populations, CMDs, SFHs, and SF patterns of the full sample of 23 LEGUS star forming dwarf galaxies.
The aim of this study was to characterize starbursts, both in terms of duration and spatial distribution of the star formation process in these active systems. Comparing different galaxies in the most homogeneous approach possible is also key to connecting the SF activity with the environment in which galaxies live, and to find possible mechanisms triggering the formation of stars in this kind of galaxies.
To this purpose, we took advantage of the UV bands of HST, thanks to the data obtained within the LEGUS survey from both new and archival observations with the WFC3 and ACS. By studying the U vs UV CMDs of our targets, we were able to infer detailed SFHs in the last Myr with unprecedented time resolution, and to compare our results with FUV and H integrated information. While the SFHs exhibit different shapes from galaxy to galaxy, particularly at the youngest epochs, the general trend is a relatively flat SF as a function of time, with no major bursts, and the strongest SF enhancements exceeding the 100-Myr average only by a factor of 2-3. These results hold irrespective of: 1) the stellar evolution library used to reconstruct the SFH, despite the different assumption in the underlying stellar physics; 2) the mass fraction of atomic gas (HI). Indeed, when the whole sample is divided into two sub-groups, gas-rich and gas-poor SFDs, no systematic difference is observed in their average SFHs.
In a few cases (NGC4449, NGC5253, NGC3738, and NGC4656) the levels of stellar crowding and/or differential reddening found in the fields challenged our ability to reproduce the star-counts and color spread of the observational CMDs. This is due to large completeness variations on the scale of fractions of a kpc, very difficult to account for even using our artificial star procedure, specifically designed to this purpose. Also our extinction modeling, based on two parameters, might be too simplistic when applied to extreme cases like these. On the other hand, stellar evolution models need to be taken with caution when studying these shorter wavelengths, especially in the color transition from MS to post-MS stars; indeed, the synthetic CMDs of NGC4449 and NGC3738 present a gap (much larger than photometric uncertainties) between the MS and the post-MS phase that is completely absent in the observed CMDs. A similar gap was already found by Tang et al. (2014) in several dwarf galaxies, and can be overcome by extending the stellar mechanism of the overshooting at the base of the convective envelope.
We found very interesting results when comparing our derived SFRs with integrated FUV and H rates. For half of the sample, our 60-Myr-average CMD-based SFR is more than two times the FUV SFR (corrected for extinction), whereas the CMD-based 10 Myr-average SFRs are consistent with the H estimates. This corroborates the result of McQuinn et al. (2015), extending the sample of galaxies where the discrepancy is found.
Finally, using HeB stars in different age intervals, we have studied
how the star formation has been spatially progressing in the last 60
Myr. We found a large variance of spatial configurations, both in
terms of concentration with respect to the RGB stars distribution and
localization of different HeBs generations. About 44% of our galaxies
shows a spatial progression of the SF in the last 60 Myr. Compared to
RGB stars, only a few galaxies show very centralized concentrations of
young stars, while the typical distribution is neither clearly
centralized nor clearly diffuse. About 52% of the sample is
caracterized by offsets larger than 250 pc between RGB and HeB spatial
centroids. In terms of spatial coverage, about 44% of galaxies is
caracterized by a population of HeB stars that are spread out as much
as the RGB stars. This result overall confirms the
McQuinn et al.’s (2012) findings, who studied the concentration of blue
HeB stars (from optical CMDs) over the last 100–250 Myr, suggesting
that the starburst phenomenon is not necessarily a SF event taking
place in the very center of the system.
We can briefly summarize our main results here.
-
•
In the last 100 Myr the dwarfs of the LEGUS sample show different SFH, but no significant bursts (larger than 2-3 times the 100-Myr-average) are detected. On average, the activity in the last 100 Myr is consistent with a constant trend, irrespective of the mass fraction of atomic gas in the galaxies;
-
•
Overall the synthetic CMDs reproduce well qualitatively and quantitatively the observations, except in a few very crowded and/or extincted galaxies;
-
•
The starburst phenomenon is not exclusively a concentrated and instantaneous SF event. A large fraction of our galaxies show: 1) very recent diffuse (compared to RGB stars) SF; 2) off-center recent or ongoing SF; 3) spatial progression of SF;
-
•
Most of the galaxies in the sample show a CMD-based average SFR in the last 60 Myr higher than the FUV-based SFR (based on existing scaling relations). The CMD-based average SFR in the last 10 Myr is instead in good agreement with the H-based SFR.
References
- Annibali et al. (2003) Annibali, F., Greggio, L., Tosi, M., Aloisi, A., & Leitherer, C. 2003, AJ, 126, 2752
- Annibali et al. (2008) Annibali, F., Aloisi, A., Mack, J., et al. 2008, AJ, 135, 1900
- Annibali et al. (2009) Annibali, F., Tosi, M., Monelli, M., et al. 2009, AJ, 138, 169
- Annibali et al. (2012) Annibali, F., Tosi, M., Aloisi, A., van der Marel, R. P., & Martinez-Delgado, D. 2012, ApJ, 745, L1
- Annibali et al. (2015) Annibali, F., Tosi, M., Pasquali, A., et al. 2015, AJ, 150, 143
- Annibali et al. (2016) Annibali, F., Nipoti, C., Ciotti, L., et al. 2016, ApJ, 826, L27
- Ashley et al. (2014) Ashley, T., Elmegreen, B. G., Johnson, M., et al. 2014, AJ, 148, 130
- Banks et al. (1999) Banks, G. D., Disney, M. J., Knezek, P. M., et al. 1999, ApJ, 524, 612
- Begum et al. (2006) Begum, A., Chengalur, J. N., Karachentsev, I. D., et al. 2006, MNRAS, 365, 1220
- Bellazzini et al. (2001) Bellazzini, M., Ferraro, F. R., & Pancino, E. 2001, ApJ, 556, 635
- Bekki & Couch (2003) Bekki, K., & Couch, W. J. 2003, ApJ, 596, L13
- Bekki & Freeman (2002) Bekki, K., & Freeman, K. C. 2002, ApJ, 574, L21
- Berg et al. (2012) Berg, D. A., Skillman, E. D., Marble, A. R., et al. 2012, ApJ, 754, 98
- Bernard et al. (2012) Bernard, E. J., Ferguson, A. M. N., Barker, M. K., et al. 2012, MNRAS, 426, 3490
- Bertelli et al. (1994) Bertelli, G., Bressan, A., Chiosi, C., Fagotto, F., & Nasi, E. 1994, A&AS, 106,
- Bressan et al. (2012) Bressan, A., Marigo, P., Girardi, L., et al. 2012, MNRAS, 427, 127
- Bressan et al. (2015) Bressan, A., Girardi, L., Marigo, P., Rosenfield, P., & Tang, J. 2015, Asteroseismology of Stellar Populations in the Milky Way, 39, 25
- Bureau & Carignan (2002) Bureau, M., & Carignan, C. 2002, AJ, 123, 1316
- Calzetti et al. (2004) Calzetti, D., Harris, J., Gallagher, J. S., et al. 2004, AJ, 127, 1405
- Calzetti et al. (2007) Calzetti, D., Kennicutt, R. C., Engelbracht, C. W., et al. 2007, ApJ, 666, 870
- Calzetti et al. (2015) Calzetti, D., Lee, J. C., Sabbi, E., et al. 2015, AJ, 149, 51
- Cannon et al. (2016) Cannon, J. M., McNichols, A. T., Teich, Y. G., et al. 2016, AJ, 152, 202
- Caffau et al. (2011) Caffau, E., Ludwig, H.-G., Steffen, M., Freytag, B., & Bonifacio, P. 2011, Sol. Phys., 268, 255
- Cardelli et al. (1989) Cardelli, J. A., Clayton, G. C., & Mathis, J. S. 1989, ApJ, 345, 245
- Choi et al. (2016) Choi, J., Dotter, A., Conroy, C., et al. 2016, ApJ, 823, 102
- Cignoni et al. (2015) Cignoni, M., Sabbi, E., van der Marel, R. P., et al. 2015, ApJ, 811, 76
- Cignoni et al. (2016) Cignoni, M., Sabbi, E., van der Marel, R. P., et al. 2016, ApJ, 833, 154
- Cignoni et al. (2018) Cignoni, M., Sacchi, E., Aloisi, A., et al. 2018, ApJ, 856, 62
- Clemens et al. (1998) Clemens, M. S., Alexander, P., & Green, D. A. 1998, MNRAS, 297, 1015
- Croxall et al. (2009) Croxall, K. V., van Zee, L., Lee, H., et al. 2009, ApJ, 705, 723-738
- Dalcanton et al. (2012) Dalcanton, J. J., Williams, B. F., Melbourne, J. L., et al. 2012, ApJS, 198, 6
- Dale et al. (2009) Dale, D. A., Cohen, S. A., Johnson, L. C., et al. 2009, ApJ, 703, 517
- De Marchi et al. (2016) De Marchi, G., Panagia, N., Sabbi, E., et al. 2016, MNRAS, 455, 4373
- Egorov et al. (2016) Egorov, O. V., Lozinskaya, T. A., & Moiseev, A. V. 2016, The Interplay Between Local and Global Processes in Galaxies,, 30
- Firth et al. (2006) Firth, P., Evstigneeva, E. A., Jones, J. B., et al. 2006, MNRAS, 372, 1856
- de Mello et al. (2012) de Mello, D. F., Urrutia-Viscarra, F., Mendes de Oliveira, C., et al. 2012, MNRAS, 426, 2441
- de Mink et al. (2012) de Mink, S. E., Brott, I., Cantiello, M., et al. 2012, Proceedings of a Scientific Meeting in Honor of Anthony F. J. Moffat, 465, 65
- de Mink et al. (2014) de Mink, S. E., Sana, H., Langer, N., et al. 2014, ApJ, 782, 7
- de Vaucouleurs, & de Vaucouleurs (1964) de Vaucouleurs, G., & de Vaucouleurs, A. 1964, ApJ, 140, 1622
- Dohm-Palmer et al. (1997) Dohm-Palmer, R. C., Skillman, E. D., Saha, A., et al. 1997, AJ, 114, 2527
- Dolphin (2000) Dolphin, A. E. 2000, PASP, 112, 1383
- Dotter (2016) Dotter, A. 2016, ApJS, 222, 8
- Elmegreen et al. (1998) Elmegreen, D. M., Chromey, F. R., Knowles, B. D., et al. 1998, AJ, 115, 1433
- Elmegreen et al. (2012) Elmegreen, B. G., Zhang, H.-X., & Hunter, D. A. 2012, ApJ, 747, 105
- Elmegreen & Scalo (2006) Elmegreen, B. G., & Scalo, J. 2006, ApJ, 636, 149
- Evstigneeva et al. (2007) Evstigneeva, E. A., Drinkwater, M. J., Jurek, R., et al. 2007, MNRAS, 378, 1036
- Fouque et al. (1992) Fouque, P., Gourgoulhon, E., Chamaraux, P., et al. 1992, A&AS, 93, 211
- Gerola et al. (1980) Gerola, H., Seiden, P. E., & Schulman, L. S. 1980, ApJ, 242, 517
- Gallart et al. (2015) Gallart, C., Monelli, M., Mayer, L., et al. 2015, ApJ, 811, L18
- Hao et al. (2011) Hao, C.-N., Kennicutt, R. C., Johnson, B. D., et al. 2011, ApJ, 741, 124
- Harris et al. (1997) Harris, J., Zaritsky, D., & Thompson, I. 1997, AJ, 114, 1933
- Heald, & HALOGAS Team (2011) Heald, G. H., & HALOGAS Team 2011, American Astronomical Society Meeting Abstracts #217 217, 246.19
- Heckman & Leitherer (1997) Heckman, T. M., & Leitherer, C. 1997, AJ, 114, 69
- Heckman et al. (2001) Heckman, T. M., Sembach, K. R., Meurer, G. R., et al. 2001, ApJ, 554, 1021
- Hill et al. (1994) Hill, R. S., Home, A. T., Smith, A. M., et al. 1994, ApJ, 430, 568
- Hopp (1999) Hopp, U. 1999, A&AS, 134, 317
- Huchtmeier et al. (1980) Huchtmeier, W. K., Seiradakis, J. H., & Materne, J. 1980, A&A, 91, 341
- Hunter, & Gallagher (1997) Hunter, D. A., & Gallagher, J. S. 1997, ApJ, 475, 65
- Hunter et al. (1998) Hunter, D. A., Wilcots, E. M., van Woerden, H., Gallagher, J. S., & Kohle, S. 1998, ApJ, 495, L47
- Hunter et al. (1999) Hunter, D. A., van Woerden, H., & Gallagher, J. S. 1999, AJ, 118, 2184
- Hunter & Elmegreen (2004) Hunter, D. A., & Elmegreen, B. G. 2004, AJ, 128, 2170
- Huchtmeier & Richter (1989) Huchtmeier, W. K., & Richter, O. G. 1989, Science, 246, 943
- Johnson et al. (2003) Johnson, K. E., Indebetouw, R., & Pisano, D. J. 2003, AJ, 126, 101
- Johnson et al. (2013) Johnson, B. D., Weisz, D. R., Dalcanton, J. J., et al. 2013, ApJ, 772, 8
- Karachentsev et al. (2003) Karachentsev, I. D., Sharina, M. E., Dolphin, A. E., et al. 2003, A&A, 398, 467
- Karczewski et al. (2013) Karczewski, O. Ł., Barlow, M. J., Page, M. J., et al. 2013, MNRAS, 431, 2493
- Kennicutt (1998) Kennicutt, R. C. 1998, ARA&A, 36, 189
- Kennicutt et al. (2009) Kennicutt, R. C., Hao, C.-N., Calzetti, D., et al. 2009, ApJ, 703, 1672
- Kereš et al. (2005) Kereš, D., Katz, N., Weinberg, D. H., & Davé, R. 2005, MNRAS, 363, 2
- Koleva et al. (2014) Koleva, M., De Rijcke, S., Zeilinger, W. W., et al. 2014, MNRAS, 441, 452
- Kornreich et al. (1998) Kornreich, D. A., Haynes, M. P., & Lovelace, R. V. E. 1998, AJ, 116, 2154
- Kroupa (2001) Kroupa, P. 2001, MNRAS, 322, 231
- Lahén et al. (2019) Lahén, N., Naab, T., Johansson, P. H., et al. 2019, ApJ, 879, L18
- Lee et al. (2009) Lee, J. C., Gil de Paz, A., Tremonti, C., et al. 2009, ApJ, 706, 599-613
- Lee et al. (2011) Lee, J. C., Gil de Paz, A., Kennicutt, R. C., et al. 2011, ApJS, 192, 6
- Lelli et al. (2014) Lelli, F., Verheijen, M., & Fraternali, F. 2014, MNRAS, 445, 1694
- Leroy et al. (2013) Leroy, A. K., Walter, F., Sandstrom, K., et al. 2013, AJ, 146, 19
- López-Sánchez et al. (2012) López-Sánchez, Á. R., Koribalski, B. S., van Eymeren, J., et al. 2012, MNRAS, 419, 1051
- Marigo et al. (2017) Marigo, P., Girardi, L., Bressan, A., et al. 2017, ApJ, 835, 77
- Martin (1998) Martin, C. L. 1998, ApJ, 506, 222
- Martínez-Delgado et al. (2012) Martínez-Delgado, D., Romanowsky, A. J., Gabany, R. J., et al. 2012, ApJ, 748, L24
- Martínez-Delgado et al. (2015) Martínez-Delgado, D., D’Onghia, E., Chonis, T. S., et al. 2015, AJ, 150, 116
- Martins et al. (2012) Martins, F., Förster Schreiber, N. M., Eisenhauer, F., & Lutz, D. 2012, A&A, 547, A17
- Mihos et al. (2013) Mihos, J. C., Harding, P., Spengler, C. E., et al. 2013, ApJ, 762, 82
- McQuinn et al. (2010) McQuinn, K. B. W., Skillman, E. D., Cannon, J. M., et al. 2010, ApJ, 724, 49
- McQuinn et al. (2011) McQuinn, K. B. W., Skillman, E. D., Dalcanton, J. J., et al. 2011, ApJ, 740, 48
- McQuinn et al. (2012) McQuinn, K. B. W., Skillman, E. D., Dalcanton, J. J., et al. 2012, ApJ, 759, 77
- McQuinn et al. (2015) McQuinn, K. B. W., Mitchell, N. P., & Skillman, E. D. 2015, ApJS, 218, 29
- McQuinn et al. (2015) McQuinn, K. B. W., Skillman, E. D., Dolphin, A. E., et al. 2015, ApJ, 808, 109
- Meynet & Maeder (1997) Meynet, G., & Maeder, A. 1997, A&A, 321, 465
- Melisse & Israel (1994) Melisse, J. P. M., & Israel, F. P. 1994, A&A, 285, 51
- Meurer et al. (1992) Meurer, G. R., Freeman, K. C., Dopita, M. A., & Cacciari, C. 1992, AJ, 103, 60
- Meurer et al. (1998) Meurer, G. R., Staveley-Smith, L., & Killeen, N. E. B. 1998, MNRAS, 300, 705
- Meurer et al. (2006) Meurer, G. R., Hanish, D. J., Ferguson, H. C., et al. 2006, ApJS, 165, 307
- Miura et al. (2018) Miura, R. E., Espada, D., Hirota, A., et al. 2018, ApJ, 864, 120
- Moustakas et al. (2010) Moustakas, J., Kennicutt, R. C., Jr., Tremonti, C. A., et al. 2010, ApJS, 190, 233-266
- Mühle et al. (2005) Mühle, S., Klein, U., Wilcots, E. M., & Hüttemeister, S. 2005, AJ, 130, 524
- Murphy et al. (2011) Murphy, E. J., Condon, J. J., Schinnerer, E., et al. 2011, ApJ, 737, 67
- Muñoz-Elgueta et al. (2018) Muñoz-Elgueta, N., Torres-Flores, S., Amram, P., et al. 2018, MNRAS, 480, 3257
- Nilson (1973) Nilson, P. 1973, Acta Universitatis Upsaliensis. Nova Acta Regiae Societatis Scientiarum Upsaliensis - Uppsala Astronomiska Observatoriums Annaler
- Ott et al. (2001) Ott, J., Walter, F., Brinks, E., et al. 2001, AJ, 122, 3070
- Ott et al. (2005) Ott, J., Walter, F., & Brinks, E. 2005, MNRAS, 358, 1423
- Patton et al. (2013) Patton, D. R., Torrey, P., Ellison, S. L., Mendel, J. T., & Scudder, J. M. 2013, MNRAS, 433, L59
- Paxton et al. (2011) Paxton, B., Bildsten, L., Dotter, A., et al. 2011, ApJS, 192, 3
- Paxton et al. (2013) Paxton, B., Cantiello, M., Arras, P., et al. 2013, ApJS, 208, 4
- Pearson et al. (2018) Pearson, S., Privon, G. C., Besla, G., et al. 2018, MNRAS, 480, 3069
- Paxton et al. (2015) Paxton, B., Marchant, P., Schwab, J., et al. 2015, ApJS, 220, 15
- Puche et al. (1992) Puche, D., Westpfahl, D., Brinks, E., & Roy, J.-R. 1992, AJ, 103, 1841
- Pustilnik, & Tepliakova (2011) Pustilnik, S. A., & Tepliakova, A. L. 2011, MNRAS, 415, 1188
- Ramachandran et al. (2019) Ramachandran, V., Hamann, W.-R., Oskinova, L. M., et al. 2019, A&A, 625, A104
- Rand (1994) Rand, R. J. 1994, A&A, 285, 833
- Rich et al. (2012) Rich, R. M., Collins, M. L. M., Black, C. M., et al. 2012, Nature, 482, 192
- Roberts (1968) Roberts, M. S. 1968, ApJ, 151, 117
- Roychowdhury et al. (2011) Roychowdhury, S., Chengalur, J. N., Kaisin, S. S., et al. 2011, MNRAS, 414, L55
- Rownd et al. (1994) Rownd, B. K., Dickey, J. M., & Helou, G. 1994, AJ, 108, 1638
- Sabbi et al. (2012) Sabbi, E., Lennon, D. J., Gieles, M., et al. 2012, ApJ, 754, LL37
- Sabbi et al. (2015) Sabbi, E., Lennon, D. J., Anderson, J., et al. 2016, ApJS, 222, 11
- Sabbi et al. (2018) Sabbi, E., Calzetti, D., Ubeda, L., et al. 2018, ApJS, 235, 23
- Sacchi et al. (2016) Sacchi, E., Annibali, F., Cignoni, M., et al. 2016, ApJ, 830, 3
- Sacchi et al. (2017) Sacchi, E., Cignoni, M., A. Aloisi, et al., 2018, ApJ, 857, 63S
- Sana et al. (2013) Sana, H., de Koter, A., de Mink, S. E., et al. 2013, A&A, 550, A107
- Sana & Evans (2011) Sana, H., & Evans, C. J. 2011, Active OB Stars: Structure, Evolution, Mass Loss, and Critical Limits, 272, 474
- Schaerer et al. (1993) Schaerer, D., Meynet, G., Maeder, A., & Schaller, G. 1993, A&AS, 98, 523
- Schechtman-Rook, & Hess (2012) Schechtman-Rook, A., & Hess, K. M. 2012, ApJ, 750, 171
- Schneider et al. (2018) Schneider, F. R. N., Sana, H., Evans, C. J., et al. 2018, Science, 359, 69
- Stayton et al. (1983) Stayton, L. C., Angione, R. J., & Talbert, F. D. 1983, AJ, 88, 602
- Starkenburg et al. (2016) Starkenburg, T. K., Helmi, A., & Sales, L. V. 2016, A&A, 595, A56
- Stewart et al. (2000) Stewart, S. G., Fanelli, M. N., Byrd, G. G., et al. 2000, ApJ, 529, 201
- Stierwalt et al. (2015) Stierwalt, S., Besla, G., Patton, D., et al. 2015, ApJ, 805, 2
- Stierwalt et al. (2017) Stierwalt, S., Liss, S. E., Johnson, K. E., et al. 2017, arXiv:1701.01731
- Stil & Israel (2002) Stil, J. M., & Israel, F. P. 2002, A&A, 392, 473
- Stinson et al. (2007) Stinson, G. S., Dalcanton, J. J., Quinn, T., Kaufmann, T., & Wadsley, J. 2007, ApJ, 667, 170
- Tang et al. (2014) Tang, J., Bressan, A., Rosenfield, P., et al. 2014, MNRAS, 445, 4287
- Theis (1999) Theis, C. 1999, Reviews in Modern Astronomy, 12, 309
- Thronson et al. (1989) Thronson, H. A., Hunter, D. A., Casey, S., et al. 1989, ApJ, 339, 803
- Tikhonov et al. (2014) Tikhonov, N. A., Galazutdinova, O. A., & Lebedev, V. S. 2014, Astronomy Letters, 40, 1
- Tikhonov et al. (2014) Tikhonov, N. A., Galazutdinova, O. A., & Lebedev, V. S. 2014, Astronomy Letters, 40, 11
- Tognelli et al. (2011) Tognelli, E., Prada Moroni, P. G., & Degl’Innocenti, S. 2011, A&A, 533, A109
- Toloba et al. (2016) Toloba, E., Guhathakurta, P., Romanowsky, A. J., et al. 2016, ApJ, 824, 35
- Tolstoy et al. (2009) Tolstoy, E., Hill, V., & Tosi, M. 2009, ARA&A, 47, 371
- Tosi et al. (1991) Tosi, M., Greggio, L., Marconi, G., et al. 1991, AJ, 102, 951
- Tosi et al. (2001) Tosi, M., Sabbi, E., Bellazzini, M., et al. 2001, AJ, 122, 1271
- Tully (1988) Tully, R. B. 1988, AJ, 96, 73
- Tully et al. (2006) Tully, R. B., Rizzi, L., Dolphin, A. E., et al. 2006, AJ, 132, 729
- Turner et al. (2015) Turner, J. L., Beck, S. C., Benford, D. J., et al. 2015, Nature, 519, 331
- van Woerden et al. (1975) van Woerden, H., Bosma, A., & Mebold, U. 1975, La Dynamique des galaxies spirales, 241, 483
- van der Hulst, & Huchtmeier (1979) van der Hulst, J. M., & Huchtmeier, W. K. 1979, A&A, 78, 82
- Viallefond, & Thuan (1983) Viallefond, F., & Thuan, T. X. 1983, ApJ, 269, 444
- Walter et al. (2007) Walter, F., Cannon, J. M., Roussel, H., et al. 2007, ApJ, 661, 102
- Watkins et al. (2016) Watkins, A. E., Mihos, J. C., & Harding, P. 2016, ApJ, 826, 59
- Weidner, & Kroupa (2005) Weidner, C., & Kroupa, P. 2005, ApJ, 625, 754
- Weilbacher et al. (2003) Weilbacher, P. M., Duc, P.-A., & Fritze-v. Alvensleben, U. 2003, A&A, 397, 545
- Weisz et al. (2008) Weisz, D. R., Skillman, E. D., Cannon, J. M., et al. 2008, ApJ, 689, 160-183
- Weisz et al. (2009) Weisz, D. R., Skillman, E. D., Cannon, J. M., et al. 2009, ApJ, 704, 1538-1569
- Weisz et al. (2011) Weisz, D. R., Dalcanton, J. J., Williams, B. F., et al. 2011, ApJ, 739, 5
- Weisz et al. (2012) Weisz, D. R., Johnson, B. D., Johnson, L. C., et al. 2012, ApJ, 744, 44