Pano: Optimizing 360° Video Streaming with a Better Understanding of Quality Perception
Abstract.
Streaming 360° videos requires more bandwidth than non-360° videos. This is because current solutions assume that users perceive the quality of 360° videos in the same way they perceive the quality of non-360° videos. This means the bandwidth demand must be proportional to the size of the user’s field of view. However, we found several quality-determining factors unique to 360° videos, which can help reduce the bandwidth demand. They include the moving speed of a user’s viewpoint (center of the user’s field of view), the recent change of video luminance, and the difference in depth-of-fields of visual objects around the viewpoint.
This paper presents Pano, a 360° video streaming system that leverages the 360° video-specific factors. We make three contributions. (1) We build a new quality model for 360° videos that captures the impact of the 360° video-specific factors. (2) Pano proposes a variable-sized tiling scheme in order to strike a balance between the perceived quality and video encoding efficiency. (3) Pano proposes a new quality-adaptation logic that maximizes 360° video user-perceived quality and is readily deployable. Our evaluation (based on user study and trace analysis) shows that compared with state-of-the-art techniques, Pano can save 41-46% bandwidth without any drop in the perceived quality, or it can raise the perceived quality (user rating) by 25%-142% without using more bandwidth.
1. Introduction
360° videos are coming to age, with most major content providers offering 360° video-based applications (fac, [n. d.]; Goo, [n. d.]; Hul, [n. d.]; Vim, [n. d.]; Net, [n. d.]; You, [n. d.]; iQi, [n. d.]). At the same time, streaming 360° videos is more challenging than streaming traditional non-360° videos. To create an immersive experience, a 360° video must stream the content of a large sphere, in high resolution and without any buffering stall (Rondao Alface et al., 2012; Gaddam et al., 2016). To put it into perspective, let us consider a traditional full-HD video of 40 pixels per degree (PPD) displayed on a desktop screen, which is an area of 48° in width as perceived by viewer’s eyes (if the screen is 15” in width at a distance of 30” to the viewer). Streaming this video on the laptop screen takes roughly 5 Mbps. In contrast, if we want to keep the perceived quality level (same PPD) for the panoramic sphere, it will take 400 Mbps, 80 more bandwidth consumption (Mangiante et al., 2017).
This paper is motivated by a simple, yet seemingly impossible quest: can we stream 360° videos in the same perceived quality as traditional non-360° videos without using more bandwidth? Given that today’s Internet is capable of streaming high-quality videos to billions of users in most parts of the world, achieving this goal would have great societal implications and could spur massive popularization of 360° videos.
Unfortunately, the current approaches fall short of achieving this goal. Most solutions (e.g., (Qian et al., 2018; Zhou et al., 2018; Bao et al., 2017; Petrangeli et al., 2017; Fan et al., 2017; Corbillon et al., 2017b; Sreedhar et al., 2017)) follow the viewport-driven approach, where only the viewport (the region facing the viewer) is streamed in high quality, but this approach has several limitations. First, a viewport (110° in width (Yao et al., 2014)) is still much larger than a laptop screen (48° in width) as perceived by users, so to stream a viewport region would still need at least twice the bandwidth of streaming a screen-size video at the same quality (Cermak et al., 2011). Second, as the viewport content needs to be pre-fetched, the player must predict where the user will look at in the future, so any prediction error can cause playback rebuffering or quality drops. Third, to adapt to arbitrary viewport movements, the 360° video must be spatially split into small tiles, which could substantially increase the size of the video.
In this work, we look beyond the viewport-driven approach and show that the quality of 360° videos is perceived differently than that of non-360° videos, due to the presence of viewpoint movements111This paper makes two assumptions: (1) the movement of the head-mounted device can approximate the movement of the actual viewpoint, and (2) the object closest to the viewpoint is the one being watched by the user. These assumptions might be simplistic, but they can be refined with recent work on accurate viewpoint tracking (e.g., (tob, [n. d.]; sma, [n. d.]; Yu et al., 2015; Lo et al., 2017; Corbillon et al., 2017a)).. In particular, we empirically show three quality-determining factors unique to 360° videos. The user’s sensitivity to the quality of a region is dependent on (1) the relative viewpoint-moving speed between the movement of viewpoint (center of the viewport) and the movement of visual objects in the region , (2) the difference of depth-of-field (DoF) between the region and the viewpoint-focused content, and (3) the change in luminance of the viewport in the last few seconds. For instance, when the viewpoint moves slowly (e.g., 5 deg/s), users tend to be sensitive to small quality distortion; when the viewpoint moves quickly (e.g., shaking head or browsing landscape), the sensitivity can drop sharply—users might be insensitive to large quality distortion. In short, how sensitive a user is to quality distortion can vary over time due to the viewpoint movements. (See §2.2 for more discussions.)
The observation that users perceive 360° video quality differently opens up new opportunities to improve 360° video quality and save bandwidth. If we know a user’s sensitivity to quality distortion, we can raise quality by a maximally perceivable amount, when there is spare bandwidth; and we can lower the quality by a maximal yet imperceptible amount, when the bandwidth is constrained. The underlying insight is that each user has a limited span of attention. For instance, when a user moves her viewpoint, the area being watched does increase, but since the attention will be spread across a wider area, the user’s attention per-pixel actually decreases.
To explore these opportunities, this paper presents Pano, a 360° video streaming system that entails three contributions:
First, Pano is built on a new quality model for 360° videos that systematically incorporates the new quality-determining factors (§4). We run a user study222Our study was IRB approved by our university, IRB00001052-18098. It does not raise any ethical issues. to quantitatively show the relationship between the user’s sensitivity to quality distortion and the relative viewpoint-moving speed, the difference of depth-of-field (DoF), and the change of luminance. The new model allows us to estimate the subjectively perceived video quality more accurately than traditional video quality metrics (e.g., PSNR (Hore and Ziou, 2010)).
Second, Pano uses a novel variable-sized tiling scheme to cope with the heterogeneous distribution of users’ sensitivity over the panoramic sphere (§5). Traditionally, a 360° video is split into equal-sized tiles (e.g., 612, 1224), each encoded in multiple quality levels, so that the player can choose different quality levels for different tiles as the viewport location moves. This uniform tiling scheme, however, might be either too coarse-grained to reflect where the user sensitivity varies, or too fine-grained to contain the video encoding overhead. Instead, Pano uses variable-sized tiling scheme, which splits the video into tiles of different sizes so that a user tends to have similar sensitivity when watching the same tile.
Finally, Pano adapts video quality in a way that is (a) robust to the vagaries of viewpoint movements, and (b) readily deployable in the existing video delivery infrastructure (§6). Pano optimizes user-perceived quality by dynamically predicting viewpoint movements and adapting quality accordingly. Despite the inevitable viewpoint prediction errors, Pano can still pick the desirable quality levels, because to estimate the user’s sensitivity to quality distortion, it suffices to predict the range of viewpoint-moving speed, luminance and DoF. In addition, since Pano needs information from both client (i.e., viewpoint trajectory) and server (i.e., video pixel information), it is incompatible with the mainstream DASH protocols (DAS, [n. d.]) where a client locally makes bitrate-adaptation decisions. To address this, Pano decouples the bitrate adaptation into an offline phase and an online phase. The offline phase pre-computes the perceived quality estimates under a few carefully picked viewpoint movements, and then it sends them to the client at the beginning of a video. In the online phase, the client predicts the perceived quality by finding a similar viewpoint movement that has a pre-computed estimate.
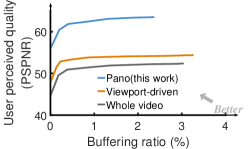
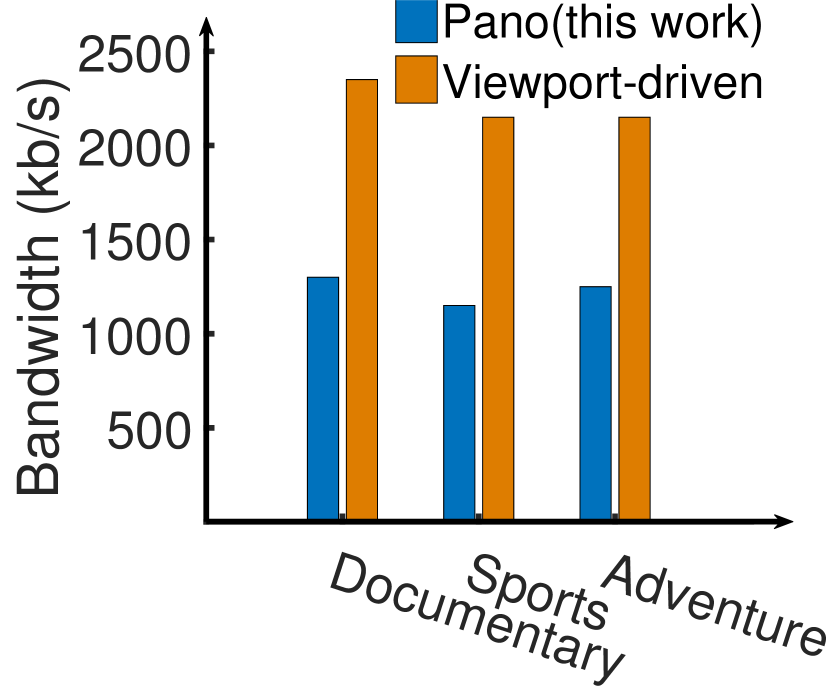
We implemented a prototype of Pano and evaluated it using a combination of user studies (20 participants, 7 videos) and trace-driven simulations (48 users, 18 videos). Across several content genres (e.g., sports, documentary), Pano can increase the mean opinion score (MOS) (MOS, [n. d.]) by 25-142% over a state-of-the-art solution without using more bandwidth. It can also save bandwidth usage by up to 46% or reduce buffering by 60-98% without any drop in perceived quality. Pano suggests a promising alternative to the popular viewport-driven approach (e.g., Figure 1), which could potentially close the gap of bandwidth consumption between 360° videos and traditional videos as we have hoped.
2. Motivation
We begin by setting up the background of 360° video streaming (§2.1). Then we introduce the quality-determining factors unique to 360° videos (§2.2), and analyze the potential improvement (§2.3) of leveraging these factors.
2.1. Background of 360° video streaming
There are already 36.9 million VR users in the US (over 10% of its population) (eMa, [n. d.]). By 2022, there will be 55 million active VR headsets in the US, as many as Netflix members in the US in 2018 (qz, [n. d.]). Many content providers (YouTube (Goo, [n. d.]), Facebook (fac, [n. d.]), Netflix (Net, [n. d.]), Vimeo (Vim, [n. d.]), Hulu (Hul, [n. d.]), iQIYI (iQi, [n. d.])) offer 360° video streaming services on various platforms (Yao et al., 2014; sam, [n. d.]; day, [n. d.]).
The proliferation of 360° videos is facilitated in part by the cheap and scalable delivery architecture. Like other Internet videos, 360° videos can be delivered to viewers through content delivery networks (CDNs). A 360° video is first converted to a planar video and encoded by a 360° encoder (e.g., (ffm, [n. d.])), which transcodes and chops the video into chunks (or segments); these video chunks are then sent to geo-distributed CDN servers; and finally, a client (VR headset or smartphone) streams the video chunks sequentially from a nearby CDN server using the standard HTTP(S) protocols (DAS, [n. d.]; hls, [n. d.]; WOW, [n. d.]). To cope with bandwidth fluctuations, each video segment is encoded in different quality levels, such as quantization parameters (QP), so that during playback the player can dynamically switch between quality levels at the boundary of two consecutive chunks, similar to traditional bitrate-adaptive streaming.
A distinctive feature of 360° video streaming is that the viewer’s attention is unevenly distributed, with more attention in the viewport area (which directly faces the user) than the rest of the video. In contrast, non-360° videos are displayed in a more confined area (e.g., a desktop screen), so the uneven distribution of attention is less obvious. The uneven distribution of attention has spurred a rich literature around the idea of viewport-driven streaming (e.g., (Gaddam et al., 2016; Graf et al., 2017; Xie and Zhang, 2017; Qian et al., 2018)) to improve 360° video quality. It spatially partitions a video into tiles (e.g., 6-by-12 grids) and encodes each tile in multiple quality levels, so the 360° video player can dynamically assign a higher quality level to tiles closer to the viewpoint (the center of a viewport). Unfortunately, viewport-driven streaming has two limitations. First, like traditional videos, each 360° video chunk must be prefetched before the user watches it, but viewport-driven streaming only fetches the viewport region in the hope that the fetched content matches the user’s viewport. So any viewpoint prediction error may negatively affect user experience. Second, to assign quality by the distance to the dynamic viewpoint, the video must be split into many fine-grained tiles (Qian et al., 2018) or encoded in multiple versions each customized for certain viewpoint trajectory (Zhou et al., 2018), but both methods could significantly increase the video size.
2.2. New quality-determining factors
A basic assumption underlying the prior efforts is that users perceive the quality of 360° videos (within the viewport) in the same way they perceive the quality of non-360° videos. This assumption limits the room for improving the performance of streaming 360° videos. In other words, since the viewport appears larger than a desktop screen to the user, it still takes more bandwidth to stream a 360° video than a traditional screen-size video.
In contrast, our key insight is that the user-perceived quality of 360° videos is uniquely affected by users’ viewpoint movements. Here, we explain three quality-determining factors that are induced by a user’s viewpoint movements (readers may refer to §4 for more analysis of their impacts on quality perception).
-
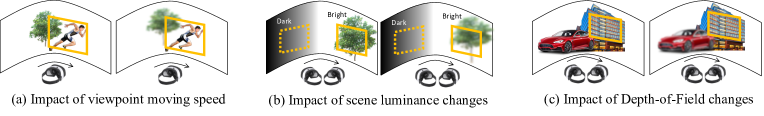
Factor #1: Relative viewpoint-moving speed. In general, the faster the user’s viewpoint moves, the less sensitive the user is to quality distortion. Figure 2(a) illustrates how this observation could help save bandwidth: when the user moves her viewpoint, reducing the quality level of the static background will have little impact on user-perceived quality. Of course, the moving objects being tracked by the viewpoint will now appear static to the user, so its quality degradation has a negative impact on the perceived quality. This idea is particularly relevant to sports videos, where the viewpoint often moves with fast-moving objects.
-
Factor #2: Change in scene luminance. As a user moves her view around, the viewed region may switch between different levels of luminance; when the content changes from dark to bright (and vice versa), users tend to be less sensitive to quality distortion in a short period of time (typically 5 seconds (Normann and Werblin, 1974; Pugh, 1975)). Figure 2(b) illustrates a simple example of how one can carefully lower the quality level of part of the video without causing any drop in the user-perceived quality. Luminance changes are prevalent in urban night scenes, where the viewpoint may switch frequently between different levels of brightness.
-
Factor #3: Difference in depth-of-field (DoF). In 360° videos, users are more sensitive to quality distortion of a region whose DoF333360° displays can simulate DoF by projecting an object to two eyes with a specific binocular parallax (disparity) (Carnegie and Rhee, 2015; Hoffman et al., 2008). is closer to that of the viewpoint. So, users may have different sensitivities to the quality of the same region, depending on the DoF of the current viewpoint. As illustrated in Figure 2(c), one can save bandwidth by dynamically tracking the DoF of the viewpoint and reducing the quality level of objects that have great difference in DoFs to the viewpoint. DoF adaptation tends to benefit outdoor videos where the viewpoint may switch between foreground objects (low DoF) and scenic views (high DoF).
Intuitive explanation: The key to understanding these opportunities is that each user has a limited span of attention. Although the video size grows dramatically to create an immersive experience, a user’s span of attention remains largely constant. As a result, a user often gives less attention to the specifics of a 360° video, which in turn reduces her sensitivity to quality distortion.
What is new about them? Although prior work (e.g., (Shimizu et al., 2007; Li et al., 2014; Hadizadeh and Bajić, 2013; Lee and Ebrahimi, 2012)) also improves video encoding and streaming by leveraging the video perceptual features (e.g., luminance and salient objects) and intrinsic dynamics (e.g., fast changing content), it is always assumed that these factors are determined by the video content, not users’ viewpoint movements. In contrast, we seek to take into account the object movements, luminance changes, and DoF differences, all caused by users’ viewpoint movements, so our approach can be viewed complementary to this body of prior work. For instance, static objects may appear as fast moving objects to a 360° video user (thus can tolerate low quality), if the user moves the viewport rapidly. Similarly, fast moving objects will appear static to the user (thus requiring high quality), if her viewpoint moves with the object.
2.3. Potential gains
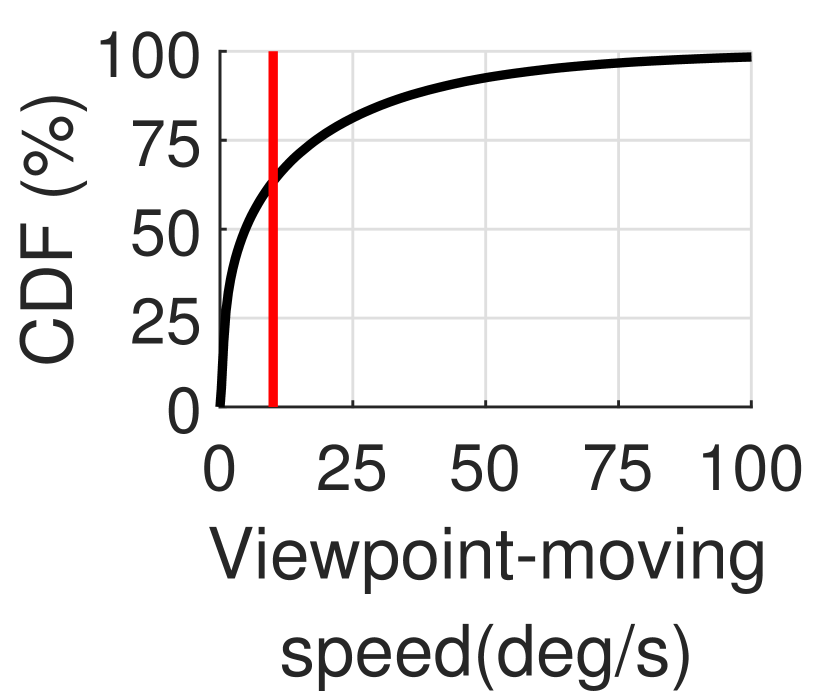
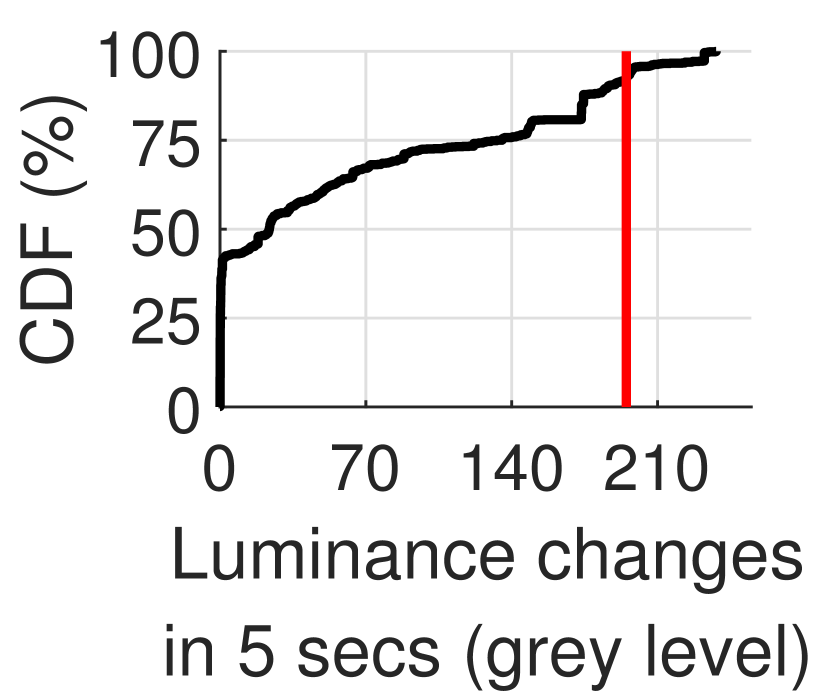
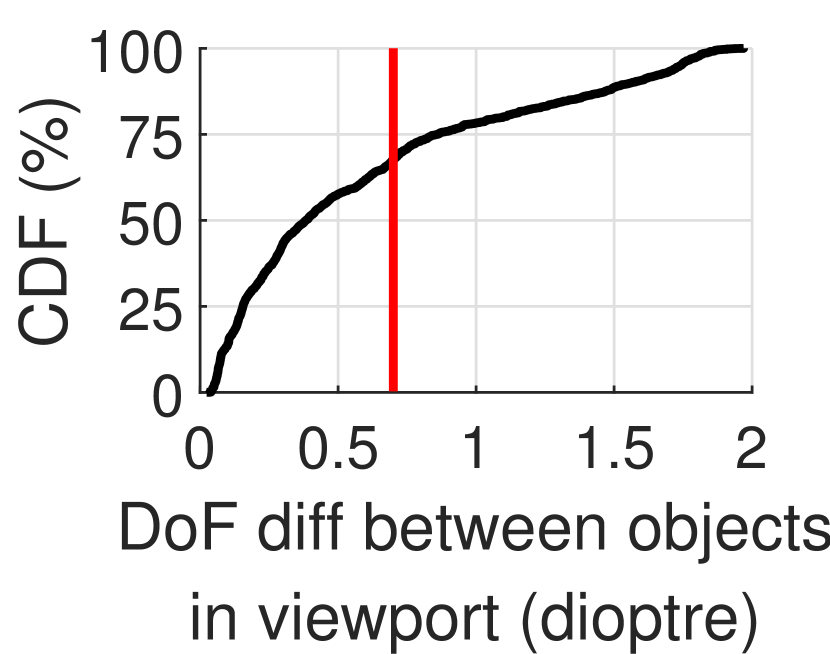
Next, we use real viewpoint traces to demonstrate the potential benefits of these quality-determining factors. The traces (VRd, [n. d.]) consist of 864 distinct viewpoint trajectories (18 360° videos each watched by 48 users (viv, [n. d.]), see Table 2 for a summary). We measure viewpoint-moving speed in degrees per second (deg/s), luminance in gray level (Safranek and Johnston, 1989; Chou and Li, 1995), and DoF in dioptres (Carnegie and Rhee, 2015; Hoffman et al., 2008).
Figure 3 shows the distribution of viewpoint-moving speeds, the distribution of maximum luminance changes in different 5-second time windows, and the distribution of maximum DoF differences between two regions in one frame. To see how these values impact users’ sensitivities to quality distortion, we measure how often these values exceed some thresholds so that users can tolerate 50% more quality distortion than they would have if the viewpoint was static. Based on our empirical user study in §4.2, such threshold of viewpoint-moving speed is 10 deg/s, that of luminance change is 200 gray level, and that of DoF difference is 0.7 diopters.
We can see that all three factors exceed their thresholds for 5-40% of time. In other words, for instance, for 40% of time the viewpoint moves over 10 deg/sec, which means during that time, the users can tolerate 50% more quality distortion on background pixels than they would have if the video is viewed on a computer screen. It should be noticed that the viewpoint movements appear to be dynamic, in part because the dataset includes many outdoor sports and adventure videos.
3. Pano overview
Exploring the aforementioned opportunities, however, requires not only changing the objective of video quality optimization, but also re-architecting several critical components of the video streaming system. We present Pano, a 360° video streaming system that addresses three key challenges.
Challenge 1: How to predict 360° video user-perceived quality by incorporating these new quality-determining factors? To our best knowledge, none of the existing video quality metrics directly captures the three new factors, so we first need to augment the existing video quality metrics to measure different user sensitivities under different viewpoint trajectories.
Our solution: Pano presents a novel 360° video quality metric (§4) that models the users’ sensitivities to quality distortion as a function of viewpoint-moving speed, luminance change, and DoF difference. A naive approach would profile all possible combinations of these values and each video. Fortunately, we show that we can decouple the impact of these factors driven by viewpoint movements from the impact of the video content. Moreover, we found that the impact of individual factors is largely mutually independent, which further reduces the efforts to build the new 360° video quality metric.
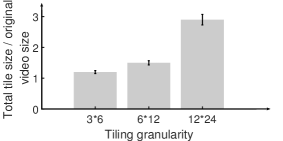
Challenge 2: How should the 360° videos be spatially split into tiles to better exploit the new opportunities? Ideally, the tiling should separate regions with different object-moving speeds (e.g., foreground moving objects vs. static background), different DoF, or different luminance values. But naively splitting the video into small tiles (e.g., 1224) will increase the video size by almost 200% compared to a coarser 36-grid tiling (Figure 4).
Our solution: Pano splits it into a handful of variable-size tiles (§5), rather than equally sized tiles (see Figure 9 for an example). As a result, users tend to have similar sensitivities to quality distortion within each tile (according to history trajectories traces). In this way, we can maintain a coarse tiling granularity to save bandwidth while still being able to assign higher quality where users are more sensitive.
Challenge 3: How to adapt quality in a way that is robust to dynamic viewport movements and readily deployable over the existing delivery infrastructure? The video quality adaptation strategy needs to be revisited for two reasons. First, it must tolerate the vagaries of available bandwidth and the inevitable errors of viewpoint movement prediction. Second, it must be deployable on the existing client-driven video streaming protocol (DAS, [n. d.]), but if done naively, one would need both client-side information (current viewpoint movement) and server-side information (video content) to determine the sensitivity of a user to quality distortion.
Our solution: Our empirical study shows that to pick the desirable quality for each tile, it is sufficient to estimate a range of the viewpoint movement, rather than their precise values (§6.1). For example, if the viewpoint moves quickly in a short time, it will be difficult to predict the exact relative viewpoint-moving speed, but Pano can still reliably estimate a lower bound of the speed based on recent history. Although Pano may lose some performance gains (e.g., assigning a higher-than-necessary quality given underestimated relative viewpoint-moving speeds), the conservative decisions still outperform the baselines which ignore the impact of viewpoint movements. Finally, to be compatible with the existing client-driven video streaming architecture, Pano encodes a look-up table in the video manifest file so that the client can approximately estimate the perceived quality of each quality level without accessing the actual video content (§6.2).
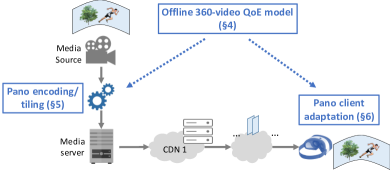
As shown in Figure 5, although a video delivery system involves many comments, deploying Pano only requires minor changes by the content provider (who controls the video encoding) and client-side device (usually also managed by the same content provider). No change is needed to the CDNs or the HTTP streaming protocol.
4. Pano: 360° video quality model
We start with Pano’s video quality model, which estimates the user-perceived quality under certain viewpoint movement.
4.1. A general video quality framework
Conceptually, Pano incorporates the new quality-determining factors in Peak Signal-to-Perceptible-Noise Ratio (PSPNR) (Chou and Li, 1995), a standard perceived quality metric. It improves the classic Peak Signal-to-Noise Ratio (PSNR) (Zhao et al., 2011) by filtering out quality distortions that are imperceptible by users. The key to PSPNR is the notion of Just-Noticeable Difference (JND) (Zhao et al., 2011), which is defined by the minimal changes in pixel values that can be noticed by viewers. PSPNR can be expressed as follows (Table 1 summarizes the terminology):
| (1) |
| (2) |
| (3) |
where denotes the image size, and denote the pixel at of the original image and that of the image encoded at quality level respectively, and denotes the JND at pixel .
Intuitively, a change on a pixel value can affect the user-perceived quality (PSPNR) only if it is greater than the JND. In other words, the notion of JND effectively provides an abstraction of users’ sensitivities to quality distortion, which can be neatly incorporated in the quality metric of PSPNR.
More importantly, we can incorporate the new quality-determining factors (§2.2) by changing the calculation of JND—higher relative viewpoint moving speeds, greater DoF differences, or greater luminance changes will lead to higher JND.
| Term | Brief description | ||
|---|---|---|---|
| Quality level, chunk index, and tile index | |||
| The bitrate of the tile the chunk at quality | |||
| Pixel value at on the original or encoded image | |||
| , | PSPNR (or PMSE (Chou and Li, 1995)) of image at quality level | ||
| JND at pixel | |||
|
|||
|
4.2. Profiling JND of 360° videos
JND has been studied in the context of non-360° videos. However, prior work has focused on the impact of video content on JND. For instance, users tend to be less sensitive to quality distortion (i.e., high JND) in areas of high texture complexity or excessively high/low luminance (Chou and Li, 1995; Chen and Guillemot, 2009; Safranek and Johnston, 1989).
As we have seen, however, 360° videos are different, in that a user’s sensitivity may vary with the viewpoint movement as well. In other words, the JND of a pixel is also dependent on the following values: (1) the speed of an object (of which pixel is a part) relative to the viewpoint; (2) the luminance of relative to where the viewpoint focused on 5 seconds ago; (3) the DoF difference between and the viewpoint focused object; and (4) the base JND , defined by the JND when there is no viewpoint movement (i.e., ) or DoF difference (). Because is only dependent on the video content, we refer to it as the content-dependent JND. We calculate using the same JND formulation from the prior work (Chou and Li, 1995; Chen and Guillemot, 2009).
To quantify the impact of on JND, we ran a user study using a similar methodology to the prior studies (Chen and Guillemot, 2009; Chou and Li, 1995). Readers can find more details of our methodology in Appendix. The study has 20 participants. Each participant is asked to watch a set of 43 short test videos, each generated with a specific level of quality distortion. The quality distortion is gradually increased until the participant reports that the distortion becomes noticeable.
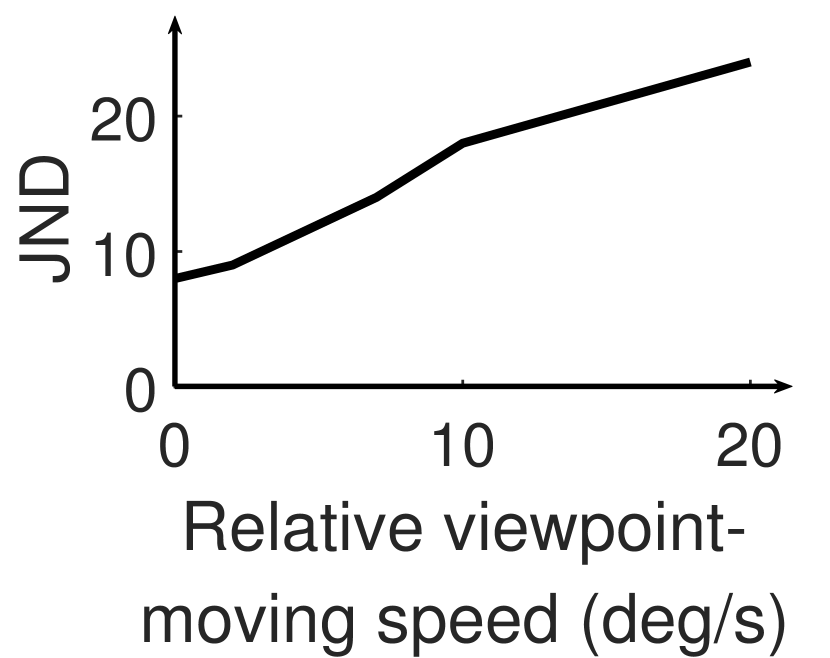
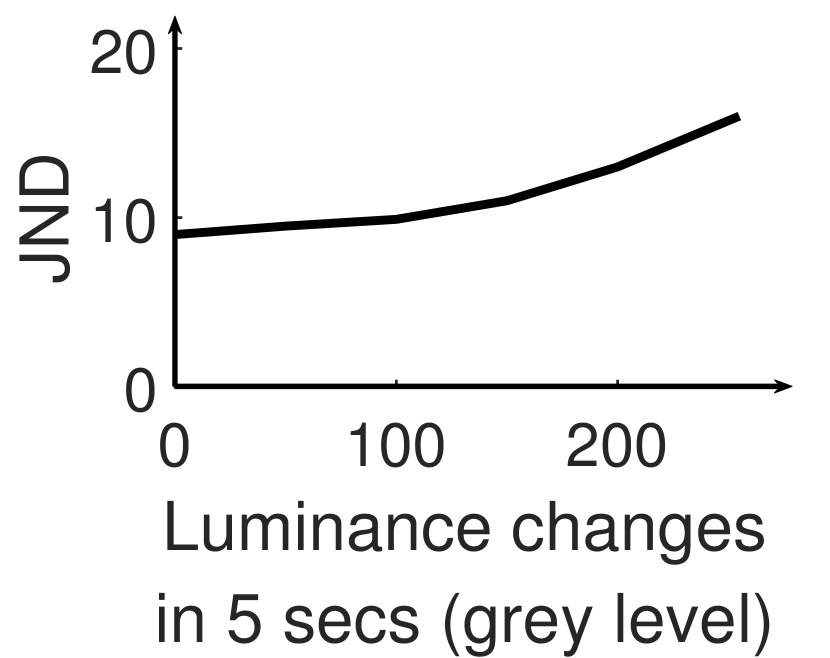
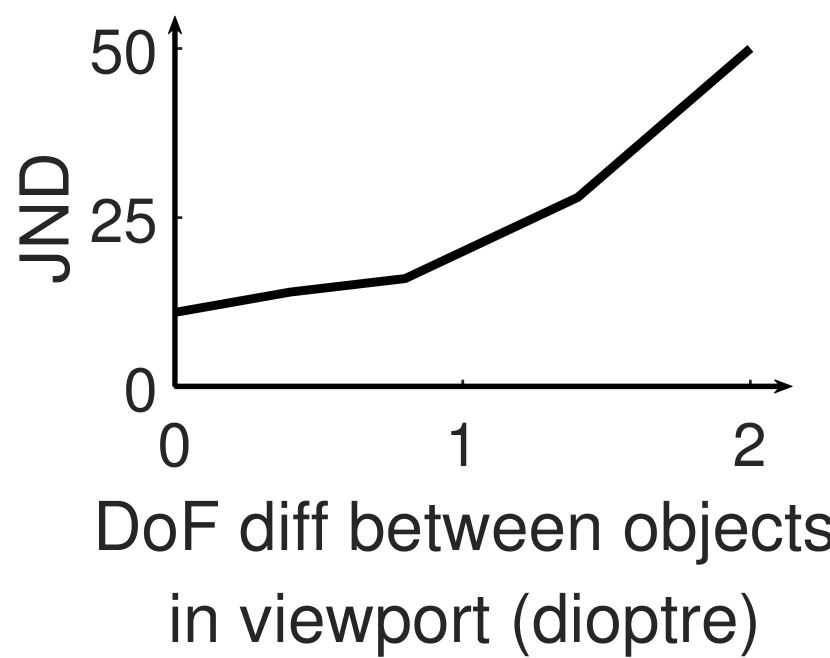
Impact of individual factors: Figure 6 shows how JND changes with the relative viewpoint-moving speed, luminance change, or DoF difference, while the other two factors are kept to zero. As expected, JND increases (i.e., users become less sensitive to quality distortion) monotonically with higher relative viewpoint-moving speeds, greater luminance changes, or sharper DoF differences. Formally, we use ( or ) to denote the ratio between the JND when ( or ) and the JND when ( or ), while holding the other two factors at zero. We call , , and the viewpoint-speed multiplier, the luminance-change multiplier, and the DoF-difference multiplier, respectively.
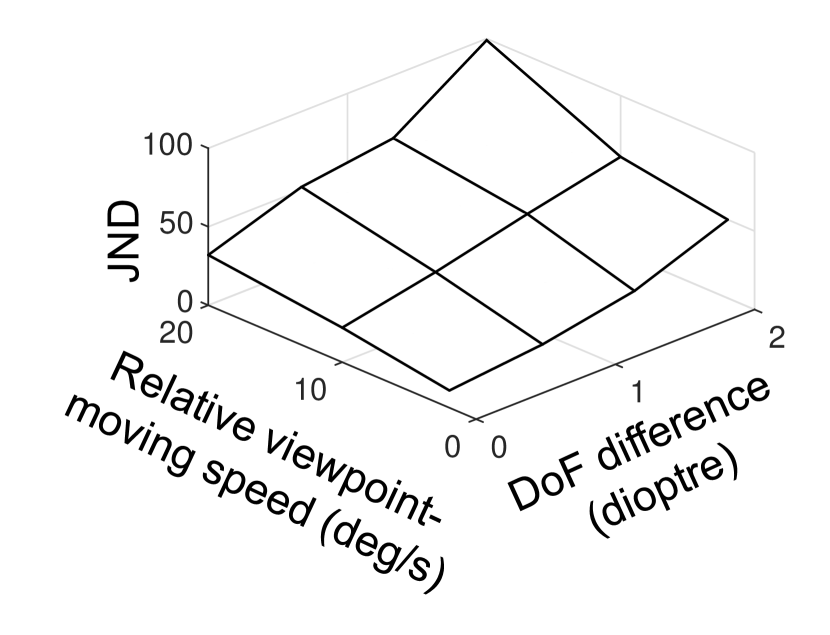
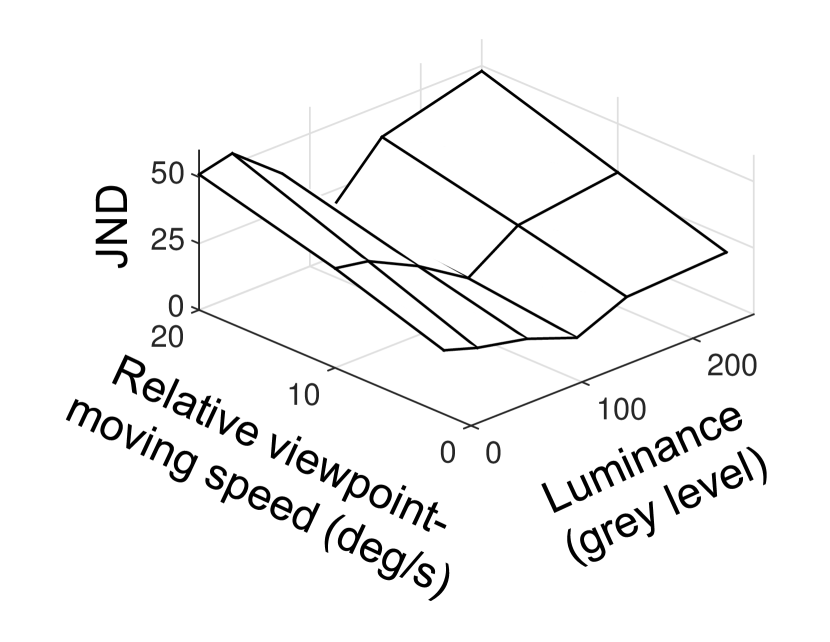
Impact of multiple factors: Figure 7 shows the joint impact of two factors on JND. In Figure 7(a), we notice that JND under viewpoint-moving speed and DoF difference can be approximated by the product of , where is the content-dependent JND (i.e., when ). This suggests the impact of these two factors on JND in this test appears to be independent. We see similar statistical independence between the impact of luminance change and that of viewpoint-moving speed or DoF difference. Figure 7(b) shows the joint impact of viewpoint-moving speed (one of the 360° video-specific factors) and the viewpoint’s current luminance value (one of the traditional factors that affect JND). The figure also shows the impact of these two factors on JND in this test appears to be independent. Notice that the impact of current luminance value on JND is non-monotonic because quality distortion tends to be less perceptible when the video is too bright or too dark.
The observation that different 360° video-specific factors appear to have independent impact on JND is well aligned with previous findings that other factors (e.g., content luminance, distance-to-viewpoint) have largely independent impact on JND (Chen and Guillemot, 2009; Chou and Li, 1995; Zhao et al., 2011).
(a) JND vs. viewpoint-moving
speed & DoF difference
(b) JND vs. viewpoint-moving
speed & luminance
Putting it together: Now, we define a new way of calculating JND for 360° videos, called 360JND, as follows:
| (4) |
In other words, 360JND is the product of the content-dependent JND, and the action-dependent ratio , which is the product of the viewpoint-speed multiplier, luminance-change multiplier, and DoF-difference multiplier. As we will see in §6.2, this separation has a great implication that the content-dependent JND can be pre-calculated, whereas the action-dependent ratio can be determined only in realtime, without the help from the server.
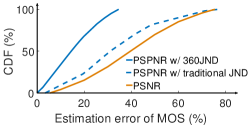
Validation of usefulness: To verify the usefulness of the new 360JND model, we plug the 360JND in the PSPNR calculation in Equation 1-3, and then check how well the resulting PSPNR value correlates with the actual user rating (MOS) from 20 participants over 21 360° videos. (See §8.1 for more details on how user rating is recorded.) For each video, we calculate the average 360JND-based PSPNR across users as well as the MOS. Then, we build a linear predictor that estimates MOS based on average PSPNR. As reference points, we similarly build a linear predictor using traditional JND-based PSPNR and a predictor using PSNR (JND-agnostic). Figure 8 shows the distribution of relative estimation errors of the three predictors (). We see that 360JND-based PSPNR can predict MOS much more accurately than the alternatives, which suggests the three 360° video-specific factors have a strong influence on 360° video perceived quality.
5. Pano: Video tiling
Next, we describe Pano’s tiling scheme, which leverages the quality metric introduced in §4. Like other DASH-based videos, Pano first chops a 360° video into chunks of equal length (e.g., one second), and then spatially splits each chunk into tiles by the following steps (as illustrated in Figure 9).
Step 1: Chunking and fine-grained tiling. Pano begins by splitting each chunk into fine-grained square-shape unit tiles with a 12-by-24 grid. Each unit tile is a video clip containing all content within the square-shape area in the chunk’s duration. These unit tiles are the building blocks which Pano then groups into coarser-grained tiles as follows.
Step 2: Calculating per-tile efficiency scores. Then Pano calculates an efficiency score for each unit tile, which is defined by how fast the tile’s quality grows with the quality level. Formally, the efficiency score of unit tile of chunk is
| (5) |
where is the PSPNR (perceived quality calculated by Equation 1) of the unit tile when it is encoded at quality level ; and (and ) denotes the lowest (and highest) quality level. There are two caveats. First, we assume the PSPNR of a unit tile is known. We will explain how to estimate them offline at the end of this section. Second, Equation 5 assumes that grows linearly with . This may not be true, but we found this assumption is a good approximation, and our solution does not crucially rely on it. We leave further refinements for future work.
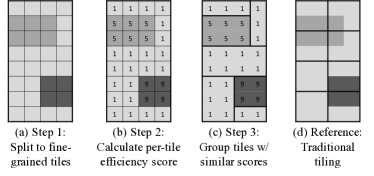
Step 3: Tile grouping. Finally, Pano groups the 1224 unit tiles into (by default, 30) variable-size coarse-grained rectangle tiles, which will eventually be used by Pano to encode the video. The goal of this grouping process is to reduce the variance of efficiency scores among the unit tiles in the same group (coarse-grained tile). More specifically, we try to minimize the weighted sum of these variances, where each variance is weighted by the area of the group. The intuition is that, because a higher/lower efficiency score means a tile will produce higher/lower PSPNR at the same quality level, the tiles with similar efficiency scores tend to be assigned with similar quality levels during playback, so grouping these unit tiles will have limited impact on quality adaptation. At the same time, having fewer tiles can significantly reduce the video size, as it avoids re-encoding the boundaries between small tiles.
Our grouping algorithm starts with one hypothetical rectangle that includes all 1224 unit tiles (i.e., the whole 360° video). It then uses a top-down process to enumerate many possible ways of partitioning this hypothetical rectangle into rectangles, each representing a coarse-grained tile. It begins by splitting this hypothetical rectangle into two rectangles along each possible vertical or horizontal boundary. Then it iteratively picks one of the existing rectangles that has more than one unit tile, and then similarly splits it, vertically or horizontally, into two rectangle tiles. This process runs repeatedly until there are rectangles (coarse-grained tiles). This process is similar to how the classic 2-D clustering algorithm (Agrawal et al., 1998) enumerates the possible partitions of a 2D space.
Calculating efficiency scores offline: We assume each video has some history viewpoint trajectories, like in (Zhou et al., 2018; Xie et al., 2018). For each tile, we compute the PSPNR under each history viewpoint trajectory, average the PSPNRs per tile across all trajectories, and derive the efficiency score per tile using Equation 5. The resulting PSPNR per tile takes both content information and viewpoint movements into account. Once the tiles are determined offline, Pano does not adjust them during playback, so the video does not need to be re-encoded. We acknowledge that computing PSPNR with the average history viewpoint movements might cause suboptimal quality for users with atypical viewing behaviors. That said, we found that the lowest perceived quality across the users in our traces is at most 10% worse than the mean quality (Figure 16(b)).
6. Pano: Quality adaptation
The design of Pano’s quality adaptation logic addresses two following questions. (1) How to adapt quality in the presence of noisy viewpoint estimates (§6.1)? And (2) how to be deployable on the existing DASH protocol (§6.2)?
6.1. Robust quality adaptation
Pano adapts quality at both the chunk level and the tile level. First, Pano uses MPC (Yin et al., 2015) to determine the bitrate of each chunk, to meet buffer length target under the predicted bandwidth. The chunk’s bitrate determines the total size of all tiles in the chunk.
Then, within the chunk , Pano determines the quality level of each tile ( is the number of tiles per chunk), to maximize the overall perceived quality (PSPNR) while maintaining total size of the tiles below the chunk’s bitrate . According to Equation 1, the overall PSPNR of the tiles is , where , and is the area size of tile . Since the total area of all tiles is constant, the tile-level quality allocation can be formulated as follows:
| min | /* Maximizing overall PSPNR */ | |||
| s.t. | /* Total tile size chunk bitrate */ |
To solve this optimization problem, we enumerate the possible assignment of 5 quality levels in each of the tiles, but instead of an exhaustive search (which has outcomes), Pano prunes the search space using the following observation. For any pair of tiles ( and ), if we found one quality assignment (e.g., assigning to and to ) is “strictly” better (i.e., producing higher PSPNR and smaller total tile size) than another assignment (e.g., assigning to and to ), then we can safely exclude the latter assignment when iterating the quality assignments of the remaining tiles.
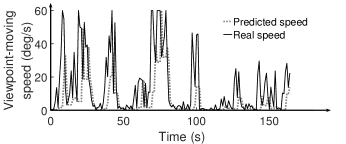
Coping with viewpoint estimation errors: In theory, optimal quality adaptation requires accurate PSPNR estimation, which relies heavily on accurate estimation of viewpoint-moving speeds, DoF differences, and luminance changes. In practice, however, we found that predicting an approximate range of these three factors is sufficient to inform optimal quality selection. The reason is two-fold. On one hand, if the head has little or slow movement (e.g., staring at an object), it is trivial to accurately predict the viewpoint-moving speed, DoF, and luminance. On the other hand, if the viewpoint moves arbitrarily, it is difficult to predict the exact viewpoint-moving speed, DoF, and luminance, but it is still plausible to estimate a lower bound for each factor using recent history. For instance, the lowest speed in the last two seconds serves a reliable conservative estimator of the speed in the next few seconds (Figure 10). Although these lower bounds would lead Pano to make conservative decisions (e.g., assigning a higher-than-necessary quality), these conservative decisions still bring sizable improvement over the baselines which completely ignore the impact of viewpoint-moving speed, DoF, and luminance.
6.2. DASH-compatible design
While the logical workflow of Pano is straightforward, it is incompatible with the popular DASH protocol (DAS, [n. d.]). This is because Pano’s quality adaptation is based on PSPNR (Equation 1), which requires both viewpoint movements (only available on the client) and the pixels of the video content (only available on the server). This, however, violates the key tenet of the popular DASH protocol that servers must be passive while clients adapt bitrate locally without aid of the server.
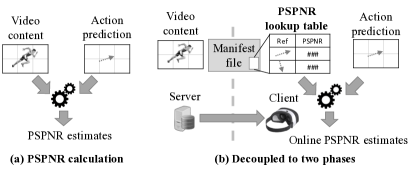
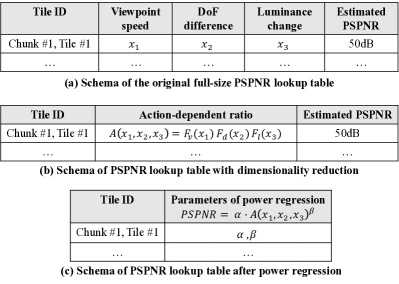
Fortunately, Pano can be implemented in a way that is compatible with the DASH protocol. The basic idea is to decouple the calculation of PSPNR into two phases (as illustrated in Figure 11). In the offline phase, the video provider pre-calculates the PSPNR for some “representative” viewpoint movements and stores them in a PSPNR lookup table. In particular, we choose representative values for each of the viewpoint speed, DoF difference and luminance change, which produces combinations and the corresponding PSPNR values in the lookup table. The PSPNR lookup table is sent to the client as part of the DASH manifest file at the beginning of a video. In the online phase, the client uses the PSPNR lookup table to estimate PSPNR under the actual viewpoint movement.
6.3. System optimization
Compressing PSPNR lookup table: A PSPNR lookup table (see Figure 12(a) for an example) includes, for each tile, the PSPNR estimates of every possible combination of viewpoint-moving speed, luminance change, and DoF difference. Without compression, the PSPNR lookup table can be 10 MB for a 5-minute video, which can significantly inflate the manifest file size. We address this problem by two techniques, which produce an approximate yet more compressed representation of the PSPNR lookup table. First, we reduce the PSPNR lookup table from “multi-dimensional” to “one-dimensional” (Figure 12(b)), by replacing the viewpoint speed, DoF, luminance with the products of their multipliers (defined in §4.2). Using their products, i.e., the action-dependent ratios (see Equation 4) to index the PSPNR lookup table, we can avoid enumerating a large number of combinations of viewpoint speed, DoF, and luminance. Second, instead of keeping a map between action-dependent ratios and their corresponding PSPNR of each tile, we found that their relationship in a given tile can be interpolated by a power function. Thus, we only need two parameters to encode the relationship between PSPNR and action-dependent ratio (Figure 12(c)). With these optimizations, we can compress the manifest file from 10 MB to 50 KB for a 5-minute video.
Reducing PSPNR computation overhead: Per-frame PSPNR calculation, in its original form (Equation 1), can be slower than encoding the same video. To reduce this overhead, we extract one frame from every ten frames and use its PSPNR as the PSPNR of other nine frames. This saves the PSPNR computation overhead by 90%, and we found this is as effective as per-frame PSPNR computation.
7. Implementation
Here, we describe the changes needed to deploy Pano in a DASH video delivery system. We implement a prototype of Pano with 15K lines of codes by C++, C#, Python, and Matlab (pan, [n. d.]).
Video provider: The video provider preprocesses a 360° video in three steps. First, we extract features from the video, such as object trajectories, content luminance, and DoF, which are needed to calculate the PSPNR of the video under each of history viewpoint movements. In particular, to detect the object trajectories, we use Yolo(Redmon and Farhadi, 2018) (a neural network-based multi-class object detector) to detect objects in the first frame of each second, and then use a tracking logic (Henriques et al., 2015) to identify the trajectory of each detected object in the remaining of the second. Then we temporally split the video into 1-second chunks, use the tiling algorithm described in §5 to spatially split each chunk into (by default, 30) tiles using FFmpeg CropFilter (ffm, [n. d.]), and encode each tile in QP levels (e.g., {22, 27, 32, 37, 42}). Finally, we augment the video’s manifest file with additional information. In particular, each tile includes the following information (other than available quality levels and their corresponding URLs): (1) the coordinate of the tile’s top-left pixel (this is needed since the tiles in Pano may not be aligned across chunks); (2) average luminance within the tile; (3) average DoF within the tile; (4) the trajectory of each visual object (one sample per 10 frames); and (5) the PSPNR lookup table (§6.3).
Video server: Like recent work on 360° videos (Qian et al., 2018), Pano does not need to change the DASH video server. It only needs to change the client-side player as described next.
Client-side adaptation: We built Pano client on a FFmpeg-based (ffm, [n. d.]) mockup implementation of the popular dash.js player (DAS, [n. d.]). To let the client use Pano’s quality adaptation logic, we make the following changes. First, the player downloads and parses the manifest file from the server. We change the player’s manifest file parser to extract information necessary for Pano’s quality adaptation. Second, we add the three new functionalities to the DASH bitrate adaption logic. The viewpoint estimator predicts viewpoint location in the next 1-3 seconds, using a simple linear regression over the recent history viewpoint locations (Qian et al., 2018, 2016). Then the client-side PSPNR estimator compares the predicted viewpoint movements with the information of the tile where the predicted viewpoint resides (extracted from the manifest file) to calculate the relative viewpoint speed, the luminance change, and the DoF difference. These factors are then converted to the PSPNR of each tile in the next chunk using the PSPNR lookup table (§6.2). Finally, after the DASH bitrate adaptation algorithm (Yin et al., 2015) decides the bitrate of a chunk, the tile-level bitrate allocation logic assigns quality levels to its tiles using the logic described in §6.1.
Client-side streaming: We fetch the tiles of each chunk as separate HTTP objects (over a persistent HTTP connection), then decode these tiles in parallel into separate in-memory YUV-format objects using FFmpeg, and finally stitch them together into a panoramic frame using in-memory copy. We use the coordinates of each tile (saved in the manifest file) to decide its location in the panoramic frame. As an optimization, the copying of tiles into a panoramic frame can be made efficient if the per-tile YUV matrices are copied in a row-major manner (i.e., which is aligned with how matrices are laid out in memory), using the compiler-optimized memcpy. As a result, the latency of stitching one panoramic frame is 1ms.
8. Evaluation
We evaluate Pano using both a survey-based user study and trace-driven simulation. Our key findings are the following.
-
Compared to the state-of-the-art solutions, Pano improves perceived quality without using more bandwidth: 25%-142% higher mean opinion score (MOS) or 10% higher PSPNR with the same or less buffering across a variety of 360° video genres.
-
Pano achieves substantial improvement even in the presence of viewpoint/bandwidth prediction errors.
-
Pano imposes minimal additional systems overhead and reduces the resource consumption on the client and the server.
8.1. Methodology
Dataset: We use 360° videos (7 genres and minutes in total). Among them, videos (also used in §2.3) have actual user viewpoint trajectories from a set of 48 users (age between 20 and 26). Each viewpoint trajectory trace is recorded on an HTC Vive (viv, [n. d.]) device. The viewpoints are refreshed every 0.05s, which is typical to other mainstream VR devices (iQi, [n. d.]; You, [n. d.]; viv, [n. d.]). Each video is encoded into quality levels (QP=) and 1-second chunks using the x264 codec (X26, [n. d.]). Table 2 gives a summary of our dataset.
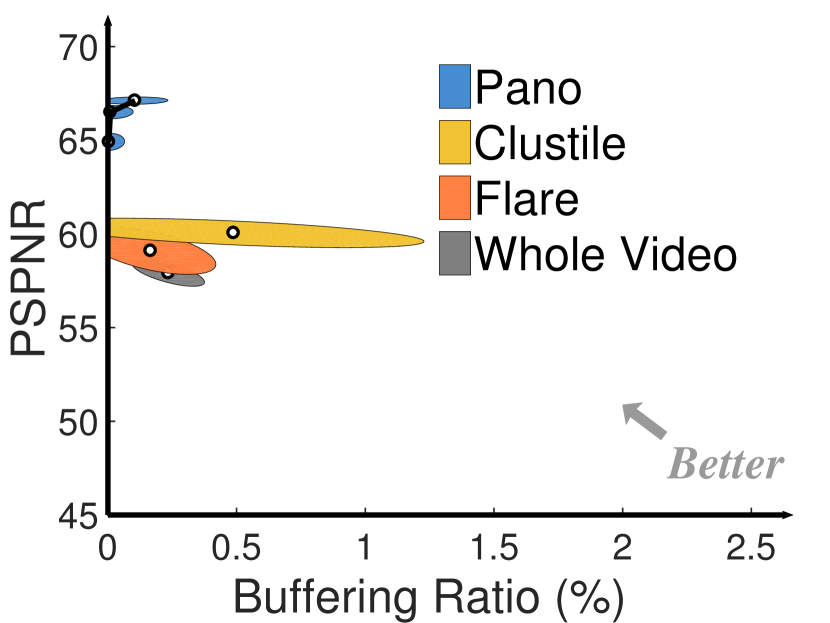
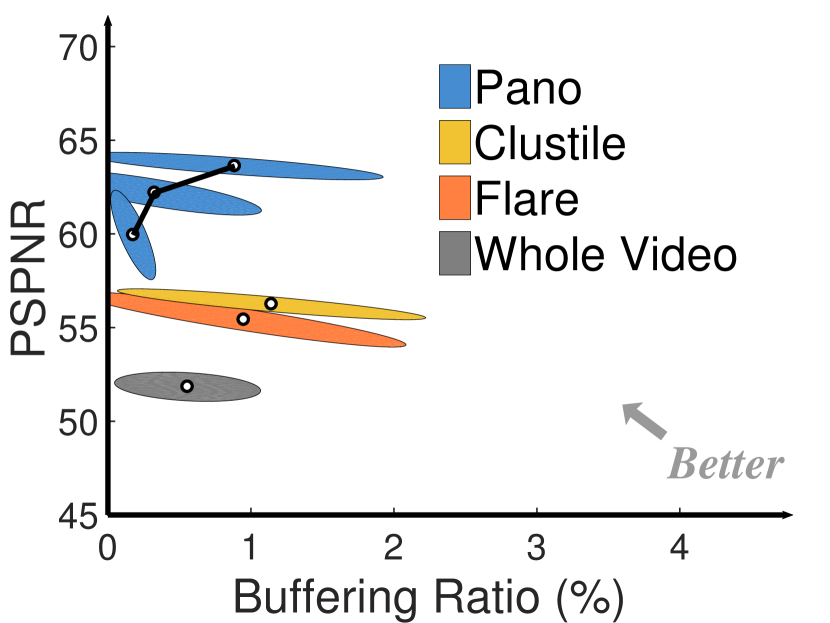
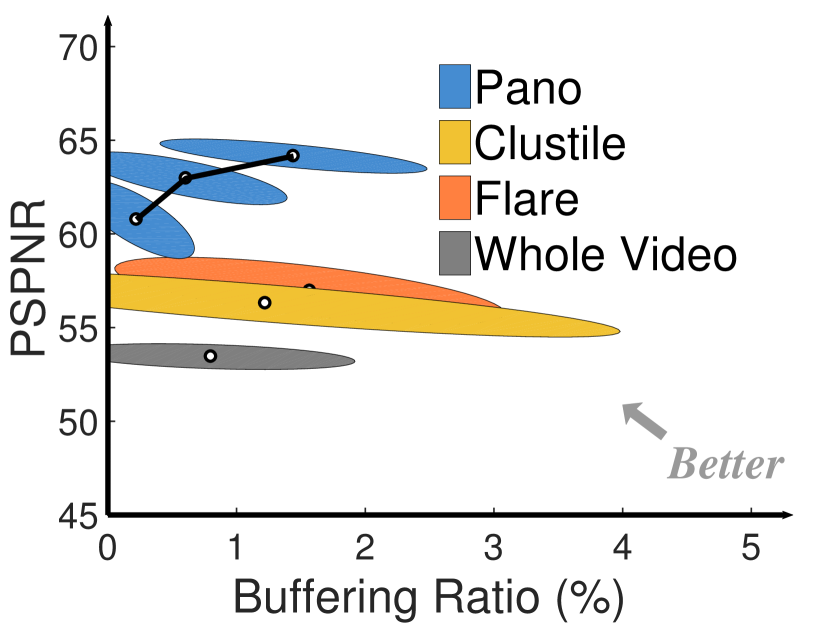
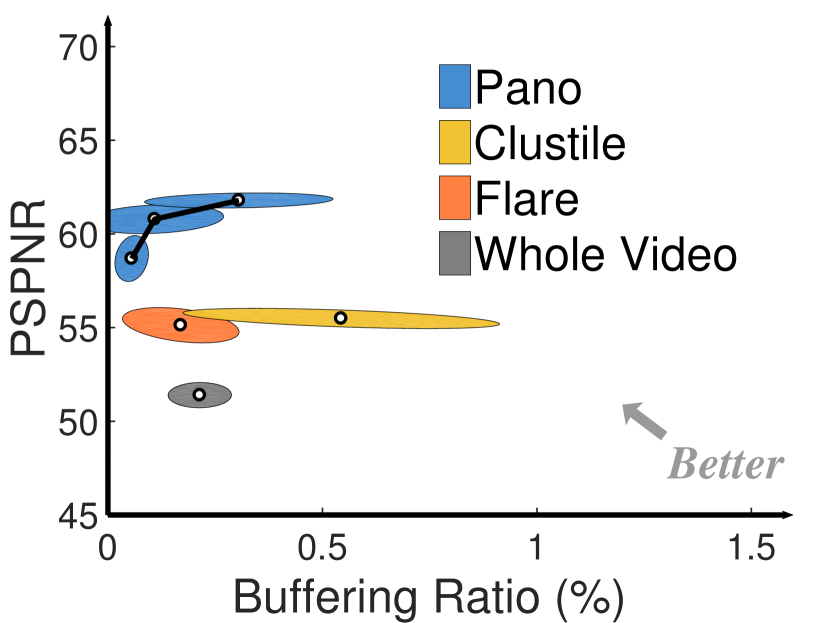
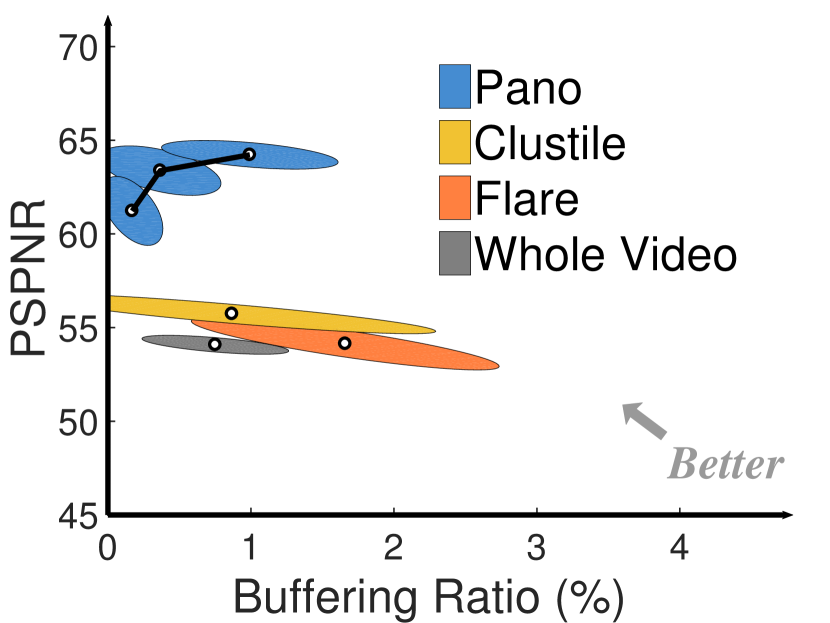
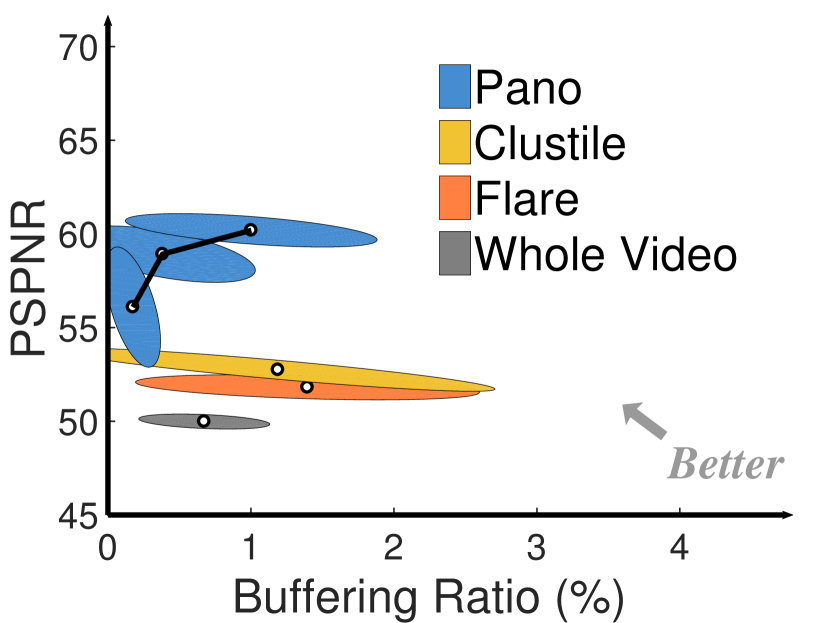
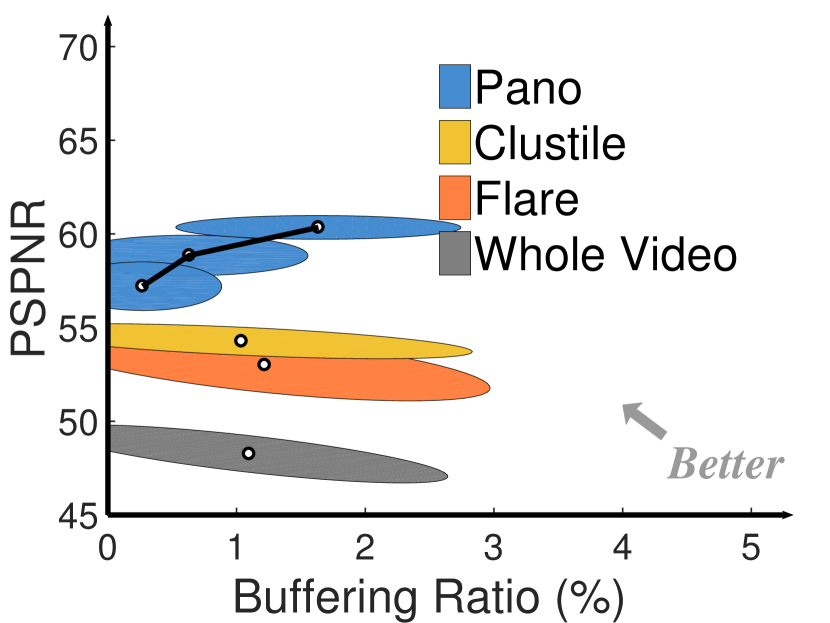
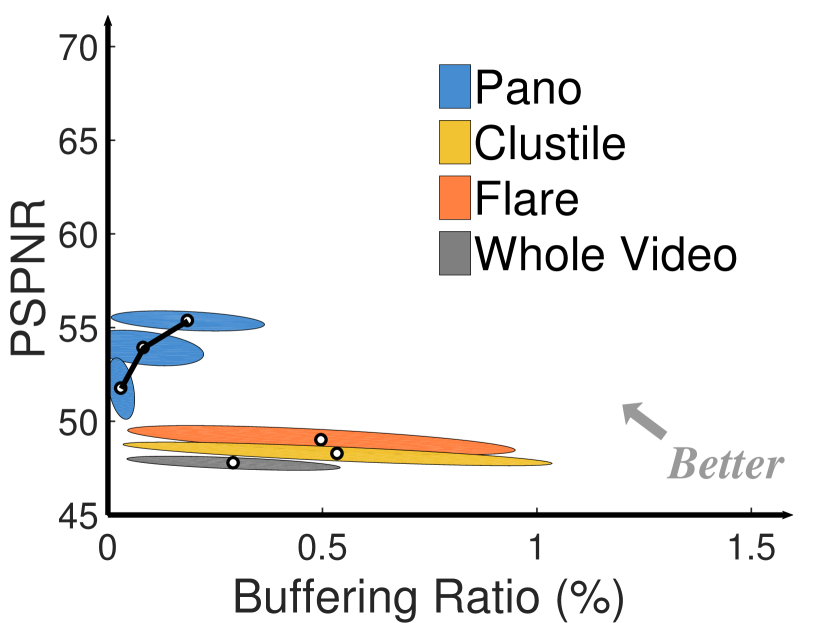
Baselines: We compare Pano with two recent proposals, Flare (Qian et al., 2018) and ClusTile (Zhou et al., 2018). They are both viewport-driven, but they prioritize the quality within the viewport in different ways. Flare uses the viewport location to spatially allocate different quality to the uniform-size tiles, whereas ClusTile uses the viewport to determine the tile shapes. Conceptually, Pano combines their strengths by extending both tiling and quality allocation using the new 360° video quality model. As a reference point, we also consider the baseline that streams the whole video in its 360° view. For a fair comparison, all baselines and Pano use the same logic for viewpoint prediction (linear regression) and chunk-level bitrate adaptation (Yin et al., 2015).
| Total # videos | 50 (18 with viewpoint traces of 48 users) | ||
|---|---|---|---|
| Total length (s) | 12000 | ||
| Full resolution | 2880 x 1440 | ||
| Frame rate | 30 | ||
| Genres (%) |
|
| PSPNR (360JND-based) | 46-53 | 54-61 | 62-69 | ||
| MOS | 1 | 2 | 3 | 4 | 5 |
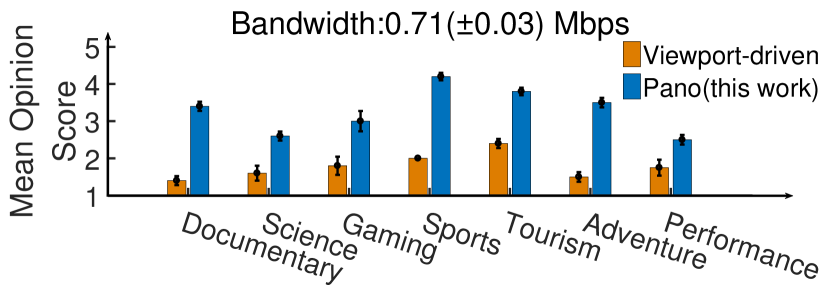
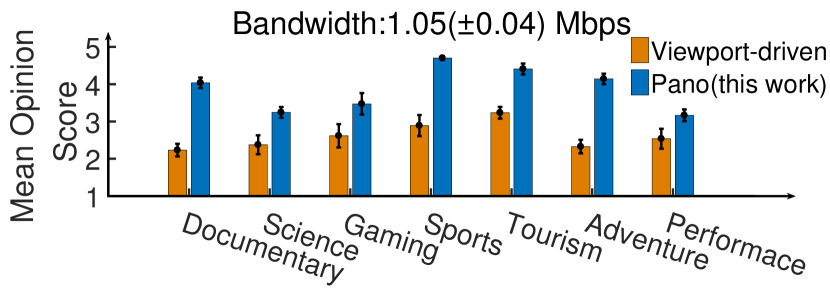
Survey-based evaluation: We run a survey-based evaluation on 20 participants. Each participant is asked to watch 7 videos of different genres, each played in 4 versions: 2 methods (Pano and Flare) and 2 bandwidth conditions (explained in next paragraph). In total, each participant watches 28 videos, in a random order. After watching each video, the participant is asked to rate their experience on the scale of 1 to 5 (MOS, [n. d.]).444 We acknowledge that by showing a participant four versions of the same video, the participants may tend to scale their rates on the same video from the lowest to the highest. While we cannot entirely prevent it, we try to mitigate this potential bias by displaying the 28 videos in a random order, so the different versions of the same video are rarely displayed one after another, which reduces the chance that a participant scales his/her rating in a certain way. For each video, we randomly pick a viewpoint trajectory from the 48 real traces and record the video as if the user’s viewpoint moves along the picked trajectory with the quality level picked by Pano or the baseline. That means Pano can still use its viewpoint prediction to adapt quality over time. The participants watch these recorded videos on an Oculus headset (Yao et al., 2014) (which generates real DoF and luminance changes). They are advised not to move their viewpoints. Admittedly, this does not provide the exact same experience as the users freely moving their viewpoints. However, since each video is generated with real dynamic viewpoint trajectories, the experience of the users would be the same if they moved their viewpoints along the recorded trajectory. Additionally, this method ensures the participants rate the same videos and viewpoint trajectories across different streaming systems and bandwidth conditions.
Network throughput traces: To emulate realistic network conditions, we use two throughput traces (with average throughput at 0.71Mbps and 1.05Mbps, respectively) collected from a public 4G/LTE operator (net, [n. d.]). We pick these two throughput traces, because they are high enough to allow Pano and the baselines to use high quality where users are sensitive (e.g., areas with low JND), but not too high that all tiles can be streamed in the highest quality.

(a) Pano
(b) Viewport-driven
(a) Sports, Trace #1
(b) Tourism, Trace #1
(c) Documentary, Trace #1
(d) Performance, Trace #1
(e) Sports, Trace #2
(f) Tourism, Trace #2
(g) Documentary, Trace #2
(h) Performance, Trace #2
Quality metrics: We evaluate the video quality along two metrics that have been shown to be critical to user experience: PSPNR, and buffering ratio. We have seen PSPNR has a stronger correlation with 360° video user rating than alternative indices (Figure 8). Table 3 maps the PSPNR ranges to corresponding MOS values. We define buffering ratio by the fraction of time the user’s actual viewport is not completely downloaded.
8.2. End-to-end quality improvement
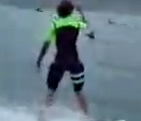
Survey-based evaluation: Figure 13 compares the MOS of Pano and the viewport-driven baseline (Flare) on the seven 360° videos. Pano and the baseline use almost the same amount of bandwidth (0.71Mbps or 1.05Mbps). We see that Pano receives a much higher user rating, with 25-142% improvement. Figure 14 shows the same snapshot under the two methods. The viewport-driven baseline gives equally low quality to both the moving object (skier) and the background of the viewport (not shown). In contrast, Pano detects the user is tracking the skier and assigns higher quality in and around the skier while giving lower quality to the static background (which appears to move quickly to the user).
Trace-driven simulation: Figure 15 compares Pano with the three baselines on 18 videos across four content genres and over two network traces. Across all combinations, Pano achieves higher PSPNR (user perceived quality), lower buffering ratio, or both. We also see that Pano has more improvement in some videos than others. This is due largely to the different levels of viewpoint dynamics across the videos. More dynamic viewpoint movements mean lowered sensitivities to quality distortion, thus more opportunities for Pano to reduce quality levels without hurting users’ perceived quality.
8.3. Robustness
Impact of viewpoint prediction noises: To stress test Pano under different viewpoint prediction errors, we create a noisier viewpoint trajectory from each real viewpoint trajectory in our trace, by adding a random shift to each actual viewpoint location. Specifically, we shift the original viewpoint location by a distance drawn uniformly randomly between 0 and degrees, in a random direction. By increasing , we effectively increase the viewpoint prediction errors. Figure 16(a) shows that more viewpoint noise () does reduce the PSPNR prediction accuracy, but the impact is not remarkable; a 40-degree noise only deviates the median PSPNR prediction by 7dB. This corroborates the intuition in §6.1 that Pano’s PSPNR prediction can tolerate a small amount of noise in viewpoint movement. Moreover, Figure 16(b) shows that the average perceived quality does drop with higher viewpoint prediction error, but the quality always has relatively small variance across users. This suggests that all users, including those whose viewpoint trajectories are very different from the majority, have similar perceived quality. Figure 16(c) shows that Pano consistently outperforms the baseline under an increasing level of viewpoint noise, although with diminishing improvements. Because subjective rating (MOS) is monotonically correlated with PSPNR (Table 3), we expect that Pano’s MOS would be similarly better than that of the baseline, despite the presence of viewpoint noises.
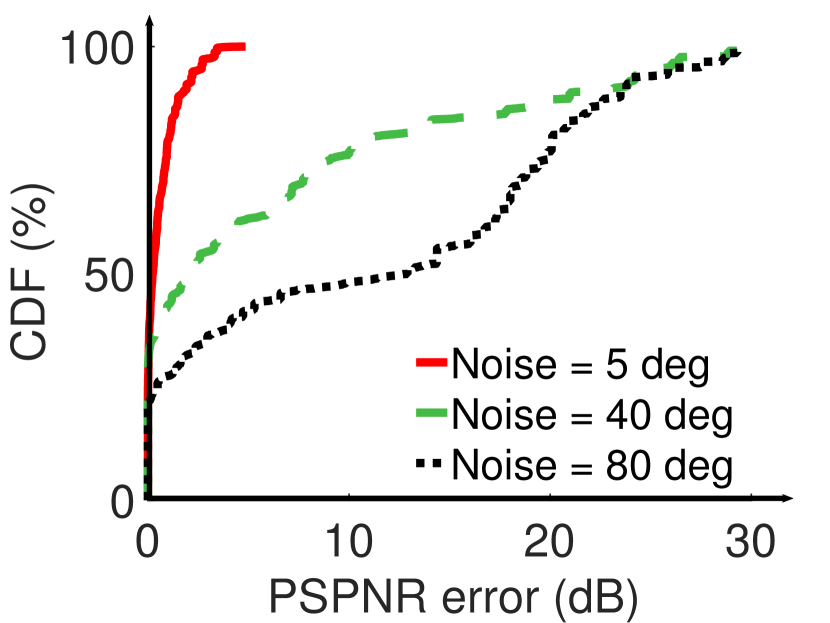
(a) PSPNR errors under noisy viewpoint prediction
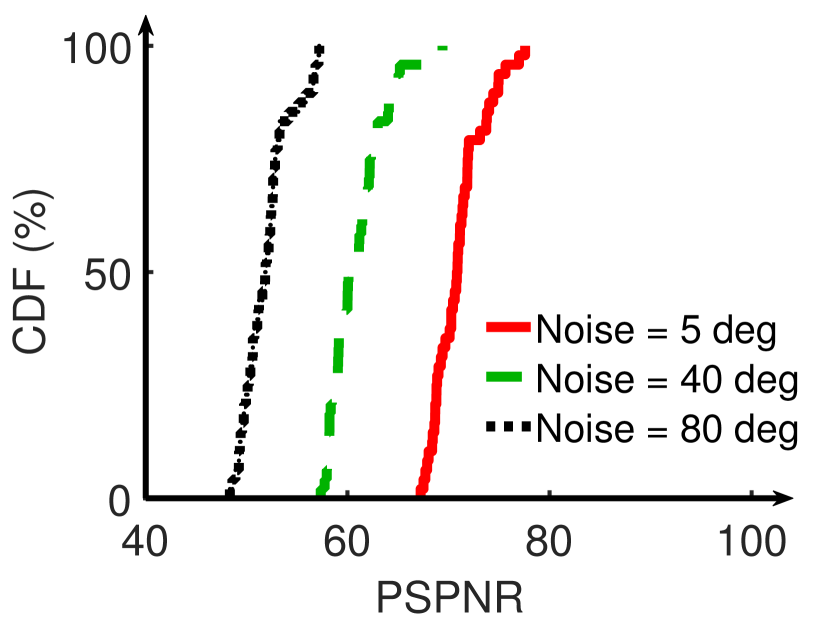
(b) Quality (PSPNR) distributions across users
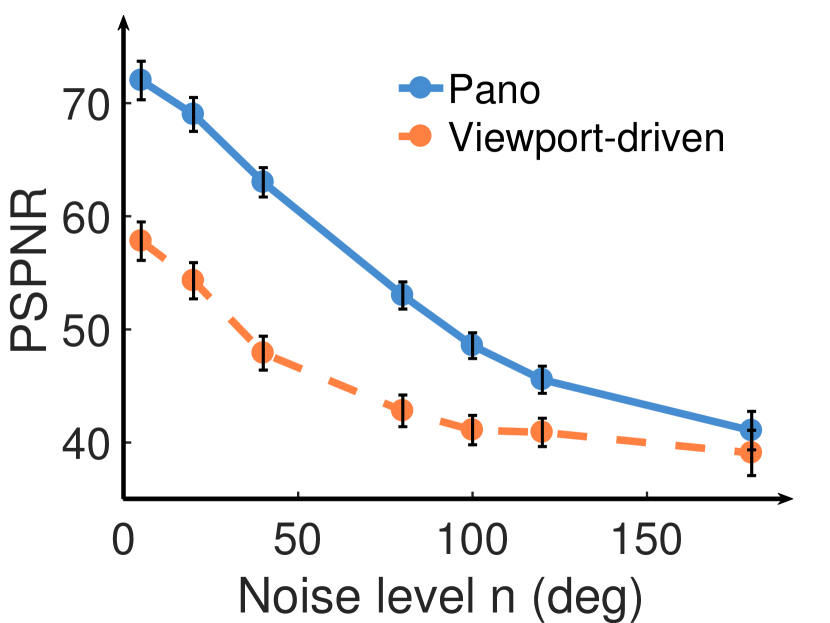
(c) Impact of viewpoint prediction errors on quality
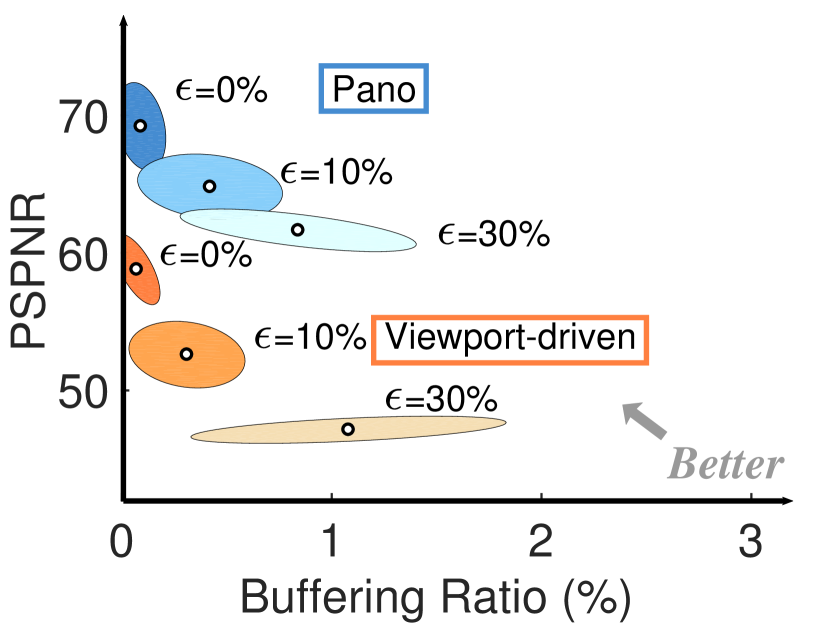
(d) Impact of bandwidth prediction errors on bandwidth-quality tradeoffs
Impact of throughput prediction errors: Figure 16(d) shows the performance of Pano (in PSPNR and buffering ratio) under different throughput prediction errors (a prediction error of 30% means the predicted throughput is always 30% higher or lower than the actual throughput). We can see that as the throughput prediction error increases, Pano’s quality degrades, but the degradation is similar to that of the viewport-driven baseline (Flare). This is because Pano consumes less bandwidth to provide the same perceived quality, which is robust when throughput drops down dramatically.
8.4. System overhead
Next, we examine the overheads of a 360° video streaming system, in computing overhead, video start-up delay, and server-side preprocessing delay. We use an Oculus headset (Qualcomm Snapdragon 821 CPU, 3GB RAM, Adreno 530 GPU) as the client, a Windows Server 2016-OS desktop of Intel Xeon E5-2620v4 CPU, 32GB RAM, Quadro M2000 GPU as the video provider, and a 5-minute sports video as the test video.
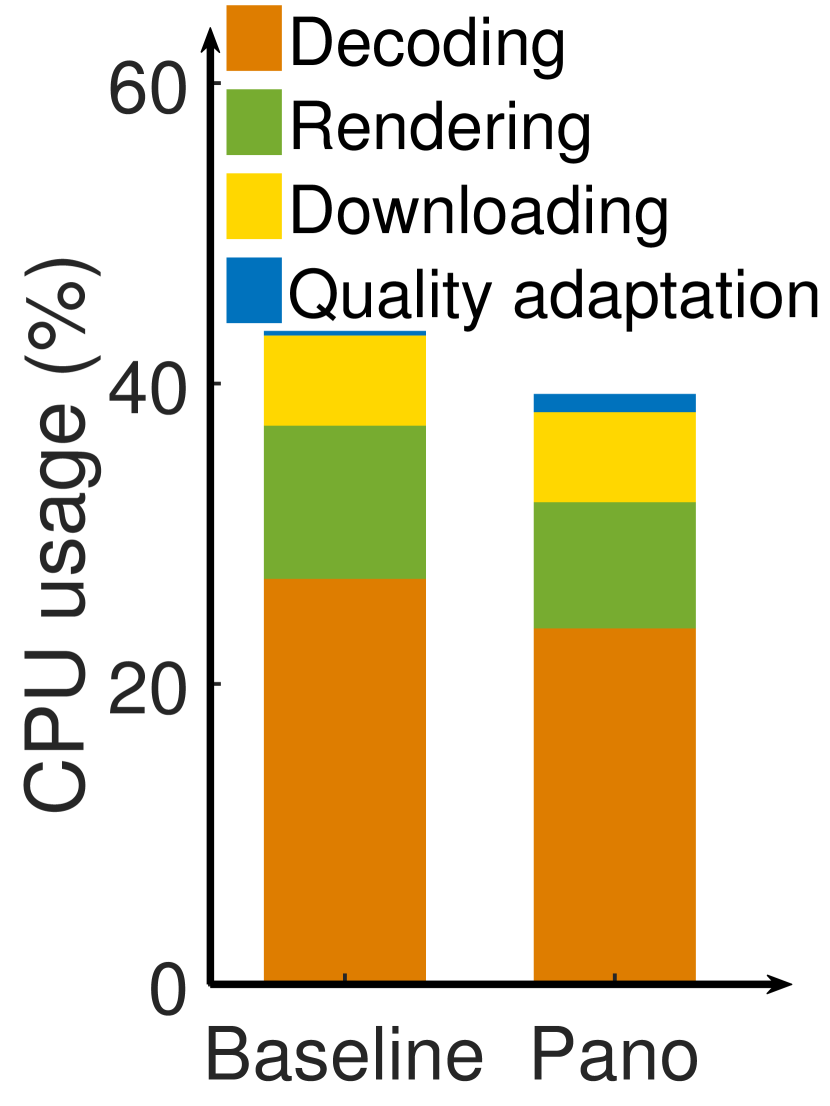
(a) Client-side CPU overhead
(b) Video start-up delay
(c) Pre-processing time for a 1-minute video
Client-side overhead: Figure 17(a) breaks down the client-side CPU overhead into that of four sequential steps: deciding per-tile quality level (quality adaptation), downloading, decoding, and rendering video tiles. We see that compared to the baseline of Flare, Pano induces less computing overhead. This is because Pano needs to render video tiles with less total size than the baseline, and although Pano needs extra PSPNR computation to make quality adaptation decisions, the client-side overhead is still dominated by video decoding and rendering, which is shared by both Pano and the baselines.
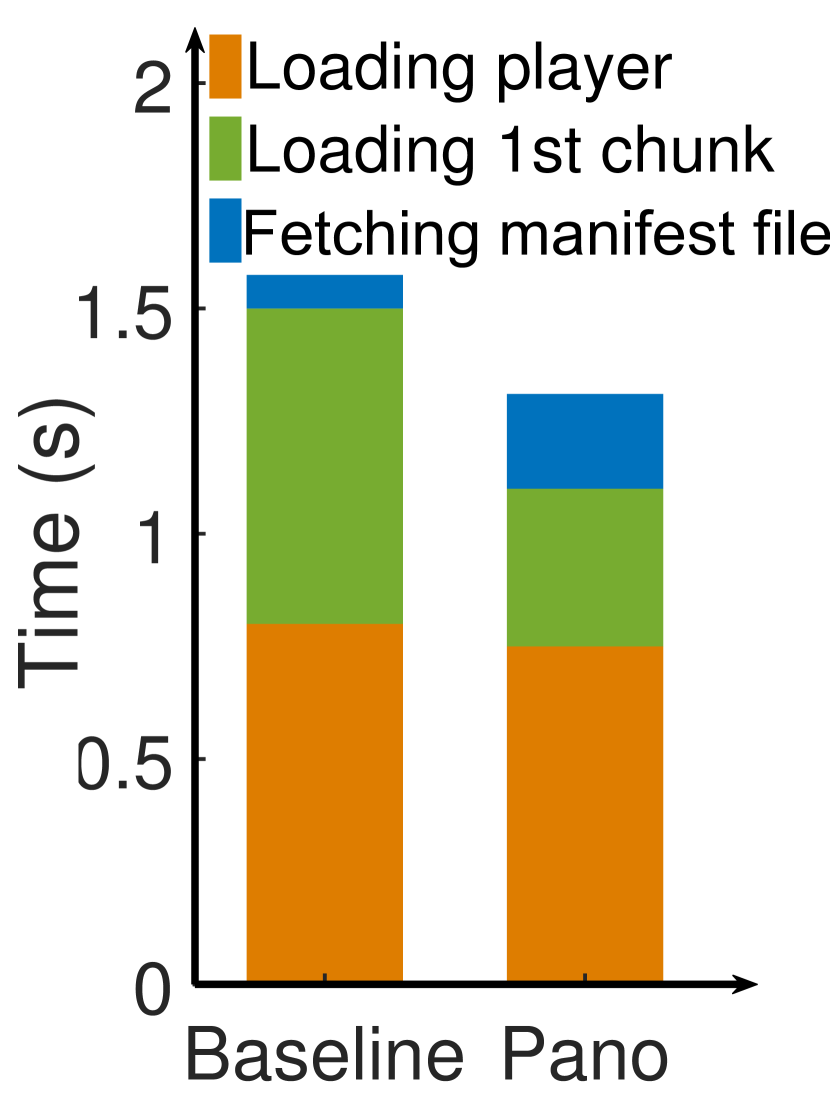
Video start-up delay: Figure 17(b) breaks down the video start-up delay (from when video player starts loading to when video starts playing) into three steps: loading the player, downloading the manifest file, and downloading the first chunk. Again, we see that Pano induces an additional overhead since it needs to download a larger manifest file that includes the PSPNR lookup table (see §7). However, the additional start-up delay is offset by the reduction of the loading time of the first chunk, because Pano uses less bandwidth (to achieve the same PSPNR).
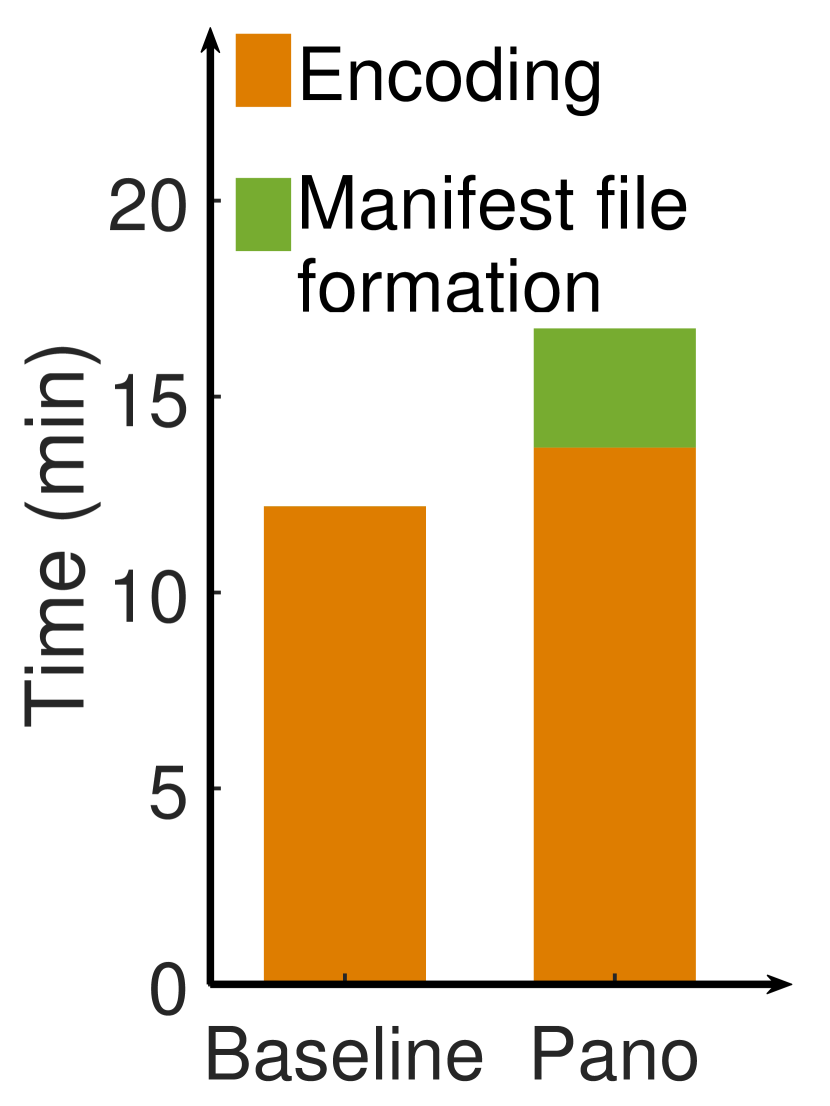
Video processing overhead: Figure 17(c) shows the pre-processing delay on the video provider side to pre-compute the PSPNR look-up table and encode the one minute worth of video (including chunking and tiling). Both the baseline and Pano fully utilize the CPU cycles. Note that the preprocessing time does not include building the JND model. Because the 360JND model (as described in §4) is agnostic to the specific video content, the 360JND model is generated once and used in all 360° videos. We can see that Pano does impose a longer pre-processing delay, due not only to the additional PSPNR pre-computation, but also to the variable-size tiling, which is more compute-intensive than the traditional grid-like tiling. Nevertheless, the processing time of Pano is still on par with the baseline.
(a) Component-wise analysis.
(b) Bandwidth consumption.
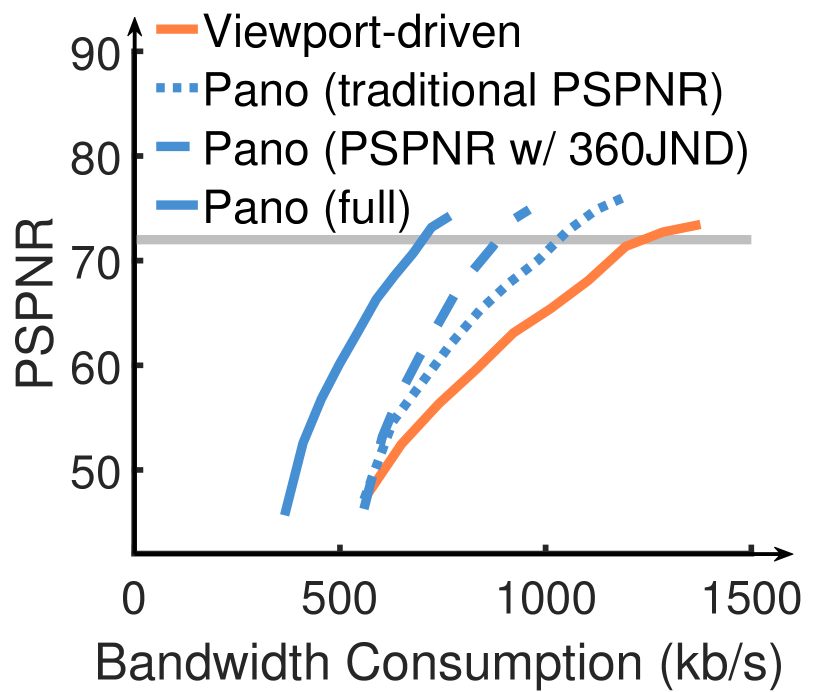
8.5. Bandwidth savings
Finally, Figure 18(a) runs a component-wise analysis to evaluate the contribution of each technique in Pano by adding one of them at a time to a viewport-driven baseline. To evaluate bandwidth savings on a larger set of videos, we extend our dataset from 18 360° videos to 50 360° videos (publicly available at (pan, [n. d.])), generate synthetic viewpoint traces for the new 32 360° videos as follows. We detect objects in each video using Yolo (Redmon and Farhadi, 2018). Then, we synthetically generate 48 viewpoint traces for each video by assuming that the viewpoint tracks a randomly picked object for 70% of the time and looks at a randomly picked region for the remaining 30% of the time. We acknowledge that it may not be the most realistic way to model viewpoint trajectories, but we believe it is useful because (1) the bandwidth consumption is still derived from encoding real videos, and (2) the fraction of object-tracking time (70%) matches the average object-tracking time in the real viewpoint traces.
Conceptually, we can breakdown the improvement of Pano over the viewport-driven baseline (Flare) into three parts. Figure 18(a) shows the bandwidth savings by each part, while holding the PSPNR to be 72 (which approximately translate to MOS = 5).
-
1.
Benefit of JND-awareness: Switching from the basic viewport-driven quality model (i.e., the perceived quality of a tile is only a function of its distance to the viewpoint) to a PSPNR-based quality model (which only includes the traditional JND-related factors (Chou and Li, 1995; Chen and Guillemot, 2009)) already saves 17% of bandwidth.
- 2.
-
3.
Benefit of variable-size tiling: Finally, the PSPNR-aware variable-size tiling (§5) reduces the bandwidth consumption, over grid tiling, by another 17%.
Finally, we run the evaluation with real throughput traces. Figure 18(b) shows that Pano achieves the same PSPNR with 41-46% less bandwidth consumption than the viewport-driven baseline.
9. Limitations of 360JND modeling
Our 360JND model (§4) is built on a survey study, where participants were asked to watch and rate their experience for videos that spanned a wide range of viewpoint speeds, DoF differences, and luminance changes. This is a similar methodology to what was used in the related work (Chou and Li, 1995; Chen and Guillemot, 2009). That said, we acknowledge two limitations of this approach.
First, the values of 360° video-specific factors are varied in a specific manner (see details in Appendix), which may not match how they would vary and be perceived by users in the wild. For instance, when we emulated different viewpoint moving speeds, the viewpoint was always moving in the horizontal direction and at a constant rate. However, when watching a 360° video, a user may move the viewpoint neither horizontally, nor at a constant speed.
Second, we have only tested the impact of two factors at non-zero values (Figure 7). We have not tested 360JND under all three factors at non-zero values. Instead, we assume their effects on JND are mutually independent, thus could be directly multiplied (Equation 1). While Figure 8 suggests our 360JND calculation is strongly correlated with user-perceived quality, Pano could benefit from a more complete and fine-grained profiling of the relationship between 360JND and various factors.
10. Related work
360° video streaming has attracted tremendous attention in industry (fac, [n. d.]; Rondao Alface et al., 2012; Goo, [n. d.]) and academia (Qian et al., 2018; Xie and Zhang, 2017; Gaddam et al., 2016; Graf et al., 2017; Hosseini and Swaminathan, 2016; Zare et al., 2016; Xie et al., 2018, 2017; Ban et al., 2018; Corbillon et al., 2017b; Duanmu et al., 2017; Sreedhar et al., 2017). Here we survey the work most closely related to Pano.
Viewport tracking: Viewport-driven adaptation is one of the most popular approaches to 360° videos streaming (Rondao Alface et al., 2012; Xie and Zhang, 2017; Gaddam et al., 2016; Zare et al., 2016; Corbillon et al., 2017b; Duanmu et al., 2017). The viewport of a user is delivered with high quality, while other areas are encoded in low quality or not streamed. To accommodate slight viewpoint movement, some work takes the recent viewport and re-scales it to a large region (Xie and Zhang, 2017; Graf et al., 2017), but it may still miss the real-time viewport if the viewport moves too much (Qian et al., 2016). To address this issue, many viewport-prediction schemes (Qian et al., 2018; Xie et al., 2018, 2017; Nasrabadi et al., 2017) are developed to extrapolate the user’s viewport from history viewpoint movements (Qian et al., 2016), cross-user similarity (Ban et al., 2018), or deep content analysis (Fan et al., 2017). In addition to predict the viewpoint location, Pano also predicts the new quality-determining factors (viewpoint-moving speed, luminance, and DoF) by borrowing ideas (e.g., history-based prediction) from prior viewport-prediction algorithms.
360° video tiling: Tile-based 360° video encoding is critical for viewport-adaptive streaming (Gaddam et al., 2016; Zare et al., 2016; Corbillon et al., 2017b; Qian et al., 2018; Xie et al., 2018). Panoramic video is spatially split into tiles, and each tile is encoded in multiple bitrates, so only a small number of tiles are needed to display the user’s dynamic viewport. But this introduces additional encoding overhead as the number of tiles increases. Grid-like tiling is the most common scheme. Alternative schemes, like ClusTile (Zhou et al., 2018), cluster some small tiles to one large tile so as to improve compression efficiency. What is new in Pano is that it splits the video in variable-size tiles which are well-aligned with the spatial distributions of the new quality-determining factors.
Bitrate adaptation in 360° videos: Both 360° videos and non-360° videos rely on bitrate-adaptation algorithms to cope with bandwidth fluctuations, but 360° videos need to spatially allocate bitrate among the tiles of a chunk (Xie et al., 2017; Qian et al., 2018) (tiles closer to the viewpoint get higher bitrates), but non-360° videos only change bitrate at the boundaries between consecutive chunks (e.g., (Yin et al., 2015; Spiteri et al., 2016; Jiang et al., 2014)). While Pano follows the tile-based bitrate adaptation, it is different in that the importance of each tile is dependent not only to its distance to the viewpoint, but users’ sensitivities to its quality distortion.
Just-Noticeable Distortion and perceived quality: Many psychological visual studies (e.g., (Chen and Guillemot, 2009; Chou and Li, 1995; Zhao et al., 2011)) have shown that the sensitivity of Human Visual System (HVS) can be measured by Just-Noticeable Distortion (JND) (Jayant et al., 1993). JND has been used in other video quality metrics (e.g., (Chou and Li, 1995)) to quantify subjective user-perceived quality, but most of the existing studies are designed for video coding and non-360° videos. This work aims to leverage the impact of interactive user behaviors (such as viewpoint movements) on JND and how users perceive 360° video quality, to achieve higher 360° video quality with less bandwidth consumption.
11. Conclusion
High-quality 360° video streaming can be prohibitively bandwidth-consuming. Prior solutions have largely assumed the same quality perception model as traditional non-360° videos, limiting the room for improving 360° videos by the same bandwidth-quality tradeoffs as traditional videos. In contrast, we show that users perceive 360° video quality differently than that of non-360° videos. This difference leads us to revisit several key concepts in video streaming, including perceived quality metrics, video encoding schemes, and quality adaptation logic. We developed Pano, a concrete design inspired by these ideas. Our experiments show that Pano significantly improves the quality of 360° video streaming over the state-of-the-art, e.g., 25%-142% higher mean opinion score with same bandwidth consumption).
Acknowledgment
We thank our shepherd Zafar Ayyub Qazi and SIGCOMM reviewers for their helpful feedback. Xinggong Zhang was supported in part by Project 2018YFB0803702, ALI AIR project XT622018001708, and iQIYI. Junchen Jiang was supported in part by a Google Faculty Research Award and CNS-1901466. Xinggong Zhang is the corresponding author.
References
- (1)
- Vim ([n. d.]) 360 Cinema on Vimeo - The high-quality home for video. https://vimeo.com/channels/360vr.
- net ([n. d.]) 4G/LTE Bandwidth Logs. http://users.ugent.be/~jvdrhoof/dataset-4g/.
- Goo ([n. d.]) Bringing pixels front and center in VR video. https://blog.google/products/google-ar-vr/bringing-pixels-front-and-center-vr-video/.
- DAS ([n. d.]) DASHjs. https://github.com/Dash-Industry-Forum/dash.js.
- VRd ([n. d.]) A Dataset for Exploring User Behaviors in Spherical Video Streaming. https://wuchlei-thu.github.io.
- day ([n. d.]) Daydream. https://vr.google.com/daydream/.
- fac ([n. d.]) Facebook end-to-end optimizations for dynamic streaming. https://code.facebook.com/posts/637561796428084.
- ffm ([n. d.]) FFmpeg. http://ffmpeg.org.
- sma ([n. d.]) Home - Smart Eye. https://smarteye.se.
- Net ([n. d.]) How to watch Netflix in VR. https://www.netflix.com/cn/.
- hls ([n. d.]) HTTP Live Streaming. https://developer.apple.com/streaming/.
- iQi ([n. d.]) iQiyi VR Channel. https://www.iqiyi.com.
- eMa ([n. d.]) Is Video a Game Changer for Virtual Reality? https://www.emarketer.com/Article/Video-Game-Changer-Virtual-Reality/1016145.
- WOW ([n. d.]) Live Virtual Reality (VR) and 360 Degree Streaming Software. https://www.wowza.com/solutions/streaming-types/virtual-reality-and-360degree-streaming.
- pan ([n. d.]) PanoProject. https://github.com/panoproject/PanoProject.
- qz ([n. d.]) Quartz. https://qz.com/1298512/vr-could-be-as-big-in-the-us-as-netflix-in-five-years-study-shows/.
- sam ([n. d.]) Samsung Gear VR with Controller. https://www.samsung.com/global/galaxy/gear-vr/.
- tob ([n. d.]) Tobii. https://www.tobii.com/group/about/this-is-eye-tracking/.
- Hul ([n. d.]) Virtual reality experiences on Hulu - Stream TV and Movies. https://help.hulu.com/s/article/guide-to-hulu-virtual-reality?language=en_US.
- You ([n. d.]) Virtual reality experiences on Hulu - Stream TV and Movies. https://vr.youku.com/.
- viv ([n. d.]) Vive. https://www.vive.com/us/.
- MOS ([n. d.]) Vocabulary for performance and quality of service. https://www.itu.int/rec/T-REC-P.10.
- X26 ([n. d.]) X264. https://www.videolan.org/developers/x264.html.
- Agrawal et al. (1998) Rakesh Agrawal, Johannes Gehrke, Dimitrios Gunopulos, and Prabhakar Raghavan. 1998. Automatic Subspace Clustering of High Dimensional Data for Data Mining Applications. In Proceedings of the 1998 ACM SIGMOD International Conference on Management of Data (SIGMOD ’98). 94–105.
- Ban et al. (2018) Yixuan Ban, Lan Xie, Xu Zhimin, Xinggong Zhang, Zongming Guo, Shengbin Meng, and Yue Wang. 2018. CUB360: Exploiting Cross-Users Behaviors for Viewport Prediction in 360 Video Adaptive Streaming. In IEEE International Conference on Multimedia and Expo (ICME).
- Bao et al. (2017) Yanan Bao, Huasen Wu, Tianxiao Zhang, Albara Ah Ramli, and Xin Liu. 2017. Shooting a Moving Target: Motion-Prediction-Based Transmission for 360-Degree Videos. In IEEE International Conference on Big Data.
- Carnegie and Rhee (2015) K Carnegie and T Rhee. 2015. Reducing Visual Discomfort with HMDs Using Dynamic Depth of Field. IEEE Computer Graphics and Applications 35, 5 (2015), 34–41.
- Cermak et al. (2011) G. Cermak, M. Pinson, and S. Wolf. 2011. The Relationship Among Video Quality, Screen Resolution, and Bit Rate. IEEE Transactions on Broadcasting 57, 2 (June 2011), 258–262.
- Chen and Guillemot (2009) Zhenzhong Chen and Christine Guillemot. 2009. Perception-oriented video coding based on foveated JND model. In Picture Coding Symposium. 1–4.
- Chou and Li (1995) Chun Hsien Chou and Yun Chin Li. 1995. Perceptually tuned subband image coder based on the measure of just-noticeable-distortion profile. IEEE Trans on Circuits and Systems for Video Technology 5, 6 (1995), 467–476.
- Corbillon et al. (2017a) Xavier Corbillon, Francesca De Simone, and Gwendal Simon. 2017a. 360-degree video head movement dataset. In Proceedings of the 8th ACM on Multimedia Systems Conference. ACM, 199–204.
- Corbillon et al. (2017b) Xavier Corbillon, Gwendal Simon, Alisa Devlic, and Jacob Chakareski. 2017b. Viewport-adaptive navigable 360-degree video delivery. In IEEE International Conference on Communications.
- Duanmu et al. (2017) Fanyi Duanmu, Eymen Kurdoglu, S. Amir Hosseini, Yong Liu, Yao Wang, Fanyi Duanmu, Eymen Kurdoglu, S. Amir Hosseini, Yong Liu, and Yao Wang. 2017. Prioritized Buffer Control in Two-tier 360 Video Streaming. In The Workshop on Virtual Reality and Augmented Reality Network. 13–18.
- Fan et al. (2017) Ching Ling Fan, Jean Lee, Chun Ying Huang, Kuan Ta Chen, and Cheng Hsin Hsu. 2017. Fixation Prediction for 360 Video Streaming in Head-Mounted Virtual Reality. In The Workshop on Network and Operating Systems Support for Digital Audio and Video. 67–72.
- Gaddam et al. (2016) Vamsidhar Reddy Gaddam, Michael Riegler, Ragnhild Eg, Pal Halvorsen, and Carsten Griwodz. 2016. Tiling in Interactive Panoramic Video: Approaches and Evaluation. IEEE Transactions on Multimedia 18, 9 (2016), 1819–1831.
- Graf et al. (2017) Mario Graf, Christian Timmerer, and Christopher Mueller. 2017. Towards Bandwidth Efficient Adaptive Streaming of Omnidirectional Video over HTTP: Design, Implementation, and Evaluation. In ACM on Multimedia Systems Conference. 261–271.
- Hadizadeh and Bajić (2013) Hadi Hadizadeh and Ivan V Bajić. 2013. Saliency-aware video compression. IEEE Transactions on Image Processing 23, 1 (2013), 19–33.
- Henriques et al. (2015) J. F. Henriques, R Caseiro, P Martins, and J Batista. 2015. High-Speed Tracking with Kernelized Correlation Filters. IEEE Transactions on Pattern Analysis & Machine Intelligence 37, 3 (2015), 583–596.
- Hoffman et al. (2008) David M. Hoffman, Ahna R. Girshick, Kurt Akeley, and Martin S. Banks. 2008. Vergence accommodation conflicts hinder visual performance and cause visual fatigue. Journal of Vision 8, 3 (2008), 33.
- Hore and Ziou (2010) A. Hore and D. Ziou. 2010. Image Quality Metrics: PSNR vs. SSIM. In 2010 20th International Conference on Pattern Recognition. 2366–2369.
- Hosseini and Swaminathan (2016) Mohammad Hosseini and Viswanathan Swaminathan. 2016. Adaptive 360 VR Video Streaming: Divide and Conquer! (2016), 107–110.
- Jayant et al. (1993) N. Jayant, J. Johnston, and R. Safranek. 1993. Signal compression based on models of human perception. Proc. IEEE 81, 10 (Oct 1993), 1385–1422. https://doi.org/10.1109/5.241504
- Jiang et al. (2014) Junchen Jiang, Vyas Sekar, and Hui Zhang. 2014. Improving fairness, efficiency, and stability in http-based adaptive video streaming with festive. IEEE/ACM Transactions on Networking (ToN) 22, 1 (2014), 326–340.
- Lee and Ebrahimi (2012) Jong-Seok Lee and Touradj Ebrahimi. 2012. Perceptual video compression: A survey. IEEE Journal of selected topics in signal processing 6, 6 (2012), 684–697.
- Li et al. (2014) S. Li, J. Lei, C. Zhu, L. Yu, and C. Hou. 2014. Pixel-Based Inter Prediction in Coded Texture Assisted Depth Coding. IEEE Signal Processing Letters 21, 1 (Jan 2014), 74–78.
- Lo et al. (2017) Wen-Chih Lo, Ching-Ling Fan, Jean Lee, Chun-Ying Huang, Kuan-Ta Chen, and Cheng-Hsin Hsu. 2017. 360 video viewing dataset in head-mounted virtual reality. In Proceedings of the 8th ACM on Multimedia Systems Conference. ACM, 211–216.
- Mangiante et al. (2017) Simone Mangiante, Guenter Klas, Amit Navon, Zhuang GuanHua, Ju Ran, and Marco Dias Silva. 2017. VR is on the Edge: How to Deliver 360 Videos in Mobile Networks. In Proceedings of the Workshop on Virtual Reality and Augmented Reality Network (VR/AR Network ’17). 30–35.
- Nasrabadi et al. (2017) Afshin Taghavi Nasrabadi, Anahita Mahzari, Joseph D Beshay, and Ravi Prakash. 2017. Adaptive 360-degree video streaming using scalable video coding. In Proceedings of the 2017 ACM on Multimedia Conference. ACM, 1689–1697.
- Normann and Werblin (1974) Richard A. Normann and Frank S. Werblin. 1974. Control of Retinal Sensitivity. The Journal of General Physiology 63, 1 (1974), 37–61.
- Petrangeli et al. (2017) Stefano Petrangeli, Viswanathan Swaminathan, Mohammad Hosseini, and Filip De Turck. 2017. An HTTP/2-Based Adaptive Streaming Framework for 360 Virtual Reality Videos. In Proceedings of the 25th ACM International Conference on Multimedia (MM ’17). ACM, New York, NY, USA, 306–314.
- Pugh (1975) E N Pugh. 1975. Rushton’s paradox: rod dark adaptation after flash photolysis. The Journal of Physiology 248, 2 (1975), 413–431.
- Qian et al. (2018) Feng Qian, Bo Han, Qingyang Xiao, and Vijay Gopalakrishnan. 2018. Flare: Practical Viewport-Adaptive 360-Degree Video Streaming for Mobile Devices. In Proceedings of the 24th Annual International Conference on Mobile Computing and Networking (MobiCom ’18). ACM, New York, NY, USA, 99–114.
- Qian et al. (2016) Feng Qian, Lusheng Ji, Bo Han, and Vijay Gopalakrishnan. 2016. Optimizing 360 video delivery over cellular networks. In The Workshop on All Things Cellular: Operations. 1–6.
- Redmon and Farhadi (2018) Joseph Redmon and Ali Farhadi. 2018. YOLOv3: An Incremental Improvement. arXiv (2018).
- Rondao Alface et al. (2012) P. Rondao Alface, J.-F. Macq, and N Verzijp. 2012. Interactive Omnidirectional Video Delivery: A Bandwidth-effective Approach. Bell Labs Tech. J. 16, 1 (2012), 135–147.
- Safranek and Johnston (1989) R. J. Safranek and J. D. Johnston. 1989. A perceptually tuned sub-band image coder with image dependent quantization and post-quantization data compression. In International Conference on Acoustics, Speech, and Signal Processing. 1945–1948 vol.3.
- Shimizu et al. (2007) S. Shimizu, M. Kitahara, H. Kimata, K. Kamikura, and Y. Yashima. 2007. View Scalable Multiview Video Coding Using 3-D Warping With Depth Map. IEEE Transactions on Circuits and Systems for Video Technology 17, 11 (Nov 2007), 1485–1495.
- Spiteri et al. (2016) K. Spiteri, R. Urgaonkar, and R. K. Sitaraman. 2016. BOLA: Near-optimal bitrate adaptation for online videos. In IEEE INFOCOM 2016 - The 35th Annual IEEE International Conference on Computer Communications. 1–9.
- Sreedhar et al. (2017) Kashyap Kammachi Sreedhar, Alireza Aminlou, Miska M. Hannuksela, and Moncef Gabbouj. 2017. Viewport-Adaptive Encoding and Streaming of 360-Degree Video for Virtual Reality Applications. In IEEE International Symposium on Multimedia.
- Xie et al. (2017) Lan Xie, Zhimin Xu, Yixuan Ban, Xinggong Zhang, and Zongming Guo. 2017. 360ProbDASH: Improving QoE of 360 Video Streaming Using Tile-based HTTP Adaptive Streaming. In ACM on Multimedia Conference. 315–323.
- Xie et al. (2018) Lan Xie, Xinggong Zhang, and Zongming Guo. 2018. CLS: A Cross-user Learning based System for Improving QoE in 360-degree Video Adaptive Streaming. In ACM on Multimedia Conference.
- Xie and Zhang (2017) Xiufeng Xie and Xinyu Zhang. 2017. POI360: Panoramic Mobile Video Telephony over LTE Cellular Networks. In Proceedings of the 13th International Conference on Emerging Networking EXperiments and Technologies (CoNEXT ’17). ACM, New York, NY, USA, 336–349. https://doi.org/10.1145/3143361.3143381
- Yao et al. (2014) Richard Yao, Tom Heath, Aaron Davies, Tom Forsyth, Nate Mitchell, and Perry Hoberman. Oculus VR best practices guide. , Oculus VR pages.
- Yin et al. (2015) Xiaoqi Yin, Abhishek Jindal, Vyas Sekar, and Bruno Sinopoli. 2015. A Control-Theoretic Approach for Dynamic Adaptive Video Streaming over HTTP. In ACM Conference on Special Interest Group on Data Communication. 325–338.
- Yu et al. (2015) Matt Yu, Haricharan Lakshman, and Bernd Girod. 2015. A framework to evaluate omnidirectional video coding schemes. In 2015 IEEE International Symposium on Mixed and Augmented Reality. IEEE, 31–36.
- Zare et al. (2016) Alireza Zare, Alireza Aminlou, Miska M. Hannuksela, and Moncef Gabbouj. 2016. HEVC-compliant Tile-based Streaming of Panoramic Video for Virtual Reality Applications. 601–605.
- Zhao et al. (2011) Y. Zhao, L. Yu, Z. Chen, and C. Zhu. 2011. Video Quality Assessment Based on Measuring Perceptual Noise From Spatial and Temporal Perspectives. IEEE Transactions on Circuits and Systems for Video Technology 21, 12 (Dec 2011), 1890–1902.
- Zhou et al. (2018) C. Zhou, M. Xiao, and Y. Liu. 2018. ClusTile: Toward Minimizing Bandwidth in 360-degree Video Streaming. In IEEE INFOCOM 2018 - IEEE Conference on Computer Communications. 962–970.
Appendices are supporting material that has not been peer reviewed.
Appendix A Appendix
This section presents the detailed methodology of modeling 360° video JND.
| Equipment | Oculus GO |
|---|---|
| CPU | Qualcomm Snapdragon 821 |
| Memory | 3GB |
| Screen Resolution | 2560 1440 |
| Refresh Rate | 72Hz |
| Fixed pupil distance | 63.5mm |
A.1. Survey process
The user study was based on 20 participants (age between 20 and 26). The same 20 participants also did the survey-based performance evaluation (§8), so the results could be affected by the limited size of the participant pool. In all tests, the participants watch (synthetically generated or real) 360° videos using an Oculus headset (Yao et al., 2014), of which the parameters are summarized in Table 4.
Each participant was asked to watch a video with an increasing level of quality distortion (see the next section for how the quality distortion was added to a video). Every time the quality distortion increased, the participant was asked whether he or she could perceive the quality distortion. We define JND of a video by the average level of quality distortion that was perceivable for the first time, across the 20 participants. We repeated this test with 43 artificially generated videos, and each participant watched the videos in a random order (which helped mitigate biases due to any specific playing order).
A.2. Test videos
Next, we explain (1) how we artificially generate videos with a controlled noise level added to an visual object, to emulate the effect of a specific level of quality distortion, and (2) how we emulate the viewpoint behavior such that the visual object would appear in the video with a specific relative moving speed, DoF difference, or background luminance change.
All test videos were generated by manipulating a basic video where a small square-shaped foreground object (6464 pixels) was located in the center of the screen. The object has a constant grey level of 50. We refer to the foreground object by .
Adding controlled quality distortion: To add a controlled quality distortion on , we borrow a similar methodology from prior user study on JND (Chou and Li, 1995; Chen and Guillemot, 2009). We randomly picked 50% pixels of , and added a value of to their values (grey level). We made sure that the resulting pixel values were still within the range of 0 to 255. By varying the value of from 1 to 205, we created a video with an increasing level of quality distortion on the foreground object . The video was played to each participant until the distortion was perceived for the first time.
Emulating the effect of relative viewpoint-moving speed: To emulate the perception of quality distortion under a specific relative viewpoint-moving speed, we fixed a red spot at the center of the screen, and moved the foreground object horizontally at a specific speed of . That is, and the red spot (viewpoint) has a relative moving speed of . The participant was asked to look at the red spot, and report whether he or she could perceive the quality distortion added onto the object . This process emulated the effect of viewpoint moving at a relative speed of to where the quality distortion occurred. We tested viewpoint speeds from 0 deg/s to 20 deg/s.
Emulating the effect of luminance changes: To emulate the perception of quality distortion under certain luminance changes, each video began with the background luminance set to , and then reduced to after 5 seconds. Right after the luminance was reduced to , the object was shown with a gradually increasing amount of quality distortion. The participant was then asked to report as soon as the quality distortion was perceived. Although the report quality distortion may not be the true minimally perceivable quality distortion (JND), we found the participants always reported quality distortion within 3 seconds after luminance was reduced. That suggests the first perceivable quality distortion might be a reasonable indicator of the real JND under the luminance change of . By fixing at 0 grey level (darkest) and varying from 0 to 240 grey level, we can test the JND under the different levels of luminance changes within a short time window of 5 seconds.
Emulating the effect of DoF differences: To emulate the perception of quality distortion on an object with a specific DoF difference from the viewpoint, we asked the participants to focus on a static spot displayed at a DoF difference (dioptre) from the foreground object . Then quality distortion was added to the object , and the participants were asked to report when they first perceived the quality distortion.
Joint impact of two factors: So far, each factor (relative viewpoint-moving speed, luminance change, DoF difference) was varied separately with others held to zero. We also tested the JND under both viewpoint speed and DoF differences at non-zero values simultaneously. That is, at each possible relative viewpoint-moving speed, we enumerated different values of DoF differences, using the same method described above. Similarly, we also tested the JND under both object luminance and relative viewpoint-moving speed at non-zero values. These results were shown in Figure 7.