Simulating the galactic system in interaction AM 2229-735 and the formation of its polar structure
Abstract
We study the formation of polar ring galaxies via minor mergers. We used N-body+hydrodynamics simulations to reproduce the dynamics of the observed system AM 2229-735 that is a minor merger whose interaction signals are those of a progenitor for a polar ring galaxy. We used the observational information of the system to get initial conditions for the orbit and numerical realisations of the galaxies to run the simulations. Our simulations reproduce the global characteristics of interaction observed in the system such as arms and a material bridge connecting the galaxies. As a merger remnant, we found a quasi-stable and self gravitating planar tidal stream with dark matter, stars and gas orbiting in a plane approximately perpendicular to the main galaxy disk leading in the future to a polar ring galaxy. We studied the dynamical conditions of the polar structure and found evidence suggesting that this kind of merger remnant can settle down in a disk-like structure with isothermal support, providing inspiring evidence about the process of formation of galactic disks and providing a potentially independent scenario to study the presence of dark matter in this kind of galaxies.
keywords:
galaxies: formation – galaxies: evolution – galaxies: interactions – galaxies: structure1 Introduction
Any successful cosmological model should be able to account not only for the observed matter distribution in the Universe but also for its observed dynamics. In the CDM scenario, the currently observed structures of matter are the result of a hierarchical process of structure formation, where primordial over-densities accreted dark matter via gravitational instability to form even bigger matter overdensities called dark matter halos. The baryonic matter is captured by these over densities falling in the gravitational potential well of halos (Benson, 2010). In this process it is supposed that angular momentum is conserved, thereby gas clouds get angular momentum from its orbital angular momentum obtaining a net rotation; additionally, while gas clouds collapse they cool and form stars. In this case the final result is a dark matter halo with an axis-symmetric gaseous and stellar structure in its centre called galactic disk. There are galaxies where mass accretion is violent and the gas and stars form a structure with spheroidal symmetry with almost zero net rotation, they define what we call elliptical galaxies (Mo et al., 2010; Benson, 2010).
In this cosmological context, galaxies undergo constant collisions leading to their evolution and to the great variety of galaxies observed at different epochs of the Universe. This hierarchical model of structure formation has been very successful to reproduce the distribution of matter in the observed universe with its main characteristics. However, still there are several open problems, one of these are the formation of disk galaxies with a complex substructure such as rings, arms, and polar structures.
The vast variety of morphologies and matter distribution product of gravitational interaction in galaxies is evident in observations (Arp & Madore, 1977, 1987; Martínez-Delgado et al., 2010; Morishita et al., 2014; Shibuya et al., 2015; Shibuya et al., 2016). One can find elliptical and S0 galaxies with inclined disks and rings, galaxies with streams of infalling material accreted from orbiting satellites, galaxies with shells, ripples and perturbed disks, etc.
A very interesting example of a galactic system are the polar ring galaxies (PRGs). They are exotic systems that are believed to be the result of a galactic interaction in a privileged direction. They are mainly characterised by a central S0 galaxy almost perpendicularly surrounded by an accreted structure of gas, dust, and stars settled in a quasi-equilibrium configuration (the galaxy NGC 4650 is an example of PRG, see Whitmore et al. (1990); Reshetnikov & Sotnikova (1997); Laurikainen et al. (2011, 2013)). Since an important fraction (20-25) of S0 galaxies show some polar structure like disks, rings or incomplete versions of them, to understand how this systems formed will extend our knowledge on the formation and evolution of galaxies. Particularly, they could be key scenarios to understand how galactic interactions happens, how mergers affect galactic morphology and kinematics, to understand the shape of gravitational potential in galaxies, the shape of dark matter halos, induced variations in star formation rate and metal distributions, among many other open questions on the evolution of galaxies.
Several models have been proposed to explain the formation and structure of polar ring galaxies. Accretion models propose that the material in the ring comes from interactions with a gas rich galaxy forming a ring around the host galaxy (Schweizer et al., 1983; Whitmore et al., 1990; Steiman-Cameron & Durisen, 1988, 1990). In merging models all material is stripped from a secondary (minor) galaxy forming a ring perpendicular to the major semi-axis of the host galaxy (Bekki, 1998; Bournaud & Combes, 2003). Other models propose that smoothly infalling material forms a ring while accreted from cosmic filaments (Macciò et al., 2006; Brook et al., 2008). All these models have been tested with numerical simulations that have succeeded to reproduce many of the properties observed in PRGs, these results together with results of observations have found correlations between the properties of the host galaxy with those of its polar structure (Reshetnikov & Sotnikova, 1997; Bekki, 1998).
Currently, there are still open questions concerning the formation of PRGs. To mention some of them, we do not know yet which would be the expected frequency of PRGs, how is the kinematics of stars forming in these structures, It is not yet clear what is the origin of the gradients of metallicity observed in PRGs, what are the formation mechanism of massive self-gravitating stellar-gaseous polar rings, among many others (Moiseev et al., 2011; Combes et al., 2013). In that sense, the use of hydrodynamical simulations to reproduce observed interacting systems candidate to form polar structures becomes interesting astrophysical laboratories. These simulations, tuned to reproduce a specific observed system, would provide useful information to understand the influence of the morphological properties of the galaxies and the merger orbit in the final properties of the polar ring or disk formed. One of these candidates, is the system AM 2229-735 (Freitas-Lemes et al., 2014) that is described below and will be the object of study in this work.
In this work we want to study the problem of the formation of polar ring galaxies in a merging model where a satellite galaxy is stripped by a host galaxy and the produced tidal stream is settled forming a polar structure around this host. For that we study the evolution of the real system AM 2229-735 using its observational information to setup N-body+hydrodynamical simulations with radiative cooling, star formation and supernovae feedback. In these simulations we found a galaxy with a polar structure around it and we studied with detail the properties and evolution of tidal stream forming the structure.
This paper is outlined as follows. In Section 2 we present the state of the art of observations of the system AM 2229-735 and the observational data that we use for this work. The method to get initial conditions for simulations from observations in Section 3. The numerical details of simulations are presented in Section 4 and an analysis of polar structure formed in Section 6. Finally, we present our conclusions in Section 7.
2 Observations
From its first report in “A CATALOGUE OF SOUTHERN PECULIAR GALAXIES AND ASSOCIATIONS” (Arp & Madore, 1977, 1987), the system AM 2229-735 have been studied by several authors, this has allowed to collect many data that will be useful to configure initial conditions for the simulations and to compare their results with observations to get clues about its evolution and fate.
Ferreiro & Pastoriza (2004) used images from CTIO 0.9m telescope plus spectra from Donzelli & Pastoriza (1997) to study the effects of the interaction on the integrated photometric properties and star formation activity, they determined that AM 2229-735 is conformed by a main disk galaxy and a compact elliptical companion galaxy. The main galaxy, with an exponential luminosity profile, is very perturbed and exhibits several regions of active star formation. The galaxies are connected with a luminous bridge that contains 17% of the total luminosity of the system. Later, Ferreiro et al. (2008) studied the properties of those HII regions. A comparison of these with other HII regions in normal and isolated galaxies and tidal dwarf galaxies candidates was done. They estimated the age, star formation rate and nuclear mass of both galaxies and of six HII regions of the main galaxy. They found that in the satellite galaxy there is H emission only in its nucleus and that in the tip of the bridge that connects the galaxies there is a special region with the youngest stellar population of the system.
Freitas-Lemes et al. (2014) made a detailed study of AM 2229-735 using acquisition images and spectroscopy data obtained at Gemini South (Chile) and Pico dos Dias (Brazil) telescopes. They analysed broad-band images and long-slit spectroscopy. These images, with better resolution than used in previous works, show clearly that the satellite is not an spheroidal but a disk galaxy (see Fig. 1). These observations allows the detection of a tail and counter-tail arc-shaped features. The southern region of the main galaxy is bluer than the northern one, its centre has a bar. The companion galaxy, almost face-on along the line-of-sight, is in general bluer than the host and exhibits an U-shaped radial velocity profile typical of interacting galaxies.
Recently, Krabbe et al. (2017) used a sample of nine interacting galaxies to study the relation between the gravitational interaction and the stellar populations. In this study, the main galaxy disk of AM 2229-735 has two interesting HII regions dominated by young and intermediate age stellar populations probably formed during the interaction. Finally, as an important particular case for this work, in Freitas-Lemes et al. (2014) AM 2229-735 is proposed as a progenitor of a polar ring galaxy because its morphology is similar to the later instants observed in simulations of polar ring galaxies shown in Bournaud & Combes (2003); Reshetnikov et al. (2006).
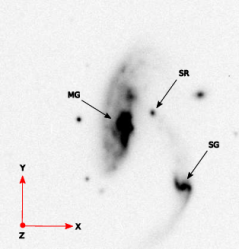
To reproduce the interaction of AM 2229-735 it is necessary to obtain, from observations, information about the galaxies in the pair. For that, we used public acquisition images in r-band superimposed on Gemini Multi-Objects Spectrograph (GMOS-S) acquired as part of the bad weather program GS-2006A-DD-6 in Gemini South, Chile. Aims and results of these observations are detailed in the paper series Krabbe et al. (2014); Rosa et al. (2014); Krabbe et al. (2017). Figure 1 shows an image of the system, one can see a main disk galaxy (hereafter MG) at its centre, a satellite galaxy (hereafter SG), a material bridge that connects both galaxies, a special luminous region (hereafter SR) on this bridge and other objects that we assume are field objects.
| Component | Masses MG () | Scale MG () | Masses SG () | Scale SG () |
|---|---|---|---|---|
| Halo | 70.19 | 23.22 | 3.05 | 9.05 |
| Gas disk | 0.16 | 3.40 | 0.03 | 1.02 |
| Stellar disk | 5.59 | 3.40 | 0.11 | 1.02 |
| Bulge | 2.39 | 0.68 | 0.03 | 0.20 |
3 Initial conditions: From observations to simulations
In this section, the procedures to estimate basic geometrical and dynamical properties of AM 2229-735 are described. In this part of the work, different strategies and techniques were combined to obtain all the parameters required to build two numerical disk galaxies with physical properties in agreement with the observations of MG and SG. Finally, a numerical procedure was developed to obtain an orbit that reproduce the state of the interaction observed for the system.
3.1 Properties of disk galaxies
We define a coordinate system for this work, with the origin in the centre of MG (defined as the position of the maximum surface brightness), coordinate axes are oriented with the X-axis to the right along the horizontal, Y-axis points up along the vertical and Z-axis pints towards the observer as illustrated in Figure 1.
Surface photometry analysis was performed using ellipse task in IRAF. Fitting the disk isophotes to an exponential profile we got radial disk scale lengths for both MG and SG . In our coordinate frame, is defined as the angular position of disk major semi-axis from the Y-axis being positive counterclockwise. We found this angle as the mean of ellipses fitted for isophotes of each disk excluding the central and outer ellipses to avoid the contribution of galactic bulge and tidally disturbed arms. The mean obtained this way are for MG and for SG. We define the inclination , as the angle between each disk and the XY plane (positive counterclockwise). This angle can be found using the mean semi-major axis and semi-minor axis of the disk as , where and can be estimated from the elliptical isophotes found with ellipse. The mean inclination, in the case of AM 2229-735 is for MG and for SG.
To complete the basic information to build the numerical models for the galaxies in the pair, it is necessary to estimate the mass of each galactic component: stellar and gaseous disks, bulge and halo. In what follows, we will describe how we estimate each mass component for each galaxy.
To calculate stellar mass () for each galaxy we used the mass-to-light ratio based in Bell et al. (2003). They estimated galaxy luminosity and stellar mass functions in the local universe using data of a large sample of galaxies from the Two Micron All Sky Survey (2MASS) and the Sloan Digital Sky Survey (SDSS). Then they estimated present-day stellar mass-to-light ratios and the mean stellar mass can be estimated as
| (1) |
here, the luminosity in -band () is required to estimate and is the galaxy colour corrected to . Because the filters used in the images of AM 2229-735 are slightly different to the used in Equation 1, we took the corrected magnitudes in and from Freitas-Lemes et al. (2014) due to their central wavelength are the closer to those of and filters. The induced error for this assumption is negligible given that the difference between these wavelengths only contribute with the continuous of spectra (see figure 5 in Freitas-Lemes et al. (2014)). is a parameter that depends of initial mass function with a value of for this case (Bell et al. (2003)).
To estimate the halo mass of the MG we used the recipes presented in Villa-Vélez (2015), where an inverse procedure to Mo et al. (1998) model is performed. In Mo et al. (1998) given a set of parameters, in a CMD cosmology, the virial velocity , the concentration and spin parameter for a dark matter halo hosting a stellar disk with fractions of mass and angular momentum and relative to those of the halo, the scale length and the rotation curve are obtained. Conversely, in Villa-Vélez (2015), using distributions built with data from SDSS, knowing and and assuming and , many realisations of the model are made, therefore, the most probable combination of , and of a halo that could host a particular disk with , , and is obtained. This method works well for massive galaxies, however, it is not well calibrated for low mass galaxies. The halo mass for SG was extracted from rotation curves acquired by D.L. Ferreiro in august of 1999 with the telescope of in the Complejo Astronómico de la Sierra de Leoncito (CASLEO).
We estimate the gas mass for MG from the ratios for presented in Catinella et al. (2010). To estimate the gas mass of SG we used the estimated value with its Hα luminosity presented in Ferreiro et al. (2008). Finally, the bulge-to-disk mass ratio for both galaxies was defined such that the stability of the disk is guaranteed when they were simulated in isolation, this ensures that dynamical and morphological changes in the galaxies are due only to its interaction. In Table 1 we summarise the results of masses and scale lengths for all galactic components used for the simulation of the system.
3.2 The orbit
Observations gave us position in the plane of each galaxy and -velocity for SG relative to MG. Then it is necessary to find its relative position and the other two velocity components, and . In general, in order to reproduce the merger, we need to find the orbit leading to the current status of the system. To obtain that information, we used a two step approach. First a two body approximation was used to explore the parameter space of orbital parameters, and then an extended body was used to select candidate orbits for the merger.
For the first step, assuming that both galaxies are point masses, we systematically explored intervals in orbital parameters eccentricity (), periastron (), () position and the inclination of the plane of the orbit ().
In the two body approximation, a large set of orbits was produced exploring the parameter space (, ). Each orbit was projected in the sky and it was accepted as a candidate orbit if it was able to reproduce the observational constraints (observed position and velocity of SG). Around 240000 candidate orbits came out of this exploration.
In the second step we took the candidate orbits produced in the first step and perform an integration in time of the orbit. For that, MG was not considered as a point mass, instead, it was modelled as an extended rigid body composed of twelve thousand static particles representing the bulge, disk and dark matter halo. Namely, these particles are static then the galactic components do not have dynamics, thus the motion of MG is given by the dynamics of its centre of mass. The mass distributions used for each component are described in Section 3.3 and their masses as in Table 1. In this way we can account for the effects of the gravitational torques acting on SG, that in this step is still modelled as a point mass. The motion of the centre of mass of MG and SG were integrated using a leapfrog integrator with adaptive time step, while the force field acting on SG considered its interaction with each particle in the realisation of MG. Starting from the instant of observation a first integration backwards in time was ran during a dynamical time (of MG), then an integration forward in time was performed. Thus, if SG orbit passes again in position and velocity close to the observational constraints this orbit is selected as a potential orbit to run in a simulation. This reduced the number of candidate orbits to around 12000 potential orbits.
As a last step, a minimisation of a chi-square estimator was made on those 12000 orbits using as parameters the observational constraints (). Thus we simulated AM 2229-735 taking the orbits with the smallest values of chi-square. Finally, 54 low resolution (VLR) simulations with different orbits were performed, from these simulations we focus on the orbit that best reproduce the observations of the system. Details of simulations are described in section 4.
3.3 Initial conditions for simulations
With all information obtained of AM 2229-735 for both, individual galaxies as well as the orbit described by the galaxies in the system, it is possible to build initial conditions of the numerical realisations of the galaxies and then reproduce the interaction between MG and SG. Initial conditions follow the prescription presented in Springel et al. (2005). All relevant parameters for the realisation of the particle distribution are summarised in Table 1. The spheroidal components, halo and bulge follow a density profile of Hernquist (1990)
| (2) |
where is the total mass of the component and is the corresponding radial scale length. Gas and stellar disks, with the same radial scale length, have exponential density profiles
| (3) |
where , and are the (stellar or gaseous) disk mass, radial scale length and vertical scale length, respectively.
Each galaxy was simulated in isolation for around to test for stability of the initial conditions and to allow the model to relax numerically. This way we ensure that any change observed in the structure of the galaxies is induced by the merger not by any instability induced by the initial conditions.
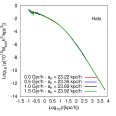
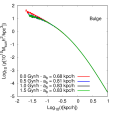
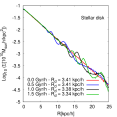
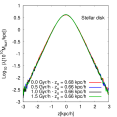
Figure 2 shows an example of stability check for MG corresponding to high resolution simulation; each line represents the system at a different time from 0 to . Top left panel shows the density profile for dark matter halo, this component does not undergo significant changes in its structure, the shape of the density profile is the same for all times and the value of the scale length is almost constant. For the bulge (top right panel) its central density decreases during the first while the scale length grows to ; After this relaxation the bulge’s structure remains stable in time. In the case of the stellar disk, the radial structure (bottom left panel) shows full stability in the inner region (within two times the radial scale lengths) all times. For the outer regions density waves travel outwards from the disk, this behaviour is typical in axis-symmetrical gravitational systems initialised using the approach used in this work (Hernquist, 1993), however after the waves dissipate and equilibrium is guaranteed within more than four times the initial scale length. The vertical structure of the stellar disk remains almost unchanged for all times as is evident in bottom right panel. All initial conditions used for MG and SG used in this work have a similar behaviour when are simulated in isolation then the interactions were configured using the galaxy models after of isolated numerical relaxation.
4 Simulations
All simulations presented in this work were ran using the code Gadget2 (Springel, 2005). It is a massively parallel TreeSPH code where interactions of collisionless particles like stars and dark matter are followed with a TreePM method while for the collisional fluid an implementation of smoothed particle hydrodynamics (SPH) for an ideal gas, that conserves energy and entropy in regions without dissipation and fully adaptive smoothing lengths is used. The integration scheme is a quasi-symplectic KDK leap-frog with adaptive individual time-steps under a synchronisation scheme. Gadget2 uses a parallelisation algorithm based on a space-filling curve getting high flexibility with minimal implications in tree force errors.
| Run | Halo MG | Disk MG | Bulge MG | Gas MG | Halo SG | Disk SG | Bulge SG | Gas SG | (kpc/h) | (kpc/h) |
|---|---|---|---|---|---|---|---|---|---|---|
| LR | 0.17 | 0.04 | ||||||||
| MR | 0.08 | 0.01 | ||||||||
| HR | 0.06 | 0.007 |
Our runs included basic hydrodynamics with radiative cooling for a primordial mixture of hydrogen and helium (Katz et al., 1996), star formation, galactic winds from supernovae feedback and chemical enrichment, these models are described in Springel & Hernquist (2003). Here, we annotate that although the radiative cooling model used here is not metal dependent, making our simulations not completely self-consistent, the metallicity acts only as a tracer of heavy elements but without any impact on the dynamics of ISM.
To study numerical convergence, in this work have ran simulations at three different resolutions, the low resolution (LR), medium resolution (MR) and high resolution (HR); the number of particles-per-component are summarised in Table 2. These numbers were tuned to make the mass of each gas particle to take values of , and in each resolution. Masses for particles for the stellar disk and bulge were always comparable to minimise two body relaxation effects. In the LR simulations the number of particles for the satellite was modified to increase the particle number of each galactic component in the stream produced during the interaction. In Table 3 we show the mass per particle for each simulation.
| Resolution | ||||
|---|---|---|---|---|
| LR host | ||||
| LR sat | ||||
| MR | ||||
| HR |
We performed 54 LR simulations whose orbits were extracted from the final set of candidate orbits found with the procedure described in subsection 3.2. The aim of these simulations was to find a good orbit for the system AM 2229-735 such that the observational constraints were well reproduced. The best orbit of this set was used to run the MR and HR simulations. The results presented here about the formation and evolution of the tidal stream produced during the interaction corresponds to those analysed in HR simulation, while the LR, MR are used to make a resolution study to determine the impact of discretisation in the evolution of the system.
As it was described in subsection 3.2 we know the trajectory of the centres of mass of MG and SG between the observational point and a point one dynamical time in the past. As each of this orbits is elliptical and in all of them the observational point is achieved after the first pass by the orbit periastron, then we selected the apoastron just before that first periastron to start the simulations. Finally, The running time of these LR simulations was after that initial point and as each simulation produced a trajectory different for the system, the orbit that produced the morphology closer to that registered in the observations of AM 2229-735 was chose to run the MR and HR simulations. The behaviour of the selected orbit and how the morphology of the interaction is reproduced will be described in subsection 6.1.
5 Extracting the tidal streams from simulations
With the aim to study the formation, evolution and properties of the tidal stream produced during the interaction of AM 2229-735, it becomes relevant to separate the particles forming this structure from those belonging to the main and satellite galaxies. Thus, the physics of the stream can be studied considering it as an independent structure within the system AM 2229-735. As we will see in next sections, our simulations show that this stream will form the polar structure around the main galaxy.
We will assume that the stream will be formed mainly by particles coming from the satellite galaxy. Thus, the tidal stream contains mainly particles from each galactic component of the satellite: gas, dark matter, disk and bulge stars and young stars formed in this galaxy during the simulation. Thus we extracted the tidal stream coming from each component separately to study its contribution in the formation and evolution of the polar structure.
The tidal streams from collisionless particles were extracted using a criterion of energy together with a criterion of local density. For each output snapshot of the simulation, the total mechanical energy of particles of SG was computed relative to its centre of mass. Those particles having a positive energy are considered unbound from SG because they were stripped by MG. These particles can fall to the centre or stay orbiting in the MG halo forming the tidal stream.
Then, to identify the particles belonging to the stream we used the fact that the tidal stream is an overdensity in the region where it is located. Using the software Enbid (Sharma & Steinmetz, 2011), we estimate the local density for particles of dark matter halo, in the initial conditions of MG, and use it to build a curve of mean density as a function of the position. Then, for each snapshot of the simulation we calculated the local density for all particles that were labelled as unbound from SG, thus we define that a particle belongs to the tidal stream if its local density is larger than the local mean density of the dark matter halo of the MG at the position of the particle.
With the previous procedure we can identify the collisionless components in the stream. As an example we show in Figures 6 and 7 the X’Y’ and X’Z’ projections in a plane oriented with the angular moment of the stream, the panels labeled with dark-matter, disk stars, bulge stars and young stars depict the stream subtracted from the simulation at , , and respectively. The plots clearly show that this method is successful to find the stream of the collisionless components. However, in order to avoid the inclusion of particles from the MG (new stars or gas particles) we reject from the stream any particle that is at a distance, measured from MG centre, smaller than times the scale lengths of the MG. In this way we keep all our attention on the material deposited in the stream from the satellite galaxy only.
Gas may be diluted in the galactic halo because heating induced by different physical mechanisms. This hot atmosphere may complicate the identification of cold gas gravitationaly bound to the stream. In order to find the gas belonging to the stream, we will focus our attention on the gas that is distributed alongside with the collisionless particles. Then we define the gas in the tidal stream as these gas particles inside the volume defined by the stream of collisionless particles forming the tidal stream.
In order to do so, once the stream defined by collisionless particles is identified, we use the particle distribution (in such a stream) to build a Delaunay tessellation. The tessellation will define the volume enclosing the stream. Any gas particle inside any of the tetrahedron defined by the collisionless particle distribution should also belong to the stream.
In the panels at the left in Figures 6 and 7 we show the X’Y’ and X’Z’ projections of gas stream at , , and from top to bottom respectively. As it can be seen in the figures, the method is successful to identify the gas inside the stream. Note, however, that this gas stream will have particles of gas coming from tidal stripping or gas that was there in the hot gas halo of MG.
6 Results and discussion
Now we present the results of the simulations that we use to study the evolution of AM 2229-735 to get clues about its fate and to study if the formation of a polar structure is possible in this system, and if it is the case, what are its structural properties.
6.1 General aspects of the evolution and reproduction of observables
First we show the system global features depicted in our simulations generated by the galaxies following the orbit that best reproduce the observed constraints, these characteristics were studied with the HR simulation that ran during .
The first thing we have to do is to be able to track the satellite orbit during the simulation. We do so by tracking the most bound particles in the satellite. We first identify the set of the most bound five hundred particles at (relative to the centre of mass of SG), and then track that set of particles across all snapshots tracing the orbit of the satellite’s core while the merger happens.
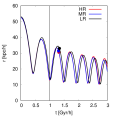
Figure 3 (left panel) shows the satellite distance to the MG’s centre as a function of time, the red line corresponds to the SG distance in simulation HR. The satellite begins a quasi periodic orbit with regular crosses by periastron each . This closed orbit changes in time due to the effects of dynamical friction and tidal stripping. An important aspect to note is that after a complete merger does not happen despite satellite mass is decreasing at all times during the merger. SG’s core describes an orbit revolving around the main galaxy, the energy of this orbit is such that the satellite is not swallowed by the main galaxy and does not transfer all its material to it. The red match point shown in the left panel of Figure 3 marks the time in the simulation where this reproduces the observational constraints and the current state of the merger morphology. This matching with observations happens after the satellite passes by second apoastron at time after starting the simulation.
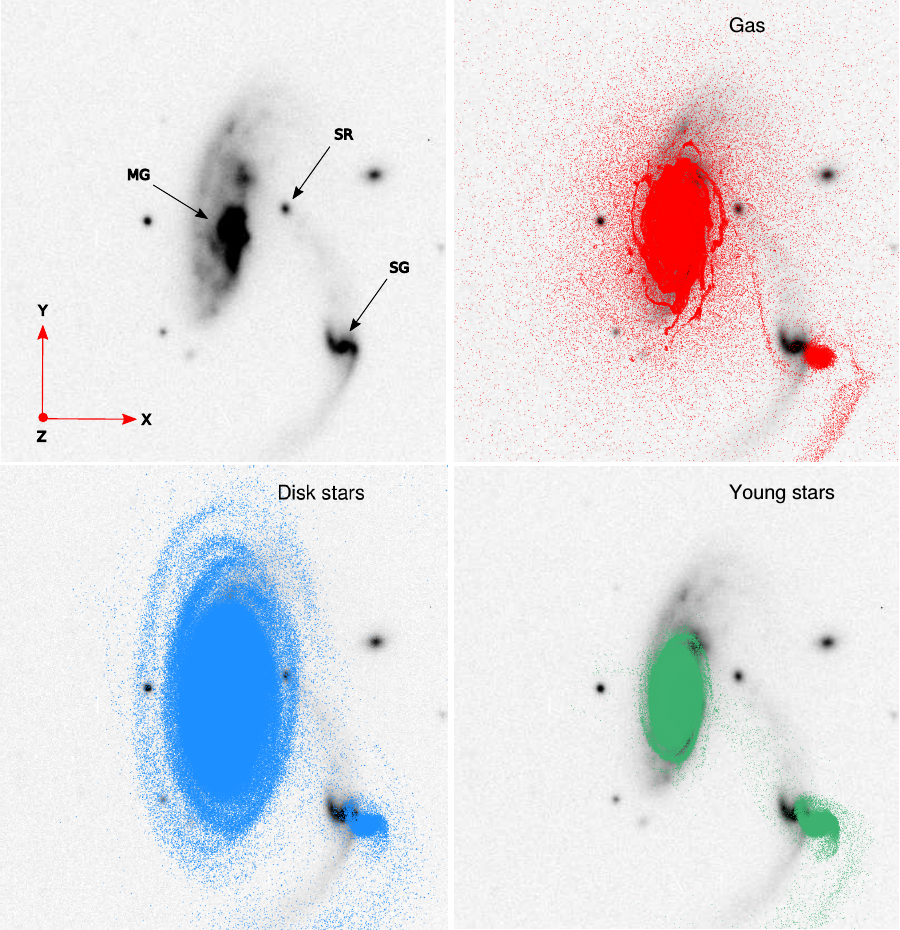
In Figure 4 we show the XY projections of different galactic components in the simulation for both galaxies at the match point overploted on the observed system. In left-top panel is the image of AM 2229-735, this image is used as background for the other panels where are superimposed points corresponding to gas (right-top), stellar disk (left-bottom) and young stars (right-bottom). The stellar components display arms with a shape very close to observations, the main galaxy disk developed a large arm after the passage of the satellite that at match point has a position very close to observed one. The same happens with the spiral arms exhibited by the satellite, they are developed during the interaction and have a shape and orientation similar to those found in the observations. Additionally, all galactic components show a bridge of material between galaxies at this time instant, this result is in agreement with observations where gas, old and young stars content were detected in the tidal streams of the system (Ferreiro et al., 2008; Freitas-Lemes et al., 2014). Finally, no structure like the especial region (SR) is formed in our simulations, this leads us to think that maybe that region is a field object and does not belong to the system AM 2229-735.
As it is observed in Figure 4, the position of the satellite and tidal stream do not match perfectly, this is expected by us because the procedures described in subsection 3.2 only gives a set of possible orbits for the system, then the orbit selected is a good orbit to reproduce the main morphological features of the interaction but clearly is not the exact orbit for AM 2229-735. Nonetheless, that we achieve to reproduce the main morphological characteristics is a sign that the procedures presented in subsection 3.2 are useful to reconstruct the orbit of the system. As the procedures used to get the possible orbits for AM 2229-735 are independent of the system, these can be used for any other observed minor merger provided that the observational constraints of , galaxy masses and orientation angles for the galactic disks are known, and assuming that the merger is not in a very advanced state of evolution.
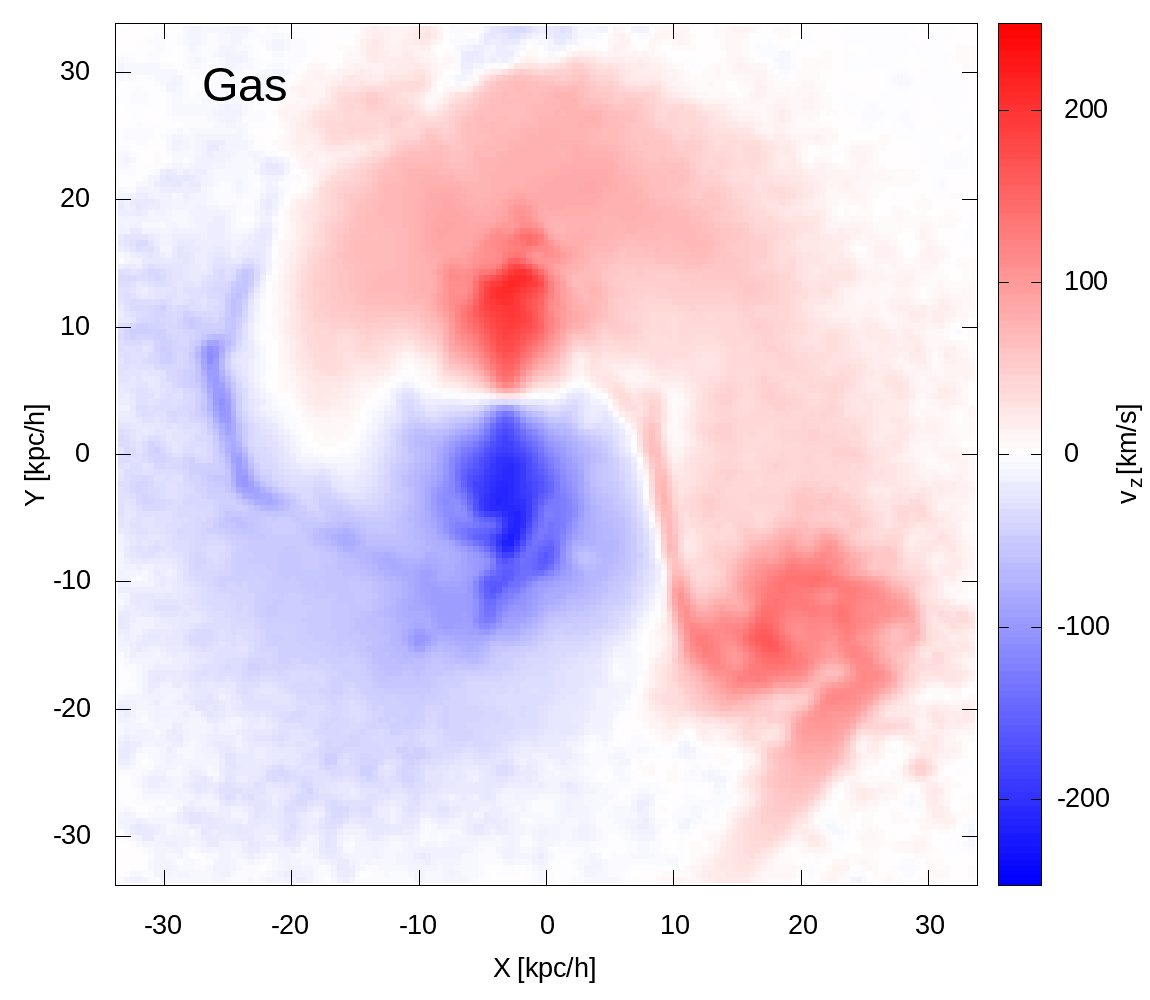
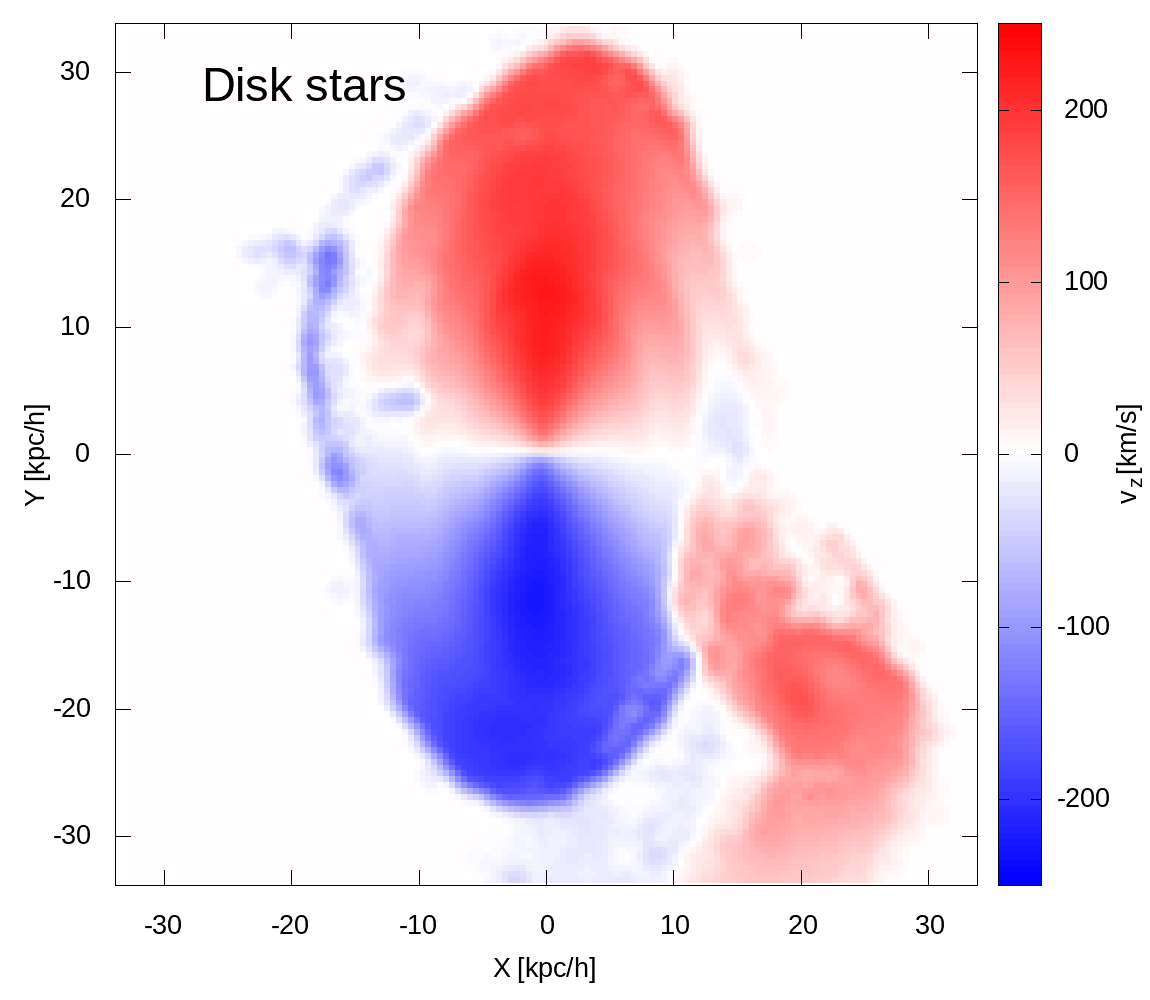
Besides the appearance of the merger, depicted in figure Figure 4, one could be interested in the observed velocity field of the system. In order to approach what one could observe if were able to observe the full velocity field of the system, in Figure 5 we draw the velocity field projected along the line of sight for the particles in the stream from gas (top-panel) and disk stars (bottom-panel). These plots show the mean velocity computed in cells of . Each field is over-ploted on top of the the XY projection of disk stars or gas in the simulation at mach point. Here we can see the range of velocities of the material forming the stream that finally will form the polar structure. These values could be compared with observations of tidal tails observed in minor mergers.
6.2 The formation of the polar structure of AM 2229-735
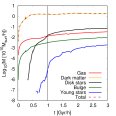
As we mentioned before, the satellite looses mass while orbiting the main galaxy, this mass is both dark matter and baryonic particles that originally belong to the SG but that are tidally stripped falling to MG forming a tidal stream around it. The right panel in Figure 3 shows the mass of the different components in the tidal stream formed by particles stripped from the satellite at each time. Each curve corresponds to the total mass stripped from each component of SG that forms the stream. Note that the tidal stream is formed with particles from all galactic components: dark matter halo (yellow line), gas (red line), bulge (green line), stellar disk (black line) and young stars (blue line), being the dark matter its more massive component. We found that at the tidal stream contains the of the initial dark matter halo mass from SG. We found also that the stream contains of the old stars, of young stars and of gas from the initial satellite mass.
As it can be seen from Figure 3, considering the contribution from all components, the stream gets almost all its mass after the second passage by the periastron at . After that, the increase in mass is not significant. Of particular interest, is the contribution of mass of young stars in the stream after . These particles were created by star formation processes in the satellite disk and then stripped to the stream. No formation of new stars in the stream is observed in our simulations.
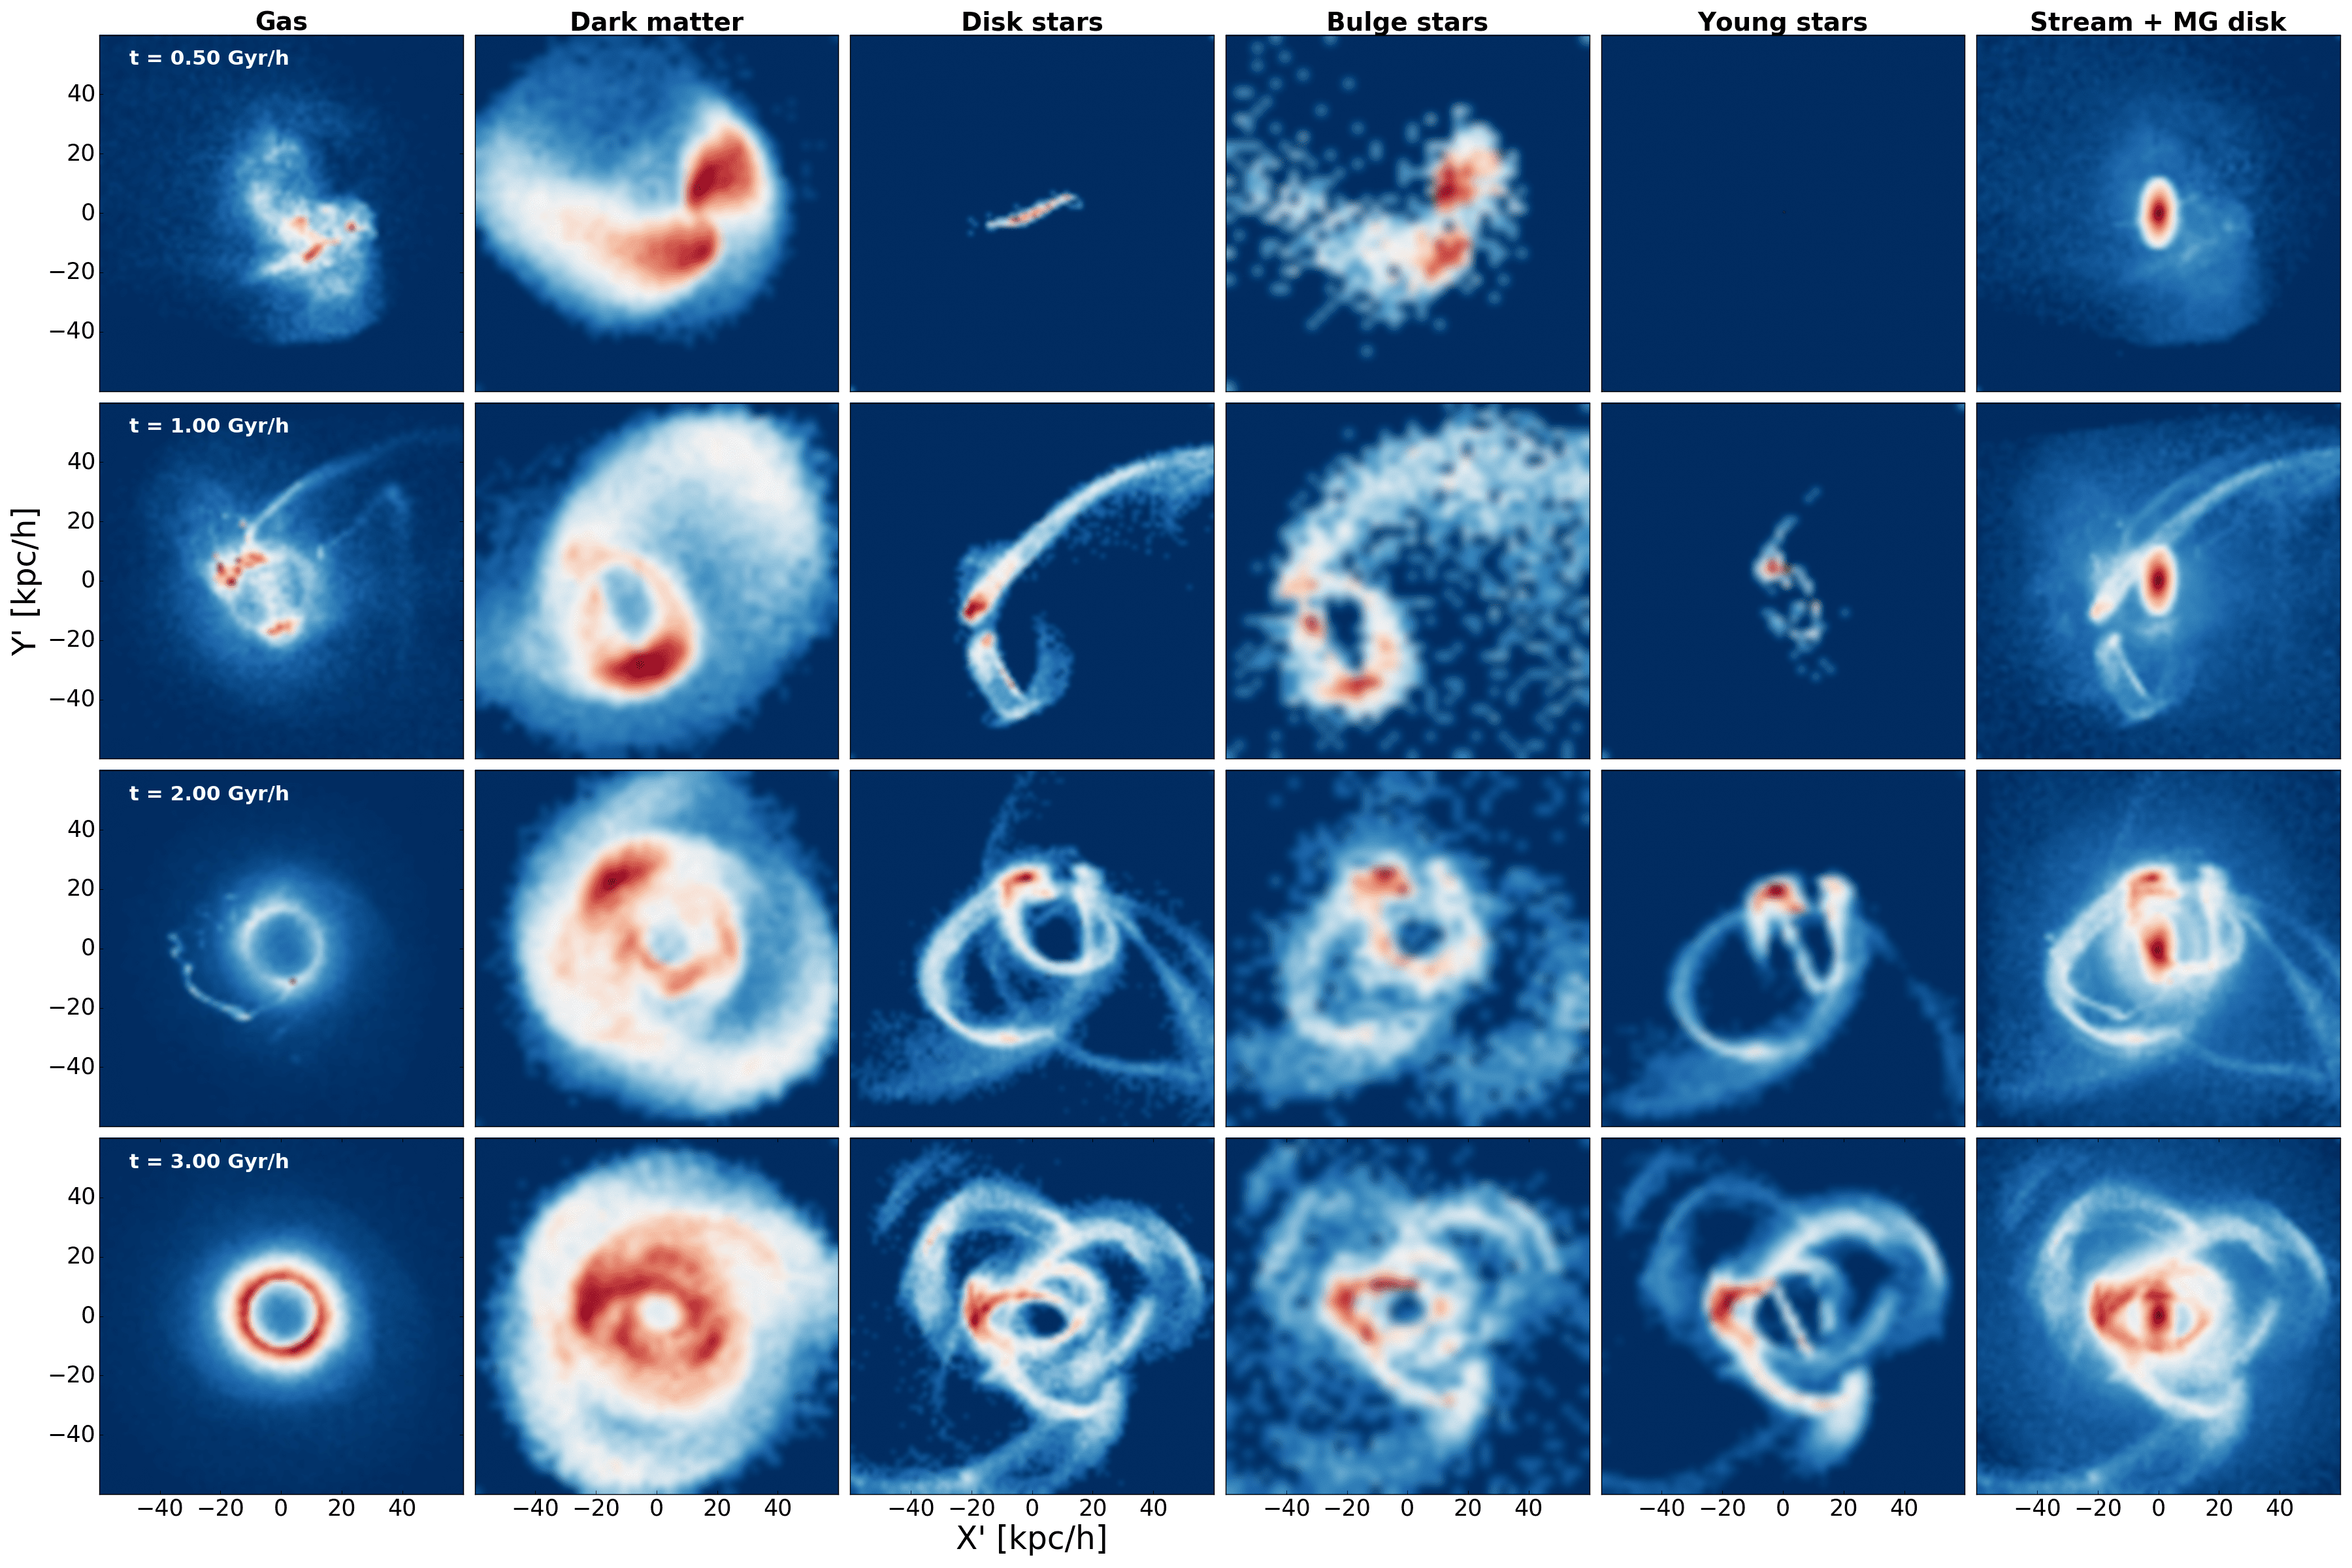
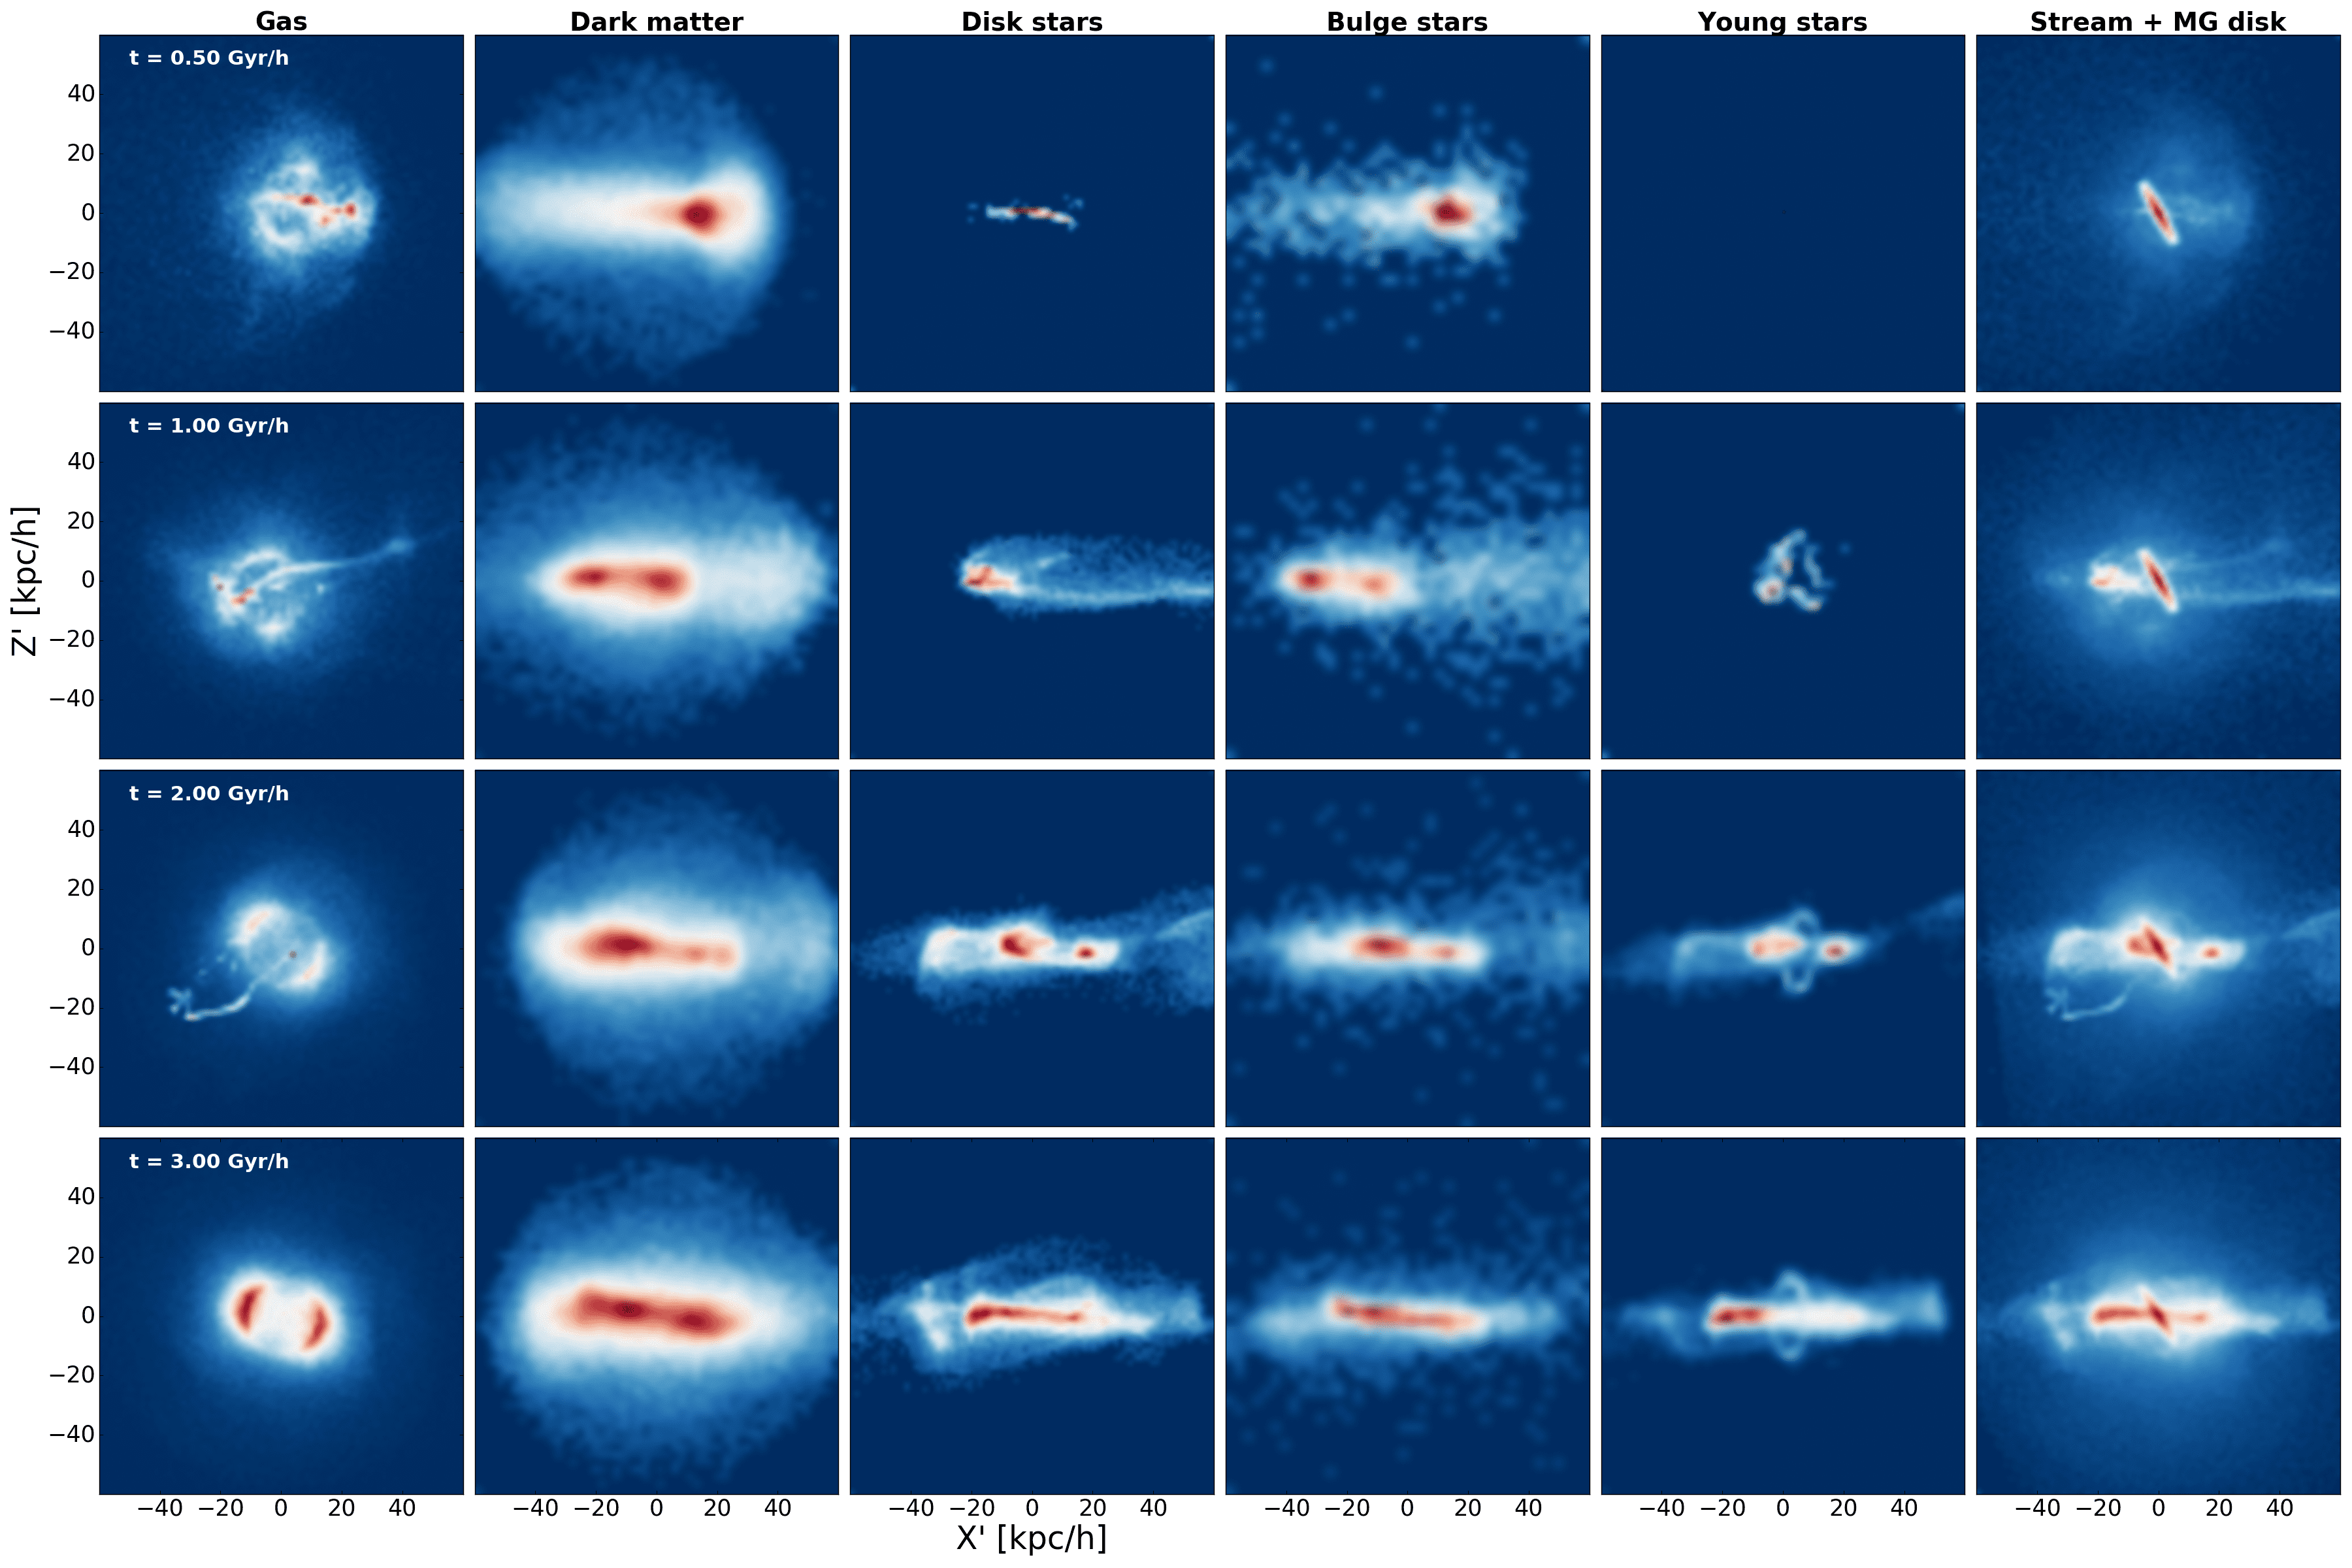
Now, let’s see how the mass distribution of the tidal stream forms a polar structure around the disk of the main galaxy as it was suggested in Freitas-Lemes et al. (2014). For that, in Figures 6 and 7, we plotted projections and respectively, of particles forming the stream separated by the galactic component where they were originally bound in the satellite galaxy. The figures are presented in the coordinates , with centre at the centre of mass of MG, of the particles in the stream after rotations such that the angular momentum of the stream points along the axis, thus, we are showing its face-on and edge-on views. In the panels of these figures we see, from top to bottom, the formation and evolution of the stream during the interaction as visualised for times , , and after the start of the simulation. For these images the colour code is scaled by density and we show the tidal stream by components, from left to right, gas, dark matter, stellar disk, bulge, young stars and the stars and gas stream together to MG stellar disk particles (for a reference).
Gas mass is present in the stream by two processes; first, a fraction of gas mass in the galactic disks of both galaxies is expelled from them due to supernovae feedback and winds. In our simulations we used a strong galactic wind isotropically distributed around disks and its mass depends on the efficiency of production (Springel & Hernquist, 2003). The second process is gas stripped out from SG forming gas tails that are observed in the panels of first column of Figures 6 and 7. One of those tails formed after second passage by periastron is part of the bridge shown in Figure 4 and it is currently observed. Part of those particles settled down in to a rosette that together with the other components are forming the polar structure.
The particles of dark matter, stellar disk and bulge form a rosette around the main galaxy, this structure begins its formation with the passage of the satellite by first periastron and at a time of around its final shape is already defined. A very notorious characteristic of this structure is its planar distribution, following these components in time it is clear that while the rosette formation happens the material accommodates in a plane that in our projections matches with the plane. This is due to the fact that the orbital initial conditions are such that the stream inherits part of the orbital angular momentum of the satellite conserving its direction producing a planar structure.
The young stars, that as we described before formed in the satellite gaseous disk, were stripped and appear in the tidal stream after with a distribution similar to the distribution assumed by the stars from the stellar disk. Thereby, a polar structure with mass of dark matter, gas and old and young stars forming a rosette in a plane is produced during the interaction with an inclination almost perpendicular to the main galaxy disk. In panels of the last column of Figures 6 - 7 we plot the projections of stellar disk of MG together to the polar structure formed with the stars and gas from satellite galaxy. The projection of the polar structure and the stellar disk of MG at depicts an appearance similar to those galaxies classified as PRGs, for example, NGC 4650.
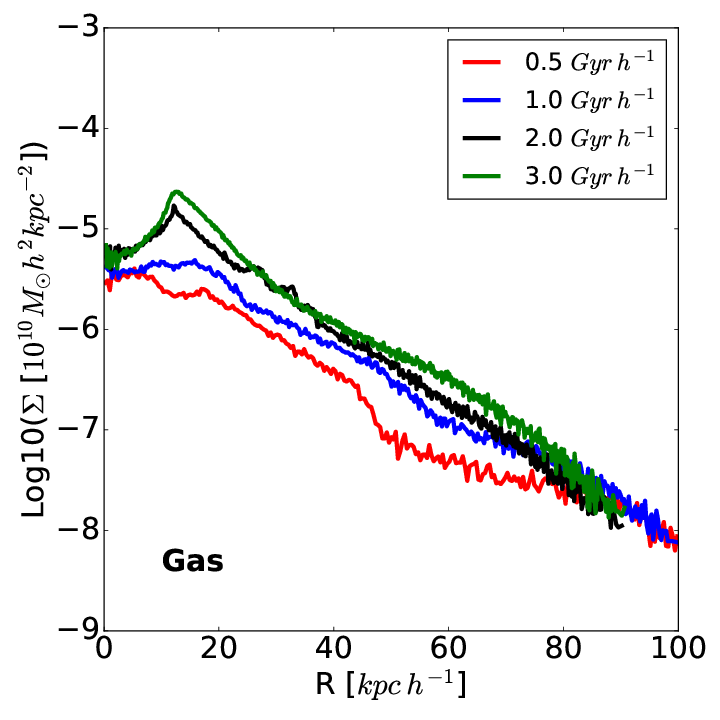
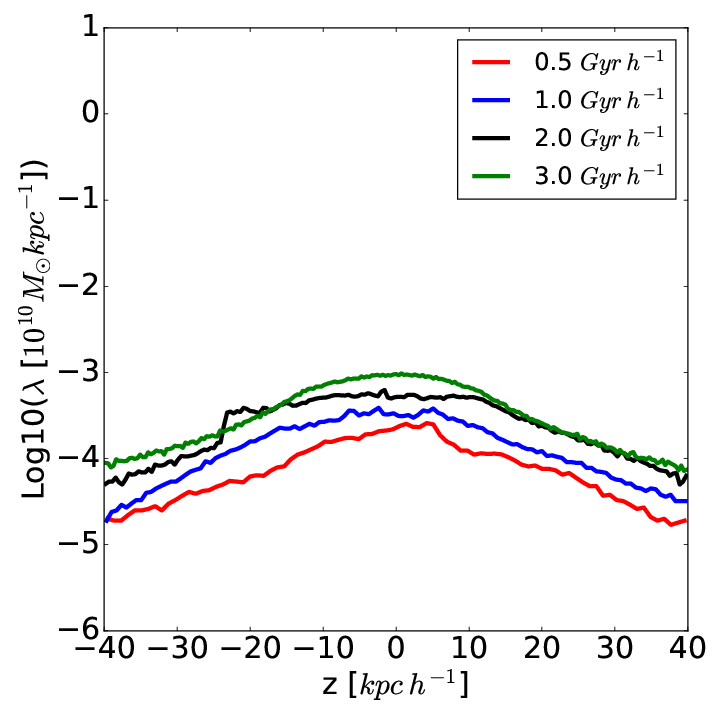
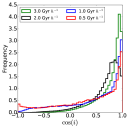
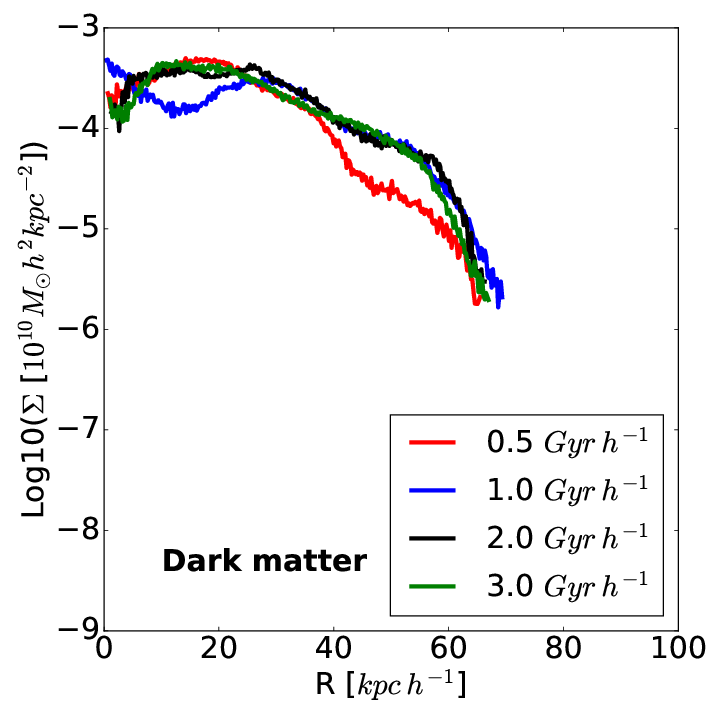
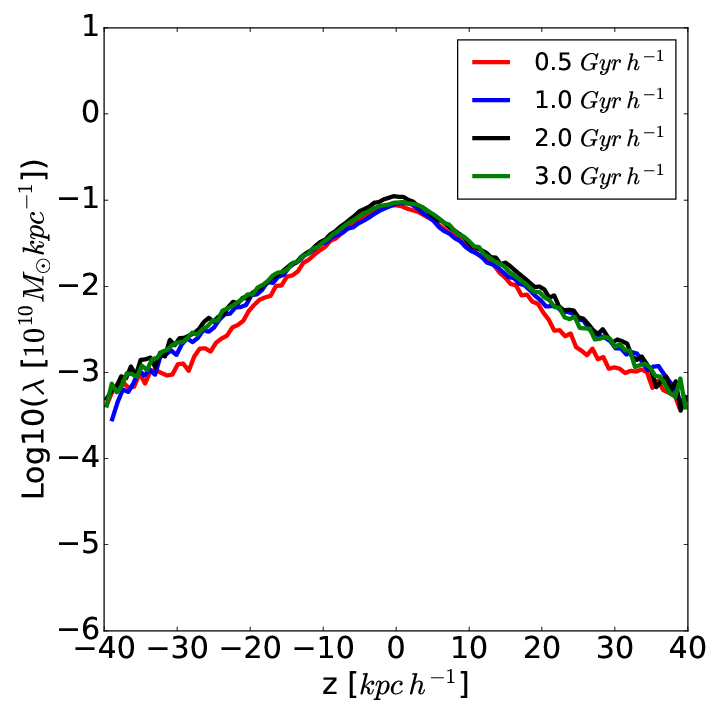
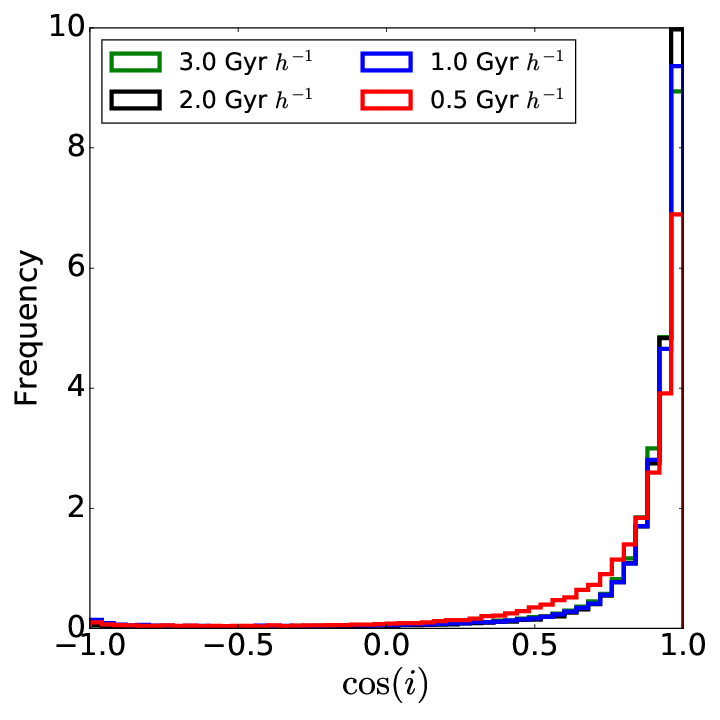
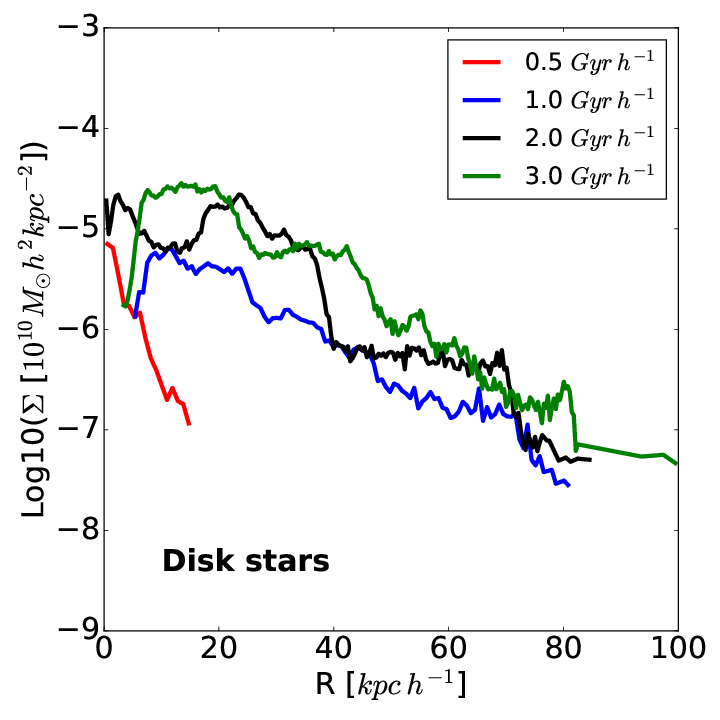
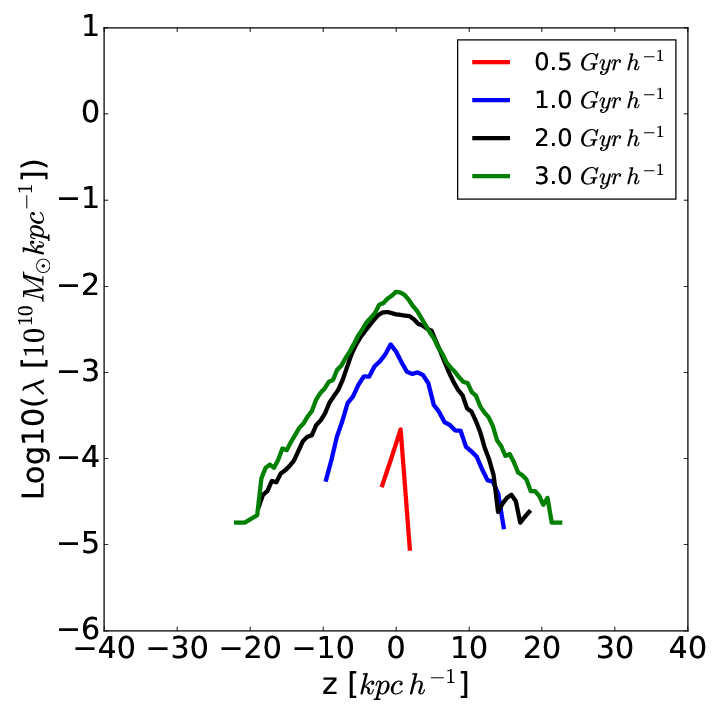
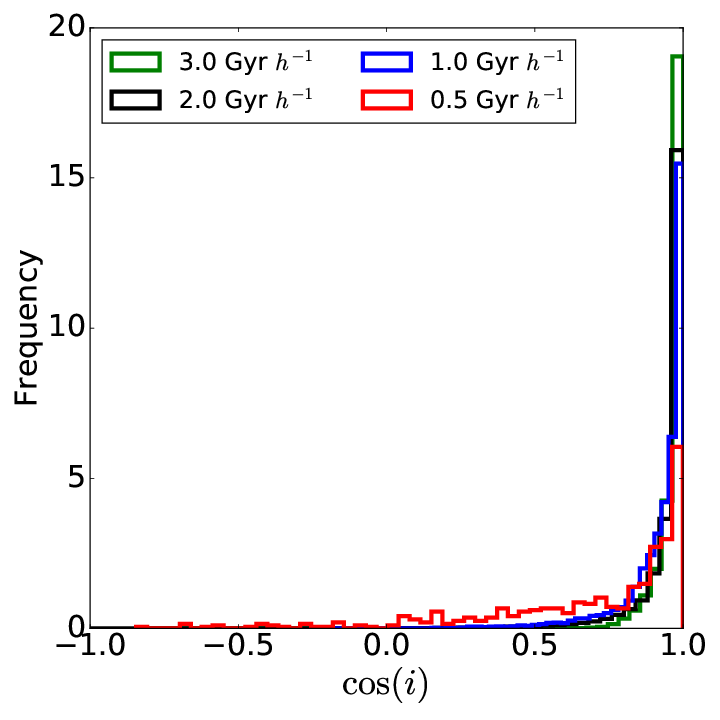
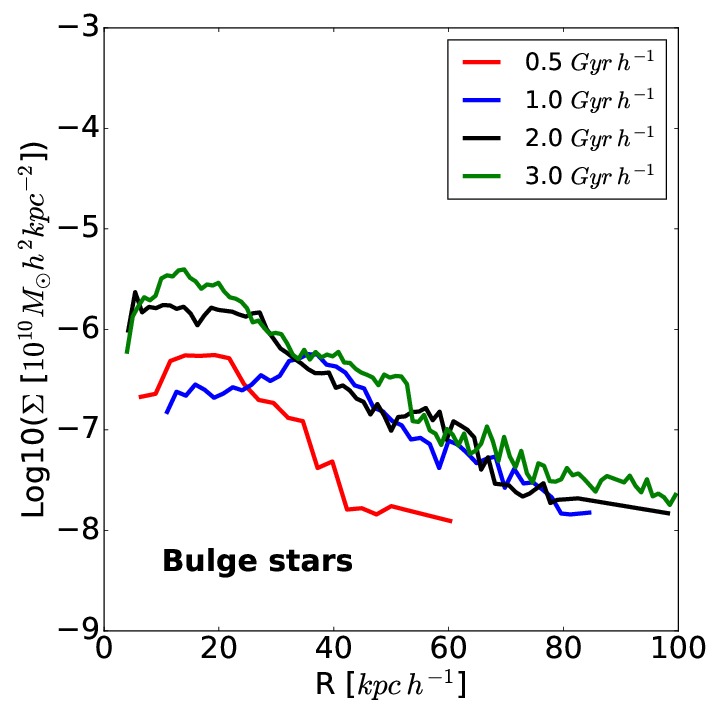
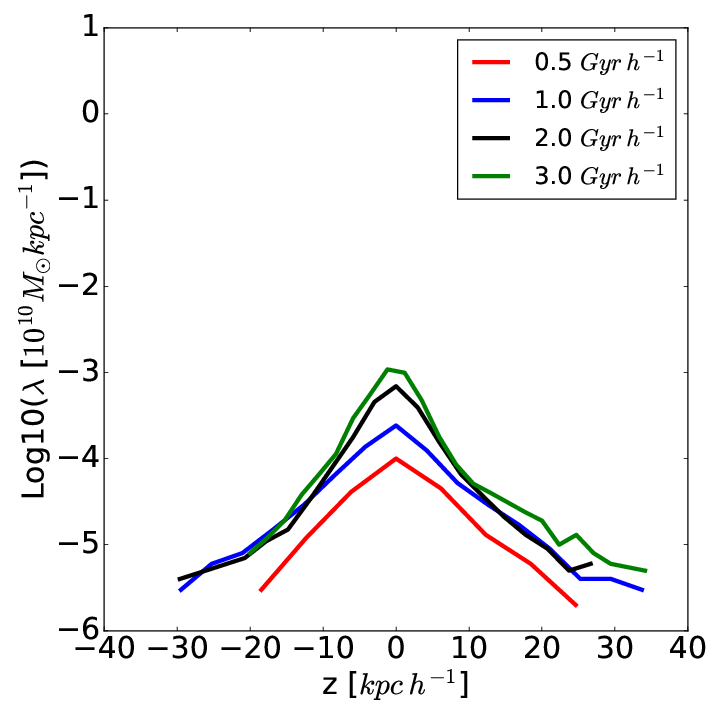
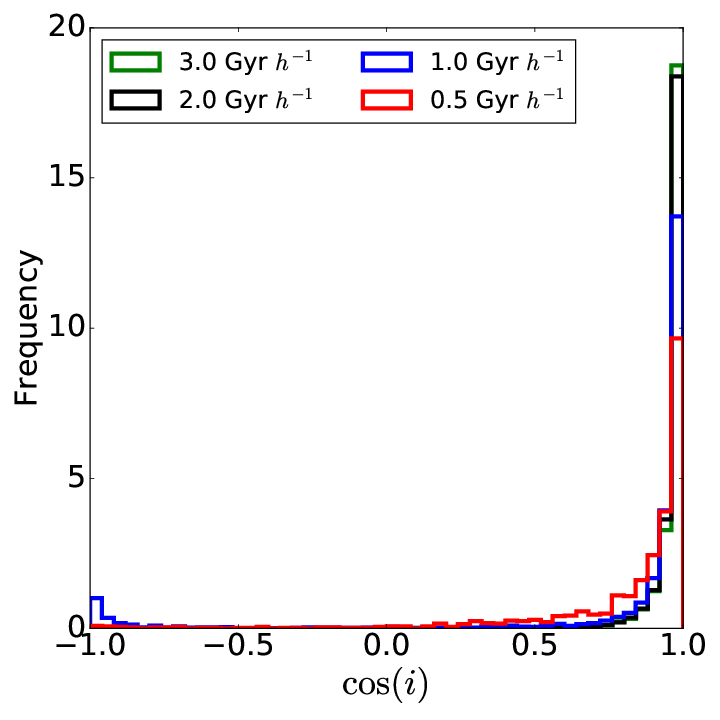
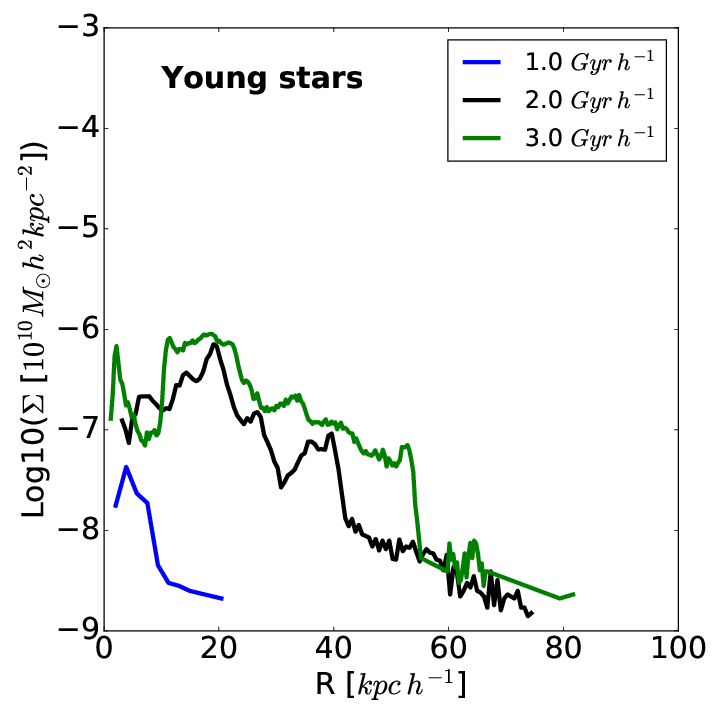
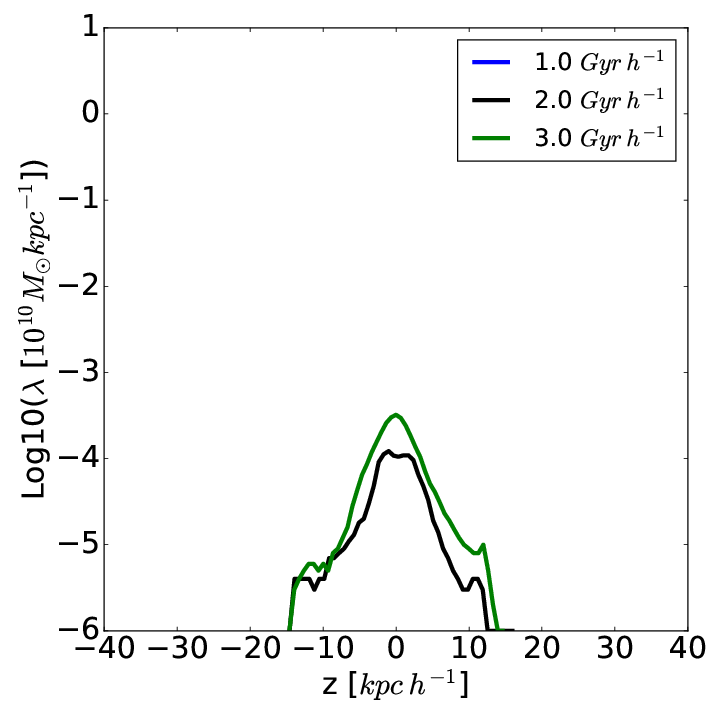
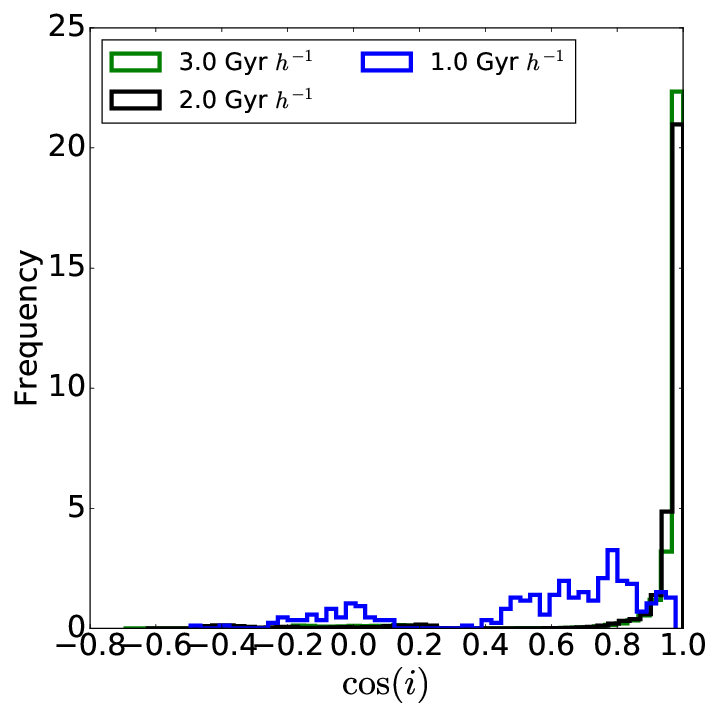
To analyse a bit more this polar structure we study its mass distribution using surface and vertical density profiles in the coordinate system . Additionally, we determine the inclinations of the orbits of these particles relative to the galactic disk of MG. For that, we compute the angular momentum of each particle relative to the stellar disk of the main galaxy. Then, we compute the inclinations as the angle between the angular momentum of each particle and the angular momentum of the stellar disk of MG. Figure 8 shows, from left to right, the surface density profile, vertical density profile and distribution of cosine of inclinations of particles from each galactic component at times , , and .
The average surface mass distributions shows an interesting trend to form an exponential distribution like a disk. The surface density profile of gas depicts a distribution clearly exponential between . Dark matter, stellar disk and bulge components exhibit a tendency to form an exponential distribution with peaks in regions where the rosette has maximum of density. For new stars the trend is not so strong yet, but particles of this component always get the behaviour of those from stellar disk component.
Additionally, comparing the shape of the vertical density profiles with those shown in Figure 2 reminds very much the behaviour of a structure with isothermal vertical support. We see that the different components of the material in the polar structure, all of them evolve in time getting a vertical distribution with a shape typical of a thick disk (Binney & Tremaine, 2008). This is an indicator of gravitational support that may suggests a long standing structure. The structure formed with particles of dark matter acquire this gravitational support very quickly at , as this component has the largest contribution to the mass in the stream this could guarantee the gravitational support of all the structure. Particles from the other components get the form of the vertical distribution after .
The gravitational support is generated by the formation of the planar structure with rotational support that is observed in the distribution of cosine of inclinations for particles in the stream. Particles in the stream, specially of gas, begin with orbital inclinations distributed in all directions with co-rotating and counter-rotating orbits relative to the rotation of the MG disk, then by conservation of angular momentum almost all orbits become co-rotating with cosine of inclination close to one, i.e., all stream forms a structure perpendicular to the MG disk. This result leads us to claim that possibly the system AM 2229-735 will evolve to a polar ring galaxy.
6.3 Dynamical structure of the polar disk
As it was already mentioned, Figure 8 shows that the average density distribution of the material in the polar structure settles in a disk-like structure that follows an almost exponential profile in the radial direction and in the vertical direction behaves in a way that suggest the behaviour of an isothermal system.
The simplest solution of Jeans equation for an axisymetric system in equilibrium with an isothermal energy distribution is
| (4) |
where is a constant and is the vertical scale length of the disk and is related to the vertical velocity dispersion of particles in the disk. A solution to the problem shows that in general is not a constant function and depends on the distance from the centre of the galaxy through the radial surface density according to
| (5) |
then in principle, for an isothermal sheet, should follow an exponential law with a scale length that is twice that of the surface density profile.
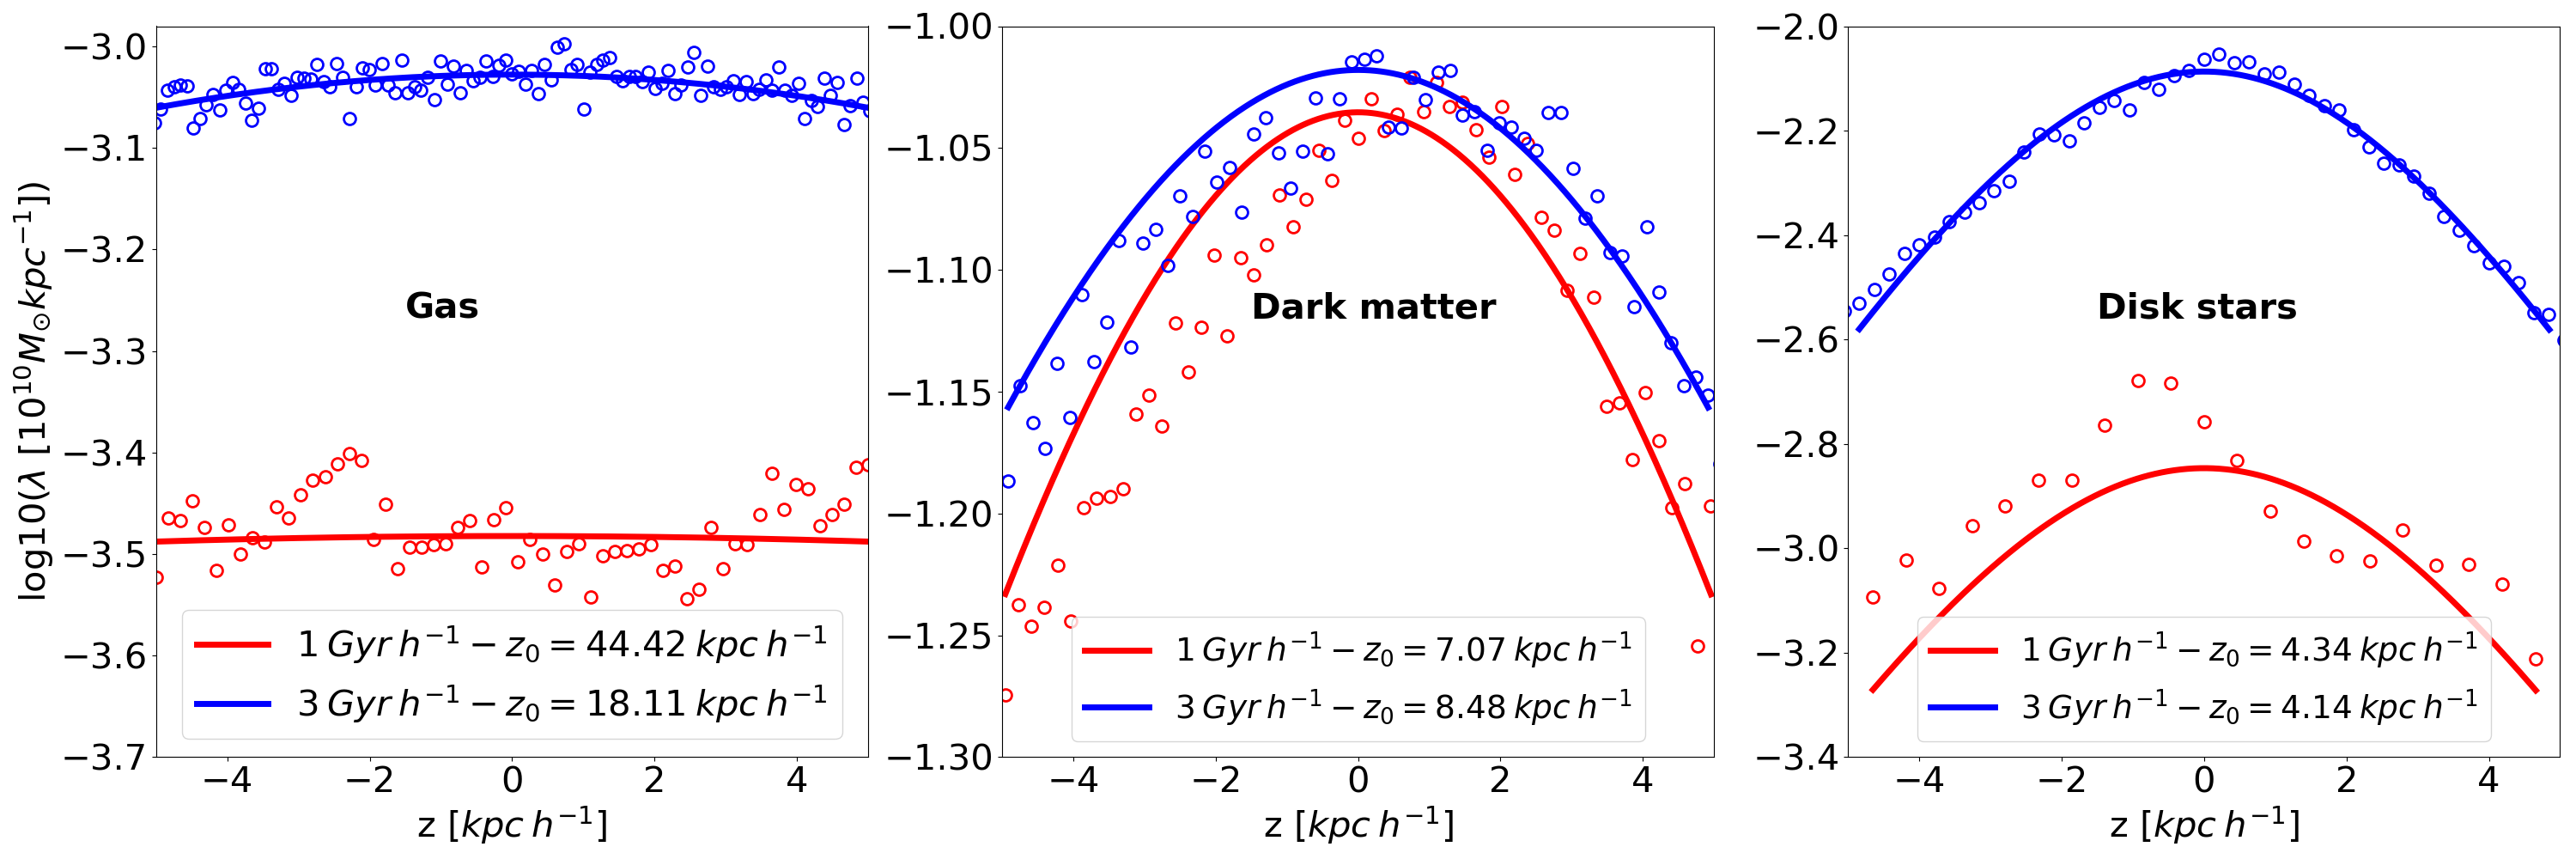
Figure 9 shows fits to equation 4 of the vertical density profile of the different mass components in the polar structure. The figure shows the fit for these components at two different simulation times of and . As it can be seen in the figure, the vertical structure is very well described by this profile for the major components of the polar structure, and as it can be observed in this figure and in figure 8, the structure tends to a particular distribution.
In order to study the dynamical conditions of the material in the stream we study the mean velocity field of the particle distribution. If we assume that the system is axisymetric, the mean radial and vertical velocities should be around zero if the system is in steady state. The azimuthal velocity should be larger than zero indicating rotational support.
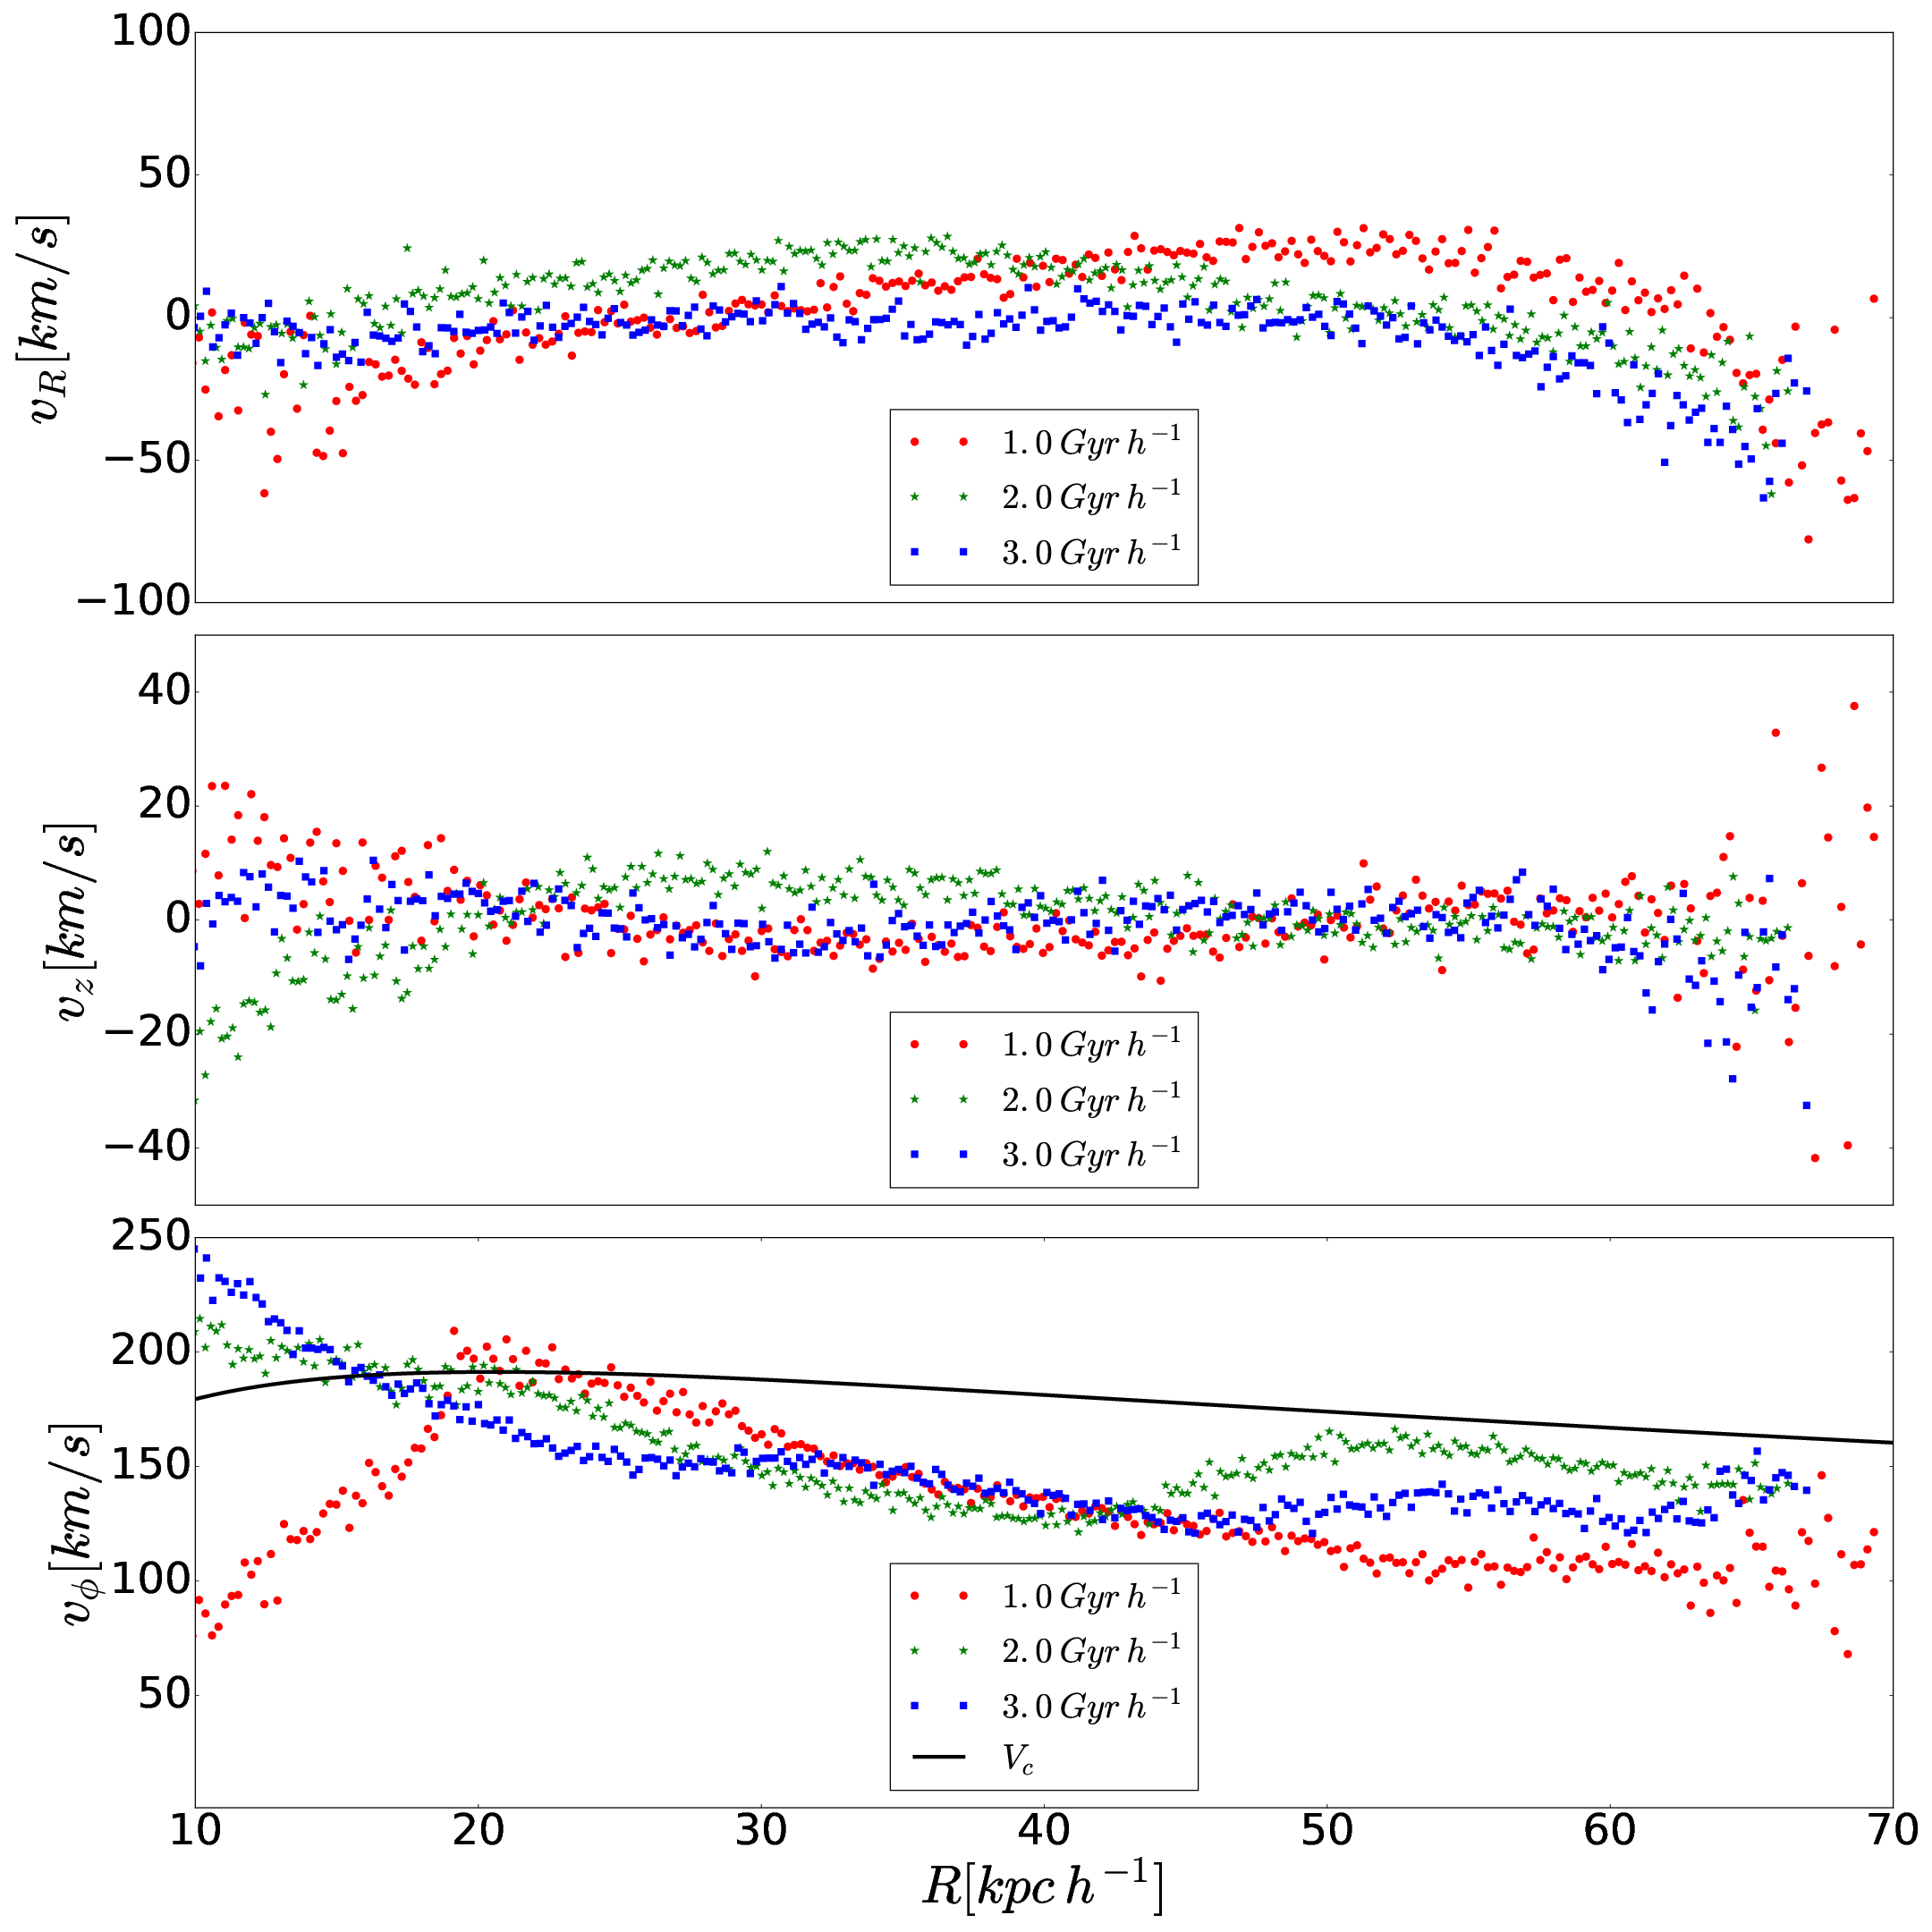
Figure 10 shows the mean radial, vertical and azimuthal velocity , of dark matter particles in the stream as a function of the distance from the centre of the disk structure. Similar plots can be obtained for gas and stars. As it can be seen, the mean vertical and radial velocities decrease in time to zero at . Not the same behaviour is observed for the azimuthal mean velocity that clearly follows a keplerian-like curve. The solid line shows the estimated circular velocity of the dark matter halo of the host galaxy in the same radial regime, showing that the particles in the polar structure tend to move under the influence of the potential of the host dark matter halo. That and tend to zero at latter times suggest that the structure is going towards a configuration of equilibrium, and the observed behaviour on indicates that the equilibrium configuration is supported (or partially supported) by rotation.
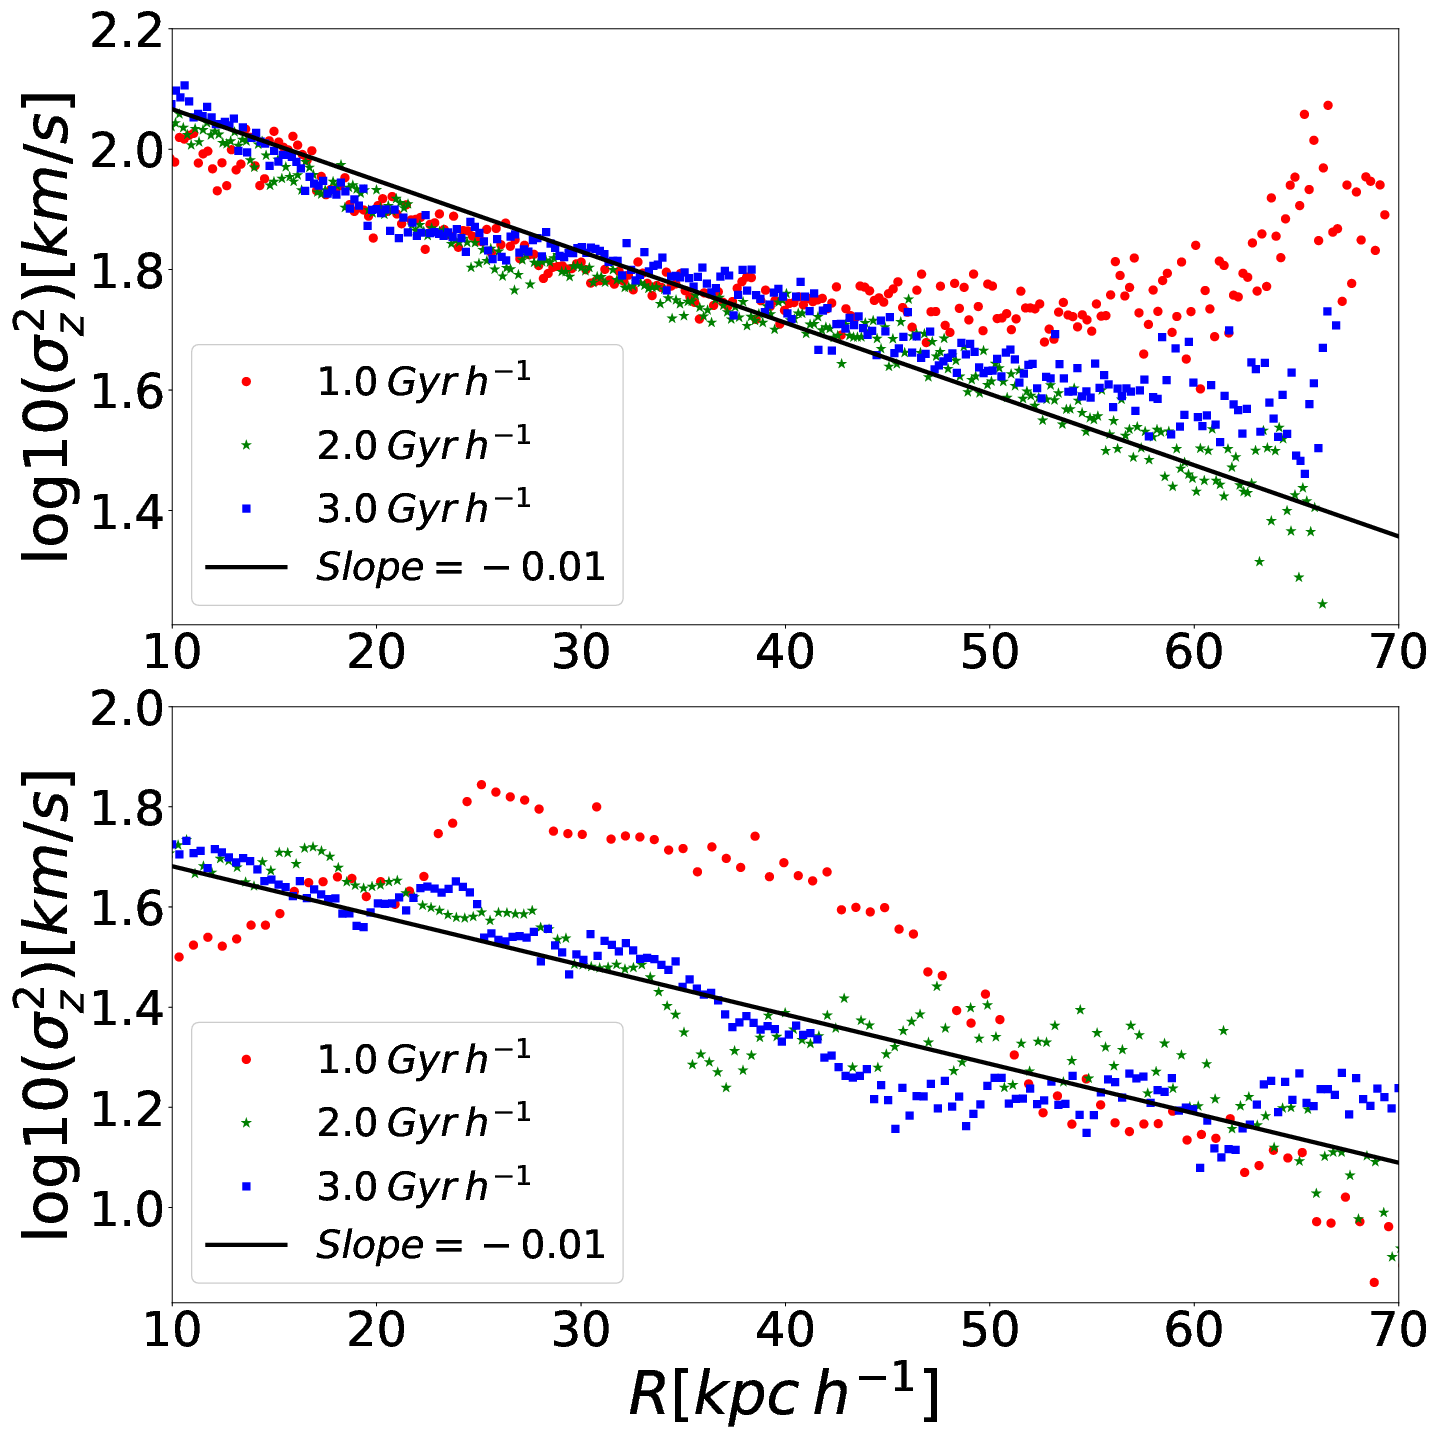
Figure 11 shows the vertical velocity dispersion as a function of distance from the centre of the polar structure for different times. As it can be seen in the figure, the larger the time, the closer the relation to the exponential profile. In agreement with the previous figures, this shows that the structure is looking for equilibrium. That follows this behaviour, according to Equation 5, suggest that the polar structure approaches a rotational support that at some degree can be approximated with an isothermal axisymetric system.
Since the HR simulation was ran just until of evolution of the system, we can not see how things evolve in a larger timescale at this resolution. However LR simulation was ran for up to , and even with the low resolution simulation, the system still shows the same behaviour in such a large period of time. This result suggest three interesting implications. First, that polar ring structures such as those observed in NGC 4650 tend to find equilibrium conditions that are similar to those of the disk galaxies. Second, this scenario and the result of these simulations, in general, are suggesting the way stellar disks are formed in the hierarchical scenario. Third, and more important, is that we see in our simulations that there is a major contribution of dark matter in the mass distribution of the polar structure. Although it is out of the scope of this work to determine under which conditions this may be observable, being able to measure precisely the motion of stars and gas in these structures would provide evidence of the presence of dark matter in the structure, turning in a new kind of experimental scenario for the detection of dark matter in galaxies.
7 Conclusions
In this work we have used observational constraints and numerical simulations to study a possible scenario for the evolution of the real system AM 2229-735 towards the formation of a polar ring galaxy.
We used the kinematic information of the galaxies in the system AM 2229-735 to apply a method to find a good orbit to simulate their interaction (subsection 3.2). This method can be used for any observed minor merger with enough information to estimate the interaction kinematics and masses of the galaxies in the system.
With this orbit we ran a high resolution simulation and studied the formation and evolution of a polar structure. We reproduced the main observed morphological features of system as the arm in main galaxy, arms in satellite galaxy and the material bridge connecting them, these features were obtained after the second pass by periastron of SG at . The tidal stream formed during interaction contains gas, dark matter, old and young stars coming mainly from SG by tidal stripping, while the satellite orbits without being swallowed by the host. This stripped material inherits the orbital angular momentum from SG and a rosette-like on a plane almost perpendicular to MG disk is produced forming a galaxy with a polar structure, a polar ring galaxy.
In order to check for the quality of our results we performed a careful resolution study running simulations at three different resolution levels (see Appendix A). We found that the global properties of the interaction as the system observation features and the formation of the polar structure are achieved in the three simulations. We found that the results from the simulations tend systematically to a fixed result with increased resolution, as it is the case of the structure of the orbit (see Figure 3). The same trends were observed for other quantities such as mass accretion and dynamical conditions in the polar structure. Therefore we are confident that our conclusions are robust against the effects of numerical discreteness.
In this work we have found that, after modelling the evolution of a realistic system, it is possible to form a polar disk structure as the result of a minor merger of galaxies. However, we go one step further and use the results of our simulations to study the dynamical conditions of such a structure. In doing so we found evidence that suggest that these polar disk structures can be approximated as isothermal axisymetric systems, very much like a classical stellar disks. We found that in the time, the structure looks for equilibrium acquiring a vertical structure very much reminiscent of a stellar disk. This result has different interesting implications. First, knowing the dynamical nature of the polar structure is itself an interesting result since it provides information about the physical conditions under which the material in the structure is evolving. Second, this process of formation of polar ring structures can be used to understand the origin of stellar exponential disks in the universe, a problem that is still yet to be solved. And third, it is interesting to note that in our simulations there is a major contribution of dark matter in the polar ring structure. The results presented here suggest that observations of stellar kinematics of polar ring galaxies may serve as an scenario to search for dark matter in this kind of objects, providing a different observational experiment for the search of dark matter in galaxies.
Finally, our simulations have included feedback, star formation, etc. We have incorporated these effects in our simulations with the aim to provide realism to the simulations, but trying to keep the scope of the work close to the subject of the formation of the polar structure and its properties, we have not focused our attention on the subject of the dynamics of gas and star formation in the merger remnant. In a work under preparation (Quiroga et.al. in prep) we study the effects of feedback in the formation of stars in the merger remnant and the polar structure. Despite not considering it in this work, we are confident that the effects of the baryon physics should not affect our conclusions since most of the gross dynamics is dominated by collisionless particles.
Acknowledgements
This research work was supported by COLCIENCIAS (doctorados nacionales, convocatoria 617 de 2013) and the research project 111571250082 (convocatoria 715-2015). N.I.L acknowledges financial support of the Project IDEXLYON at the University of Lyon under the Investments for the Future Program (ANR- 16-IDEX-0005). I.R. thanks the Brazilian agency CNPq (Project 311920/2015-2). Additionally, simualtions performed in this work were run in the computer facilities of GFIF in the Instituto de Física, Universidad de Antioquia, Hipercubo at IP&D-UNIVAP (FINEP 01.10.0661-00, FAPESP 2011/13250-0 and FAPESP 2013/17247-9), Leibniz-Institut Für Astrophysik Potsdam. The authors gratefully acknowledge the Gauss Centre for Supercomputing e.V. (www.gauss-centre.eu) for funding this project by providing computing time through the John von Neumann Institute for Computing (NIC) on the GCS Supercomputer JURECA at Jülich Supercomputing Centre (JSC).
References
- Arp & Madore (1977) Arp H., Madore B. F., 1977, Royal Astronomical Society, Quarterly Journal,, 18, 234
- Arp & Madore (1987) Arp H. C., Madore B., 1987, A catalogue of southern peculiar galaxies and associations
- Bekki (1998) Bekki K., 1998, ApJ, 499, 635
- Bell et al. (2003) Bell E. F., McIntosh D. H., Katz N., Weinberg M. D., 2003, ApJS, 149, 289
- Benson (2010) Benson A. J., 2010, Phys. Rep., 495, 33
- Binney & Tremaine (2008) Binney J., Tremaine S., 2008, Galactic Dynamics: Second Edition. Princeton University Press
- Bournaud & Combes (2003) Bournaud F., Combes F., 2003, A&A, 401, 817
- Brook et al. (2008) Brook C. B., Governato F., Quinn T., Wadsley J., Brooks A. M., Willman B., Stilp A., Jonsson P., 2008, ApJ, 689, 678
- Catinella et al. (2010) Catinella B., et al., 2010, MNRAS, 403, 683
- Combes et al. (2013) Combes F., Moiseev A., Reshetnikov V., 2013, A&A, 554, A11
- Donzelli & Pastoriza (1997) Donzelli C. J., Pastoriza M. G., 1997, ApJS, 111, 181
- Ferreiro & Pastoriza (2004) Ferreiro D. L., Pastoriza M. G., 2004, A&A, 428, 837
- Ferreiro et al. (2008) Ferreiro D. L., Pastoriza M. G., Rickes M., 2008, A&A, 481, 645
- Freitas-Lemes et al. (2014) Freitas-Lemes P., Rodrigues I., Dors O. L., Faúndez-Abans M., Pérez-Montero E., 2014, MNRAS, 441, 1086
- Hernquist (1990) Hernquist L., 1990, ApJ, 356, 359
- Hernquist (1993) Hernquist L., 1993, ApJS, 86, 389
- Katz et al. (1996) Katz N., Weinberg D. H., Hernquist L., 1996, ApJS, 105, 19
- Krabbe et al. (2014) Krabbe A. C., Rosa D. A., Dors O. L., Pastoriza M. G., Winge C., Hägele G. F., Cardaci M. V., Rodrigues I., 2014, MNRAS, 437, 1155
- Krabbe et al. (2017) Krabbe A. C., Rosa D. A., Pastoriza M. G., Hägele G. F., Cardaci M. V., Dors O. L. J., Winge C., 2017, MNRAS, 467, 27
- Laurikainen et al. (2011) Laurikainen E., Salo H., Buta R., Knapen J. H., 2011, MNRAS, 418, 1452
- Laurikainen et al. (2013) Laurikainen E., Salo H., Athanassoula E., Bosma A., Buta R., Janz J., 2013, MNRAS, 430, 3489
- Macciò et al. (2006) Macciò A. V., Moore B., Stadel J., 2006, ApJ, 636, L25
- Martínez-Delgado et al. (2010) Martínez-Delgado D., et al., 2010, AJ, 140, 962
- Mo et al. (1998) Mo H. J., Mao S., White S. D. M., 1998, MNRAS, 295, 319
- Mo et al. (2010) Mo H., van den Bosch F. C., White S., 2010, Galaxy Formation and Evolution
- Moiseev et al. (2011) Moiseev A. V., Smirnova K. I., Smirnova A. A., Reshetnikov V. P., 2011, MNRAS, 418, 244
- Morishita et al. (2014) Morishita T., Ichikawa T., Kajisawa M., 2014, ApJ, 785, 18
- Reshetnikov & Sotnikova (1997) Reshetnikov V., Sotnikova N., 1997, A&A, 325, 933
- Reshetnikov et al. (2006) Reshetnikov V., Bournaud F., Combes F., Faúndez-Abans M., de Oliveira-Abans M., 2006, A&A, 446, 447
- Rosa et al. (2014) Rosa D. A., Dors O. L., Krabbe A. C., Hägele G. F., Cardaci M. V., Pastoriza M. G., Rodrigues I., Winge C., 2014, MNRAS, 444, 2005
- Schweizer et al. (1983) Schweizer F., Whitmore B. C., Rubin V. C., 1983, AJ, 88, 909
- Sharma & Steinmetz (2011) Sharma S., Steinmetz M., 2011, EnBiD: Fast Multi-dimensional Density Estimation, Astrophysics Source Code Library (ascl:1109.012)
- Shibuya et al. (2015) Shibuya T., Ouchi M., Harikane Y., 2015, ApJS, 219, 15
- Shibuya et al. (2016) Shibuya T., Ouchi M., Kubo M., Harikane Y., 2016, ApJ, 821, 72
- Springel (2005) Springel V., 2005, MNRAS, 364, 1105
- Springel & Hernquist (2003) Springel V., Hernquist L., 2003, MNRAS, 339, 289
- Springel et al. (2005) Springel V., Di Matteo T., Hernquist L., 2005, MNRAS, 361, 776
- Steiman-Cameron & Durisen (1988) Steiman-Cameron T. Y., Durisen R. H., 1988, ApJ, 325, 26
- Steiman-Cameron & Durisen (1990) Steiman-Cameron T. Y., Durisen R. H., 1990, ApJ, 357, 62
- Villa-Vélez (2015) Villa-Vélez J. A., 2015, Bachelor thesis, Instituto de Física. Universidad de Antioquia
- Whitmore et al. (1990) Whitmore B. C., Lucas R. A., McElroy D. B., Steiman-Cameron T. Y., Sackett P. D., Olling R. P., 1990, AJ, 100, 1489
Appendix A Study of resolution
All results presented in the previous section were obtained using the high resolution simulation (HR). In this section we study the implications of doing the same simulation with the same initial conditions and the same baryonic physics but using lower resolutions. Remember that these resolutions were defined in Section 4 where HR, MR and LR are tags for simulations of high, medium and low resolutions. Thus, this experiment shows the effects of the discretization on the evolution of the system and its impact in our conclusions.
In left panel of Figure 3 we show the distance between SG and MG as a function of time for the three different resolutions. Although there are some differences in trajectories after orbits for HR (red line) and MR (blue line) resolutions have a very similar behaviour. On the other hand, although the differences are still small, LR (black line) has a slightly different behaviour. This produces that the match points are not fully coincident revealing that the time where simulation reproduces the observation is not the same, however the differences a very small. The differences in time to math point is of with LR and with LR, and the differences in distance are of with MR and with LR.
These results are a consequence of the discrete representation of the system and how the different approximations affect the dynamics of the system with different number of particles. Then in each resolution the satellite undergoes unequal gravitational forces and torques that lead to slightly different trajectories. Obviously, while the number of particles is increased a better approximation to the continuous is realised and the discrepancy in orbits decrease like it happens with HR and LR resolutions.
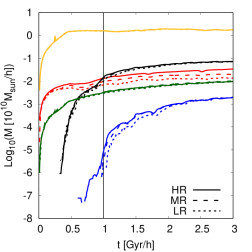
In the same way processes like tidal and ram pressure stripping and the effects of feedback in the gas particles may be affected by discretisation. In Figure 12 we show the stream masses measured for each component for the three resolutions (short dashed lines for LR, dashed lines for MR and solid lines for HR).
As almost the mass of the polar structure is in dark matter, the first thing we can see is that the total mass in the polar structure is the same for all three simulations, independent on the resolution. We see also that all collisionless components (stellar disk, bulge and DM halo) have more or less the same mass deposition rate in to the polar structure. A slight difference is observed for the particles in the disk in the LR simulation, and it should be due to the effects of different angular momentum transfer at that low resolution simulation. Differences are observed for the gas and for the young stars.
For gas, that undergoes more rich physics via sub-grid model for ISM, the discretisation is more important than other components producing a larger discrepancy between its mass curves giving more gas mass to the stream when the resolution is increased (HR). Since the mass per particle is lower in HR than in LR then its inertia to external perturbations is smaller. Also, the resolution affects directly the star formation and feedback processes such that the amount of cold and hot gas and young stars available to be part of the stream changes for each resolution.
The abundance of young stars is slightly different. First, notice that HR starts showing young stars at earlier times than MR and LR simulations. This is naturally due to the increased resolution that allows to track movement of smaller parcels of mass from the galaxies to the streams and polar structure. Afterwards HR and MR simulations show more or less the same behaviour, and although at the beginning LR shows a different rate of mass transfer in to the polar structure, the final total mass is the same for all simulations.
Despite small differences in orbits and mass accretion of polar structure, their global features as form and dimensions are similar implying that orbital properties of particles forming the polar ring are the same. Obviously, the models subgrid controlling the gas physics are resolution depending then the physical properties and the star formation process do not have the same behaviour in simulations.
We argue that we have achieved convergence in our simulations and that resolution is not affecting our conclusions relative to the formation and structure of the polar ring forming during the simulations of the merger of AM 2229-735.