Interacting fermions in two dimension in simultaneous presence of disorder and magnetic field
Abstract
We study the revival of Hofstadter butterfly due to the competition between disorder and electronic interaction using mean field approximation of unrestricted Hartree Fock method at zero temperature for two dimensional square and honeycomb lattices. Interplay of disorder and electronic correlation to nullify each other is corroborated by the fact that honeycomb lattice needs more strength of electronic correlation owing to its less co-ordination number which enhances the effect of disorder. The extent of revival of the butterfly is better in square lattice than honeycomb lattice due to higher coordination number. The effect of disorder and interaction is also investigated to study entanglement entropy and entanglement spectrum. We find that for honeycomb lattice area law of entanglement entropy is obeyed in all cases but for square lattice there is some departure from area law for larger subsystems. The entanglement spectrum have the reflection symmetry of the original butterfly of the Hofstadter spectrum. The interaction induces a gap in the entanglement spectrum as well conforming the correspondence between physical spectrum and entanglement spectrum. The effect of disorder closes the interaction induced gap in the entanglement spectrum establishing the nullification of interaction due to disorder and vice versa.
pacs:
74.50.+r, 03.75.Lm, 75.30.DsI Introduction
Since its discovery in 1976 Hofstadter butterfly Hofs has remained a topic
of great interest in condensed matter physics and is still drawing attention for studying its various
aspects. Hofstadter studied the properties of an electron moving in a two dimensional square lattice in the presence
of an uniform perpendicular magnetic field. The spectrum when plotted as a function of the ratio
of magnetic flux per plaquette to the flux quantum resembled a butterfly like structure and hence the name.
The energy spectrum is an intricate function of this ratio . If is a rational
number then each energy band is devided into sub-bands by the magnetic field. When the magnetic field is varied,
the spectrum shows a recursive structure at rational values of , while a Cantor set like structure appears at irrational
values of . The gaps appear because of Landau levels and effect of interaction has not been considered.
Later on, the Hofstadter butterfly has been studied for different lattice structures like triangular Yeong ,
honeycomb Gumbs and comparative studies of triangular and kagome lattices Juan etc. Experimental
realization of Hofstadter butterfly has been achieved in recent past Dean . The work of Wilkinson Wilkinson based on semi classical approach followed by re-normalization group scheme applied to energy spectrum provided theoretical insight into the Hofstadter butterfly.
In practice we have both disorder and interaction simultaneously present in a physical system. In addition, study of disorder and interaction are of genuine theoretical interest for the complexity they bring in to an otherwise non-interacting translationally invariant system. Studies of effect of disorder Bhatt ; koshino and interaction Minh on Hofstadter butterfly have been carried out separately. Presence of disorder into such a system changes the scenario dramatically. Large disorder (large compared to hopping integral) completely destroys the butterfly structure Bhatt . It smears out the butterfly structure by plugging in states into the gaps. For small disorder(small or comparable to hopping integral) it is expected that states will appear in the gaps between sub bands thus smearing out the sub bands while the large gaps will not be affected Bhatt . On the other hand effect of electronic correlation on the Hofstadter butterfly has been studied using exact diagonalization Cjazka , self consistent Hartree approximation Gudmundsson and dynamical mean field theory(DMFT) Minh . The exact diagonalization calculation for finite size system Cjazka showed that electronic correlation smear out the fine structure of Hofstadter butterfly. The self consistent Hartree approximation done earlier Gudmundsson showed that in presence of electron correlation the pattern of spectrum heavily depends on the filling or chemical potential of the system. The effect of interaction on Hofstadter butterfly has been studied using DMFT and other technique in case of Falikov-Kimball model Minh ; wrobel-2009 ; subhashree . It showed that in long range ordered phase, the presence of electronic interaction induced a gap without disturbing the fine structure of the butterfly. The gap simply eats up the central part of the butterfly keeping intact the two wings. In the present work we deal with the issue of revival of the Hofstadter butterfly in simultaneous presence of site disorder and correlation. We incorporate the electronic correlation by considering the single orbital Hubbard model with onsite Coulomb repulsion. The site disorder has been introduced by wrapping the four letter Rudin-Shapiro sequence over all the sites of lattice. The reason for choosing Rudin-Shapiro over other quasi-periodic sequence is that the dc conductivity calculated with it as site disorder for a non-interacting electron problem in one dimension was found to be in much better agreement with that obtained with random disorder compared to Fibonacci and Thue-Morse sequencesAldea . As such one is able to arrive at results close to that of random disorder using a deterministic sequence and are saved from doing configurational average. The effect of disorder is to localize electrons. As a result sites with lowest onsite potential have highest occupation of electrons and vice versa. On the other hand the on-site Hubbard interaction drives the system towards an anti-ferromagnetic configuration which is also an insulating state Gupta . Recently it is shown that interaction also induces charged ordering in the Hofstadter butterfly archana-2016 ; archana-2017 , however for Bose-Hubbard model in the presence of magnetic field such charge density order is absent umucahlar ; oktel . On varying the on-site Hubbard interaction in presence of disorder, the system therefore undergoes a transition from disorder driven insulator to correlation driven insulator. In between, at a certain critical value of the on-site Coulomb repulsion, the two effects nullify each other. As such we expect a revival of the Hofstadter butterfly at the point of nullification. The extent of this nullification should be visible in the quality of revival of the Hofstadter butterfly. The method that we use in our work is the numerical mean field approximation of unrestricted Hartree Fock. This method has the strength of handling both the electrical and magnetic sectors in the same footing(mean field) and being able to handle spatial correlations in a self consistent fashion. It is a well known fact that the effect of disorder as well as interaction crucially depends on the lattice connectivity. If the lattice connectivity or the effective physical dimension is larger, the effect of disorder or interaction is weaker. To explore this aspect we have considered in our study square as well as honeycomb lattice. Recently it has been established that entanglement is an important aspect of a many body system which can reveal many salient characteristics very effectively, for example, phase transition amico-2008 , topological order li-haldane , edge states saptarshi-2016 etc. Previous studies of entanglement on Hofstadter problem was mainly confined to bilayer systems schliemann ; arovas-2012 or for cylindrical geometry moradi-2016 where entanglement in momentum space was studied after tracing out one layer of physical system or one spatial direction respectively. In these cases it was possible to obtain an analytical expression for entanglement entropy in momentum space. In our study we are investigating the usual entanglement in physical lattice by integrating out a certain region to explore how the spatial entanglement does evolve with magnetic field. Specifically we see how the area law is being affected. We also examine entanglement spectrum for the largest subsystem (which in our case is half the original system) and observe useful patterns similar to Hofstadter pattern. The interplay of interaction and disorder in the entanglement entropy and entanglement spectrum is investigated thoroughly.
Our plan of presentation is following. In Sec. II, we discuss in detail the main theoretical construction and approximation used. This includes the derivation of mean-field approximation used in the paper as well as the description of Rudin-Shapiro disorder being implemented. In Sec. III, we describe the bi-partition of the square lattice and honeycomb lattice to define the reduce density matrix and hence to calculate the entanglement entropy and entanglement spectra. In Sec. IV, we provide our estimation of critical strength of interaction where the gap at half filling due to interaction and disorder nullify each other for square and honeycomb lattice. Followed by this, we explain our main results. In Sec. V.1 we describe the effect of interaction and disorder on Hofstadter spectra for square and honeycomb lattice. In Sec. V.2 we describe the effect of interaction and disorder on entanglement entropy and entanglement spectra. Finally we conclude our results in Sec. VI with a discussion and put our finding in a larger perspective.
II Model and Method
We now present and discuss the model Hamiltonian and scheme of dealing with interaction and disorder. We implement a tight-binding single-band Hubbard model on square and honeycomb lattice. The reason to study both square and honeycomb lattice is to have a comparative study of two different two dimensional lattices with different co-ordination number. Each site of a square lattice has four nearest neighbors and for honeycomb lattice there are three nearest neighbors (effective lower dimension). As a result localization effect of disorder will be more prominent in honeycomb lattice and hence we expect a better recovery of Hofstadter butterfly in square lattice compared to honeycomb on switching on electronic interaction. We choose the Landau gauge such that the components of the vector potential are to get uniform magnetic field along z-direction. Therefore for the square lattice the phase appears only in the hopping along -direction. The Hamiltonian for the square as well as honeycomb lattice can be written as,
| (1) | |||||
Here the label ‘’ represents a site of the two-dimensional square lattice or honeycomb lattice. The operator () creates (destroys) an electron of spin at site ‘’. We set the hopping ‘’ to be nearest neighbor only. We take a gauge such that where arises due to external magnetic field. denotes nearest neighbor along direction. The last term is the on-site Hubbard interaction term. The chemical potential is calculated by demanding that there be exactly N/2 electrons in the problem. This is done by taking the average of the N/2-th and the (N/2 + 1)-th energy level. We set uniformly for all the bonds in both the lattices. We make no further assumption about the magnetic order if any, and thus retain all spin indices in the formulas below.
To make progress with the Hamiltonian given in 1, the last term i.e the Hubbard interaction is treated under Unrestricted Hartree-Fock(UHF) approximation claveau-2014 ; gupta1 ; gupta2 . To put it more clearly, the Hubbard onsite term in UHF is approximated by putting the product of onsite fluctuations of the up and down spin electrons to zero.
| (2) |
We will drop the last term because it does not contribute to the equation of motion. Once this approximation is implemented for the Hubbard interaction term, the on-site potential is modified as:
| (3) |
And the corresponding decoupled Hamiltonian can be written as sum of up and down components as follows.
| (4) | |||||
| (5) |
After writing the Hamiltonian as a sum of up and down components we start with
an initial guess for and . The Hamiltonian is
then diagonalized for both up and down spin electrons and new values of
and are generated. The process is iterated
until we reach a self consistent solution. Then one can calculate all the
physical quantities.
Having discussed the mean-field approximation employed for Hubbard interaction we briefly describe the implementation of Peierls phase factor peierls-1933 due to magnetic field. We have taken the Landau gauge in which magnetic vector potential is represented as
where represents unit vector along -direction. It is evident that for square lattice all the hopping parameter along -direction is unchanged but the hopping elements along -direction is
given by where , is the horizontal co-ordinate of ’th site as shown in Fig. 1. However for the honeycomb lattice, in addition to the hopping along -direction, the hopping along the zig-zag chain extending along directions would also acquire a phase because of the finite component along the -direction. We denote this phase as where . Now the translation vector along the zig-zag chain is taken as which yields (in Fig. 1, right panel, they are shown by light blue and pink thick lines). An elementary calculation shows that for both type of slanted bonds. With the above convention it is easy to check that for square lattice the flux per plaquette is invariant upon and for the honeycomb lattice the corresponding shift is . As the Hofstadter spectra only depends on the flux per plaquette, the periodicity of Hofstadter spectra for square and honeycomb lattice is and respectively. We note that here the strength of magnetic field is assumed to be in the unit of fundamental magnetic flux quanta. In our numerical study we solve Eq. 4 self-consistently using the above phase factors for the hopping parameters. We begin with a initial distributions of (for a given realization of ) and diagonalize the effective single particle Hamiltonian as given in Eq. 4 to obtain the new distribution of . The resulting distribution of s are taken as the initial values in the next iteration and the iteration continues until the initial distribution and converge within a prescribed accuracy.
The value of the site potentials ’s are assigned by the four letter Rudin-Shapiro sequence, which is wrapped around the lattice. Practically we implement this by an one-dimensional representation of the lattice as shown in Fig. 1. The sequence is generated by using four letters , the generating scheme is , , , where represents the sequence for a given successive four sites along the one-dimensional array and represent the sequence for next four sites. The Rudin-Shapiro sequence narad-2015 therefore grows as and so on. In the present study we have taken and this sequence is termed as throughout the manuscript. In this study we have taken the Rudin-Shapiro sequence to simulate the disorder in the system for simplicity. To take the effect of disorder into account properly, one needs to take a configuration average of many realization of disorder which is computationally very heavy specially in the presence of interaction. However we think that the result obtained within the Rudin-Shapiro sequence generated disorder is able to produce the qualitatively identical results as obtained from proper configuration average.
III Details of subsystem for entanglement calculation
Having discussed our theoretical model and approximation scheme in detail, we briefly describe our scheme of entanglement estimation in the present study. As described earlier we have taken a square lattice of dimension with an open boundary condition. To estimate the entanglement entropy we define various subsystem as follows. We take a square of dimension and increase ‘’ from 3 to 21 implying that we take a subsystem whose size includes squares with ‘’ taking values 2 to 20. In Fig. 1 A, we have shown such a subsystem having dimension of squares. The entanglement spectrum has been investigated only for the largest square subsystem when . The entanglement entropy has been calculated by usual procedure of diagonalizing the correlation matrix of the subsystem ent for free fermionic system. In all the figure entanglement entropy has been plotted for various subsystem represented by for the squares. For the honeycomb lattice, we have presented a cartoon picture in Fig. 1 B. The various subsystem has zig-zag chains where in each chain has sites. In the Fig. 1 B, we have represented the upper row of such subsystems by red filled circles and the region bounded by the red filled circles shows a generic subsystem of sites. The largest value of taken by us is 23 and entanglement spectrum is investigated for this largest subsystem only. Entanglement spectrum is defined as the eigenvalues of the reduced density matrix. The eigenvalues of the reduced density matrix is related to the eigenvalues of the correlation function matrix as shown in ent . If ’s are the eigenvalues of the correlation matrix then one can obtain the eigenvalues of the reduced density matrix. In appendix we elucidate this relation. This intern enables one to calculate the von-Neuman entanglement entropy of a non-interacting system completely determined by the formula amico-2008 ; eisert-2010 ,
| (6) |
In our study we have evaluated the above quantity. Apart from this we have also plotted for the largest subsystem for different magnetic field. The distribution of is directly related with the physical spectrum and entanglement spectrumfidkowski-2010 .

IV Critical values of interactions
We have already explained that our motivation was to investigate the extent of revival of the Hofstadter butterfly due to interplay of disorder and interaction. Thus the pertinent question is what is the order parameter that should be a good indicator of such interplay. It is known that an onsite Hubbard interaction opens a Mott-Hubbard gap at half filling. The same is true for the present study as well. For a self consistent study in the presence of interaction, the shape of the butterfly nature of the spectrum remains the same though a gap opens at half filling. In the presence of small and moderate disorder the fractal nature of the butterfly spectrum starts to melt away giving a structure less spectrum. In our study there are interaction and disorder both. The gap at half filling at B = 0 is the physical indicator of how the competition between these two mechanisms manifest. The localization effect of disorder dominates till a critical value of onsite Hubbard interaction is reached beyond which a gap at half-filling opens up due to electronic correlation and the system becomes an insulator because of electron-electron interaction. There are doubly occupied sites below but above it the onsite interaction dominates and double occupancies become energetically unfavourable. Therefore is the point at which the two effects nullify each other.
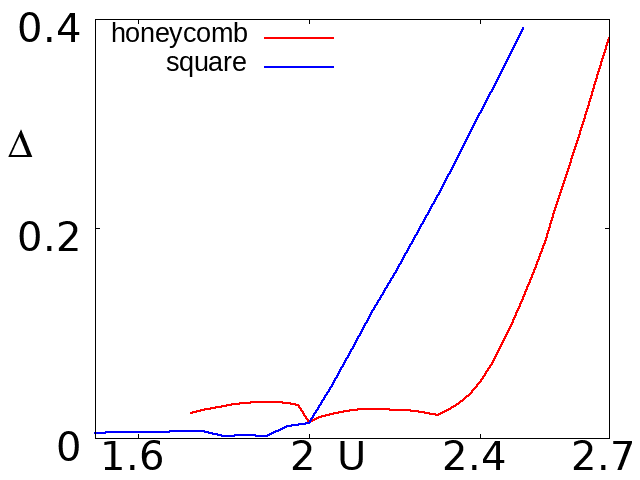
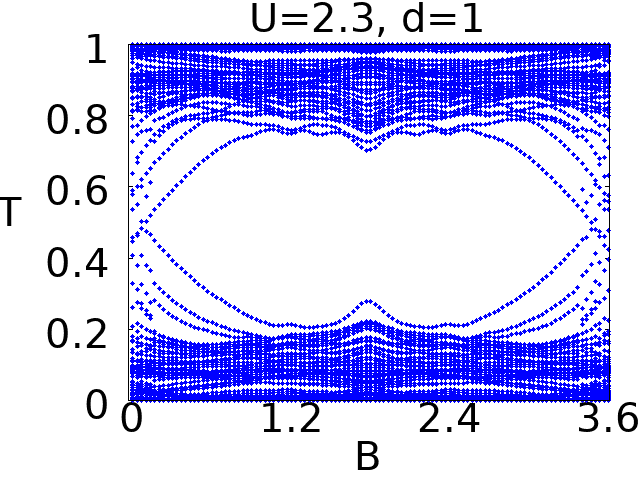
For square lattice and Honeycomb lattice we obtain the value of as 1.9 and 2.3 respectively as shown in Fig. 2. The location of as described is not very precise due to finite size effect. We have found that for various system sizes there is a non-uniformity in gap at half filling and the location of varies though they are very near to 1.9 and 2.3 for square and honeycomb lattice respectively. We have zeroed in at these values of after a careful comparison of data for various system sizes such that finite size effect is minimal. For this reason we have chosen a system size of for square lattice and for honeycomb lattice.
V Results
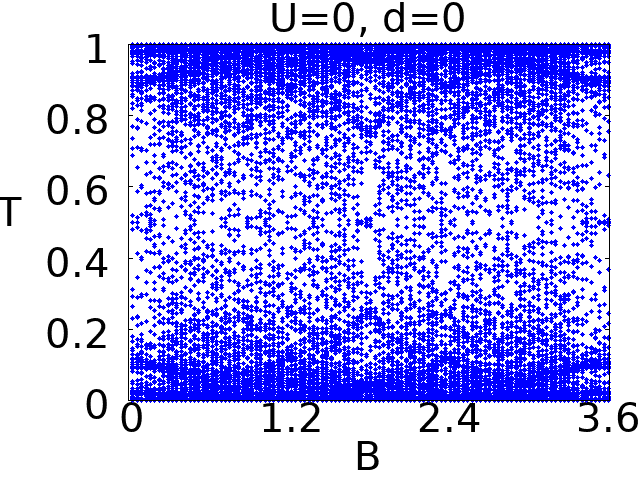
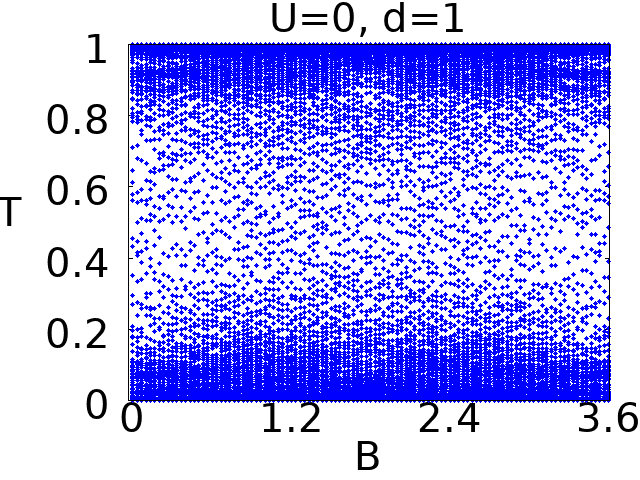
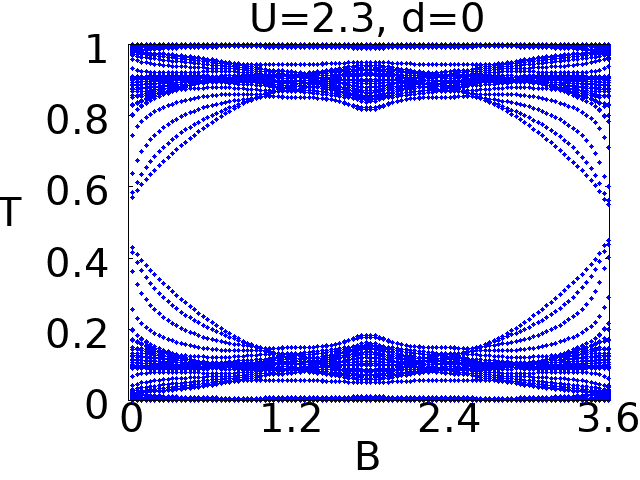
We now move on to describe our main results. From now on ‘E’ stands for the Hofstadter spectrum, ‘S’ stands for entanglement entropy for subsystem as plotted against different magnetic field and ‘T’ denotes entanglement spectra for half subsystem as defined before. In Fig. 3 and Fig. 4 we plotted the Hofstadter spectra for square and honeycomb lattice respectively. For entanglement entropy and spectrum for square lattice we refer Fig. 5 and Fig. 7 respectively. Similarly for honeycomb lattice, we use Fig. 8 and Fig. 10 for entanglement entropy and entanglement spectra respectively. In all the above mentioned figures the upper left panel represents the plot in the absence of disorder and interaction, upper right panel represents the case when disorder is present in the absence of interaction. In the lower left panel we present the plot when interaction is present but there is no disorder. Finally in the lower right panel, we present the result in the case of simultaneous presence of disorder and interaction. With these guidelines for understanding the figures we now move on to discuss the effect of interaction and disorder on Hofstadter spectra.
V.1 Effect of disorder and interaction on spectrum
V.1.1 Square lattice
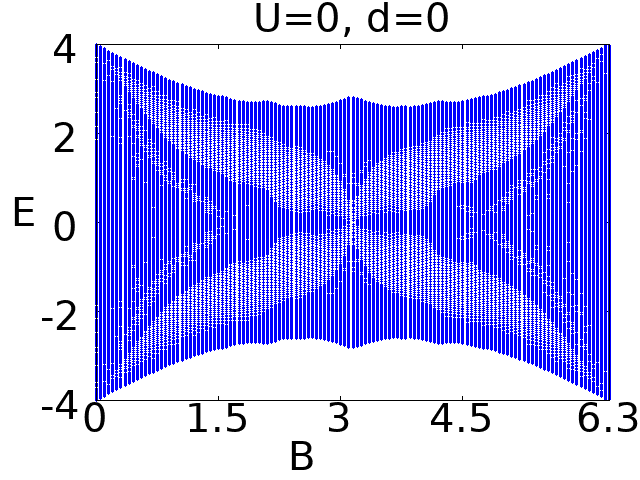
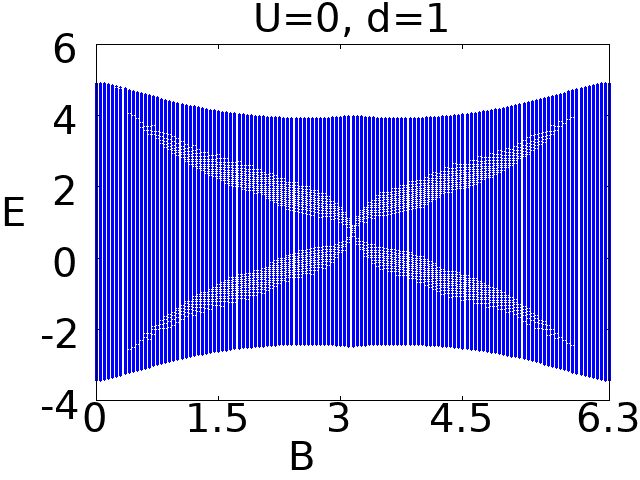
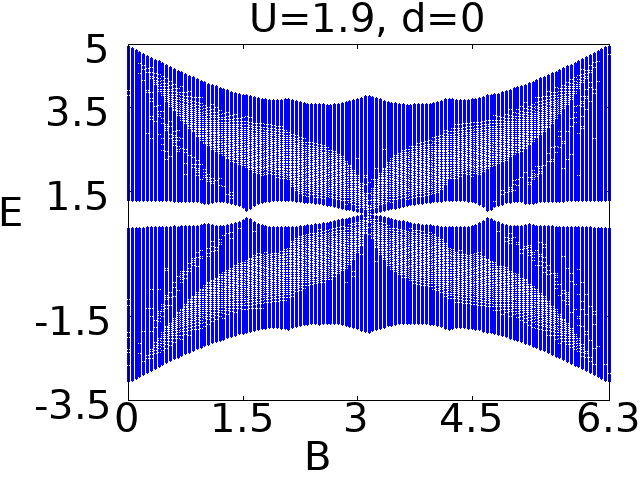
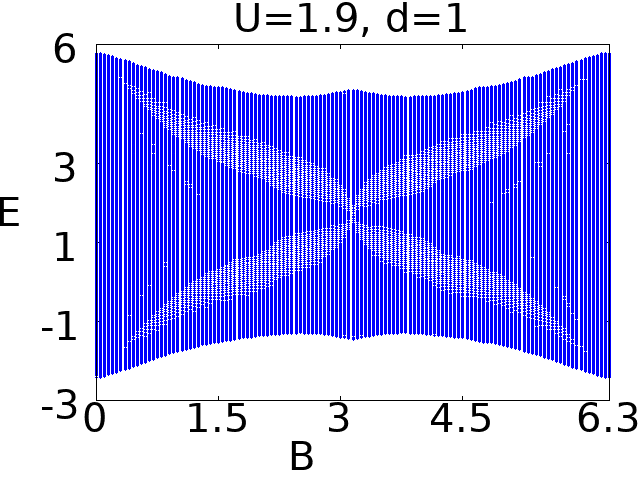
In Fig.3, we have presented the effect of interaction and disorder graphically for square lattice. From the convention of different parameters as mentioned earlier we observe from Fig. 3 that as we turn on the disorder, Hofstadter spectrum loses its fractal/butterfly nature. The given disorder inserts states into the gaps and is strong enough to smear out the fractal character and the spectrum almost looks like a continuous band though the lowest eigenvalue still retains the reflection symmetry with respect to . Now we discuss the effect of interaction without disorder. Turning on interaction causes a gap in the Hofstadter spectrum retaining its overall butterfly like structure as evident from lower left panel of Fig. 3. Now as we turn on the disorder in the presence of interaction we observe the resurrection of Hofstadter butterfly for a critical value of interaction. This resurrection or revival is marked by the appearance of the largest wing or gap in the spectra. Though we note that the width of the wing has decreased and the subdominant wings are also faintly present there. This is also accompanied with vanishing gap at half filling. Thus we find a clear evidence that the localization effect due to disorder and interaction play against each other and results in the revival of butterfly spectra to some extent. Now we move on to explain the results for honeycomb lattice.
V.1.2 Honeycomb single layer
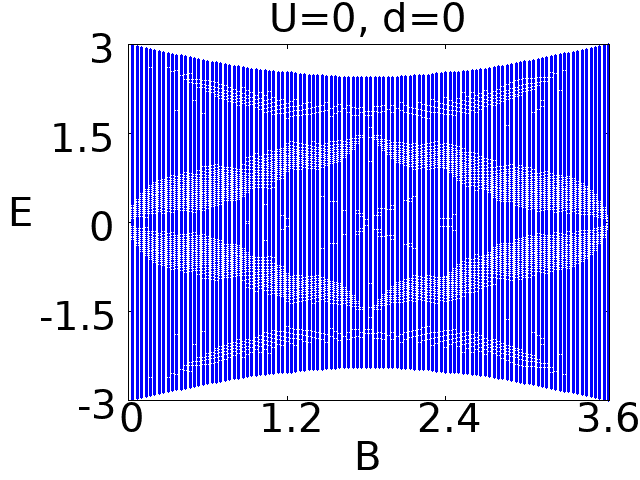
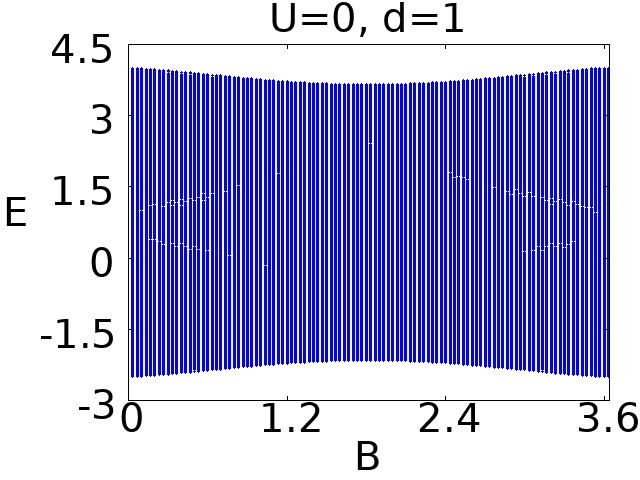
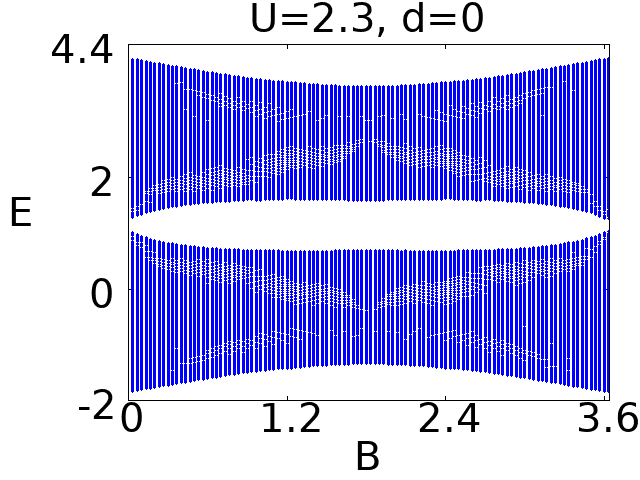
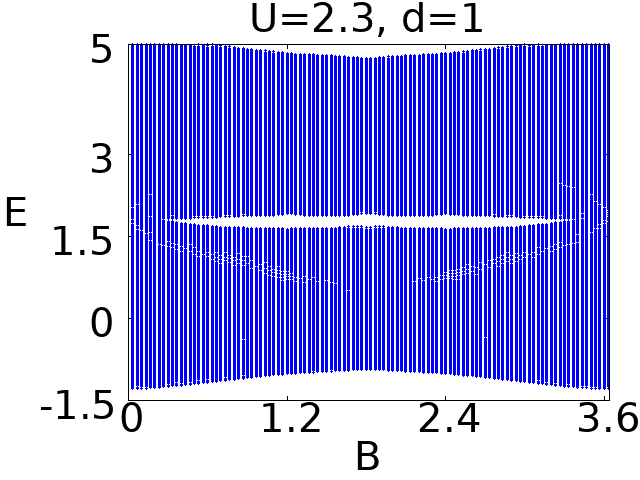
For the Honeycomb lattice, we observe similar effect due to disorder and interaction in the Hofstadter spectrum. The disorder (generated by (0 0.5 1 1.5) Rudin Shapiro sequence) is strong enough to smear out the entire Hofstadter butterfly structure almost completely. The effect of disorder is stronger than the square lattice which can be attributed to reduced co-ordination number. Again in the absence of disorder, the self consistent analysis of the Hubbard interaction gives a gap at half filling without otherwise disturbing the Hofstadter pattern. The induced Hubbard gap is larger in magnitude in comparison to square lattice. Further for the square lattice the interaction introduced gap is minimum(maximum) at middle(end points) where as for honeycomb lattice it is opposite. We think this is due to the Lieb’s theorem lieb-1994 which states that for square lattice the minimum energy corresponds to flux per plaquette where as for honeycomb lattice the corresponding flux is zero. Furthermore in simultaneous presence of disorder and interaction we find that Hubbard gap is minimized and small revival of the Hofstadter spectrum at . However the revival of butterfly spectra is stronger in square lattice due to increase in coordination number. The present disorder is strong enough so that the strength of required to nullify the effect of the same strength of disorder is also larger in comparison to square lattice due to the decrease in number of nearest neighbor hopping.
V.2 Effect of interaction and disorder on Entanglement
V.2.1 Square lattice
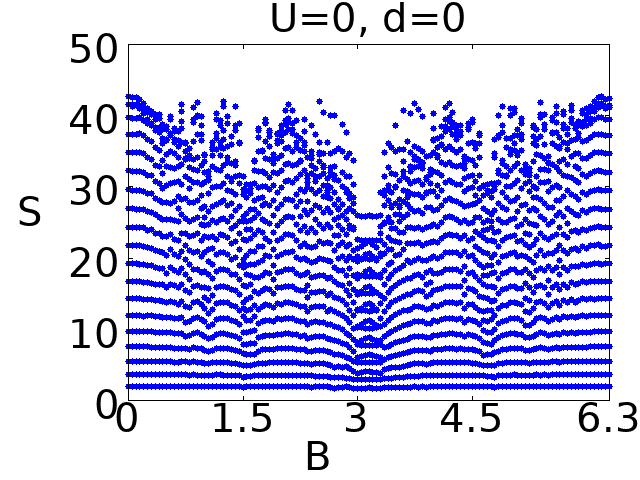
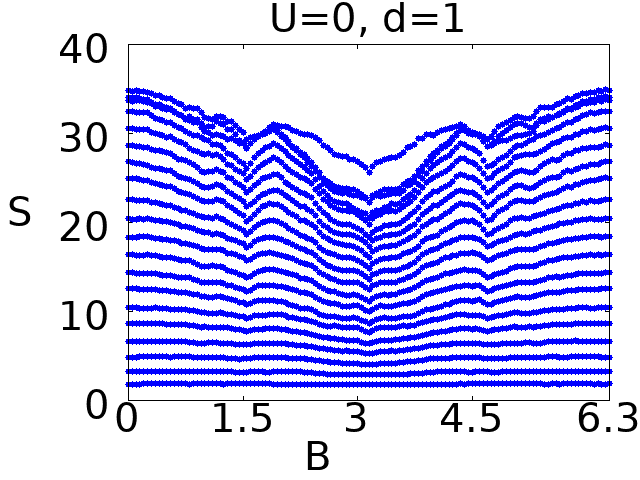
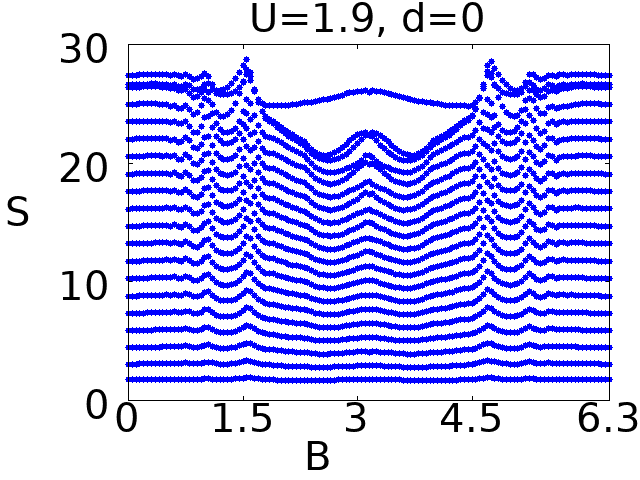
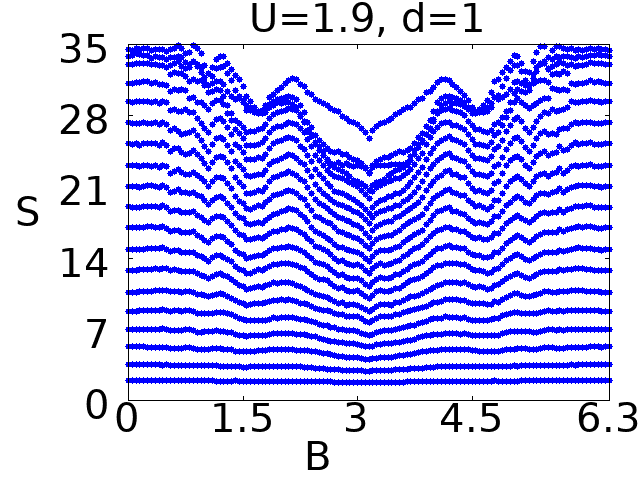
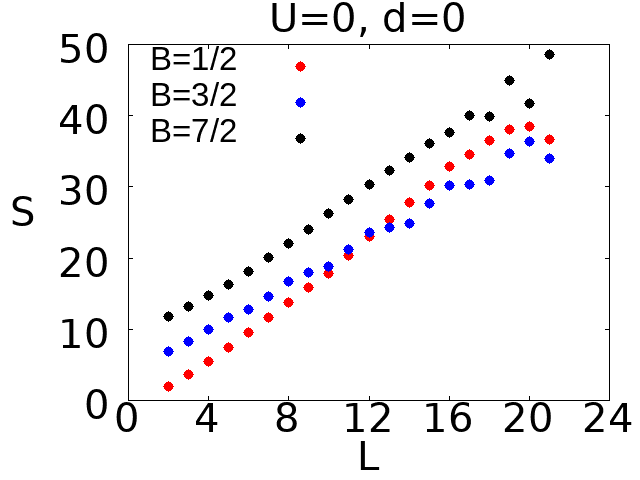
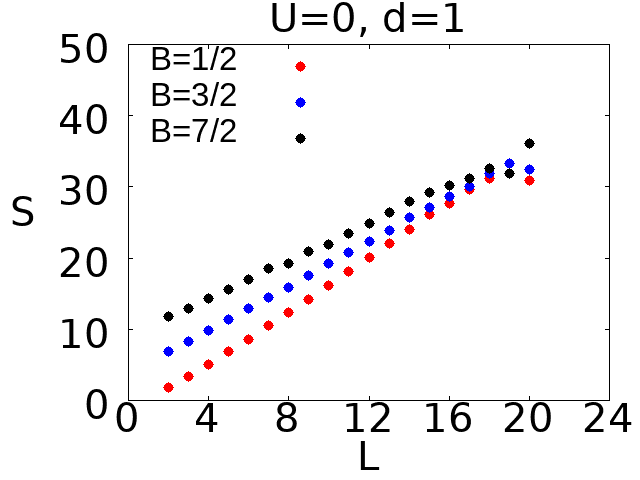
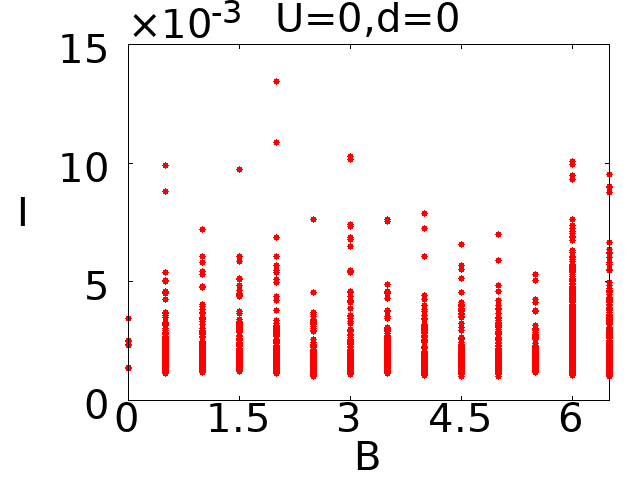
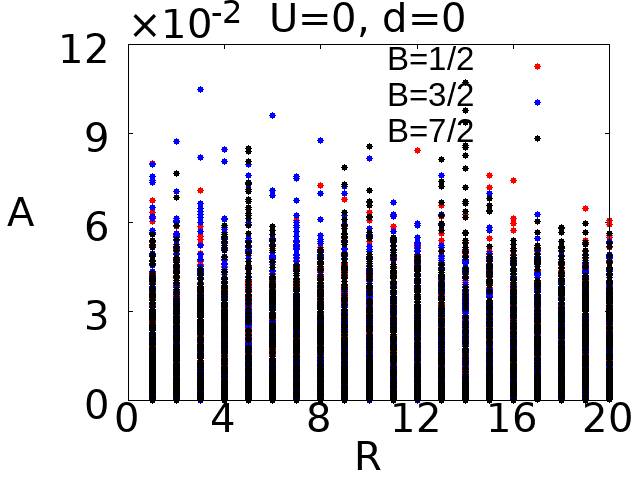
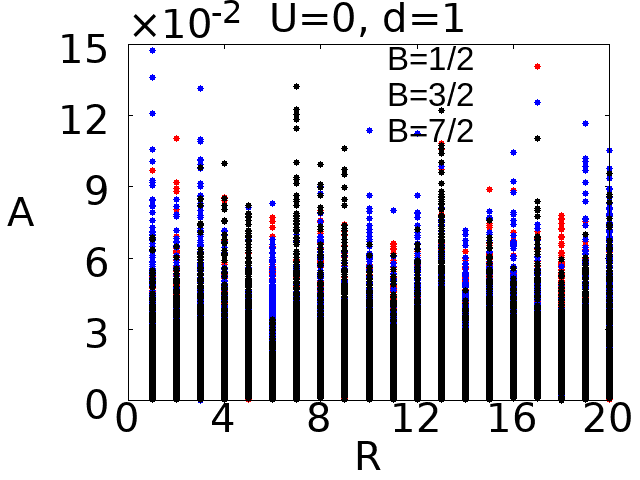
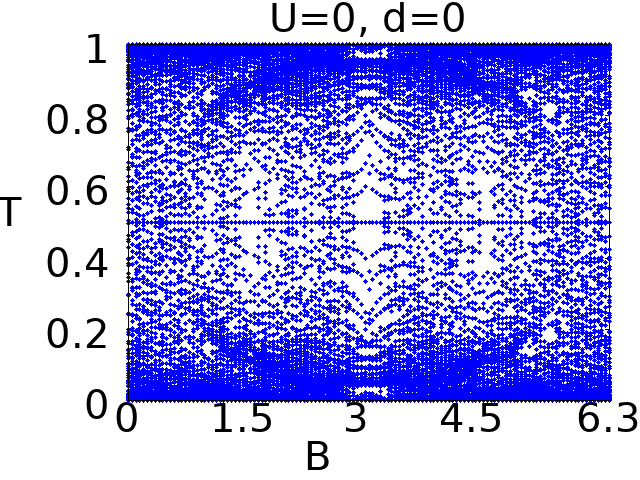
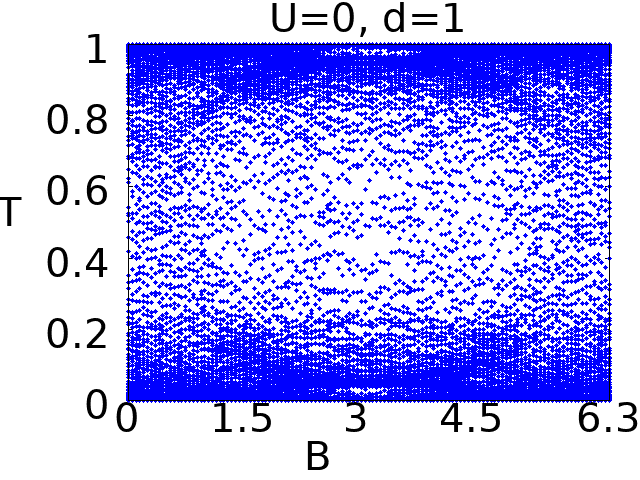
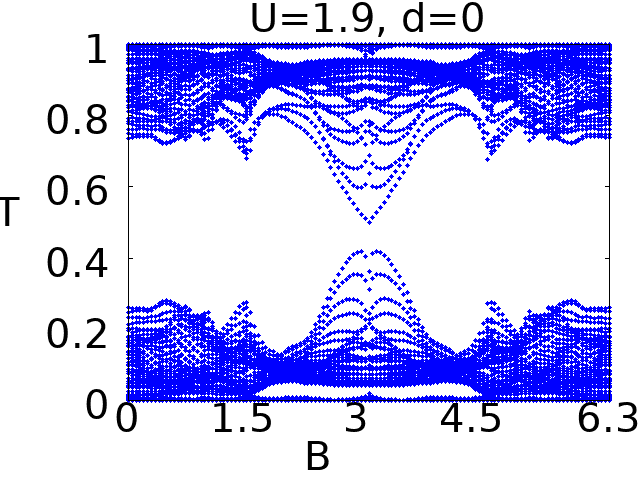
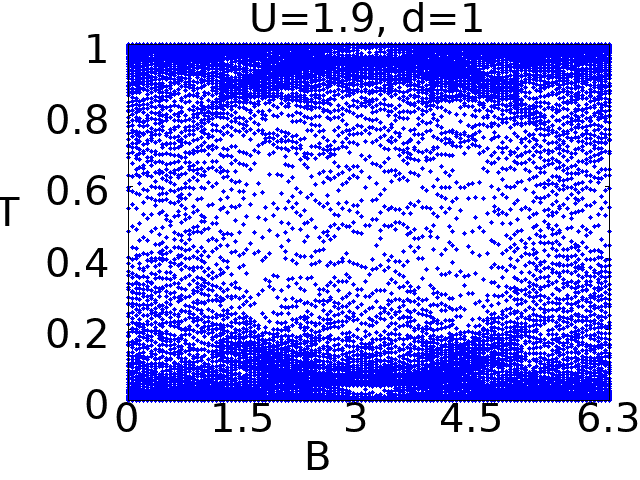
Having described the effect of interaction and disorder on Hofstadter spectrum we now discuss their effect on entanglement. We have investigated entanglement entropy for various subsystem sizes as described in Sec. III and also examined the correlation matrix spectrum for the largest subsystem whose dimension is half the full system. We begin our discussion with square lattice. In Fig. 5, we have plotted the entanglement entropy for various situations( interaction and disorder as mentioned earlier). In each of these plot the horizontal axis represents magnetic field and vertical axis denotes entanglement entropy for various block sizes as described in Fig. 1 and in Sec. III. This imply that for a given magnetic field say at , the fist blue point vertically denotes entanglement entropy of block size , the second points correspond to block size and so on. Thus an equispaced entanglement entropy for a given magnetic field ensures the area law to be maintained. From the Fig. 5 we observe that for uniform case area law is better maintained for magnetic fields close to zero or . For magnetic field near area law is not maintained well for uniform case. However area law is shown to improve in the presence of disorder and interaction and both as we find the entanglement entropy to be more equispaced. For better understanding, in Fig. 6 upper left and right panel we have shown the entanglement entropy versus the length (L) (length of one side of square subsystem) for three representative magnetic field for uniform case and in the presence of disorder respectively. For better representation entanglement entropy for higher magnetic field are shifted upward by 7.5 and 15 respectively. It is clear that the disorder induces better area law. However there seems to be a departure from area law for larger subsystems. To understand this we have plotted in the middle left and right panel the inverse participation ratio (see Appendix for definition) for uniform case and in the presence of disorder respectively at half filling. It is clear that for the uniform case, the small values of IPR signify extended wave functions and the area law is not expected to be maintained for this. For disordered case large values of IPR signify localization however for magnetic field near , small values of IPR denotes delocalized or quasi-delocalized wave function which might cause such violation of area law for larger subsystem. In the lower left and right panel of Fig. 6, we plotted amplitude of wave functions from boundary to the center and we always find a significant probability of some wave functions denoting quasi-delocalized nature of the wave functions. As the entanglement entropy is a contribution from all the eigenfunctions up to half filling, it is rather difficult to come at definite conclusion for such area law violation. At most it points out to inhomogenous and extended nature of wave functions. In appendix we have shown more elaborately how the IPR and amplitude of wave function varies for various system sizes and for various strength of interaction and disorder. This shows that there is always some quasi delocalized wave functions whose contributions to the entanglement entropy depend on the vary nature of the wave functions and the subsystem. It may be noted that such delocalized wave function has been experimentally observed in disordered Chern insulators udvas-2021 . Interestingly entanglement entropy shows a local minima at B= for disordered case but shows a local maxima in the presence of interaction. To understand the entanglement entropy and its behavior near , we plot the entanglement spectra for the largest subsystem as shown in Fig. 7. We observe that the gap in the entanglement spectrum follows directly from the gap at half filling shown in 3 conforming the correspondence between entanglement spectra and physical spectra fidkowski-2010 . For example in Fig. 7 lower left panel, we find that the electronic interaction opens a gap at half filling but the magnitude of the gap depends on the magnetic field. At certain magnetic field, the gap is minimum and at those values of magnetic fields we find that entanglement entropy depart from the area law. Also at these values of magnetic field entanglement spectrum shows a reduced gap. If we look at the entanglement spectrum for the pure case, we do note that there are some fractal structure as well. The magnetic field length scale also present itself an important length scale which competes with the localization effect of interaction and at certain magnetic field, the effect of interaction is reduced to a minimum. This may cause enhancement of entanglement entropy and reduced gap in entanglement spectrum.
V.2.2 Honeycomb lattice
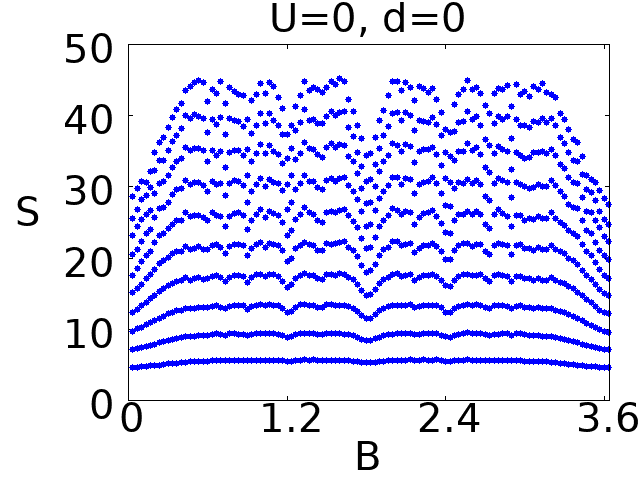
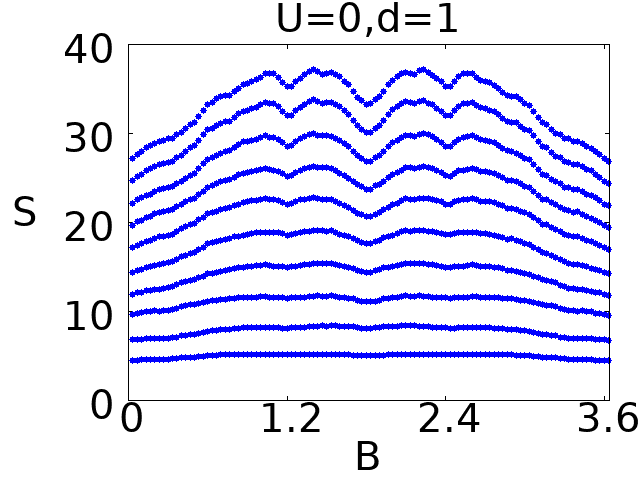
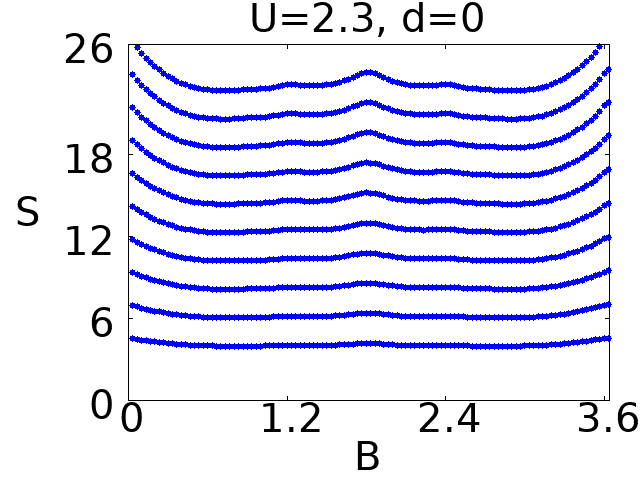
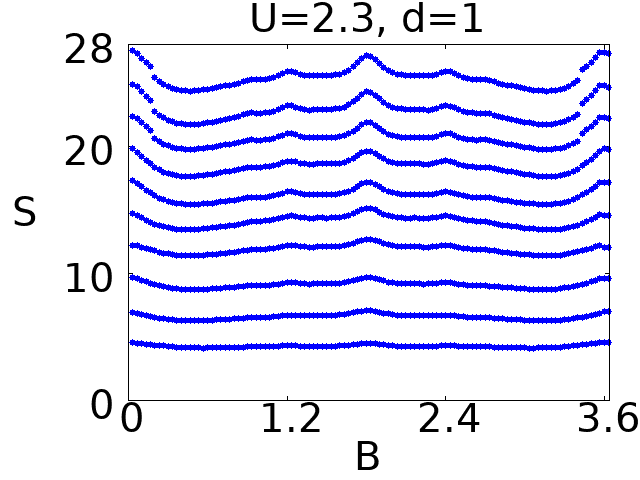
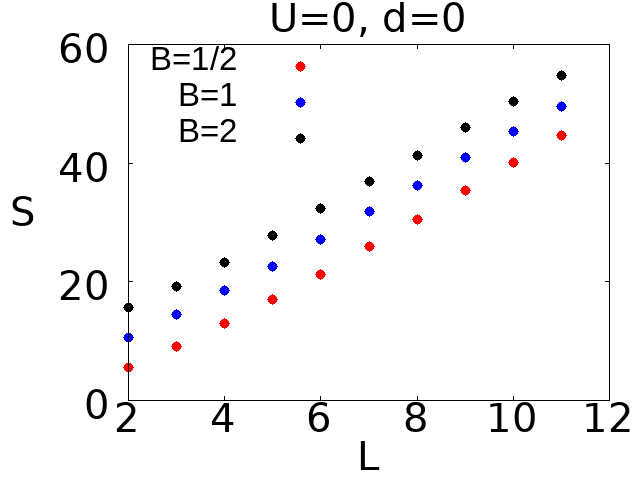
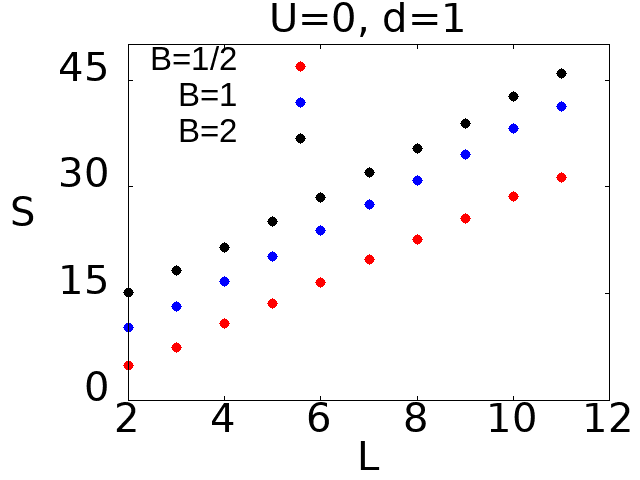
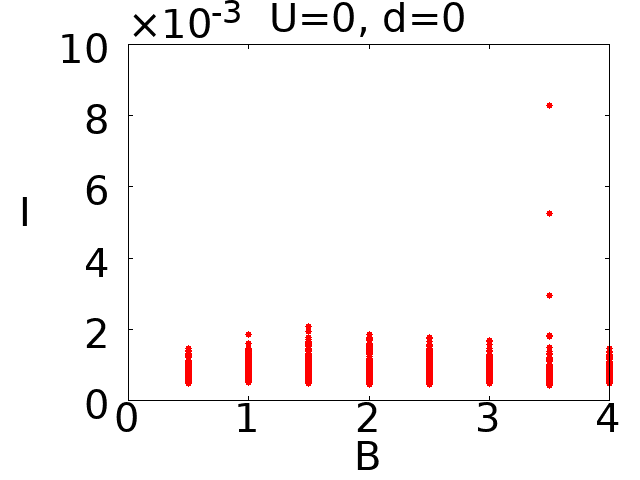
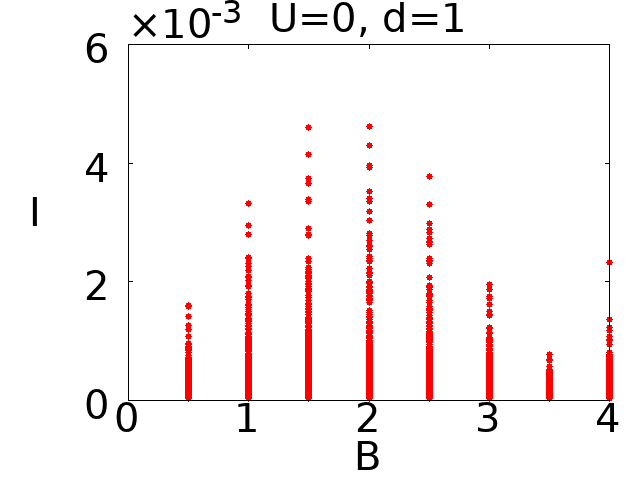
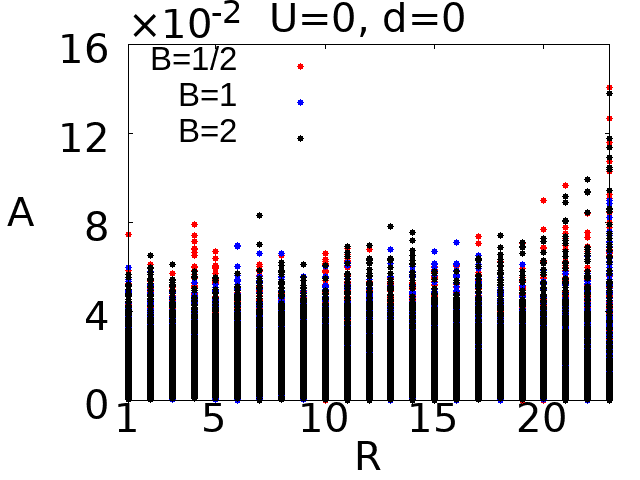
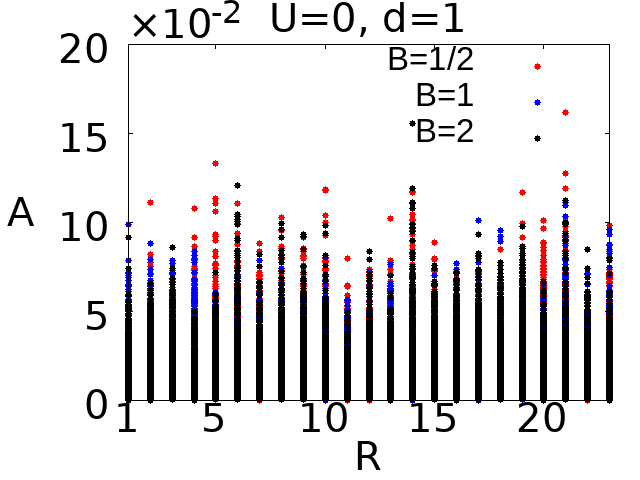
Now we discuss the entanglement properties for honeycomb lattice. In Fig. 8 and Fig. 10 we plotted entanglement entropy and correlation spectrum respectively. The Entanglement entropy shows similar characteristics as in square lattice. For pure Hofstadter spectrum( in the absence of interaction as well as disorder) the entanglement entropy is equispaced at a given magnetic field. Though the spacing’s between two successive subsystem varies with magnetic field. The equal spacing between the entanglement entropy for various subsystem signifies area law. The entanglement entropy for large subsystem shows a very weak fluctuation as we increase the magnetic field but it can never be termed as oscillations as found for square lattice. We find that for honeycomb lattice the departure from area law for larger subsystem does not exist contrary to square lattice. In Fig. 9 upper left and right panel we plotted entanglement entropy versus L for three different magnetic field for uniform and disordered case respectively. The entanglement entropy for higher magnetic fields are shifted vertically by 7.5 and 15 for better representation. Perfect linear behavior of the plot shows agreement to area law. In the middle left and right panel we showed IPR and we see that disorder has induced an increment in IPR by a factor of 10. In the lower panels of Fig. 9, we plotted amplitude of the wave functions(from the middle of one of the edge to the center) at half filing and we observe the quasi-delocalized nature of the wave function similar to square lattice. Though the effect of disorder induces an increment of IPR by 10 times for both square and honeycomb lattice, we observe that the area law is better maintained for honeycomb lattice. This probably indicates that the wave functions are more homogeneous and uniform in case of honeycomb lattice such that instead of quasi-delocalized modes a better adherence to area law is found in comparison to square lattice. For large subsystem, the entanglement entropy monotonically increases with intermittent minima including a minima around which is half-cycle values for the magnetic field. In the presence of interaction and disorder, some feature of only disorder case returns and also net entanglement entropy increases. The entanglement spectrum also shows interesting pattern similar to square lattice. For pure case i.e in the absence of interaction and disorder, the spectrum do have a reflection symmetry and finer structure as found in the Hofstadter spectrum. In the presence of disorder the spectrum becomes more homogeneous without any finer structure. In the presence of only interaction a large gap opens in the spectrum. This gap is minimum at , i.e at the zone boundary. For the square lattice at the zone boundary the interaction induced gap is maximum. When disorder is turned on in the presence of interaction we find that interaction induced gap is reduced and at the zone boundary the gap almost vanishes. Thus we see the signature of nullifying effect of interaction and disorder in the correlation spectrum as well.
VI Discussion
Let us recapitulate and summarize our results briefly. As already explained the main objective of our study is to explore the interplay of disorder
and interaction in the Hofstadter spectra and entanglement as well. The disorder is implemented according to
four letter Rudin-Shapiro sequence as we intended to see the effect of disorder as close as possible to random disorder without doing configurational average. However, it may remain to justify such claim of simulating the actual physics obtained through configurational averages over many random disordered realizations. Nevertheless given the fact that such configurational averages needs a much longer time to investigate, the Rudin-Shapiro sequence followed in this article always, on its own, constitute a particular realizations of disorderedness which deserves to be explored. We note that such method of investigations which avoid configuational averages are present in condensed matter system such as Fibonacci series vipin1 , Aubry-Andre-Harper modelvipin2 .
To account for the interaction, we performed a self consistent unrestricted Hartree-Fock analysis.
As expected the butterfly nature of the spectra vanishes once the disorder is turned on in the absence of interaction. When the interaction is present
but the disorder is not present, we find that a gap comes to exist in the middle of the Hofstadter spectrum but otherwise the pattern remains intact as found before Cjazka ; Minh .
Remarkably, in simultaneous presence of disorder and interaction, we find that
butterfly nature of the Hofstadter spectrum returns to some extent with the wings having lesser width.
Also the interaction induced gap in the middle of the Hofstadter spectra vanishes. This implies that interaction
and disorder successfully nullify each other. It would be interesting to see what happens to such revival beyond mean field. However this is beyond the scope of present study. The revival of Hofstadter butterfly intricately depends on the lattice
coordination number as well as the relative strength of disorder. For example,
effect of disorder is enhanced in the honeycomb lattice because of lower
coordination number. This is manifested in the comparatively weaker revival of butterfly spectra in Honeycomb lattice than in square lattice. Also the effect of
disorder is nullified by interaction at for square lattice whether for honeycomb lattice the corresponding value is . If we increase
further beyond , a gap opens up at Half-filling, therefore this is the farthest we can go for nullification.
The interplay of interaction and disorder has also been successfully realized in the study of entanglement properties. In our endeavor to study the entanglement properties of the Hofstadter effect, we find that for pure case, area law of entanglement entropy is preserved for
low and high magnetic field. But for intermediate magnetic field the entanglement entropy depart from its usual area law for square lattice for larger subsystem. For honeycomb lattice there is perfect agreement with area law in all cases. Our effort to understand this differences between square lattice and honeycomb lattice through investigating various system sizes and different disorder realizations point out that there is intricate differences in the resulting wave functions in square and honeycomb lattice. The inverse participation ratio as well as distributions of wave functions show the existence of large number of quasi-delocalized modes which are possibly fundamentally different in square and honeycomb lattice. Possibly for larger subsystems such wave functions are at maximum incommensurability resulting such violations of are law. But for smaller subsystems the effect is minimized. Finally we see that the correlation function eigenvalues do manifest the symmetric properties observed in the Hofstadter butterfly. The effect of interaction does recover
the area law at intermediate magnetic field implying the localization of the eigenstates due to interactions are in effect. In the presence of disorder, we similarly find that area law is better recovered for square lattice. In the entanglement spectrum as well we find that the symmetry of the spectra is lost and becomes homogeneous in the presence of disorder, though the spectrum is more denser at higher and lower limits of the value of correlation function spectra. The effect of interaction on the entanglement entropy and spectrum is also manifested profoundly for the intermediate magnetic field. The gap of the Hofstadter spectrum due to interaction are also reflected in the gap of the correlation (entanglement spectrum) spectrum. These band gaps are minimum where the gap of the Hofstadter spectra are minimum in the presence of interaction fidkowski-2010 . The entanglement entropy as well as entanglement spectra does show similar behavior in honeycomb lattice.
Thus our study of the effect of interaction and disorder on square and honeycomb lattice in view of the modification of Butterfly effect and entanglement shows
importance of lattice connectivity to determine the ground state properties. Though we have used self consistent mean field approximation, we think that a
more accurate calculation would not qualitatively change the finding of our study. However it would be interesting to derive various aspect of our
study for example the value of critical interaction strength and disorder at the nullification point in an analytical way. However such study is beyond the scope of the present study and will be carried out in future. We may note that the mean-field method has been very effective in capturing the transition from charge density wave to spin density wave phase for one dimensional chemically modulated Hubbard chain at half filling and there was excellent agreement with the real space re-normalization method results gupta3 . The transition from paramagnetic to antiferromagnetic phase in two dimensional Hubbard model at half filling was captured very well by the UHF method and was in close agreement with the quantum Monte Carlo resultslin-1987 . Whereas in case of correlated Kondo type processes where there is a large effective mass re-normalization near Mott transition, methods like dynamical mean field theory are more capable than UHF in capturing the transition potthoff ; lederer . In light of this we think that the the parameter space being implemented in the present study is a realistic one. We think that with the advancement of recent progresses in cold atom systems in optical lattices sen-sen-2007 ; joller-2003 ; peden ; osterloh effect of interaction and disorder on Hofstadter butterfly may be achieved. Further in view of the scope of future avenue it is interesting to note that there are previous studies callan-1992 ; ouvry which investigated the effect of dissipation callan-1992 as well as non-hermitian effect ouvry on Hofstadter effect. As the dissipation parameterized by the friction parameter become greater than unity one obtains a phase transition from delocalised phase to localized phase. On the other hand the non-hermitian effect as modeled by the biased hopping along -direction shows a nested multi fractal structure. It may be noted that recently a lot of interest is shown in investigating the non-hermitian effect ashida-2020 ; ramy-2017 in various condensed matter system and its relation to dissipation and interaction. Thus our present study could be further extended in these directions and will be taken as a future endeavor.
Acknowledgement
S M thanks SAMKHYA: High Performance Computing Facility provided by the Institute of Physics, Bhubaneswar. S M also acknowledges S P Mandal without whose hospitality it would be impossible to complete the project in time.
Appendix
In this appendix we briefly explain and clarify various associated definitions and formulas that have been used in the text. We begin by a brief introduction of entanglement entropy.
Entanglement entropy for non-interacting tight binding Hamiltonian It is known that entanglement is understood mainly between two
quantum states where two states could be qubits or representative of two different region in space and time. Here we are interested in the entanglement between
two regions of interest say A and B. This two regions comprise the full system which in our case is a finite lattice such as square or honeycomb. The first step toward such estimation of entanglement entropy is calculation of reduced density matrix of A or B. For a tight binding model having only hopping interaction such as , the reduced density matrix of a given region say A can be calculated exactly by calculating the correlation function matrix of that region. By correlation function matrix we mean that if the region A contains sites the correlation function matrix is matrix i.e where and denote any two generic sites inside the region . For a free fermionic Hamiltonian as , one can exactly calculate the eigenvalues of as described in ent, . There is one to one correspondence between the eigenvalues of the correlation function matrix (say ) and the eigenvalues of the reduced density matrix of that region. By Wick’s theorem and following reference ent, , one can write the reduced density matrix of the region A in the following form,
| (7) |
In the above ’s are fermionic number operators corresponding to some fictitious eigenvalues ’s which are related to the eigenvalues of the correlation matrix eigenvalues by,
| (8) |
It is easy to find the constant in Eq. 7 from the condition and one obtains . Given the eigenvalues , one can then easily obtain the eigenvalues of the reduced density matrix from Eq. 7. These eigenvalues are expressed as,
| (9) |
There are choices of configurations of which yield the total eigenvalues. The von-Neuman entanglement entropy is defined as,
| (10) |
Using the definition of as given in Eq. 7, one arrives at the final formula for entanglement entropy as,
| (11) |
Thus we observe that entanglement entropy is completely determined by the eigenvalues of the correlation function matrix . Apart from the entanglement entropy entanglement spectra i.e distribution of is also found to be important. Instead of , one can equally look at correlation matrix spectra i,e the distribution of . In this study we have numerically studied entanglement entropy as well as correlation function spectra.
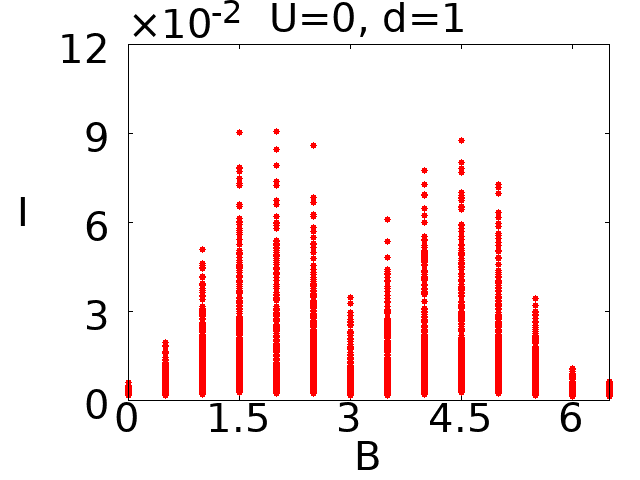
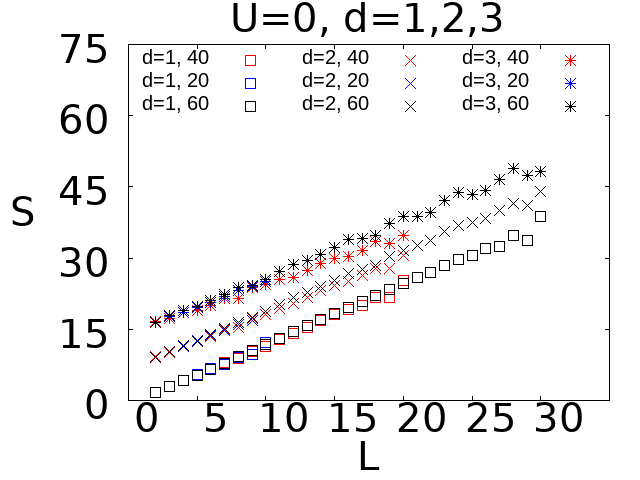
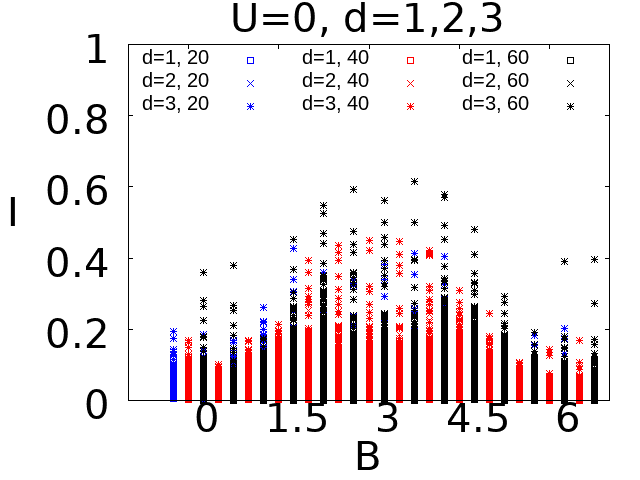
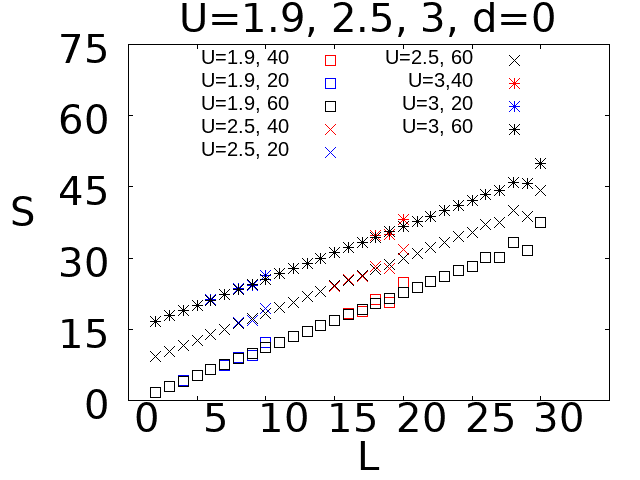
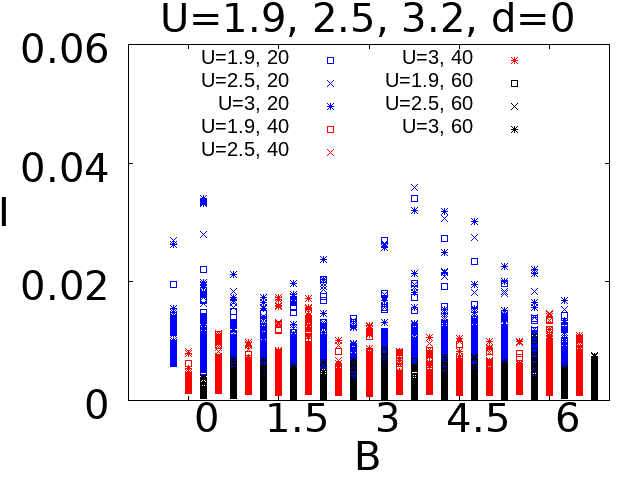
Notes on finite size effect of entanglement entropy: Now we discuss the effect of subsystem size and strength of disorder as well as of interaction. In the upper left panel of Fig. 11, we have plotted entanglement entropy for three different realizations of disorders. Also for each realizations, we took three different system sizes such as , and . The subsystem for each of these three systems begin with and ends at where . As can be seen that for system sizes with the largest subsystem does not show much departure from the linear behavior. However for system sizes 40 and 60, the larger subsystems always show some departure from linear behavior i.e from area law. If there is a genuine boundary effect which is causing these departure one would expect that such effect to disappear with larger system and subsystem sizes. This must come from some quasi-delocalized or fully delocalized modes that still exist in the presence of disorder. In the right lower panel of Fig. 11, we have plotted entanglement entropy for three different realizations of interactions and again we observe that there is departure from linear behaviour for larger subsystems independent of full system sizes. This also excludes the existence of any boundary effect and instead points out to the complexity of bulk modes at half filling. In the right panels we plotted inverse participation ratios (IPR) for disorder (upper panel) and interaction (lower panel). It shows that disorder is more effective into inducing localization as the IPR for interaction as lower by 10 times compared to what is obtained in the presence of interaction. However the departure from area law for the larger subsystems as discussed before indicates that eigenstates with low IPR values (which are possibly well delocalized) are causing this.
Definition of Inverse Participation Ratio: Consider that a given single particle normalized wavefunction can be expanded in the following way,
| (12) |
In the above is the creation operator at site ‘’ and denotes the probability amplitude. The inverse participation ratio maestro ; romera that is used to describe the degree of localization is defined as,
| (13) |
If the wave function is equally distributed over all the sites, one would have which yields, for thermodynamic system. On the other hand if the system is sharply localized at a given site say ’’, the one would have and .
Thus a value of close to zero describes a delocalized states and if the value of is close to 1 it describes a localized states.
Notes on amplitude of wave function: We refer the definition of as given in Eq. 12. Now as shown in Fig 1, the green line describes a path from the boundary to the the center of the finite system that we consider. "S" and "E" denote the starting and end point of this
path. The probability amplitude of () is plotted along this path in Fig. 6, 9. The sites along this path start from S (having numbered as 1) and increase upto ending at "E". Our system size is .
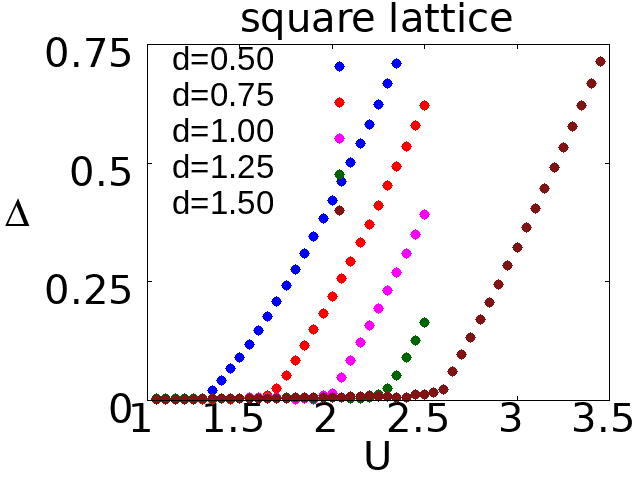
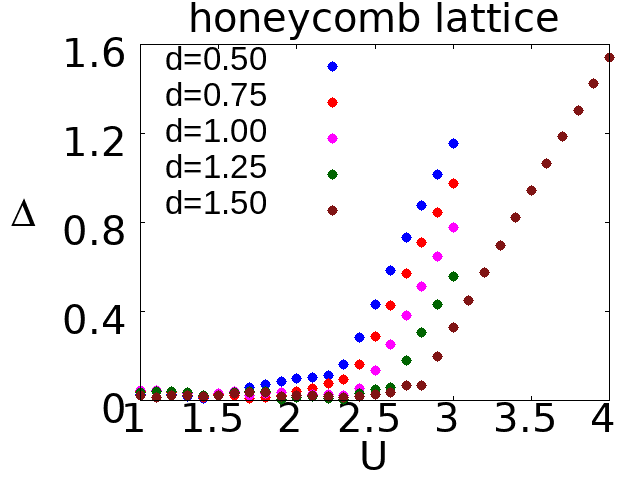
Discussions on critical interaction strength for various disorders: A pertinent and very relevant question is what happens if one varies the strength of Rudin-Shapiro disorder sequence. In the present study the four letter Rudin-Shapiro (A,B,C,D) has been taken as (0,1,0.5,1.5). In the manuscript this disorder is denoted as . For this strength critical values of interaction for square and honeycomb lattice are obtained as 1.9 and 2.3 respectively. Here we briefly discuss what happens if we scale the strength of Rudin-Shapiro disorder sequence and how the gap at half filling behaves as a function of . The result has been plotted in Fig. 12. As can be seen that the critical values of is directly proportional to the applied disordered strength. This further strengthen the main finding of this study is that disorder and interaction really try to nullify each other consistently for a wide range of parameters. From Fig. 12 we also note that as disorder strength varies from to the critical value of is spread from to for square lattice where as for honeycomb lattice it is spread within a narrow region of to . Thus we observe that effect of lattice coordinates play a major role in determining the critical values of interaction. However we must note that for various values of and the corresponding , the disappearance of Hofstadter spectra as well as re-appearance of it would qualitatively change from whatever presented in this study.
References
- (1) D. Hofstadter, Phys. Rev. B , 14, 2239(1976)
- (2) M. Ya. Azbel, Zh. Eksp. Teor. Fiz. 46, 929 (1964). [Sov. Phys. JETP 19, 634 (1964)]
- (3) Gi Yeong Oh, Journal of the Korean Physical Society 37, No. 5, November 2000, pp. 534-539
- (4) Godfrey Gumbs and Paula Fekete, Phys. Rev. B 56 3787 (1997)
- (5) Juan Li,Yi-Fei Wang and Chang-De Gong J. Phys.: Condens. Matter 23 156002(2001)
- (6) C. R.Dean Nature 497, 598-602(2013)
- (7) M. Wilkinson Proc. Roy. Soc. Lond. Series A, Mathematical and Physical Sciences391, 305-350(1984)
- (8) Chenggang Zhou, Mona Berciu, R. N. Bhatt, Phys. Rev. B 71, 125310 (2005)
- (9) Mikito Koshino and Tsuneya Ando, Phys. Rev. B 73, 155304 (2006)
- (10) Minh Tien Tran, Phys. Rev. B 81 115119(2010)
- (11) Katarzyna Czajka, Anna Gorczyca, Maciej M. Maśka, and Marcin Mierzejews, Phys. Rev. B 74, 125116 (2006)
- (12) Vidar Gudmundsson , Rolf Gerhardt, Phys. Rev. B 52 , 16744 (1995)
- (13) M. Wrobel, M. Mierzejewski, and M. M. Maska, Acta Phys. Pol A 118, 379(2010), arXiv:0912.4155
- (14) Subhasree Pradhan, J. Phys.: Condens. Matter 28 505502 (2016)
- (15) A. Aldea and M. Dulea, Phys. Rev. Lett. 60, 1672 (1988)
- (16) Tribikram Gupta and Sanjay Gupta Eur. Phys. Lett. 88, 17006 (2009)
- (17) Archana Mishra, S. R. Hassan, and R. Shankar, Phys. Rev. B, 93, 125134 (2016)
- (18) Archana Mishra, S. R. Hassan, and R. Shankar, Phys. Rev. B, 95, 035140 (2017)
- (19) R. O. Umucahlar and M. O. Oktel, Phys. Rev. A 76, 055601 (2007)
- (20) M. O. Oktel, M. Nita, and B. Tanatar, Phys. Rev. B 75, 045133 (2007)
- (21) L. Amico, R. Fazio, A. Osterloh, and V. Vedral, Rev. Mod. Phys. 80, 517 (2008)
- (22) H. Li and F. D. M. Haldane, Phys. Rev. Lett. 101, 010504 (2008)
- (23) Saptarshi Mandal, Moitri Maiti, Vipin Kerala Verma, Phys. Rev. B 94, 045421, (2016)
- (24) John Schliemann, 2013 New J. Phys. 15 053017
- (25) Zhoushen Huang and Daniel P. Arovas, Phys. Rev. B 86, 245109 (2012)
- (26) Z Moradi and J Abouie J. Stat. Mech. (2016) 113101
- (27) Y Claveau et al 2014, Eur. J. Phys. 35 035023
- (28) Sanjay Gupta, Shreekantha Sil and Bibhas Bhattacharyya, J. Phys.: Condens. Matter 18 (2006) 1987–1997
- (29) Sanjay Gupta, Shreekantha Sil, Bibhas Bhattacharyya, Physica B 355 (2005) 299–307
- (30) R. E. Peierls, Z. Phys. 80, 763 (1933)
- (31) Philip Lafrance, Narad Rampersad, Randy Yee, Advances in Applied Mathematics, 63 (2015) 19-40
- (32) I. Peschel, J. Phys. A 36, L205 (2003)
- (33) J. Eisert, M. Cramer and M. B. Plenio, Rev. Mod. Phys. 82, 277, 2010.
- (34) E. H. Lieb, Phys. Rev. Lett. 73, 2158 (1994)
- (35) L. Fidkowski, Phys. Rev. Lett. 104, 130502(2010)
- (36) M. Lewenstein, A. Sanpera, V. Ahufinger, B. Damski, A. Sen, and U. Sen, Adv. Phys. 56, 243 (2007)
- (37) D. Jaksch and P. Zoller, New J. Phys. 5, 56 (2003).
- (38) B. M. Peden, R. Bhat, M. Kramer, and M. J. Holland, J. Phys. B: At. Mol. Opt. Phys. 40, 3725 (2007)
- (39) K. Osterloh, M. Baig, L. Santos, P. Zoller, and M. Lewenstein, Phys. Rev. Lett. 95, 010403 (2005)
- (40) Vipin Kerala Varma and Marko Žnidari, Phys. Rev. B 100 , 085105 (2019).
- (41) Vipin Kerala Varma, Clélia de Mulatier, and Marko Žnidarič, Phys. Rev. B 96 032130 (2017).
- (42) Sanjay Gupta, Shreekantha Sil, Bibhas Bhattacharyya, Physical Review B, 63, 125113, (2001).
- (43) Lin H. Q. and Hirsch J. E., Phys. Rev. B, 35, 3359, (1987).
- (44) Potthoff M. and Nolting W., Physica B, volume 259-261 ,year 1999, page 760.
- (45) Lederer P. and Rozenberg M. J., EPL, volume 81,year 2008, page 67002.
- (46) Curtis G. Callan, Jr. and Denise Freed, Nuclear Physics B 374 (1992) 543-566
- (47) Maxim N.hernodub and Stephane Ouvry, Phys. Rev. E 92, 042102 (2015)
- (48) Yuto Ashidaa, Zongping Gonga, and Masahito Uedaa, Advances in Physics, 2020 Vol. 69, No. 3, 249–435, https://doi.org/10.1080/00018732.2021.1876991
- (49) Ramy El-Ganain, Konstantinos G. Makris, Mercedeh Khajavikhan, Ziad H. Musslimani, Stefan Rotter and Demetrios N. Christodoulides, Nature Physics volume 14, pages 11–19 (2018)
- (50) Udvas Chattopadhyay, Sunil Mittal, Mohammad Hafezi, and Y. D. Chong, Phys. Rev. B 103, 214201 (2021).
- (51) Timothy B P Clark and Adrian Del Maestro 2018 J. Phys. A: Math. Theor. 51 495003.
- (52) M Calixto and E Romera J. Stat. Mech. (2015) P06029.