Limited role of vortices in transport in highly disordered superconductors near
Abstract
At finite temperatures and magnetic fields, type-II superconductors in the mixed state have a non-zero resistance that is overwhelmingly associated with vortex motion. In this work we study amorphous indium oxide films, which are thicker than the superconducting coherence length, and show that near their resistance in the presence of perpendicular and in-plane magnetic fields becomes almost isotropic. Up to a linear rescaling of the magnetic fields both the equilibrium resistance as well as the non-equilibrium current-voltage characteristics are insensitive to magnetic field orientation suggesting that, for our superconductors, there is no fundamental difference in transport between perpendicular and in-plane magnetic fields. Additionally we show that this near-isotropic behavior extends to the insulating phase of amorphous indium oxide films of larger disorder strength that undergo a magnetic field driven superconductor-insulator transition. This near-isotropic behavior raises questions regarding the role of vortices in transport and the origin of resistance in thin-film superconductors.
.1 Introduction
Driving a transport current () through a thin film type-II superconductor in the mixed state results in finite dissipation and therefore finite resistance (). This finite is overwhelmingly associated with vortex motion Tinkham (2004); Bardeen and Stephen (1965); Tinkham (1964); Anderson (1962); Anderson and Kim (1964); Larkin and Ovchinnikov (1979); Feigel’Man et al. (1990); Blatter et al. (1994) where dissipation increases with vortex velocity which, in turn, is governed by an interplay between the Lorentz force, the vortex pinning force and a viscous damping of vortex motion Bardeen and Stephen (1965); Blatter et al. (1994).
In thin films the large discrepancy between thickness () and other sample dimensions (which we denote as , typically ) leads to an anisotropic response to perpendicular and parallel magnetic fields ( and ) even in an intrinsically isotropic material. This anisotropic response can be understood by comparing the lengthscales of the problem that affect the vortex pinning force. If is smaller than the coherence length, , which is the radius of a vortex (normal) core, vortices can penetrate the sample under the application of but not resulting in a pronounced anisotropy (some examples are high- superconductors Palstra et al. (1989), twisted bi-layer graphene Cao et al. (2018) and other thin-films Ruggiero et al. (1980)).
In films of intermediate thicknesses, where , vortices can penetrate both under and Foo (a) but their contribution to is expected to be significantly different. This is because the vortex pinning force is proportional to the vortex length (assuming vortices have a finite elasticity Larkin and Ovchinnikov (1979); Blatter et al. (1994)) which are and in and respectively. In addition, the characteristic distance over which vortices logarithmically interact (setting the size of vortex bundles that are collectively pinned Blatter et al. (1994)) is the penetration depth which in is rescaled from its bulk value to Tinkham (2004). As in our type-II superconductor, .
Recently, we studied the critical current () in a:InO films at low ’s and high ’s near Doron et al. (2019) and showed that is consistent with a thermal bi-stability. To study the contribution of vortex motion to we measured ’s in for two different angles between the source-drain current and (): and . Although the Lorentz force acting on vortices is , the measured ’s are independent of . This result suggests that is not a result of vortex de-pinning.
The anisotropy in a:InO films has been previously studied for samples of various disorder strengths by adjusting the angle between and the sample plane () Gantmakher et al. (2000); Paalanen et al. (1992); Johansson et al. (2011); Shammass et al. (2012). Experimental studies Johansson et al. (2011); Shammass et al. (2012) showed that at low ’s there is a pronounced anisotropy on both sides of the disorder driven superconductor-insulator transition (SIT), where in samples that are superconducting (at ) initially scales with the orbital component of () but at higher ’s the anisotropy decreases and becomes isotropic. This was demonstrated for all samples regardless of whether they were superconducting or insulating at . This behavior was explained in Ref. Porat and Meir (2015) using a percolation model which assumes that the sample is composed of superconducting islands. The anisotropic behavior is due to orbital effects that reduce the coherent coupling between superconducting islands and the isotropic behavior at high ’s is a result of a Zeeman field that causes the collapse of superconducting islands.
The goal of this work we are reporting here is to characterize the anisotropy in the resistance response of superconducting films of various thicknesses. We will show that: 1. Our superconductors are anisotropic at low ’s and turn isotropic near (as reported previously Johansson et al. (2011)) 2. We identified matching pairs of and where both equilibrium and the corresponding non-equilibrium ’s are identical, within experimental error. 3. Using a simple linear relation we can map all transport properties between and and 4. We demonstrate that a similar linear mapping between and applies to both equilibrium and non-equilibrium transport properties also in the -driven insulating phase of a:InO films of higher disorder at ’s below the magneto-resistance peak.
.2 Experimental
The data of superconducting samples presented in this study were obtained from five a:InO films of various thicknesses t=22, 26, 57, 100 and 280 nm. Each sample was thermally annealed post deposition to a room- of 4 mcm, which places them in the relatively low-disorder range of a:InO. All measurements were performed using an Oxford instruments Kelvinox dilution refrigerator with a base of 10mK, equipped with a z-axis magnet. In order to control the angle between and the sample plane the samples were mounted on a probe with a rotating head. While measuring in the superconducting phase, all measurement lines where filtered using room- RC filters with a cutoff frequency of 200 KHz.
To facilitate a meaningful comparison among our films of various thickness, we consider our results in terms of intensive parameters: current density (), electric field (), resistivity () and differential resistivity () where and are the sample’s length and width and is the voltage.
I Results and analysis
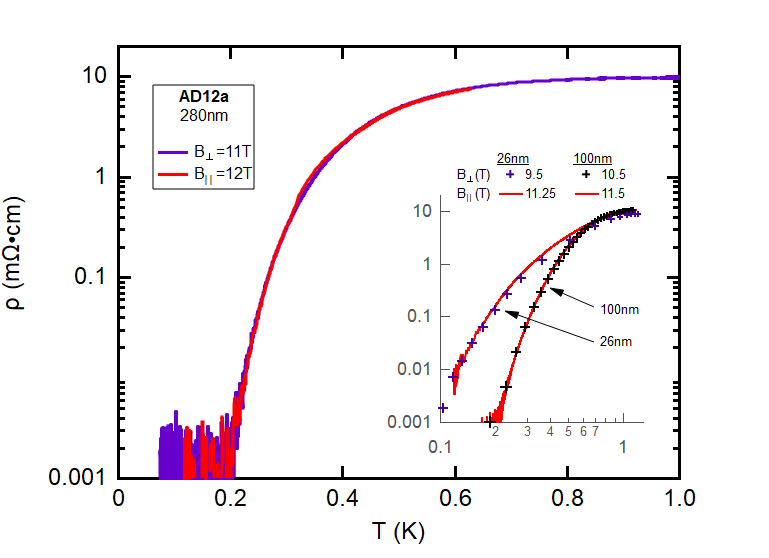
We begin by showing that we can identify pairs of ’s, -, for which the transport characteristics are virtually indistinguishable. In Fig. 1 we plot vs. of the 280nm thick film at T (red) and T (purple). In this pair of ’s we find that the curves are identical, within error, for both orientations. We refer to such pairs of and , having the same , as matching-’s. We could find such matching-’s virtually for our entire measurement range. In the inset of Fig. 1 we plot similarly matching-’s obtained from the 100nm and 26nm films.

Next we show that the correspondence within matching ’s extends beyond Ohmic transport and equally applies to the critical current of superconductivity, and beyond. In Fig. 2 we plot vs. of the 280nm thick film at T (purple) and T (red), the same matching-’s as in Fig. 1. In the inset of Fig. 2 we plot vs. for 26nm and 100nm thick films at the same matching ’s as those in the inset of Fig. 1.
The data presented in Figs. 1 and 2 portray the main point of this work: there is no fundamental difference in the transport properties of our superconductors between and and our samples, despite being thin-films, are in effect isotropic (as evident by the closeness of the values in matching-’s. The minor differences in matching-’s are discussed below). This holds for equilibrium (Fig. 1) as well as non-equilibrium (Fig. 2) transport.
This near-isotropic transport at high ’s deserves further consideration. In type-II superconductors the finite measured below the superconducting critical is typically associated with vortex motion. In our samples (nm Sacépé et al. (2015)) is smaller than the thickness therefore vortices can penetrate through the sample plane. As the vortex pinning-energy scales with its length Blatter et al. (1994), which changes by 3-4 orders of magnitude between the -orientations, one would expect to display a significant anisotropy. The measured (near-)isotropic behavior suggests that the origin of the finite measured at low ’s is not likely due to vortex motion.
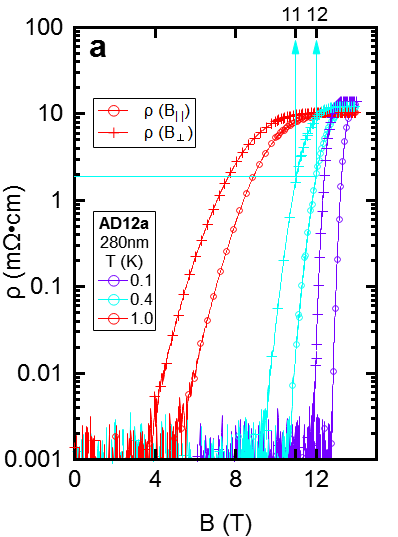
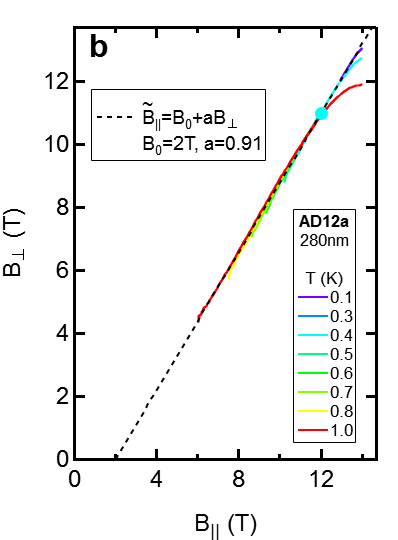
To gain further insight into this -orientation dependence, we inspect the shift in among the matching ’s. In Fig. 3a we plot vs. and of the 280nm thick sample at various ’s. To identify the law for matching ’s we perform a continuous mapping between and by finding -pairs that satisfy . For example, the horizontal light-blue line in Fig. 3a corresponds to mcm and the vertical light blue arrows mark its intersect with in both -orientations. In this example TKTK. In Fig. 3b we plot the result of this continuous mapping on a plane, the T, T matching-’s from the example above is marked by a light blue circle. The continuous lines are obtained by continuously varying and satisfying the condition and the colors correspond to performing the mapping at different ’s. The dashed black line marks the following linear mapping between equilibrium transport at the different orientations
| (1) |
where for the 280nm thick sample T and and () stands for a measurement at () rescaled according to Eq. 1.
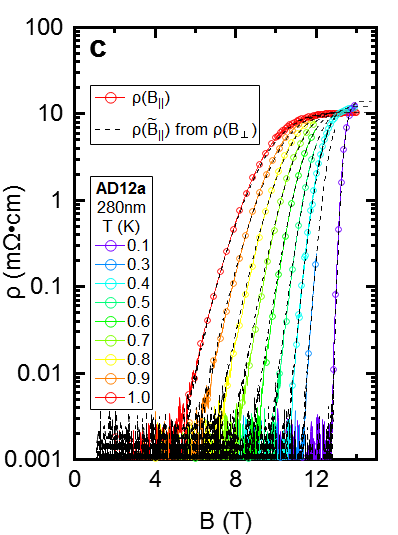
The quality of this linear mapping between both -orientations is demonstrated in Fig. 3c where circles connected by colored lines mark (colors mark different isotherms) and the dashed black lines mark at the corresponding ’s, i.e. the result of applying the mapping of Eq. 1 on measured data.

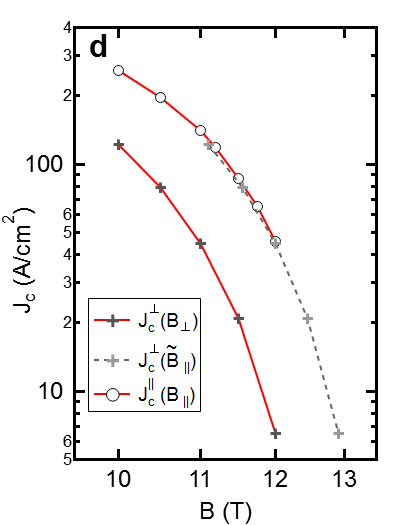
To test whether the mapping described in Eq. 1 and extracted from Ohmic measurements also applies to non-equilibrium transport we study whether this mapping can account for the anisotropy in critical current density () Foo (b). In Fig. 3d we plot measured at (, black crosses connected by a red line) and measured at (, circles connected by a red line) vs. the magnitude of . Gray crosses connected via a dashed gray line mark , namely measured in where the abscissa was rescaled according to Eq. 1. The collapse of and suggests that the linear mapping also holds for non-equilibrium transport. This result is consistent with the conclusions of Ref. Doron et al. (2019) where we showed that the critical currents are determined entirely by the Ohmic .
We repeated the process of mapping between the equilibrium and described above for four more samples of different thicknesses: 100nm, 57nm, 26nm and 22nm (See supplemental material Sup Sec. S1 for and of all samples). The results of these mappings are plotted in Figs. 4a-d (see Table. 1 in the supplemental material Sup for a summary of the mapping parameters). The mapping parameters and of the 100nm and 57nm thick films (Fig. 4a-b) are similar to those of the thicker 280nm thick film (Fig. 3b). For 26nm and 22nm thick films the mappings performed at different ’s did not fully converge as a whole into a single curve. We chose to perform the linear fit such that it best describes the low- range of the mapping. The resulting and do differ from that of the thicker samples. In the discussion section we consider reasons for the differences in mappings between thinner and thicker films. In Sec. S2 of the supplemental material Sup we show that, similarly to Fig. 3d, the equilibrium mappings displayed in Fig. 4 also maps the critical currents of both -orientations.
I.1 Discussion
Role of vortices in our type-II superconductor
The main conclusion from the results presented above is that there is no fundamental difference between transport at and , especially near where samples become isotropic Johansson et al. (2011); Shammass et al. (2012); Porat and Meir (2015) (see supplemental material Sup Fig. S2 for a study of vanishing anisotropy near in our superconducting samples). As vortices and pinning forces are expected to be drastically different between these -orientations, our results question the role of vortices in transport of highly disordered superconductors near . Adding to that the aforementioned result reported in Ref. Doron et al. (2019), that is independent of the angle between and , suggests that the finite and measured in our type-II superconductor at a finite is caused by a non-vortex mechanism and raises the interesting question of what actually causes in highly disordered superconductors near .
Mapping between and near the SIT
Up to now we discussed the similarity in transport between and only in relatively low disordered a:InO films that do not have a prominent insulating phase. a:InO films of higher disorder strength undergo a SIT Goldman and Markovic (1998); Gantmakher and Dolgopolov (2010); Sondhi et al. (1997) that can be driven by various parameters Hebard and Paalanen (1990); Yazdani and Kapitulnik (1995); Baturina et al. (2004); Shahar and Ovadyahu (1992); Parendo et al. (2006); Haviland et al. (1989); Goldman and Markovic (1998). It turns out that the above analysis is also relevant to higher disordered samples near the driven SIT Hebard and Paalanen (1990); Yazdani and Kapitulnik (1995); Baturina et al. (2004).
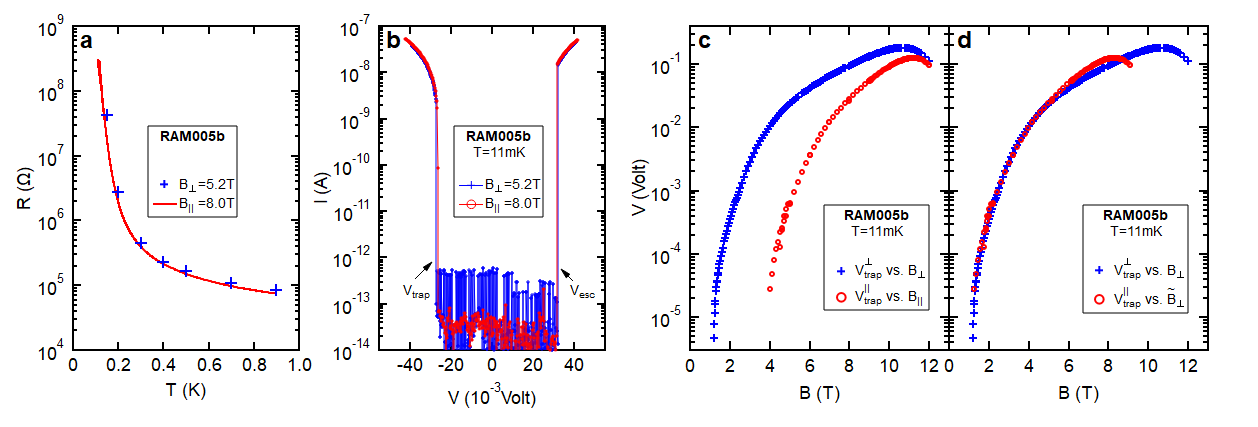
Below we consider sample RAM005b, a 30nm thick film that undergoes both and driven SIT’s (see Sec. S3 of the supplemental material Sup for and ). In Fig. 5a we plot at 5.2T (blue crosses) and at 8T (red line). In Fig. 5b we plot vs. at the same matching-’s at 11mK. We repeated the same mapping protocol described above and found a linear relation between equilibrium and as in Eq. 1 with and T (see supplemental material Sup for full details of the mapping).
Next we apply the mapping to non-equilibrium transport. The non-equilibrium properties we map in the insulating phase are the threshold ’s, apparent in Fig. 5b and marked as and , where the ’s exhibit a large discontinuity in Sambandamurthy et al. (2005) due to electron overheating Altshuler et al. (2009); Ovadia et al. (2009). In Fig. 5c we plot ( measured in ) vs. , and ( measured in ) vs. . It is apparent that at low ’s is anisotropic. In Fig. 5d we plot the same but now we plot vs. instead of vs. . Similar to the superconducting phase, the insulating phase also exhibits the apparent collapse of the threshold ’s (in the range T and T).
The main difference between the mappings in both phases is in its regime of applicability. While in the superconducting phase the mapping applies for the whole range, including near where becomes isotropic, in the insulating phase the mapping breaks at high ’s (T and T). We note that in the ranges where the mapping applies, the insulating phase of a:InO has an underlying superconducting nature where transport is carried mainly by Cooper-pairs that become spatially localized Feigel’man et al. (2010); Dubi et al. (2007); Gantmakher et al. (1996); Nguyen et al. (2009); Sacépé et al. (2011, 2015); Crane et al. (2007); Paalanen et al. (1992); Breznay et al. (2016); Steiner and Kapitulnik (2005). At higher ’s, beyond a well studied peak in the magnetoresistance Paalanen et al. (1992), it is believed that superconductivity terminates locally and transport is carried mainly by quasi-particles Paalanen et al. (1992); Breznay et al. (2016); Steiner and Kapitulnik (2005). In that range in the insulator the mapping is no longer applicable.
Linear mapping between transport at and
The basis for the linear relation between and , described by Eq. 1, is not clear yet. We summarize below all of our major observations that a future theoretical description should account for: 1. There is a linear mapping relating transport properties in and that equally applies to equilibrium and non-equilibrium situations. 2. The fit parameters and do not vary much between samples of thicknesses greater than 57nm, but these parameters are significantly different for the 22nm and 26nm thick films. This suggests that there is an important lengthscale which is greater than 26nm and smaller than 57nm. This lengthscale is unknown to us as for a:InO samples nm Sacépé et al. (2015), m (see Sec. S2 of the supplemental material of Ref. Doron et al. (2019) which uses experimental results of Refs. Misra et al. (2013); Crane et al. (2007)), the mean-free path is smaller than 1nm, the magnetic length corresponding to in samples thicker than 57nm is 19nm and in the 22nm and 26nm thick samples it is 12nm. 3. In the thinner 22nm and 26nm thick samples the mapping has some -dependence. 4. The mapping also applies to the -driven insulating phase of a:InO for ’s below the magneto-resistance peak.
One possible explanation for the isotropic behavior is that our samples are practically three dimensional. Following this logic one can account for the finite values as some geometric rescaling due to the large discrepancy between and the other sample dimensions that accounts for the finite nature of . If that was indeed the case we would expect that as we approach the 3d limit, namely as increases, the mapping parameters would tend towards and . Comparing these parameters of the 57nm, 100nm and 280nm thick films shows that .
Another possible interpretation is that is related to a finite of the sample where, at low ’s, there is a full Meissner effect. It was pointed to us Meir that following this interpretation and using a slightly extended percolation approach than that of Ref. Porat and Meir (2015) can lead to the linear relation of Eq. 1. It is unclear to us whether this approach can also explain the linear mapping in the insulating phase.
In summary, the isotropic behavior detailed in this work suggests that the role of vortices in the mixed state of our highly disordered type-II superconductor is limited. We show that the rather weak measured anisotropy can be adjusted using a linear mapping between and .
Acknowledgements.
We are grateful to Y. Meir and K. Michaeli for fruitful discussions.Funding
This research was supported by The Israel Science Foundation (ISF Grant no. 556/17), the United States - Israel Binational Science Foundation (BSF Grant no. 2012210) and the Leona M. and Harry B. Helmsley Charitable Trust.
References
- Tinkham (2004) M. Tinkham, Introduction to superconductivity (Courier Corporation, 2004).
- Bardeen and Stephen (1965) J. Bardeen and M. Stephen, Physical Review 140, A1197 (1965).
- Tinkham (1964) M. Tinkham, Physical Review Letters 13, 804 (1964).
- Anderson (1962) P. Anderson, Physical Review Letters 9, 309 (1962).
- Anderson and Kim (1964) P. W. Anderson and Y. Kim, Reviews of modern physics 36, 39 (1964).
- Larkin and Ovchinnikov (1979) A. Larkin and Y. N. Ovchinnikov, Journal of Low Temperature Physics 34, 409 (1979).
- Feigel’Man et al. (1990) M. Feigel’Man, V. Geshkenbein, and A. Larkin, Physica C: Superconductivity 167, 177 (1990).
- Blatter et al. (1994) G. Blatter, M. V. Feigel’man, V. B. Geshkenbein, A. I. Larkin, and V. M. Vinokur, Reviews of Modern Physics 66, 1125 (1994).
- Palstra et al. (1989) T. Palstra, B. Batlogg, R. Van Dover, L. Schneemeyer, and J. Waszczak, Applied physics letters 54, 763 (1989).
- Cao et al. (2018) Y. Cao, V. Fatemi, S. Fang, K. Watanabe, T. Taniguchi, E. Kaxiras, and P. Jarillo-Herrero, Nature 556, 43 (2018).
- Ruggiero et al. (1980) S. Ruggiero, T. Barbee Jr, and M. Beasley, Physical Review Letters 45, 1299 (1980).
- Foo (a) In-plane vortices have their symmetry axis parallel to the sample plane.
- Doron et al. (2019) A. Doron, I. Tamir, T. Levinson, F. Gorniaczyk, and D. Shahar, arXiv preprint arXiv:1908.09303 (2019).
- Gantmakher et al. (2000) V. Gantmakher, M. Golubkov, V. Dolgopolov, A. Shashkin, and G. Tsydynzhapov, Journal of Experimental and Theoretical Physics Letters 71, 473 (2000).
- Paalanen et al. (1992) M. A. Paalanen, A. F. Hebard, and R. R. Ruel, Phys. Rev. Lett. 69, 1604 (1992).
- Johansson et al. (2011) A. Johansson, I. Shammass, N. Stander, E. Peled, G. Sambandamurthy, and D. Shahar, Solid State Communications 151, 743 (2011).
- Shammass et al. (2012) I. Shammass, O. Cohen, M. Ovadia, I. Gutman, and D. Shahar, Physical Review B 85, 140507 (2012).
- Porat and Meir (2015) E. Porat and Y. Meir, Physical Review B 92, 024509 (2015).
- Sacépé et al. (2015) B. Sacépé, J. Seidemann, M. Ovadia, I. Tamir, D. Shahar, C. Chapelier, C. Strunk, and B. A. Piot, Physical Review B 91, 220508 (2015).
- Foo (b) has a small hysteresis. We swept from negative to positive values and define as that in the negative ”trapping” side of the ’s.
- (21) See supplemental material at URL.
- Goldman and Markovic (1998) A. M. Goldman and N. Markovic, Phys. Today 51, 39 (1998).
- Gantmakher and Dolgopolov (2010) V. F. Gantmakher and V. T. Dolgopolov, Phys.-Usp. 53, 1 (2010).
- Sondhi et al. (1997) S. L. Sondhi, S. M. Girvin, J. P. Carini, and D. Shahar, Rev. Mod. Phys. 69, 315 (1997).
- Hebard and Paalanen (1990) A. F. Hebard and M. A. Paalanen, Phys. Rev. Lett. 65, 927 (1990).
- Yazdani and Kapitulnik (1995) A. Yazdani and A. Kapitulnik, Phys. Rev. Lett. 74, 3037 (1995).
- Baturina et al. (2004) T. I. Baturina, D. R. Islamov, J. Bentner, C. Strunk, M. R. Baklanov, and A. Satta, JETP Lett. 79, 337 (2004).
- Shahar and Ovadyahu (1992) D. Shahar and Z. Ovadyahu, Phys. Rev. B 46, 10917 (1992), URL http://link.aps.org/doi/10.1103/PhysRevB.46.10917.
- Parendo et al. (2006) K. A. Parendo, K. H. S. B. Tan, and A. M. Goldman, Phys. Rev. B 73, 174527 (2006), URL https://link.aps.org/doi/10.1103/PhysRevB.73.174527.
- Haviland et al. (1989) D. B. Haviland, Y. Liu, and A. M. Goldman, Phys. Rev. Lett. 62, 2180 (1989).
- Sambandamurthy et al. (2005) G. Sambandamurthy, L. W. Engel, A. Johansson, E. Peled, and D. Shahar, Phys. Rev. Lett. 94, 017003 (2005).
- Altshuler et al. (2009) B. L. Altshuler, V. E. Kravtsov, I. V. Lerner, and I. L. Aleiner, Phys. Rev. Lett. 102, 176803 (2009).
- Ovadia et al. (2009) M. Ovadia, B. Sacépé, and D. Shahar, Physical review letters 102, 176802 (2009).
- Feigel’man et al. (2010) M. Feigel’man, L. Ioffe, V. Kravtsov, and E. Cuevas, Annals of Phys. 325, 1390 (2010).
- Dubi et al. (2007) Y. Dubi, Y. Meir, and Y. Avishai, Nature 449, 876 (2007).
- Gantmakher et al. (1996) V. F. Gantmakher, M. V. Golubkov, J. G. S. Lok, and A. K. Geim, JETP 82, 951 (1996).
- Nguyen et al. (2009) H. Q. Nguyen, S. M. Hollen, M. D. Stewart, J. Shainline, A. Yin, J. M. Xu, and J. M. Valles, Phys. Rev. Lett. 103, 157001 (2009).
- Sacépé et al. (2011) B. Sacépé, T. Dubouchet, C. Chapelier, M. Sanque, M. Ovadia, D. Shahar, M. Feigel’man, and L. Ioffe, Nat. Phys. 7, 239 (2011).
- Crane et al. (2007) R. Crane, N. P. Armitage, A. Johansson, G. Sambandamurthy, D. Shahar, and G. Grüner, Physical Review B 75, 184530 (2007).
- Breznay et al. (2016) N. P. Breznay, M. A. Steiner, S. A. Kivelson, and A. Kapitulnik, Proceedings of the National Academy of Sciences 113, 280 (2016).
- Steiner and Kapitulnik (2005) M. Steiner and A. Kapitulnik, Physica C: Superconductivity 422, 16 (2005).
- Misra et al. (2013) S. Misra, L. Urban, M. Kim, G. Sambandamurthy, and A. Yazdani, Physical review letters 110, 037002 (2013).
- (43) Y. Meir, Private communication.