Dimensional Emotion Detection from Categorical Emotion
Abstract
We present a model to predict fine-grained emotions along the continuous dimensions of valence, arousal, and dominance (VAD) with a corpus with categorical emotion annotations. Our model is trained by minimizing the EMD (Earth Mover’s Distance) loss between the predicted VAD score distribution and the categorical emotion distributions sorted along VAD, and it can simultaneously classify the emotion categories and predict the VAD scores for a given sentence. We use pre-trained RoBERTa-Large and fine-tune on three different corpora with categorical labels and evaluate on EmoBank corpus with VAD scores. We show that our approach reaches comparable performance to that of the state-of-the-art classifiers in categorical emotion classification and shows significant positive correlations with the ground truth VAD scores. Also, further training with supervision of VAD labels leads to improved performance especially when dataset is small. We also present examples of predictions of appropriate emotion words that are not part of the original annotations.
1 Introduction
In psychology literature, basic emotions are categorized as happy, sad, angry and so on Ekman (1992); Plutchik (2001), however, we can feel and express more subtle and complex emotions beyond them. They can be systematically represented with the Valence-Arousal-Dominance (VAD) model which maps emotional states to 3-dimensional continuous VAD space. This space allows various emotions to be projected into the space with measurable distances from one another Russell and Mehrabian (1977), covering a wider range of subtle emotions compared to the categorical models with a finite set of basic emotions. Capturing such fine-grained emotions with dimensional VAD models could benefit clinical natural language processing (NLP) Desmet and Hoste (2013); Sahana and Girish (2015), emotion regulation such as psychotherapy Torre and Lieberman (2018). For example, analyzing the client’s utterance and acknowledging the negative emotion as ‘neglected’ rather than ‘sad’, which is known as ‘affect labeling’, would reduce negative physiological, behavioral, and psychological responses resulting from that emotional state.
Thus developing a dimensional emotion detection model would be very useful, but one problem is a lack of required annotated resources. There is a relatively small sentence-level corpus with full VAD annotations Buechel and Hahn (2017), and a corpus annotated with V and A dimensions Preoţiuc-Pietro et al. (2016a); Yu et al. (2016a), and only with V Lykousas et al. (2019). We could build additional resources by labeling VAD scores by Best-Worst Scaling Kiritchenko and Mohammad (2017). Instead, we approach this problem with a novel and more efficient method to predict VAD scores from existing corpora annotated with categorical emotions Scherer and Wallbott (1994); Alm et al. (2005); Aman and Szpakowicz (2007); Mohammad (2012); Sintsovaa and Musata (2013); Li et al. (2017); Schuff et al. (2017); Shahraki and Zaiane (2017); Mohammad et al. (2018).
In this paper, we propose a framework to learn the VAD scores from sentences with categorical emotion labels by leveraging the VAD scores of the label words obtained from the NRC-VAD lexicon Mohammad (2018). We demonstrate our approach by fine-tuning a pre-trained language model RoBERTa Liu et al. (2019). Our model learns conditional VAD distributions through supervision of categorical labels and uses them to compute VAD scores as well as to predict the emotion labels for a given sentence. Our contributions are as follows.
-
•
We propose a framework which enables learning to predict VAD scores as well as categorical emotions from a sentence only with categorical emotion labels.
-
•
Our model shows significant positive correlations to corresponding ground truth VAD scores.
-
•
Our model outperforms state-of-the-art dimensional emotion detection models by fine-tuning with supervision of VAD scores when the training dataset size is limited.
2 Approach
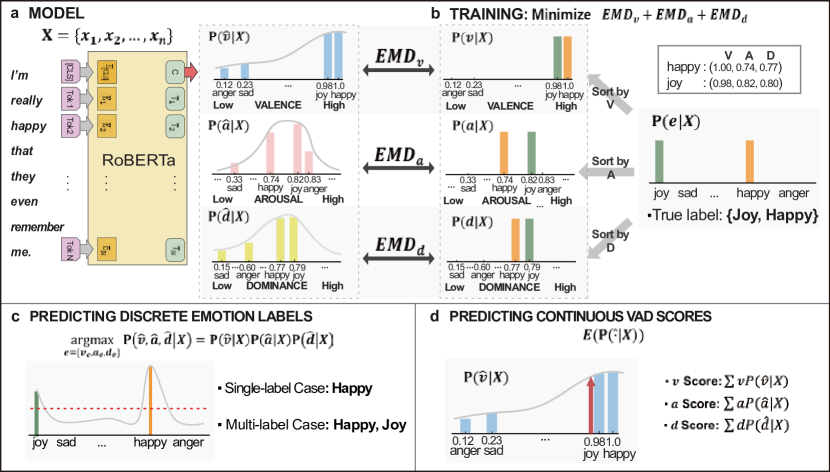
Overview. We predict VAD scores for a given text from a model trained on a dataset with categorical emotion annotations. The key idea is to train VAD prediction model by using categorical emotion labels. It is possible because we find that those categorical labels can be mapped to word-level VAD scores by using NRC-VAD lexicon Mohammad (2018). Thus we conceptualize categorical emotion as a point in the VAD space. Then we sort the labels by each VAD dimension to obtain (sparse) ground truth conditional VAD distributions (Fig. 1a, 1b). Then we train a model to predict the VAD distributions, rather than an emotion category, by minimizing the distance between the predicted and the ground truth distributions. This allows the model to predict the VAD scores (expectations of predicted distributions, Fig. 1d) and pick an emotion label within a given set of categorical labels (argmax of emotion labels, Fig. 1c).
Model Architecture (Fig 1a). Formally, an emotion detection model is where is an emotion drawn from a set of pre-defined categorical emotions , and is a sequence of symbols representing the input text. Usually is a one-hot vector in emotion classification.
Unlike classification models directly learning , we learn each distribution of V, A, and D from a pair of input text and categorical labels. To this end, we map the categorical emotion labels to the three-dimensional VAD space, , using the NRC-VAD Lexicon. Each and, ranges from 0 to 1. For example, an emotion label "joy" is mapped to (0.980, 0.824, 0.794) and "sad" to (0.225, 0.333, 0.149) Mohammad (2018). Using s, our model predicts the following distribution:
| (1) |
Furthermore, since the VAD dimensions are nearly independent Russell and Mehrabian (1977), we simply assume mutual independence:
| (2) |
For each decomposed conditional distribution, we can use any type of trainable function with sufficient complexity to capture the linguistic patterns from the given input. As a demonstration, we use pre-trained bidirectional language model RoBERTa Liu et al. (2019) which shows high performances in natural language understanding tasks if fine-tuned over task-specific datasets. We stack a softmax or sigmoid activation layer over the hidden state corresponding to [CLS] token in the model for each conditional distribution.
Model Training (Fig 1b). To train our model, we need to obtain target conditionals for each from categorical emotion labels. We simply sort categorical emotions in by V, A, D scores respectively, based on the mapped VAD coordinates. For example, if we have four emotions in the categorical labels and they have corresponding valence (V) scores (0.980, 0.225, 1.000, 0.167) in NRC-VAD Mohammad (2018), then we sort the labels in the order (anger, sad, joy, happy) and the corresponding one-hot labels to obtain the target conditional . In other words, by rearranging the label positions in ascending order of valence scores, sorted one-hot labels can be treated as a proxy of target conditionals. Similarly, we sort the labels for the A, D dimensions to obtain the other conditionals. They will be sparse because we only have points for each dimension.
Next, we minimize the distances between the true and predicted s. Since we sorted the labels, there is ordering among the classes. This should be taken into account during optimization, so we minimize the squared Earth Mover’s Distance (EMD) loss Hou et al. (2017) between them to consider the order of labels as follows:
| (3) |
where is the true conditional, is the predicted conditional and is class index. Formally, EMD loss is the squared difference between the cumulative distribution function (CDF) and the corresponding . The loss penalizes the mispredictions according to a distance matrix that quantifies the dissimilarities between classes. For instance, if a ground truth is ‘happy’, the loss give more penalty to a prediction ‘sad’ compared to ‘joy’ because ‘sad’ is way more far from ‘happy’ than ‘joy’ on the V dimension. Simple cross-entropy loss cannot reflect this distance between classes.
Note that Eq. 3 has an assumption that the probability mass of and should be the same. In the single label case, i.e., if the categorical label can appear only once for each text, it could be easilty satisfied when using softmax for . However, in multi-label, this assumption is violated because generally sigmoid is used to represent positive probabilities for each class independently. Thus we slightly change Eq. 3 to satisfy the assumption, defining interclass EMD loss:
| (4) |
where and are corresponding probabilities for class in normalized and . In addition, as shown in Fig. 1d, the distances between classes are usually not the same, so we give larger weights if they are far from each other through . is one of the corresponding V, A, D values for class , and if . We also introduce intraclass EMD loss:
| (5) |
where we assume could be divided into two classes, , which represent the probability of belonging to class : () and not belonging to class : (). Finally we sum two EMD losses for multi-labeled case as follows:
| (6) |
Finally, we minimize the sum of three squared EMD losses between target and predicted distributions for each of VAD dimensions:
| (7) |
where , , denote target and , , predicted conditional distributions.
Predicting Continuous VAD Scores (Fig. 1d). We can further compute the expectations of each predicted conditional distributions of V, A, D dimension to predict the continuous VAD scores.
| (8) |
Once again, we use the VAD scores in Mohammad (2018) for each dimension when computing the expectations. This allows us to predict continuous VAD scores from the model which is trained over categorical emotion annotations.
Predicting Categorical Emotion Labels (Fig. 1c). We can further recover categorical emotions from the predicted distributions. We pick one emotion label from a given set as in the conventional emotion classifiers. By computing the product of predicted , , , we obtain predicted assuming conditional independence. Then we pick an emotion label as follows:
| (9) |
Since we only have given emotion labels, we compare the joint probabilities of and pick one emotion label having the maximum probability among labels (single-label case, Eq. 9), or multiple labels with probability over a certain threshold (multi-label case). The threshold is a hyperparameter of the model, set to , a geometric mean of the three distributions.
3 Experiments
We mainly focus on demonstrating our approach can effectively predict continuous emotional dimensions only with categorical emotions throughout experiments.
3.1 Dataset
We use four existing datasets consisting of text and corresponding emotion annotations. Three of them have categorical emotion labels, and the last is annotated with VAD scores.
SemEval 2018 E-c (SemEval). A multi-labeled categorical emotion corpus contains 10,983 tweets and corresponding labels for presence or absence of 11 emotions Mohammad et al. (2018). We abbreviate this hereafter as SemEval. We use pre-splits of train, valid, test set of the dataset.
ISEAR. A single-labeled categorical emotion annotated corpus contains 7,666 sentences. A label can have only one emotion among 7 categorical emotions Scherer and Wallbott (1994). We split the dataset in a stratified fashion in terms of the labels. The train, valid, test set is split by the ratios (0.7:0.15:0.15).
GoEmotions. A multi-labeled categorical dataset consisted of of 58,009 reddit comments with 28 emotion labels including neutral class Demszky et al. (2020). However, the original dataset with 28 emotion labels has large disparity in terms of emotion frequencies (admiration is 30 times more frequent that grief). To reduce the side-effects from this property, we choose the ‘Ekman’ option of the dataset provided by the authors which consists of 7 emotion labels including neutral class. We use pre-splits of train, valid, test set of the dataset.
EmoBank. Sentences paired with continuous VAD scores as labels. This corpus contains 10,062 sentences collected across 6 domains and 2 perspectives. Each sentence has three scores representing VAD in the range of 1 to 5. Unless otherwise noted, we use the weighted average of VAD scores as ground truth scores, which is recommended by EmoBank authors. We use pre-splits of train, valid, test set of the dataset Buechel and Hahn (2017).
3.2 Dimensional Emotion (VAD) Prediction
We investigate VAD score prediction performance of our approach and compare them to the state-of-the-art models. Since training objectives of models vary, we use Pearson’s correlation coefficient as the evaluation metric.
3.2.1 Zero-shot VAD Prediction
Our Models. We compute the VAD score predictions using Eq. 8 with our model trained on three datasets with categorical emotion annotations (SemEval, ISEAR, GoEmotions). We call these results as zero-shot prediction performances because they are not trained over the EmoBank train-set, only using the EmoBank test-set for evaluation. This could be interpreted as how much a model can generalize the categorical emotions into the continuous VAD space using only fixed points in the space. These are denoted as (Ours, ) where SemEval, ISEAR, GE in Table. 1. We highlight these results to evaluate our main idea.
3.2.2 VAD Prediction with Supervision
We continuously train the our zero-shot models with the train-set of the EmoBank, and compare their performance with other methods which relies on the direct supervision from them. This allow us to compare the zero-shot prediction performances against them, and how much the zero-shot prediction model could be improved if VAD annotations are available. We also compare data scarce scenarios, only using a part of Emobank training-set.
Our Models. We fine-tune our zero-shot models once again on the Emobank train-set. In the first stage, we train zero-shot models by combining the EMD loss with MLM loss to prevent catastrophic forgetting Chronopoulou et al. (2019). In the second stage, we add another linear layer and ReLU activations on top of the model for each VAD dimensions. All of the parameters are fine-tuned by minimizing the mean squared error loss (MSE). During fine-tuning, parameters are freezed for 5 epochs except the added linear layer and then all parameters are unfreezed. Through this model, we investigate the effectiveness of our approach as a parameter initialization strategy of VAD regression model where the VAD annotations are available. These models are denoted as (Ours, EB) where SemEval, ISEAR, GE in Table. 1.
AAN. Adversarial Attention Network for dimensional emotion regression which learns to discriminate VAD dimension scores Zhu et al. (2019). Pearson correlations of predicted and ground truth of VAD scores in EmoBank are reported. Since the scores are reported by 2 perspectives and 6 domains respectively, we use the highest VAD correlations among perspective and domains.
Ensemble. Multi-task ensemble neural networks which learns to predict VAD scores, sentiment, and their intensity simultaneously Akhtar et al. (2019).
SRV-SLSTM. Predicting VAD scores through variational autoencoders trained by semi-supervised learning, which shows state-of-the-art performance on the VAD score prediction task Wu et al. (2019). The model shows highest performance when using 40% of labeled Emobank data, so we compare our model’s performances to scores of that setting.
RoBERTa-Large (Regression). We add simple yet effective baseline for fair comparison. We add a linear layer with Relu on top of pre-trained RoBERTa Liu et al. (2019) for training on a entire EmoBank training-set. The models are optimized by minimizing the mean squared error loss (MSE).
3.3 Categorical Emotion Prediction
We examine classification performances of our approach and compare them to the state-of-the-art emotion classification models. We use accuracy and macro/micro F1 scores as evaluation metrics.
Our Models. We fine-tune RoBERTa with our EMD objective and predict the emotion category as shown in Fig 1c. For a multi-labeled dataset (SemEval, GoEmotions), we minimize Eq. 7 with Eq. 6. For a single-labeled dataset (ISEAR), we fine-tune RoBERTa by minimizing Eq. 7 with Eq. 3 for each VAD dimension. These models are denoted as (, M) where SemEval, ISEAR, GoEmotions and state-of-the-art, RoBERTa, Ours in Table. 2.
MT-CNN. A convolutional neural network for text classification trained by multi-task learning Zhang et al. (2018). The model jointly learns classification labels and emotion distributions of a given text. The model reaches state-of-the-art classification accuracy and F1 score on ISEAR.
NTUA-SLP. A classifier using deep self-attention layers over Bi-LSTM hidden states. The models is pre-trained on general tweets and ‘SemEval 2017 task 4A’, then fine-tuned over all ‘SemEval 2018 subtasks’ Baziotis et al. (2018). The model took first place in multi-labeled emotion classification task on SemEval.
Seq2Emo A sequence-to-sequence model for multi-label classification task. Huang et al. (2019). The model additionally leverages correlations between emotion labels during classification.
RoBERTa-Large (Classification). As a simple baseline, we add a linear layer with sigmoid activation on RoBERTa Liu et al. (2019) for training on a multi-labeled dataset (SemEval, GoEmotions) or softmax activation for single-labeled dataset (ISEAR). These models are optimized by minimizing the cross-entropy loss.
3.4 Experimental Details
In all experiments, we use PyTorch version of RoBERTa-Large from Huggingface Transformers Wolf et al. (2019). We set the learning rate to 3e-5, batch size to 32. Fine-tuning parameters is stopped when the validation loss and and evaluation metrics are converged. We use 1 RTX 6000 GPU for optimization. More details are in Appendix. We release our implementation in GitHub. 111https://github.com/SungjoonPark/EmotionDetection
| Dataset |
|
|||||
|---|---|---|---|---|---|---|
| Task | Regression | |||||
| Model | Scheme | V (r) | A (r) | D (r) | ||
| Ours, SemEval | Zero-shot | .715 | .319 | .308 | ||
| Ours, ISEAR | Zero-shot | .611 | .083 | .242 | ||
| Ours, GE | Zero-shot | .630 | .277 | .311 | ||
| AAN | Supervised | .424 | .352 | .265 | ||
| Ensemble | Supervised | .635 | .375 | .277 | ||
| SRV-SLSTM | Semi-super. | .620 | .508 | .333 | ||
| RoBERTa-Large | Supervised | .829 | .569 | .513 | ||
| Ours, EBSemEval | Supervised | .838 | .570 | .518 | ||
| Ours, EBISEAR | Supervised | .836 | .568 | .536 | ||
| Ours, EBGE | Supervised | .835 | .573 | .529 | ||
4 Results
Zero-Shot VAD Prediction. The results are shown in Table 1. When our model is trained on SemEval and tested on Emobank, the predicted VAD scores show significant positive Pearson’s correlation coefficients with target VAD scores in EmoBank. The correlation in valence (V) shows the highest score among the dimensions (r=.715, p.001), followed by arousal (A) (r=.319, p.001), and dominance (D) (r=.308, p.001). For our model trained on ISEAR dataset, the scores also show significant positive Pearson’s . The correlation in V dimension is highest (r=.611, p.001), followed by D (r=.242, p.001), and A (r=.083, p.001). For GoEmotions dataset, the highest correlation is also V dimension (r=.630, p.001), followed by dominance (D) (r=.311, p.001), and arousal (A) (r=.277, p.001). We observe prediction performances of VAD scores from text usually are the best in V dimension and A, D follows. These tendencies are observed in our experiments as well as in other baselines (AAN, Ensemble, SRV-SLSTM).
The average of correlations between dataset is in the order of SemEval (.448), GoEmotions (.406), and ISEAR (.312) in descending order. The main reason SemEval has best performance is because emotion labels in SemEval have more information than that of ISEAR or GoEmotions. First, SemEval has 11 categorical emotion annotations whereas ISEAR and GoEmotions have 7 labels each. More labels lead to less sparse VAD target distributions, thus our model can distinguish the extent of VAD more easily where there are more labels. Second, SemEval and GoEmotions can have multiple emotion labels for every sentence, but ISEAR has only one label. Apparently, these multiple emotion labels makes the possible range of the expected VAD scores much wider than that of single emotion labels. If a sentence always should have a single label, then the predicted VAD distribution must sum up to one. Having multiple labels enables the distributions to sum to a larger number, which leads to a wider range of the expected values that help the model distinguish the degree of VAD dimensions for a given sentence.
Note that we observe the correlation in A dimension of ISEAR is low. We see that the standard deviation of arousal scores of ISEAR labels ‘anger’, ‘disgust’, ‘fear’, ‘sadness’, ‘shame’, ‘joy’, ’guilt’ is lower (.191) than other dimensions, (V: .313, D: .235) and actually it becomes much lower when only one label ’sadness’, is removed, dropping to (.105). This makes model difficult to differentiate labels in terms of the degree of arousal, leading to lower correlation for the A dimension.
VAD prediction with Supervision. Three comparison models (AAN, Ensemble, SRV-SLTSTM) in Table 1 are trained by supervision of VAD scores. Among the comparison models, Ensemble shows the highest correlation on V dimension (.635), SRV-SLSTM reaches to the highest correlation on A (.508) and D (.333) dimensions. We emphasize that our model trained on SemEval shows even better correlation in the V dimension (.715) without any supervision of VAD scores. Correlation for A (.319) is next which is slightly lower than AAN and Ensemble, and correlation for D (.308) is comparable to SRV-SLTSTM.
Furthermore, we observe that if we continue training our zero-shot models with supervision of VAD labels, our model outperforms all of the state-of-the-art models with a large margin. For model trained on SemEval, the VAD fine-tuned model shows a significant correlation in V (r=.838, p.001), A (r=.570, p.001) and D (r=.518, p.001) dimensions. For ISEAR, the fine-tuned model shows correlation of V (r=.836, p.001), A (r=.568, p.001) and D (r=.536, p.001) dimensions. For GoEmotions, the fine-tuned model shows correlation of V (r=.835, p.001), A (r=.573, p.001) and D (r=.529, p.001) dimensions. The average of supervised result between dataset is in the order of ISEAR (.647), GoEmotions (.646) and SemEval (.642) in descending order. For model trained from ISEAR, these are (+.215, +.065, +.196) improvement of the correlation from the state-of-the-art models with supervision for VAD dimensions.
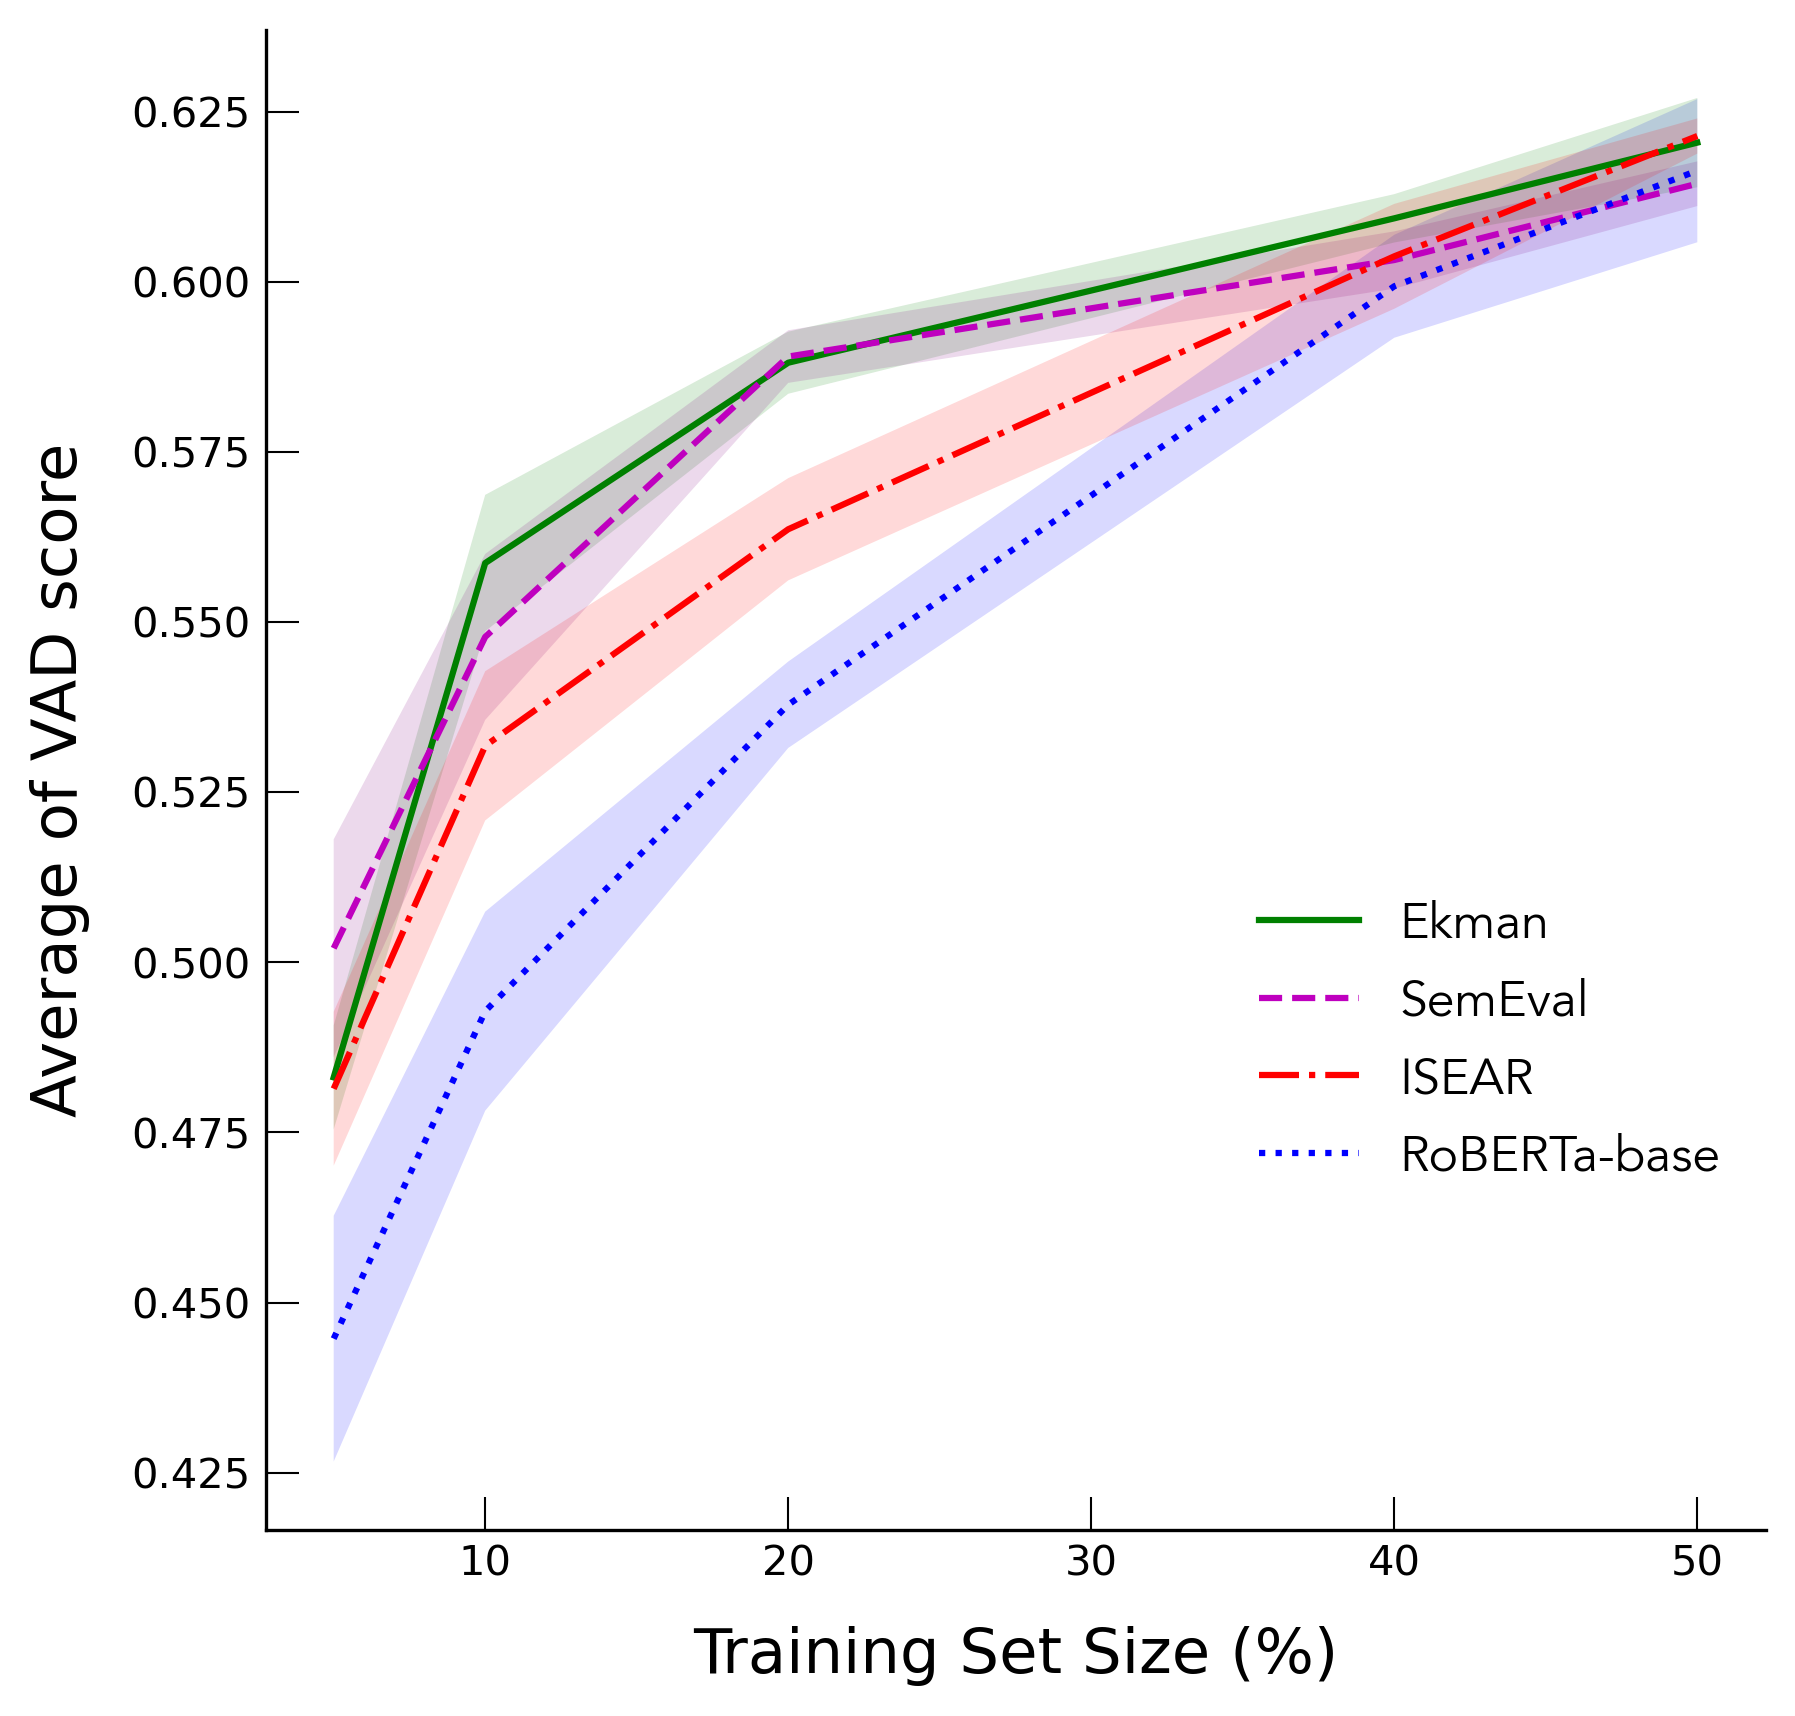
In fact, the performance of our approach are comparable to that of RoBERTa-large (Regression) and it shows correlations in V (r=.829, p.001), A (r=.569, p.001) and D (r=.513, p.001) dimensions. We see that this is because the size of Emobank training set is sufficiently large, so we further conduct experiment assuming the training data is small. Figure 2 shows results on such settings, using only {5, 10, 20, 30, 40, 50}% of the training data. For all models initialized to our fine-tuned model on SemEval, ISEAR, Ekman, our method shows better performance compared to that of RoBERTa-large (Regression) when using of training data is smaller.
| Dataset (Model) |
|
|
Acc. | ||||
|---|---|---|---|---|---|---|---|
| ISEAR (MT-CNN) | - | .668 | - | ||||
| ISEAR (RoBERTa) | .754 | .755 | - | ||||
| ISEAR (Ours) | .752 | .753 | - | ||||
| SemEval (NTUA-SLP) | .528 | .701 | .588 | ||||
| SemEval (Seq2Emo) | - | .709 | .592 | ||||
| SemEval (RoBERTa-Large) | .574 | .725 | .607 | ||||
| SemEval (Ours) | .566 | .725 | .607 | ||||
| GoEmotions Demszky et al. (2020) | .640 | - | - | ||||
| GoEmotions (RoBERTa) | .618 | .691 | .659 | ||||
| GoEmotions (Ours) | .611 | .686 | .657 |
Categorical Emotion Prediction. Next, classification performances of our model and that of comparison models are reported in Table. 2. Note that our model outperforms all baseline models for emotion classification except RoBERTa-Large, which is comparable to our model.
5 Ablation Study
| Model | V (r) | A (r) | D (r) | Avg. |
| Zero-Shot | ||||
| 1. RoBERTa (CE, SE) | .685 | .315 | .278 | .426 |
| 2. RoBERTa (Ours, SE) | .715 | .319 | .308 | .448 |
| Supervised | ||||
| 3. RoBERTa (Random, EB) | .381 | .386 | .253 | .340 |
| 4. BERT (Pretrained, EB) | .794 | .537 | .514 | .615 |
| 5. RoBERTa (Pretrained, EB) | .829 | .569 | .513 | .637 |
| 6. Ours, SE-EB (RoBERTa) | .838 | .570 | .518 | .642 |
| Tweet | Categorical Label | Nearest Neighbors from VAD scores | ||||||
|---|---|---|---|---|---|---|---|---|
|
joy, optimism |
|
||||||
|
anger, disgust |
|
||||||
|
|
|
We further conduct ablation study to investigate our model’s VAD prediction performances. Since we use pre-trained RoBERTa and fine-tune them with different datasets, the effect of model architecture, pre-training and fine-tuning should be decomposed to understand the source of improvements. We show the result for SemEval dataset because it gave the best performance for zero-shot score prediction. Validation set results are shown in Appendix.
In Table 3, we present six models for ablation study. Model 1 is RoBERTa trained on SemEval with our framework except EMD loss replaced with cross-entropy which does not consider the order of classes in terms of VAD. Compared to Model 2, RoBERTa trained on SemEval with EMD loss, our model shows better correlations in overall. (+.022)
Model 3 is fine-tuned on EmoBank without pre-trained weights of RoBERTa, showing highly underperforming result compared to Model 5, which take advantage of pre-trained weights. Still the performance of Model 3 is comparable to that of AAN Zhu et al. (2019), it could be highly improved with using pre-trained knowledge obtained from masked language modeling task. (+.302) More Interestingly, Model 4 uses BERT Devlin et al. (2018) pre-trained weights, showing slightly lower performance than Model 5. This indicates using better language models also improves the performance. (+.027) Model 6 shows comparable performance compared to Model 5 when using full train-set.
6 Qualitative Examples
In Table 4, we show examples predicted from our model trained on SemEval. The table presents annotated tweets from SemEval test set, corresponding predicted categorical labels, and top 5 nearest neighbor emotional words with respect to the predicted VAD scores. For these three tweets, our model correctly predicted the categorical emotion labels. We elaborate how we find the nearest neighbor words from the VAD scores.
Given our model’s predicted VAD scores, we find the nearest neighbor words for those scores by using NRC-VAD-Lexicons Mohammad (2018). We first rescale our model’s predicted VAD scores from 0 to 1 for each VAD dimension since the NRC-VAD lexicons have values from 0 to 1. To do this, we first predict VAD scores for every sentence in SemEval test set and then we rescale the scores by following: ( to make all dimension scores range from 0 to 1.
Next, we find the nearest neighbor words by using the rescaled VAD values. Euclidean distances between the values and all words in NRC-VAD-Lexicons are computed, and we pick the top five nearest words among them with the smallest distances. We present the words in the right column of Table 4. Note that these words are extracted from NRC-VAD lexicons so some words are not emotional because it contains frequently used 20,000 English words. However, these words help us understand VAD scores intuitively, and they could be regarded as automatically generated emotion annotations for a given sentence, which are not seen during training.
7 Related Work
Categorical model of emotion assumes that the categories represented by emotion words compose the building blocks of human emotion. Supporting evidence includes six basic emotions Ekman (1992), and findings of universally adaptive emotions Plutchik (1980). An alternative to understand how people conceptualize emotional feelings is the dimensional model of emotion. Osgood et al. (1957) suggested the initial idea of emotion coordinates. Russell and Mehrabian (1977) further constructed Pleasure or Valence-Arousal-Dominance (PAD, VAD) model, a semantic scale model to rate emotional state, representing an emotional state as a pair of orthogonal coordinates on VAD dimensions. Absolute values of the intercorrelations among the three scales show considerable independence among the scales Russell and Mehrabian (1977), categorical emotion states can be represented in 3D (VAD) emotion space.
Based on emotional dimensions, word-level VAD annotation of English words has been created Bradley and Lang (1999); Warriner et al. (2013); Mohammad (2018). Also, there are few sentence-level VA or VAD annotated corpora Buechel and Hahn (2017); Preoţiuc-Pietro et al. (2016b); Yu et al. (2016b). By using these resources, recent work tried to predict VAD scores from sentences based on variational autoencoders Wu et al. (2019), adversarial learning Zhu et al. (2019), ensemble learning Akhtar et al. (2019). However, sentence-level VAD annotated corpus is scarce, we use more common resource which is sentences annotated with basic categorical emotions for VAD score prediction Scherer and Wallbott (1994); Alm et al. (2005); Aman and Szpakowicz (2007); Mohammad (2012); Sintsovaa and Musata (2013); Li et al. (2017); Schuff et al. (2017); Shahraki and Zaiane (2017); Mohammad et al. (2018); Demszky et al. (2020). These datasets are commonly used for emotion classification, we use them to predict VAD scores from sentences with word-level VAD scores of categorical emotion labels.
Recently, a lot of dataset related to emotion has been released. Especially, there are dataset in healthcare domain Sosea and Caragea (2020), relation between emoji and emotion Shoeb and de Melo (2020), and emotional text from social media Ding et al. (2020). All of these are cateogrical annotations which again shows the lack of dimensional annotations thus the need for our model to capture fine-grained emotion detection. Also, our work could be extended to a large domain: it could help better performance of multimodal emotion detection Zhang et al. (2020), emotion in conversation Ishiwatari et al. (2020), and emotion change in a paragraph Brahman and Chaturvedi (2020).
There are multiple emotion datasets annotated with various types of label sets. To train model across the various shaped emotion dataset, several existing studies aggregate various format of emotion dataset into a common annotation schema, and show better performance using unified dataset Bostan and Klinger (2018); Belainine et al. (2020). However, still the labels are mapped to other predefined emotions and the datasets are limited to categorical labels. In Buechel and Hahn (2018), they convert categorical emotions into VAD representation using simple Feed-Forward Neural Networks. They train model with dataset labeled with both emotion categories and VAD. However, in our paper, we convert categorical emotion knowledge to VAD without any labeled pairs.
8 Discussion and Conclusions
We propose learning to predict VAD scores from the text with categorical emotion annotations. Our framework predicts VAD score distributions by minimizing the EMD distances between predicted VAD distributions and sorted label distributions as a proxy of target VAD distributions. Even our model assumes VAD emotion space and order between emotions, our model shows significant prediction performances in real-world datasets.
Robustness. Our framework could be applied to multimodal datasets. If we apply our framework to IEMOCAP Busso et al. (2008), the zero-shot VAD predictions are significantly correlated with ground truths (V: 0.396, A: 0.241, D: 0.197) as well. However, the performance is rather low since our model does not leverage other modalities such as audio or videos. Once our framework is extended to integrate such information through image/speech encoders, performance would be improved. We use NRC-VAD to estimate distance between emotions because it is constructed very carefully to locate words in VAD space. If we use other word-level VAD resources such as ANEW Redondo et al. (2007), we observe positive results as well (V: 0.682, A: 0.270, D: 0.296).
Ethical Considerations. A model trained by our approach could be used to understand and regulate one’s own emotional states and to save people from suicide. In addition, social bots capable of emotion recognition could help people in various ways. However, a model trained by our approach could be misused to detect or control others’ emotional states against their will. It may reveal private information about mental or physical health or private feelings an individual does not wish to share. This concern is even more serious when we consider that machine learning models can be cost-effective and thus used at scale for pervasive monitoring of emotions Greene (2020). An example of a harmful use of the technology is manipulating the semantic emotive content of user news feeds which can affect the choices of both individuals and groups on the platform to engage and interact Stark and Hoey (2020). From a different perspective, problems might occur from the inaccurate results of the model. Mispredictions of the models could result in harmful outcomes even in systems designed to be helpful, and this is a serious problem in many languages with relatively low resources (i.e., languages other than English and a few others that are extensively studied within NLP), resulting in inequity with respect to the benefits gained by this technology. Basically, resources to train emotion detection models are scarce in most languages, and their quality would degrade if translated to other languages from English since cultural nuances to defining emotions vary. Therefore, one should follow guidelines for the ethical use of emotional AI technologies, which present a checklist for anyone engaged with data about human emotion. Stark and Hoey (2020) For example, McStay and Pavliscak’s guidelines McStay and Pavliscak (2019) include a number of salutary suggestions for taking action as a practitioner.
We hope our framework will be helpful in building an annotated sentence-level VAD emotion dataset by providing machine-annotated VAD scores as a start, or use it just as VAD score prediction model. Most of the languages except English would not have such corpus with VAD annotations, so our model will be helpful to build resources using multilingual corpora with categorical emotion labels Öhman et al. (2018).
Acknowledgements
This research was supported by the Engineering Research Center Program through the National Research Foundation of Korea (NRF) funded by the Korean Government MSIT (NRF2018R1A5A1059921).
References
- Akhtar et al. (2019) S. Akhtar, D. Ghosal, A. Ekbal, P. Bhattacharyya, and S. Kurohashi. 2019. All-in-one: Emotion, sentiment and intensity prediction using a multi-task ensemble framework. IEEE Transactions on Affective Computing.
- Alm et al. (2005) Cecilia Ovesdotter Alm, Dan Roth, and Richard Sproat. 2005. Emotions from text: machine learning for text-based emotion prediction. In EMNLP.
- Aman and Szpakowicz (2007) Saima Aman and Stan Szpakowicz. 2007. Identifying expressions of emotion in text. In TSD.
- Baziotis et al. (2018) Christos Baziotis, Nikos Athanasiou, Alexandra Chronopoulou, Athanasia Kolovou, Georgios Paraskevopoulos, Nikolaos Ellinas, Shrikanth Narayanan, and Alexandros Potamianos. 2018. Ntua-slp at semeval-2018 task 1: predicting affective content in tweets with deep attentive rnns and transfer learning. In SemEval.
- Belainine et al. (2020) Billal Belainine, Fatiha Sadat, Mounir Boukadoum, and Hakim Lounis. 2020. Towards a multi-dataset for complex emotions learning based on deep neural networks. In Proceedings of the Second Workshop on Linguistic and Neurocognitive Resources, pages 50–58, Marseille, France. European Language Resources Association.
- Bostan and Klinger (2018) Laura-Ana-Maria Bostan and Roman Klinger. 2018. An analysis of annotated corpora for emotion classification in text. In Proceedings of the 27th International Conference on Computational Linguistics, pages 2104–2119, Santa Fe, New Mexico, USA. Association for Computational Linguistics.
- Bradley and Lang (1999) Margaret M Bradley and Peter J Lang. 1999. Affective norms for english words (anew): Instruction manual and affective ratings. Technical report, Citeseer.
- Brahman and Chaturvedi (2020) Faeze Brahman and Snigdha Chaturvedi. 2020. Modeling protagonist emotions for emotion-aware storytelling. In Proceedings of the 2020 Conference on Empirical Methods in Natural Language Processing (EMNLP), pages 5277–5294.
- Buechel and Hahn (2017) Sven Buechel and Udo Hahn. 2017. Emobank: Studying the impact of annotation perspective and representation format on dimensional emotion analysis. In EACL.
- Buechel and Hahn (2018) Sven Buechel and Udo Hahn. 2018. Emotion representation mapping for automatic lexicon construction (mostly) performs on human level. In Proceedings of the 27th International Conference on Computational Linguistics, pages 2892–2904, Santa Fe, New Mexico, USA. Association for Computational Linguistics.
- Busso et al. (2008) Carlos Busso, Murtaza Bulut, Chi-Chun Lee, Abe Kazemzadeh, Emily Mower, Samuel Kim, Jeannette N Chang, Sungbok Lee, and Shrikanth S Narayanan. 2008. Iemocap: Interactive emotional dyadic motion capture database. Language resources and evaluation, 42(4):335–359.
- Chronopoulou et al. (2019) A. Chronopoulou, C. Baziotis, and A. Potamianos. 2019. An embarrassingly simple approach for transfer learning from pretrained language models. In Proceedings of the 2019 Conference of the North American Chapter of the Association for Computational Linguistics: Human Language Technologies, Volume 1 (Long and Short Papers), page 2089–2095.
- Demszky et al. (2020) Dorottya Demszky, Dana Movshovitz-Attias, Jeongwoo Ko, Alan Cowen, Gaurav Nemade, and Sujith Ravi. 2020. Goemotions: A dataset of finegrained emotions. In Proceedings of the 58th Annual Meeting of the Association for Computational Linguistics, pages 4040–4054.
- Desmet and Hoste (2013) Bart Desmet and VéRonique Hoste. 2013. Emotion detection in suicide notes. Expert Syst. Appl., 40(16):6351–6358.
- Devlin et al. (2018) Jacob Devlin, Ming-Wei Chang, Kenton Lee, and Kristina Toutanova. 2018. BERT: pre-training of deep bidirectional transformers for language understanding. In WMT.
- Ding et al. (2020) Keyang Ding, Jing Li, and Yuji Zhang. 2020. Hashtags, emotions, and comments: A large-scale dataset to understand fine-grained social emotions to online topics. In Proceedings of the 2020 Conference on Empirical Methods in Natural Language Processing (EMNLP), page 1376–1382.
- Ekman (1992) Paul Ekman. 1992. An argument for basic emotions. Cognition & emotion, 6(3-4):169–200.
- Greene (2020) Gretchen Greene. 2020. The ethics of ai and emotional intelligence. Technical report, Partnership on AI.
- Hou et al. (2017) Le Hou, Chen-Ping Yu, and Dimitris Samaras. 2017. Squared earth movers distance loss for training deep neural networks on ordered-classes. In NIPS.
- Huang et al. (2019) Chenyang Huang, Amine Trabelsi, Xuebin Qin, Nawshad Farruque, and Osmar R Zaïane. 2019. Seq2emo for multi-label emotion classification based on latent variable chains transformation. arXiv preprint arXiv:1911.02147.
- Ishiwatari et al. (2020) Taichi Ishiwatari, Yuki Yasuda, Taro Miyazaki, and Jun Goto. 2020. Relation-aware graph attention networks with relational position encodings for emotion recognition in conversations. In Proceedings of the 2020 Conference on Empirical Methods in Natural Language Processing (EMNLP), pages 7360–7370.
- Kiritchenko and Mohammad (2017) Svetlana Kiritchenko and Saif M Mohammad. 2017. Best-worst scaling more reliable than rating scales: A case study on sentiment intensity annotation. arXiv preprint arXiv:1712.01765.
- Li et al. (2017) Yanran Li, Hui Su, Xiaoyu Shen, Wenjie Li, Ziqiang Cao, and Shuzi Niu. 2017. Dailydialog: A manually labelled multi-turn dialogue dataset. arXiv preprint arXiv:1710.03957.
- Liu et al. (2019) Yinhan Liu, Myle Ott, Naman Goyal, Jingfei Du, Mandar Joshi, Danqi Chen, Omer Levy, Mike Lewis, Luke Zettlemoyer, and Veselin Stoyanov. 2019. Roberta: A robustly optimized bert pretraining approach. arXiv preprint arXiv:1907.11692.
- Lykousas et al. (2019) Nikolaos Lykousas, Constantinos Patsakis, Andreas Kaltenbrunner, and Vicenç Gómez. 2019. Sharing emotions at scale: The vent dataset. In Proceedings of the International AAAI Conference on Web and Social Media, volume 13, pages 611–619.
- McStay and Pavliscak (2019) A. McStay and P Pavliscak. 2019. Emotional artificial intelligence: Guidelines for ethical use.
- Mohammad (2018) Saif Mohammad. 2018. Obtaining reliable human ratings of valence, arousal, and dominance for 20,000 english words. In Proceedings of the 56th Annual Meeting of the Association for Computational Linguistics (Volume 1: Long Papers), pages 174–184.
- Mohammad (2012) Saif M Mohammad. 2012. # emotional tweets. In SemEval.
- Mohammad et al. (2018) Saif M. Mohammad, Felipe Bravo-Marquez, Mohammad Salameh, and Svetlana Kiritchenko. 2018. Semeval-2018 Task 1: Affect in tweets. In SemEval.
- Öhman et al. (2018) Emily Öhman, Kaisla Kajava, Jörg Tiedemann, and Timo Honkela. 2018. Creating a dataset for multilingual fine-grained emotion-detection using gamification-based annotation. In Proceedings of the 9th Workshop on Computational Approaches to Subjectivity, Sentiment and Social Media Analysis, pages 24–30.
- Osgood et al. (1957) Charles Egerton Osgood, George J Suci, and Percy H Tannenbaum. 1957. The measurement of meaning. 47. University of Illinois press.
- Plutchik (1980) Robert Plutchik. 1980. A general psychoevolutionary theory of emotion. In Theories of emotion, pages 3–33. Elsevier.
- Plutchik (2001) Robert Plutchik. 2001. The nature of emotions: Human emotions have deep evolutionary roots, a fact that may explain their complexity and provide tools for clinical practice. American scientist, 89(4):344–350.
- Preoţiuc-Pietro et al. (2016a) Daniel Preoţiuc-Pietro, H Andrew Schwartz, Gregory Park, Johannes Eichstaedt, Margaret Kern, Lyle Ungar, and Elisabeth Shulman. 2016a. Modelling valence and arousal in facebook posts. In Proceedings of the 7th workshop on computational approaches to subjectivity, sentiment and social media analysis, pages 9–15.
- Preoţiuc-Pietro et al. (2016b) Daniel Preoţiuc-Pietro, H. Andrew Schwartz, Gregory Park, Johannes Eichstaedt, Margaret Kern, Lyle Ungar, and Elisabeth Shulman. 2016b. Modelling valence and arousal in Facebook posts. In Proceedings of the 7th Workshop on Computational Approaches to Subjectivity, Sentiment and Social Media Analysis, pages 9–15, San Diego, California. Association for Computational Linguistics.
- Redondo et al. (2007) Jaime Redondo, Isabel Fraga, Isabel Padrón, and Montserrat Comesaña. 2007. The spanish adaptation of anew (affective norms for english words). Behavior research methods, 39(3):600–605.
- Russell and Mehrabian (1977) James A Russell and Albert Mehrabian. 1977. Evidence for a three-factor theory of emotions. Journal of research in Personality, 11(3):273–294.
- Sahana and Girish (2015) DS Sahana and L Girish. 2015. Automatic drug reaction detection using sentimental analysis. International Journal of Advanced Research in Computer Engineering & Technology (IJARCET), 4(5).
- Scherer and Wallbott (1994) Klaus R Scherer and Harald G Wallbott. 1994. Evidence for universality and cultural variation of differential emotion response patterning. Journal of personality and social psychology, 66(2):310.
- Schuff et al. (2017) Hendrik Schuff, Jeremy Barnes, Julian Mohme, Sebastian Padó, and Roman Klinger. 2017. Annotation, modelling and analysis of fine-grained emotions on a stance and sentiment detection corpus. In WASSA, pages 13–23.
- Shahraki and Zaiane (2017) Ameneh Gholipour Shahraki and Osmar R Zaiane. 2017. Lexical and learning-based emotion mining from text. In CICLing.
- Shoeb and de Melo (2020) Abu Awal Md Shoeb and Gerard de Melo. 2020. Emotag1200 : Understanding the association between emojis and emotions. In Proceedings of the 2020 Conference on Empirical Methods in Natural Language Processing (EMNLP), pages 8957–8967.
- Sintsovaa and Musata (2013) Valentina Sintsovaa and Claudiu Musata. 2013. Fine-grained emotion recognition in olympic tweets based on human computation. In WASSA.
- Sosea and Caragea (2020) Tiberiu Sosea and Cornelia Caragea. 2020. Canceremo: A dataset for fine-grained emotion detection. In Proceedings of the 2020 Conference on Empirical Methods in Natural Language Processing (EMNLP), page 8892–8904.
- Stark and Hoey (2020) Luke Stark and Jesse Hoey. 2020. The ethics of emotion in ai systems.
- Torre and Lieberman (2018) Jared B. Torre and Matthew D. Lieberman. 2018. Putting feelings into words: Affect labeling as implicit emotion regulation. Emotion Review, 10(2):116–124.
- Warriner et al. (2013) Amy Beth Warriner, Victor Kuperman, and Marc Brysbaert. 2013. Norms of valence, arousal, and dominance for 13,915 english lemmas. Behavior Research Methods, 45(4):1191–1207.
- Wolf et al. (2019) Thomas Wolf, Lysandre Debut, Victor Sanh, Julien Chaumond, Clement Delangue, Anthony Moi, Pierric Cistac, Tim Rault, R’emi Louf, Morgan Funtowicz, and Jamie Brew. 2019. Huggingface’s transformers: State-of-the-art natural language processing. ArXiv, abs/1910.03771.
- Wu et al. (2019) Chuhan Wu, Fangzhao Wu, Sixing Wu, Zhigang Yuan, Junxin Liu, and Yongfeng Huang. 2019. Semi-supervised dimensional sentiment analysis with variational autoencoder. Knowledge-Based Systems, 165:30–39.
- Yu et al. (2016a) Liang-Chih Yu, Lung-Hao Lee, Shuai Hao, Jin Wang, Yunchao He, Jun Hu, K Robert Lai, and Xuejie Zhang. 2016a. Building chinese affective resources in valence-arousal dimensions. In Proceedings of the 2016 Conference of the North American Chapter of the Association for Computational Linguistics: Human Language Technologies, pages 540–545.
- Yu et al. (2016b) Liang-Chih Yu, Lung-Hao Lee, Shuai Hao, Jin Wang, Yunchao He, Jun Hu, K. Robert Lai, and Xuejie Zhang. 2016b. Building Chinese affective resources in valence-arousal dimensions. In Proceedings of the 2016 Conference of the North American Chapter of the Association for Computational Linguistics: Human Language Technologies, pages 540–545, San Diego, California. Association for Computational Linguistics.
- Zhang et al. (2020) Dong Zhang, Xincheng Ju, Junhui Li, Shoushan Li, Qiaoming Zhu, and Guodong Zhou. 2020. Multi-modal multi-label emotion detection with modality and label dependence. In Proceedings of the 2020 Conference on Empirical Methods in Natural Language Processing (EMNLP), pages 3584–3593.
- Zhang et al. (2018) Yuxiang Zhang, Jiamei Fu, Dongyu She, Ying Zhang, Senzhang Wang, and Jufeng Yang. 2018. Text emotion distribution learning via multi-task convolutional neural network. In IJCAI.
- Zhu et al. (2019) Suyang Zhu, Shoushan Li, and Guodong Zhou. 2019. Adversarial attention modeling for multi-dimensional emotion regression. In Proceedings of the 57th Annual Meeting of the Association for Computational Linguistics, pages 471–480.
Appendix A Appendix
| Model | V (r) | A (r) | D (r) | Avg. |
| Zero-Shot | ||||
| 1. RoBERTa (CE, SE) | .682 | .310 | .249 | .414 |
| 2. RoBERTa (Ours, SE) | .710 | .327 | .282 | .440 |
| Supervised | ||||
| 3. RoBERTa (Random, EB) | .400 | .411 | .184 | .332 |
| 4. BERT (Pretrained, EB) | .806 | .596 | .473 | .625 |
| 5. RoBERTa (Pretrained, EB) | .839 | .605 | .512 | .652 |
| 6. RoBERTa (Ours, EB-SE) | .834 | .594 | .517 | .648 |
| Dataset | EmoBank | SemEval 2018 E-c | ISEAR | GoEmotions (GE) | ||||||||||||||||||||
| Task | Regression |
|
|
|
||||||||||||||||||||
| Model | Scheme | V (r) | A (r) | D (r) |
|
|
Acc. |
|
|
|
|
Acc. | ||||||||||||
| RoBERTa-Large (Classification) | - | - | - | - | .601 | .731 | .619 | .735 | .734 | .623 | .697 | .665 | ||||||||||||
| Ours, SemEval (RoBERTa) | Zero-shot | .710 | .327 | .282 | .585 | .727 | .614 | - | - | - | - | - | ||||||||||||
| Ours, ISEAR (RoBERTa) | Zero-shot | .595 | .027 | .218 | - | - | - | .735 | .735 | - | - | - | ||||||||||||
| Ours, GE (RoBERTa) | Zero-shot | .602 | .308 | .271 | - | - | - | - | - | .604 | .690 | .660 | ||||||||||||
| Ours, EBSemEval (RoBERTa) | Supervised | .834 | .594 | .517 | - | - | - | - | - | - | - | - | ||||||||||||
| Ours, EBISEAR (RoBERTa) | Supervised | .836 | .601 | .512 | - | - | - | - | - | - | - | - | ||||||||||||
| Ours, EBGE (RoBERTa) | Supervised | .842 | .594 | .512 | - | - | - | - | - | - | - | - | ||||||||||||
A.1 Hyperparameter Searching
We follows default setting of models except maximum sequence length of Ours, (EBSemEval, ISEAR, GoEmotions with RoBERTa-Large).
The default settings are as follows: learning rate learning rate 3e-05, maximum sequence length 256, total update 10000, update frequency 4, warmup proportion 0.1, BertAdam for optimizer, and dropout 0.1.
For supervised setting, the learning rate for 5 epochs when freezing the parameters is 3e-03 and learning rate after freezing is 5e-06. The warmup proportion during this process is 0.001. For fine-tuning experiment with 5% of training set size, warmup proportion for RoBERTa baseline is 0.01 and number of epochs for freezing is 10 for ISEAR in the purpose of stable fine-tuning process and faster convergence.
A.2 Dataset Details
In our experiment, we use four types of emotion datasets: Emobank 222https://github.com/JULIELab/EmoBank, SemEval: 333https://competitions.codalab.org/competitions/17751#learn_the_details-datasets, ISEAR 444http://www.affective-sciences.org/index.php/download_file/view/395/296/, and GoEmotions 555https://github.com/google-research/google-research/tree/master/goemotions. We include all the original datasets and data splitting is done as follows. We use the train, validation, test split of EmoBank, SemEval and GoEmotions published from the authors. In case of ISEAR, we split 7:1.5:1.5 with random seed 42 using train_test_split function in sklearn library, in stratified fashion to retain ratio between classes.
A.3 Experimental Details
In all experiment, we specifically use RoBERTa-Large 666https://huggingface.co/transformers/model_doc/roberta.html and BERT-Large trained on cased English text using Whole-Word-Masking 777https://huggingface.co/transformers/model_doc/bert.html. The details of model structure are described in model library 888https://huggingface.co/transformers/pretrained_models.html. RoBERTa-Large contains 355M trainable parameters and BERT-Large has 340M. The batch size is set to 32, we stop fine-tuning all of the layers when the validation loss and metrics are converged. We use 1 GPU (RTX 6000 Ti), and take less than 5 hours for each runs. All evaluation measures in test and validation split results are average of 5 runs.