Current affiliation: ]Applied Physics, Yale University, New Haven, Connecticut 06520, USA ††thanks: K. Saritas and E. R. Fadel contributed equally to this work
Charge density and redox potential of LiNiO2 using ab initio diffusion quantum Monte Carlo
Abstract
Electronic structure of layered LiNiO2 has been controversial despite numerous theoretical and experimental reports regarding its nature. We investigate the charge densities, lithium intercalation potentials and Li diffusion barrier energies of LixNiO2 () system using a truly ab-initio method, diffusion quantum Monte Carlo (DMC). We compare the charge densities from DMC and density functional theory (DFT) and show that local and semi-local DFT functionals yield spin polarization densities with incorrect sign on the oxygen atoms. SCAN functional and Hubbard- correction improves the polarization density around Ni and O atoms, resulting in smaller deviations from the DMC densities. DMC accurately captures the p-d hybridization between the Ni-O atoms, yielding accurate lithium intercalation voltages, polarization densities and reaction barriers.
pacs:
I Introduction
Lithium-ion battery technologies have undergone tremendous advances leading to major developments in a surge of applications from mobile technologies to electric vehicles Thackeray et al. (1983); Motavalli (2015); Mizushima et al. (1981). However, further improvements in storage density are still needed. Developing cathode materials that are suitable for reversible energy storage is a challenging task which requires multiscale materials discovery approach. Many cathode materials have been discovered and studied using experimental methods Parz et al. (2013); Iwaya et al. (2013); Motohashi et al. (2009); Takahashi et al. (2007); Godinez et al. (1996); Hertz et al. (2008). However, these efforts can be accelerated using atomic scale theoretical and computational approaches Urban et al. (2016); Seo et al. (2015); Van der Ven et al. (1998); Shao-Horn et al. (2003); Wolverton and Zunger (1998) that yield high accuracy redox potentials.
Density functional theory (DFT) Kohn and Sham (1965); Hohenberg and Kohn (1964) is often used to predict redox potentials, band gaps and the formation energies of transition metal oxides Ceder (1999); Ong et al. (2011); Urban et al. (2016); Marianetti et al. (2004); Jain et al. (2013) due to its favorable balance of computational cost and accuracy. Li-ion battery cathode materials are based on redox-active transition metal oxides, fluorides, phosphates etc. In these materials, local or semi-local DFT exhibits non-systematic errors because of significant self-interaction errors from the localized d electrons. To correct this self interaction error, it is common to apply an impurity model (e.g. DFT with Hubbard model correction referred to as DFT+ Anisimov et al. (1991); Dudarev and Botton (1998)) or to include some portion of the exact exchange Heyd et al. (2003) (hybrid-DFT). These methods involve adjustable parameters that are often tuned to increase the accuracy of various properties, including redox potentials. Transferability of these parameters across the family of transition metal oxides (e.g. nickelates, cobaltites) is questionable, thus the ab-initio character of the calculations are reduced in favor of increased accuracy. Therefore, it is difficult to understand and design electronic and energetic properties of cathode materials using available DFT-based methods when no experimental guidance is available Tarascon and Armand (2001); Whittingham (2004); Bhatt and O’Dwyer (2015).
Using a judicious choice of the value on the transition metal atom can help yield reasonable redox potentials. values can be determined self consistently using linear response theory Cococcioni and de Gironcoli (2005); Himmetoglu et al. (2014); Kulik et al. (2006). However, the values determined through linear response can depend on the material and valence which changes during delithiation Wang et al. (2006, 2007); Hautier et al. (2012); Seo et al. (2015); Delmas et al. (1999); Marianetti et al. (2004). Due to the strong electronegativity of oxygen, valence electrons on the transition metal species are rearranged upon changing the Li concentration, which formally necessitates a separate value at every state of charge for the the transition metal species. This is crucial to the accuracy of redox potentials since the average redox potential for Li extraction is calculated using the following equation McKinnon and Haering (1983); Aydinol et al. (1997):
| (1) |
where G is the Gibbs free energy of the compounds at Li concentrations of x1 and x2. Typically DFT (or DMC) ground state energies can be used to replace the Gibbs free energies with very little error. Therefore, one would need to perform three calculations to determine the average voltage at different Li concentrations: , and metallic Li. However, it is not clear whether DFT energies with different values can be used for calculating energy differences corresponding to the redox voltages.
In this work, we aim to eliminate most of the mentioned challenges and calculate electronic and energetic properties of LixNiO2 using a fundamentally different approach: diffusion quantum Monte Carlo (DMC)Foulkes et al. (2001); Needs et al. (2010); Shulenburger and Mattsson (2013). DMC is a many-body method which has been successfully used to calculate equilibrium geometries, defect and crystalline formation energies, exchange coupling constants and quasiparticle gaps of transition metal oxides with near chemical accuracy, comparable to the coupled cluster calculations in quantum chemistry applications Saritas et al. (2017); Kolorenč et al. (2010); Yu et al. (2017, 2015); Santana et al. (2015); Luo et al. (2016); Kylänpää et al. (2017); Foyevtsova et al. (2014); Needs et al. (2002); Williamson et al. (1998); Mitra et al. (2015); Schiller et al. (2015); Saritas et al. (2018a, b, 2019); Saritas and Grossman (2017). Using DMC, we study the Li intercalation voltages, charge density distributions and Li diffusion barriers of LixNiO2, where . We then benchmark our DMC calculations with DFT and DFT+. We highlight important differences between these methods and demonstrate the limitations of DFT+ corrections.
II Methods
In this work we used DFT and DMC ground-state energies to determine the redox potential of LiNiO2 as a function of Li concentration. We used Dudarev’s Hubbard- Anisimov et al. (1997); Dudarev and Botton (1998) corrected PBE Perdew et al. (1996) DFT functional to benchmark our DMC results. For DFT calculations, all geometries are optimized separately for each functional. We used Vienna ab-initio simulation packageKresse and Hafner (1994); Kresse and Furthmüller (1996) (VASP) code for all the reported DFT energies and redox potentials. In these calculations, we used projector-augmented wave pseudopotentials Kresse and Joubert (1999) and a kinetic energy of 520 eV.
Calculating DMC ground-state energies of involves multiple practical steps. Here, we broadly explain main steps involved in a general way and in the following paragraph we will discuss the technical details. First, a trial (guiding) wavefunction must be generated often using single particle Slater determinants (DFT, DFT+, hybrid-DFT) Schiller et al. (2015) or using configuration-interaction (CI) methods Dash et al. (2018); Scemama et al. (2018). The trial wavefunction defines the nodal surface of the fixed-node DMC calculation where the wavefunction goes to zero. However, the CI methods are largely limited to finite systems as they are computationally rather demanding. Therefore, DFT based methods have been largely utilized in periodic systems. In this approach the nodal surface is often optimized by either varying the interaction parameter or the exact exchange ratio in the hybrid-DFT functionals Yu et al. (2017); Doblhoff-Dier et al. (2016); Shin et al. (2017); Kylänpää et al. (2017). Second, Jastrow parameters (correlation functions) are added to the guiding wavefunction and then optimized to further capture many-body correlations in the system. Jastrow parameters are defined for many-body interactions such as electron-electron and electron-electron-ion as examples. Optimizing these parameters require evaluation of expensive stochastic derivatives, hence they are performed using variational Monte Carlo (VMC). Finally, DMC calculations are performed using the trial wavefunction and the optimized Jastrow parameters. The DMC calculations involve equilibration and statistics accumulation steps. We report the DMC energies obtained in the statistics accumulation step. Detailed information regarding the DMC method can be found in the literature and the Supplementary Information Foulkes et al. (2001); Needs et al. (2010); Shulenburger and Mattsson (2013); Sup (2019).
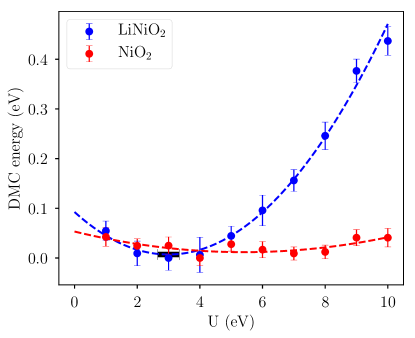
DMC and VMC calculations were performed using QMCPACKKim et al. (2018), while DFT-VMC-DMC calculation workflows are generated using the Nexus Krogel (2016) software suite. We used PBE+ functional to generate spin-up and spin-down trial wavefunctions using Quantum EspressoGiannozzi et al. (2009) (QE) code. For Ni and O atoms, we used the norm-conserving RRKJ type pseudopotentials Krogel et al. (2016); OPI (2019), while for the Li atom we use BFD pseudopotentialsBurkatzki et al. (2007) converted to Kleinman-Bylander form. These pseudopotentials are specifically constructed for DMC calculations and require very large kinetic energy cutoffs (350 Ry), hence they are not practical for DFT calculations. Therefore, in this work, QE code and the RRKJ pseudopotentials were only used towards the DMC calculations. The pseudopotentials in this work were well validated on similar systems using DMC, such as Li intercalation of multilayered graphene Ganesh et al. (2014), formation energies, ground and excited states of NiO Mitra et al. (2015); Shin et al. (2017). Each wavefunction we used in the DMC calculations were made of a Slater determinant and Jastrow factors, where both were optimized separately. Varying the interaction energy in PBE+, we optimized the nodal surface of the trial wavefunction. DFT+ calculations yield monotonously increasing energies with increased U value. However, the value is used as a variational parameter in DMC, because with a fixed set of Jastrow parameters, the guiding wavefunction that has the nodal surface closest to exact nodal surface yields the exact ground state energy of that system Foulkes et al. (2001). For NiO2 and LiNiO2, we performed this step in Fig. 1. Fig. 1 will be further explained later. Jastrow parameters were optimized using subsequent VMC variance and energy minimization calculations using the linear method Umrigar et al. (2007) as implemented in QMCPACK. Cost function of the energy minimization is split as 95/5 energy and variance minimization, which is shown to provide a good balance for improvements in DMC with the resulting variance Umrigar and Filippi (2005).
The DMC calculations are performed using a uniform gamma-centered 3x3x3 reciprocal grid on all the supercells studied, with a time step of 0.01 Ha-1. We used the model periodic coulomb (MPC) interaction to eliminate spurious two-body interactions Drummond et al. (2008); Fraser et al. (1996). The locality approximation Mitáš et al. (1991) has been shown to yield smaller localization errors in Ni atoms Dzubak et al. (2017), compared to T-moves Casula (2006). Therefore the locality approximation was used throughout this work.
In Fig. 1, the trial wavefunction optimization is shown for 12 and 16-atom cells in NiO2 and LiNiO2 using a 2x2x2 reciprocal grid with PBE+. Here, the value is used as a variational parameter to optimize the nodal surface of the trial wavefunction. In practice, one can use different flavors of DFT functionals (local, semilocal, meta-GGA). However, it has been shown that optimized LDA+ and PBE+ trial wavefunctions yield identical DMC energies in NiO, while PBE+ has smaller curvature in the DMC energy versus interaction energy curves Shin et al. (2017). In Fig. 1, we find that the DMC total energy of LiNiO2 is more sensitive to the value (a sharp minimum at eV, while for NiO2 the DMC energies are statistically identical within the range of values studied. Therefore, we used PBE+ eV on all the Ni atoms to generate DMC trial wavefunctions in this work.
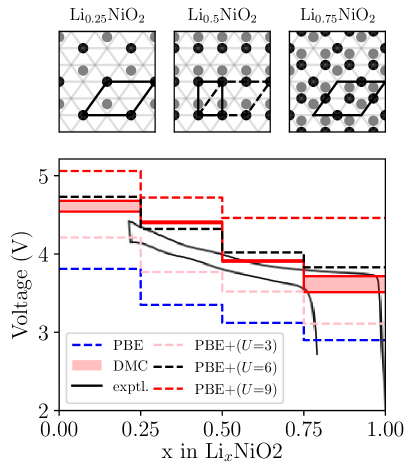
Geometry optimization in DMC is computationally demanding. Therefore, we fully optimized geometric structures using DFT-PBE. It has been shown PBE and PBE+ can perform well against the experimental lattice parameters Chakraborty et al. (2018). For LiNiO2, we used the R-3m symmetry cell as our starting geometry for the geometry relaxation calculationsHirano et al. (1995). We used 4x4 supercells in the xy-plane to determine the minimum energy Li-vacancy ordering for the LixNiO2 structures. Minimum energy structures for each Li concentration are then studied with DMC. The primitive cell lattice parameter these structures are shown in Table 1 at Supplementary Information Sup (2019). The (001) projections of the vacancy ordered structures we used in this work are shown in Fig. 2, agreeing with theoretical and experimental findings Van der Ven et al. (1998); Reimers and Dahn (1992); y de Dompablo et al. (2002); Arai et al. (1995); Delmas et al. (1980, 1999).
One and two body finite size effects must be controlled in periodic DMC calculations. One-body effects are controlled using twist averaging and using a twist averaging correction scheme similar to that proposed by Rajagopal et. al. Rajagopal et al. (1994) and as implemented in Ref. 39. Whereas the two-body effects require extrapolation to the infinitely large system. If the supercell size is very large, then the two-body effects become minimal and independent of the shape of the supercell. However, for a given volume the supercell that can be used in the DMC calculations is not unique. Therefore, we used optimal_tilematrix method in Nexus, to generate the supercell tiling matrices. Optimal_tilematrix method maximizes the minimum inscribing radius to reduce image interactions in all directions. However, the supercells with similar systems and lattice parameters can benefit from systematic error cancellations: e.g. achieve faster convergence on the energy differences between the LixNiO2 supercells. Therefore, for the 14 atom cell of Li0.5NiO2 we used a supercell (shown in Fig. 2) which has similar lattice parameters to Li0.25NiO2 and Li0.75NiO2. An extrapolation scheme was used on the DMC charge densities to eliminate the bias from using a mixed estimator at the DMC level. In DMC the charge density estimator does not commute with the fixed node DMC Hamiltonian Foulkes et al. (2001). Hence, the collected DMC density is a mixed estimator between the pure fixed-node DMC and VMC densities. In order to obtain the pure fixed-node DMC density, the following extrapolation formulas can be used Foulkes et al. (2001):
| (2) |
| (3) |
where and are DMC and VMC charge densities respectively. The accuracy of the estimators increases with the increased quality of the trial wavefunction, , where is the wavefunction from DMC Hamiltonian and the is the trial wavefunction. Ideally in homogeneous systems both estimators above should yield identical results. However, in our case the pseudo Li+ atoms donate almost all of their electrons, making the second extrapolation scheme in Eqn. 3 numerically challenging. This is because the VMC density in the denominator approaches zero near the charge depleted regions of pseudo Li+ atoms. Therefore, the extrapolation scheme in Eqn. 2 was used throughout this work.
III Results and Discussion
III.1 Ground state calculations
In LiNiO2, Ni is in an octahedral environment with a formal charge of 3+. Theoretical calculations predict that Ni3+ has the () electronic configuration which yields a net magnetization of 1 on each Ni atom y de Dompablo et al. (2002); Arroyo y de Dompablo et al. (2001); Arroyo y de Dompablo and Ceder (2003). However, it has been challenging to experimentally observe the long-range ferromagnetic ordering in LiNiO2 Chen et al. (2011); Kemp et al. (1990); Reynaud et al. (2001). Plane-wave ab-initio calculations with periodic boundary conditions were used to find ferromagnetic ordering in the ground state Zhou et al. (2004); Chen et al. (2011). In the layered NiO2 structure, the Ni atom donates its electron to O atoms and formally becomes diamagnetic Zhou et al. (2004). Our PBE+ calculations agree with these findings, yielding a distribution of Ni3+ and Ni4+ atoms in all LixNiO2 structures based on the projection of the charge density on atomic orbitals. Structural parameters and the total magnetic moments of the structures we studied are listed in the Supplementary Information Sup (2019).
In Fig. 2 we show the Li-intercalation potential of the LixNiO2 structures () , calculated using DMC and DFT methods. In the figure, theoretical results are overlayed on the experimental results from ref. 55. In Fig. 2, we first show the primitive cells for each delithiated structures. DMC intercalation voltages show excellent agreement with the experimental curve except for the slight overestimation between Li0.25NiO2 and Li0.5NiO2. From PBE+=0 to 9 eV, the average voltage increases monotonically. All DFT functionals in Fig. 2, except PBE+=9 have the same step features as the voltage profile, while the step at =0.75 disappears for PBE+=9. Similar loss of stepwise features in the voltage curves has also been observed near complete Li intercalation with the HSE functional when the exact exchange ratio is increased from 0.17 to 0.25 Seo et al. (2015) in LiCoO2. It has been suggested that at the high and low Li intercalation limits, different amounts of exact exchange would be required to reproduce the experiments Seo et al. (2015). Our findings, in terms of the loss of stepwise features in LiNiO2, are similar to LiCoO2 Seo et al. (2015). Hence, we demonstrate the challenges of using a constant vaue or exact exchange ratio in hybrid DFT functionals to reproduce the redox potentials across the Li intercalation limits.
III.2 Charge densities
The shortcomings of DFT and DFT+ in reproducing experimental redox potentials LixNiO2 are attributed to the challenges in the accurate description of the hybridization between O- and Ni- orbitals Cococcioni and de Gironcoli (2005); Himmetoglu et al. (2014); Shishkin and Sato (2016). Because of this hybridization, it is difficult to correct the exchange-correlation energy term with orbital-dependent energy terms without explicitly accounting for the orbital occupancy of both Ni and O, while taking into account the interatomic coupling. However, the performance of DMC for the voltage curves in Fig. 2 suggests that DMC can also provide accurate charge density distributions, and in particular the - hybridization between Ni and O atoms.
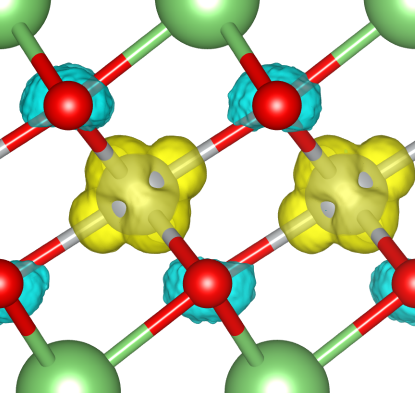
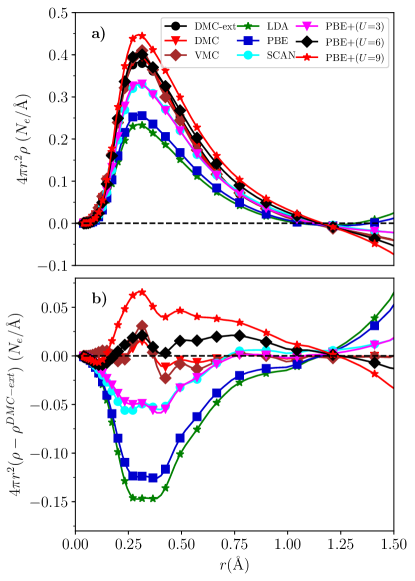
We investigate the radial spin polarization density of LiNiO2 to understand the degree of hybridization between Ni- and O- electrons in Fig. 3 and 4. This is motivated by the following: As previously mentioned, in LiNiO2, Ni has a formal charge of 3+, Ni3+, while being in an octahedral environment with occupation. This would mean that the manifold is completely occupied. The unpaired electron in the Ni level yields 1 magnetization per Ni atom. In LiNiO2, only the Ni- and O- orbitals have the proper symmetry to hybridize, due to having near 90∘ Ni-O-Ni angles. O- (, or ) and Ni- orbitals form a filled bonding orbital and a half-filled anti-bonding orbital Arroyo y de Dompablo and Ceder (2003); y de Dompablo et al. (2002). This is consistent with experimental findings from electron energy loss spectroscopy measurements, which find that Ni3+ is in a low spin state in LiNiO2, with a significant hybridization between Ni- and O- electrons Koyama et al. (2005). Density of states plots in our Supplementary Information also show that the Fermi level is almost purely Ni- and O- Sup (2019). In this respect, the spin polarization density can be used as an indication to show the distribution of the electron at the level. At the DFT level, the charge density of the orbital can be obtained through band decomposition of the charge density, but this is not yet accessible within DMC. Therefore, the spread of the spin polarization density can be used to understand if the hybridization is primarily of Ni or O character. Here, we should emphasize that the total spin polarization is constrained at 1 per Ni atom in all DFT and DMC calculations in Fig. 3a,b and 4a,b in order to provide a uniform comparison between the methods. Nevertheless, total spin polarization was also found to be close to 1 in DFT calculations where the total spin polarization is completely relaxed Chakraborty et al. (2018).
In Fig. 3a we show the radial spin polarization density () around the Ni atom in LiNiO2. All the theoretical methods in Fig. 3a yield a peak density around 0.3 Å and all the values are all positive around the core region of the Ni atom. The peak height depends on the DFT functional, with LDA exhibiting the smallest peak height, followed by PBE, and with other functionals showing larger peak heights. The peak height increases monotonically with the increased + interaction on the Ni valence electrons. To have a closer look at the results of 3a, radial spin polarization density differences from extrapolated DMC densities are shown in Fig. 3b. We highlight three main outcomes from Fig. 3b: (i) DMC and VMC charge densities are almost equal with slight fluctuations around the spin density peak regions, indicating that the trial wavefunction is a good estimate of the true many-body wavefunction (ii) PBE+=6 has the most accurate spin polarization density around Ni atom compared to the extrapolated DMC density. This result is illuminating and consistent, as the PBE+=6 calculation also provides the most accurate DFT intercalation voltages in Fig. 2. This point will be further discussed below. (iii) PBE+=3 and SCAN functionals provide almost identical densities. Various examples in the literature suggest a reduced self-interaction error in SCAN compared to GGA Perdew et al. (2017); Peng and Perdew (2017); Kitchaev et al. (2016); Sai Gautam and Carter (2018), which has been reflected in using significantly lower + values in SCAN compared to GGA+ to produce identical results.
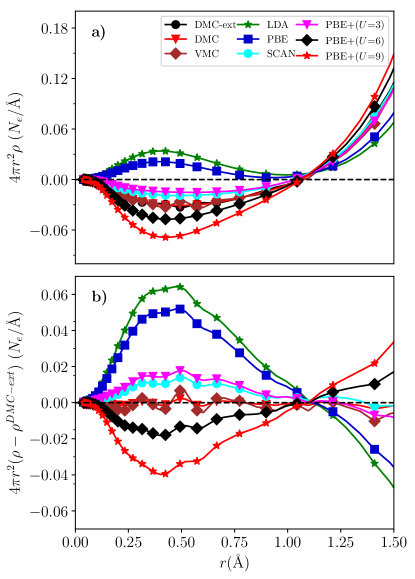
In Fig. 4a and b, we perform the same analysis as in Fig. 3a and b, but around the O atom. The LiNiO2 structure we used has the R-3m symmetry meaning that all O atoms are identical. This is apparent from the DMC spin polarization density (Fig. 5) which shows both and character. Although a Jahn-Teller distortion can ideally be considered, that could lead to splitting between and levels Arroyo y de Dompablo and Ceder (2003); Arroyo y de Dompablo et al. (2001). The most important result in Fig. 4a is that the sign of the spin polarization density changes depending on the DFT functional used. Fig. 5 shows that the negative spin polarization density on the O atoms are parallel to the Ni-O plane, but not strongly directional on the Ni-O bond axis. A positive spin density around the O atom (e.g. with LDA) in Fig. 4a is related to a reduced peak value in Fig. 3a. This is correlated to the peak intensities in the density of states (see Supplementary Information), where there is complete overlap between O- and Ni- peaks at the PBE level, the O- peak at the Fermi level increases with increasing value. Local and semi-local DFT leads to delocalized spin polarization densities for the electron. However, with increasing interaction and at the meta-GGA level, the electron is more strongly localized over the Ni core leading to a small polarization over the Ni-O layer. We find that PBE+=3 eV and SCAN functionals produce almost identical spin polarization densities around the O-atom as well, similar to Fig. 3a,b.
III.3 Lithium diffusion barriers
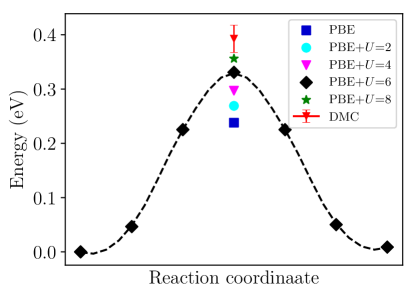
In Fig. 6, nudged elastic band (CI-NEB) Jónsson et al. (1998) calculations are performed using 5 equidistant images to obtain the Li diffusion saddle point in a 14-atom Li0.5NiO2 cell. This cell is found to be sufficiently large to compute the converged energy barrier for lithium diffusion along the tetrahedral vacancy site in LiNiO2. The geometry of the saddle point can heavily depend on the theoretical method used. Since the saddle point optimization is not yet available in DMC, we perform several tests to ensure that the saddle point geometry optimized in DFT is reasonable to perform DMC calculations.
We cross check the saddle point geometries optimized using PBE and PBE+=6 to understand the effect of geometry optimization on the energy barriers. We compare PBE and PBE+=6 as PBE+=6 provides the most accurate voltage curves in Fig. 2. When both of the structures were calculated using PBE, their ground state energies differ by less than 50 meV. Our PBE barrier energies compare well with the literature 0.25 eV Kang and Ceder (2006). However, when the same saddle point structures calculated using PBE+=6 eV, their total energies differ by 0.1-0.2 eV. It is known that the distance between NiO2 slabs can drastically effect the diffusion rates Van Der Ven and Ceder (2000). The reduced slab distance in PBE may lead to increased diffusion barriers in PBE+ calculations. Therefore, we used the saddle point structure optimized using PBE+=6 eV to perform DMC calculations.
Our literature search indicates that a Li diffusion barrier of 0.3-0.6 eV must be expected for Li0.5NiO2. Experimental studies on the diffusion rates of LiNiO2 are rather challenging as Ni3+ prefers to migrate into Li+ sites at lower Li concentrations. Nevertheless, using 7Li NMR spectra a diffusion barrier of 0.6 eV is found Nakamura et al. (2000). In layered oxides, Li+ diffusion rates are known to increase (diffusion barriers would decrease) with increasing Li-slab distance, hence with decreasing the Li concentration Kang and Ceder (2006). Therefore, the 0.6 eV should be used as an upper bound in our diffusion barrier calculations performed with the Li0.5NiO2 cell. Experimental diffusion barrier of LiCoO2 has been studied numerous times with macroscopic Okubo et al. (2009) and local techniques Balke et al. (2012) that yield a diffusion barrier of 0.26-0.3 eV near Li0.5CoO2. It has been noted that the diffusion barrier in LiNiO2 should be larger than the diffusion barrier of LiCoO2 Nakamura et al. (2000). Therefore, the diffusion barrier of Li0.5CoO2 can be used as a lower bound for Li0.5NiO2. Hence, our analysis yields a range of Li diffusion barrier energies (0.3-0.6 eV) for Li0.5NiO2.
Fig. 6 shows that the energy barriers are increased with the increased value of , as expected. We find that a value of 6 eV or larger must be used to obtain Li diffusion barrier energy within 0.3-0.6 eV . DMC Li diffusion barrier energy we calculated, 0.39(3) eV, is larger than all the PBE+ diffusion barrier energies in Fig. 6. While PBE+=6 eV reproduces experimental voltage curves, a substantially higher value of , 10 eV, could be required to fit the energy barrier calculated with DMC. This result supports previous work showing how the energy of the transition state can depend strongly on the exchange component of the density functional, and often larger exchange ratios are required for accurate barrier height than what is needed for the equilibrium geometries Lynch and Truhlar (2001). Therefore, it is likely that the value of 6 eV, which is reasonable for intercalation voltages, leads to an underestimation of the barrier height compared to the DMC barrier height.
IV Conclusions
We showed that it is possible to obtain accurate Li intercalation voltage curves using DMC method, and illustrated this approach on the LiNiO2 layered cathode structure. Semilocal DFT results typically underestimate the voltage curves due to spurious self-interaction effects, and require corrections. However, DMC calculates the electron-electron interactions without any ad-hoc approximations. To our knowledge, our work is the first report of a cathode redox potential determined using DMC, which accurately reproduces the experiments and lays the foundation for future methods for predicting redox reaction voltages entirely from first principles. We discuss the degree of - hybridization between Ni and O atoms using spin charge density distributions while comparing to the failures of DFT for this material. We show that charge densities computed by LDA and PBE are significantly different than DMC, while SCAN and DFT+ offer relatively improved results. We show how other material properties such as energy barrier to lithium diffusion can be affected, and how the accuracy of DFT+ may not be transferable across different physical properties.
References
- Thackeray et al. (1983) M. M. Thackeray, W. I. F. David, P. G. Bruce, and J. B. Goodenough, Mater. Res. Bull. 18, 461 (1983).
- Motavalli (2015) J. Motavalli, Nature 526, S96 (2015).
- Mizushima et al. (1981) K. Mizushima, P. C. Jones, P. J. Wiseman, and J. B. Goodenough, Solid State Ionics 3-4, 171 (1981).
- Parz et al. (2013) P. Parz, B. Fuchsbichler, S. Koller, B. Bitschnau, F. A. Mautner, W. Puff, and R. Würschum, Appl. Phys. Lett. 102, 0 (2013).
- Iwaya et al. (2013) K. Iwaya, T. Ogawa, T. Minato, K. Miyoshi, J. Takeuchi, A. Kuwabara, H. Moriwake, Y. Kim, and T. Hitosugi, Phys. Rev. Lett. 111, 126104 (2013).
- Motohashi et al. (2009) T. Motohashi, T. Ono, Y. Sugimoto, Y. Masubuchi, S. Kikkawa, R. Kanno, M. Karppinen, and H. Yamauchi, Phys. Rev. B 80, 165114 (2009).
- Takahashi et al. (2007) Y. Takahashi, N. Kijima, K. Dokko, M. Nishizawa, I. Uchida, and J. Akimoto, J. Solid State Chem. 180, 313 (2007).
- Godinez et al. (1996) L. A. Godinez, J. Lin, and M. Marc, J. Electrochem. Soc. 139, 2 (1996).
- Hertz et al. (2008) J. T. Hertz, Q. Huang, T. McQueen, T. Klimczuk, J. W. G. Bos, L. Viciu, and R. J. Cava, Phys. Rev. B 77, 075119 (2008).
- Urban et al. (2016) A. Urban, D.-H. Seo, and G. Ceder, Comput. Mater. 2, 16002 (2016).
- Seo et al. (2015) D. H. Seo, A. Urban, and G. Ceder, Phys. Rev. B 92, 1 (2015).
- Van der Ven et al. (1998) a. Van der Ven, M. Aydinol, G. Ceder, G. Kresse, and J. Hafner, Phys. Rev. B 58, 2975 (1998).
- Shao-Horn et al. (2003) Y. Shao-Horn, L. Croguennec, C. Delmas, E. C. Nelson, and M. a. O’Keefe, Nat. Mater. 2, 464 (2003).
- Wolverton and Zunger (1998) C. Wolverton and A. Zunger, Phys. Rev. Lett. 81, 606 (1998).
- Kohn and Sham (1965) W. Kohn and L. Sham, Phys. Rev. 385 (1965).
- Hohenberg and Kohn (1964) P. Hohenberg and W. Kohn, Phys. Rev. 136, B864 (1964).
- Ceder (1999) G. Ceder, Phys. Rev. B 59, 742 (1999).
- Ong et al. (2011) S. P. Ong, V. L. Chevrier, G. Hautier, A. Jain, C. Moore, S. Kim, X. Ma, and G. Ceder, Energy Environ. Sci. 4, 3680 (2011).
- Marianetti et al. (2004) C. a. Marianetti, G. Kotliar, and G. Ceder, Nat. Mater. 3, 627 (2004).
- Jain et al. (2013) A. Jain, S. P. Ong, G. Hautier, W. Chen, W. D. Richards, S. Dacek, S. Cholia, D. Gunter, D. Skinner, G. Ceder, and K. A. Persson, APL Mater. 1 (2013), 10.1063/1.4812323.
- Anisimov et al. (1991) V. I. Anisimov, J. Zaanen, and O. K. Andersen, Phys. Rev. B 44, 943 (1991).
- Dudarev and Botton (1998) S. Dudarev and G. Botton, Phys. Rev. B 57, 1505 (1998).
- Heyd et al. (2003) J. Heyd, G. E. Scuseria, and M. Ernzerhof, J. Chem. Phys. 118, 8207 (2003).
- Tarascon and Armand (2001) J.-M. Tarascon and M. Armand, Nature 414, 359 (2001).
- Whittingham (2004) M. S. Whittingham, Chem. Rev. 104, 4271 (2004), pMID: 15669156.
- Bhatt and O’Dwyer (2015) M. D. Bhatt and C. O’Dwyer, Phys. Chem. Chem. Phys. 17, 4799 (2015).
- Cococcioni and de Gironcoli (2005) M. Cococcioni and S. de Gironcoli, Phys. Rev. B 71, 035105 (2005).
- Himmetoglu et al. (2014) B. Himmetoglu, A. Floris, S. de Gironcoli, and M. Cococcioni, Int. J. Quantum Chem. 114, 14 (2014).
- Kulik et al. (2006) H. J. Kulik, M. Cococcioni, D. A. Scherlis, and N. Marzari, Physical Review Letters 97, 1 (2006).
- Wang et al. (2006) L. Wang, T. Maxisch, and G. Ceder, Phys. Rev. B 73, 1 (2006).
- Wang et al. (2007) L. Wang, T. Maxisch, and G. Ceder, Chem. Mater. 19, 543 (2007).
- Hautier et al. (2012) G. Hautier, S. P. Ong, A. Jain, C. J. Moore, and G. Ceder, Phys. Rev. B 85 (2012), 10.1103/PhysRevB.85.155208.
- Delmas et al. (1999) C. Delmas, M. Ménétrier, L. Croguennec, S. Levasseur, J. Pérès, C. Pouillerie, G. Prado, L. Fournès, and F. Weill, Int. J. Inorg. Mater. 1, 11 (1999).
- McKinnon and Haering (1983) W. McKinnon and R. Haering, in Modern aspects of electrochemistry (Springer, 1983) pp. 235–304.
- Aydinol et al. (1997) M. K. Aydinol, A. F. Kohan, G. Ceder, K. Cho, and J. Joannopoulos, Phys. Rev. B 56, 1354 (1997).
- Foulkes et al. (2001) W. Foulkes, L. Mitas, R. Needs, and G. Rajagopal, Reviews of Modern Physics 73, 33 (2001).
- Needs et al. (2010) R. J. Needs, M. D. Towler, N. D. Drummond, and P. López Ríos, J. Phys.: Condensed Matter 22, 023201 (2010).
- Shulenburger and Mattsson (2013) L. Shulenburger and T. R. Mattsson, Phys. Rev. B 88 (2013), 10.1103/PhysRevB.88.245117, arXiv:1310.1047 .
- Saritas et al. (2017) K. Saritas, T. Mueller, L. Wagner, and J. C. Grossman, J. Chem. Theory Comput. 13, 1943 (2017).
- Kolorenč et al. (2010) J. Kolorenč, S. Hu, and L. Mitas, Phys. Rev. B 82 (2010), 10.1103/PhysRevB.82.115108.
- Yu et al. (2017) J. Yu, L. K. Wagner, and E. Ertekin, Phys. Rev. B 95, 075209 (2017).
- Yu et al. (2015) J. Yu, L. K. Wagner, and E. Ertekin, J. Chem. Phys. 143, 224707 (2015).
- Santana et al. (2015) J. A. Santana, J. T. Krogel, J. Kim, P. R. C. Kent, and F. A. Reboredo, J. Chem. Phys. 142 (2015), 10.1063/1.4919242.
- Luo et al. (2016) Y. Luo, A. Benali, L. Shulenburger, J. T. Krogel, O. Heinonen, and P. R. C. Kent, New Journal of Physics 18, 113049 (2016).
- Kylänpää et al. (2017) I. Kylänpää, J. Balachandran, P. Ganesh, O. Heinonen, P. R. C. Kent, and J. T. Krogel, Physical Review Materials 1, 065408 (2017).
- Foyevtsova et al. (2014) K. Foyevtsova, J. T. Krogel, J. Kim, P. R. C. Kent, E. Dagotto, and F. A. Reboredo, Phys. Rev. X 4 (2014), 10.1103/PhysRevX.4.031003.
- Needs et al. (2002) R. J. Needs, P. R. C. Kent, A. R. Porter, M. D. Towler, and G. Rajagopal, Int. J. Quantum Chem. 86, 218 (2002).
- Williamson et al. (1998) A. J. Williamson, R. Hood, R. Needs, and G. Rajagopal, Phys. Rev. B 57, 12140 (1998), arXiv:9803207 [cond-mat] .
- Mitra et al. (2015) C. Mitra, J. T. Krogel, J. A. Santana, F. A. Reboredo, and M. Carlo, J. Chem. Phys. 143, 164710 (2015).
- Schiller et al. (2015) J. A. Schiller, L. K. Wagner, and E. Ertekin, Phys. Rev. B - Condens. Matter Mater. Phys 92, 235209 (2015).
- Saritas et al. (2018a) K. Saritas, J. T. Krogel, P. R. C. Kent, and F. A. Reboredo, Physical Review Materials 2, 085801 (2018a).
- Saritas et al. (2018b) K. Saritas, J. T. Krogel, and F. A. Reboredo, Phys. Rev. B 98, 155130 (2018b).
- Saritas et al. (2019) K. Saritas, W. Ming, M.-H. Du, and F. A. Reboredo, J. Phys. Chem. Lett 10, 67 (2019).
- Saritas and Grossman (2017) K. Saritas and J. C. Grossman, J. Phys. Chem. C 121, 26677 (2017).
- Delmas et al. (1980) C. Delmas, C. Fouassier, and P. Hagenmuller, Phys. B+C 99, 81 (1980).
- Anisimov et al. (1997) V. I. Anisimov, F. Aryasetiawan, and A. I. Lichtenstein, J. Phys.: Condens. Matter 9, 767 (1997).
- Perdew et al. (1996) J. Perdew, K. Burke, and M. Ernzerhof, Phys. Rev. Lett. 77, 3865 (1996).
- Kresse and Hafner (1994) G. Kresse and J. Hafner, Phys. Rev. B 49, 14251 (1994).
- Kresse and Furthmüller (1996) G. Kresse and J. Furthmüller, Physical review. B, Condensed matter 54, 11169 (1996).
- Kresse and Joubert (1999) G. Kresse and D. Joubert, Phys. Rev. B 59, 11 (1999).
- Dash et al. (2018) M. Dash, S. Moroni, A. Scemama, and C. Filippi, J. Chem. Theory Comput. 14, 4176 (2018).
- Scemama et al. (2018) A. Scemama, A. Benali, D. Jacquemin, M. Caffarel, and P. F. Loos, J. Chem. Phys. 149, 034108 (2018).
- Doblhoff-Dier et al. (2016) K. Doblhoff-Dier, J. Meyer, P. E. Hoggan, G. J. Kroes, and L. K. Wagner, J. Chem. Theory Comput. 12, 2583 (2016).
- Shin et al. (2017) H. Shin, Y. Luo, P. Ganesh, J. Balachandran, J. T. Krogel, P. R. C. Kent, A. Benali, and O. Heinonen, Phys. Rev. Mater. 1, 073603 (2017).
- Sup (2019) (2019), see Supplementary Information…
- Kim et al. (2018) J. Kim, A. D. Baczewski, T. D. Beaudet, A. Benali, M. C. Bennett, M. A. Berrill, N. S. Blunt, E. J. L. Borda, M. Casula, D. M. Ceperley, S. Chiesa, B. K. Clark, R. C. C. III, K. T. Delaney, M. Dewing, K. P. Esler, H. Hao, O. Heinonen, P. R. C. Kent, J. T. Krogel, I. Kylänpää, Y. W. Li, M. G. Lopez, Y. Luo, F. D. Malone, R. M. Martin, A. Mathuriya, J. McMinis, C. A. Melton, L. Mitas, M. A. Morales, E. Neuscamman, W. D. Parker, S. D. P. Flores, N. A. Romero, B. M. Rubenstein, J. A. R. Shea, H. Shin, L. Shulenburger, A. F. Tillack, J. P. Townsend, N. M. Tubman, B. V. D. Goetz, J. E. Vincent, D. C. Yang, Y. Yang, S. Zhang, and L. Zhao, J. Phys. Condens. Matt. 30, 195901 (2018).
- Krogel (2016) J. T. Krogel, Computer Physics Communications 198, 154 (2016).
- Giannozzi et al. (2009) P. Giannozzi, S. Baroni, N. Bonini, M. Calandra, R. Car, C. Cavazzoni, D. Ceresoli, G. L. Chiarotti, M. Cococcioni, I. Dabo, A. Dal Corso, S. de Gironcoli, S. Fabris, G. Fratesi, R. Gebauer, U. Gerstmann, C. Gougoussis, A. Kokalj, M. Lazzeri, L. Martin-Samos, N. Marzari, F. Mauri, R. Mazzarello, S. Paolini, A. Pasquarello, L. Paulatto, C. Sbraccia, S. Scandolo, G. Sclauzero, A. P. Seitsonen, A. Smogunov, P. Umari, and R. M. Wentzcovitch, J. Phys. Condens. Matter 21, 395502 (19pp) (2009).
- Krogel et al. (2016) J. T. Krogel, J. A. Santana, and F. A. Reboredo, Phys. Rev. B 93 (2016), 10.1103/PhysRevB.93.075143.
- OPI (2019) “Opium pseudopotential generator,” http://opium.sourceforge.net (2019).
- Burkatzki et al. (2007) M. Burkatzki, C. Filippi, and M. Dolg, J. Chem. Phys. 126, 234105 (2007).
- Ganesh et al. (2014) P. Ganesh, J. Kim, C. Park, M. Yoon, F. A. Reboredo, and P. R. Kent, J. Chem. Theory Comput. 10, 5318 (2014).
- Umrigar et al. (2007) C. J. Umrigar, J. Toulouse, C. Filippi, S. Sorella, and R. G. Hennig, Phys. Rev. Lett. 98, 110201 (2007).
- Umrigar and Filippi (2005) C. J. Umrigar and C. Filippi, Physical Review Letters 94 (2005), 10.1103/PhysRevLett.94.150201, arXiv:0412634 [cond-mat] .
- Drummond et al. (2008) N. D. Drummond, R. J. Needs, A. Sorouri, and W. M. Foulkes, Phys. Rev. B 78 (2008), 10.1103/PhysRevB.78.125106, arXiv:0806.0957 .
- Fraser et al. (1996) L. M. Fraser, W. M. C. Foulkes, G. Rajagopal, R. J. Needs, S. D. Kenny, and A. J. Williamson, Phys. Rev. B 53, 1814 (1996).
- Mitáš et al. (1991) L. Mitáš, E. L. Shirley, and D. M. Ceperley, J. Chem. Phys. 95, 3467 (1991).
- Dzubak et al. (2017) A. L. Dzubak, J. T. Krogel, and F. A. Reboredo, J. Chem. Phys. 147, 024102 (2017).
- Casula (2006) M. Casula, Phys. Rev. B 74 (2006), 10.1103/PhysRevB.74.161102.
- Chakraborty et al. (2018) A. Chakraborty, M. Dixit, D. Aurbach, and D. T. Major, npj Comput. Mater. 4, 60 (2018).
- Hirano et al. (1995) A. Hirano, R. Kanno, Y. Kawamoto, Y. Takeda, K. Yamaura, M. Takano, K. Ohyama, M. Ohashi, and Y. Yamaguchi, Solid State Ionics 78, 123 (1995).
- Reimers and Dahn (1992) J. N. Reimers and J. Dahn, Journal of The Electrochemical Society 139, 2091 (1992).
- y de Dompablo et al. (2002) M. A. y de Dompablo, A. Van der Ven, and G. Ceder, Phys. Rev. B 66, 064112 (2002).
- Arai et al. (1995) H. Arai, S. Okada, H. Ohtsuka, M. Ichimura, and J. Yamaki, Solid State Ionics 80, 261 (1995).
- Rajagopal et al. (1994) G. Rajagopal, R. J. Needs, S. Kenny, W. M. Foulkes, and A. James, Physical Review Letters 73, 1959 (1994).
- Arroyo y de Dompablo et al. (2001) M. E. Arroyo y de Dompablo, C. Marianetti, A. Van der Ven, and G. Ceder, Phys. Rev. B 63, 144107 (2001).
- Arroyo y de Dompablo and Ceder (2003) M. E. Arroyo y de Dompablo and G. Ceder, in J. Power Sources, Vol. 119-121 (2003) pp. 654–657.
- Chen et al. (2011) H. Chen, C. L. Freeman, and J. H. Harding, Phys. Rev. B - Condens. Matter Mater. Phys. 84 (2011), 10.1103/PhysRevB.84.085108.
- Kemp et al. (1990) J. Kemp, P. Cox, and J. Hodby, J. Phys. Condens. Matter 2, 6699 (1990).
- Reynaud et al. (2001) F. Reynaud, D. Mertz, F. Celestini, J.-M. Debierre, A. Ghorayeb, P. Simon, A. Stepanov, J. Voiron, and C. Delmas, Physical review letters 86, 3638 (2001).
- Zhou et al. (2004) F. Zhou, M. Cococcioni, C. A. Marianetti, D. Morgan, and G. Ceder, Phys. Rev. B 70, 235121 (2004).
- Shishkin and Sato (2016) M. Shishkin and H. Sato, Phys. Rev. B 93, 085135 (2016).
- Koyama et al. (2005) Y. Koyama, T. Mizoguchi, H. Ikeno, and I. Tanaka, J. Phys. Chem. B 109, 10749 (2005).
- Perdew et al. (2017) J. P. Perdew, W. Yang, K. Burke, Z. Yang, E. K. U. Gross, M. Scheffler, G. E. Scuseria, T. M. Henderson, I. Y. Zhang, A. Ruzsinszky, H. Peng, J. Sun, E. Trushin, and A. Görling, Proc. Natl. Acad. Sci. 114, 2801 (2017).
- Peng and Perdew (2017) H. Peng and J. P. Perdew, Phys. Rev. B 96 (2017).
- Kitchaev et al. (2016) D. A. Kitchaev, H. Peng, Y. Liu, J. Sun, J. P. Perdew, and G. Ceder, Phys. Rev. B 93 (2016).
- Sai Gautam and Carter (2018) G. Sai Gautam and E. A. Carter, Phys. Rev. Mater. 2, 095401 (2018).
- Kang and Ceder (2006) K. Kang and G. Ceder, Phys. Rev. B 74, 094105 (2006).
- Jónsson et al. (1998) H. Jónsson, G. Mills, and K. W. Jacobsen, in Classical and quantum dynamics in condensed phase simulations (World Scientific, 1998) pp. 385–404.
- Van Der Ven and Ceder (2000) a. Van Der Ven and G. Ceder, Electrochem. Solid-State Lett. 3, 301 (2000).
- Nakamura et al. (2000) K. Nakamura, H. Ohno, K. Okamura, Y. Michihiro, I. Nakabayashi, and T. Kanashiro, Solid State Ionics 135, 143 (2000).
- Okubo et al. (2009) M. Okubo, Y. Tanaka, H. Zhou, T. Kudo, and I. Honma, Journal of Physical Chemistry B 113, 2840 (2009).
- Balke et al. (2012) N. Balke, S. Kalnaus, N. J. Dudney, C. Daniel, S. Jesse, and S. V. Kalinin, Nano Letters 12, 3399 (2012).
- Lynch and Truhlar (2001) B. J. Lynch and D. G. Truhlar, J. Phys. Chem. A 105, 2936 (2001).