The GALAH Survey: Chemically tagging the Fimbulthul stream to the globular cluster Centauri
Abstract
Using kinematics from Gaia and the large elemental abundance space of the second data release of the GALAH survey, we identify two new members of the Fimbulthul stellar stream, and chemically tag them to massive, multi-metallic globular cluster Centauri. Recent analysis of the second data release of Gaia had revealed the Fimbulthul stellar stream in the halo of the Milky Way. It had been proposed that the stream is associated with the Cen, but this proposition relied exclusively upon the kinematics and metallicities of the stars to make the association. In this work, we find our two new members of the stream to be metal-poor stars that are enhanced in sodium and aluminium, typical of second population globular cluster stars, but not otherwise seen in field stars. Furthermore, the stars share the s-process abundance pattern seen in Cen, which is rare in field stars. Apart from one star within 1.5 deg of Cen, we find no other stars observed by GALAH spatially near Cen or the Fimbulthul stream that could be kinematically and chemically linked to the cluster. Chemically tagging stars in the Fimbulthul stream to Cen confirms the earlier work, and further links this tidal feature in the Milky Way halo to Cen.
keywords:
globular clusters: individual: Cen – Galaxy: halo – Galaxy: kinematics and dynamics1 Introduction
The modern paradigm for the formation and growth of galaxies, and of larger scale structures within the Universe (known as the CDM paradigm) features the growth of large galaxies, like the Milky Way, through mergers with smaller bodies (e.g., Searle & Zinn, 1978; White & Frenk, 1991; Côté et al., 1998, 2000; Venn et al., 2004; Cole et al., 2002; Oser et al., 2010). When a dwarf galaxy merges with Milky Way, it is tidally stripped of some, or all, of its stars. Similarly, objects already orbiting the Milky Way can be tidally stripped of stars during events like Galactic plane passages. If the dynamical evolution timescale is larger than the orbital period, these stripped stars remain for some time on approximately the mean orbit of the progenitor (Lynden-Bell & Lynden-Bell, 1995). This leads to streams and tidal debris throughout the Milky Way Galaxy, acting as the fossils records of these events.
Large-scale photometric surveys have, to date, uncovered some 50 streams in our Galaxy (Mateu et al., 2018, and references therein). The second data release of the ESA’s Gaia mission (Prusti et al., 2016; Brown et al., 2018) has caused an explosion in the discovery rate of streams through the combination of precise photometry and proper motion measurements, and has been used to identify stellar streams in the local region of the Galaxy (Meingast et al., 2019), the bulge (e.g., Ibata et al., 2018), the halo (e.g., Malhan et al., 2018; Koppelman et al., 2018; Ibata et al., 2019b), and even potentially outside of our Galaxy in the Magellanic Stream (e.g., Price-Whelan 1; Price-Whelan et al., 2018a; Nidever et al., 2019; Bellazzini et al., 2019). There is much interest in kinematically mapping these streams (e.g., Li et al., 2019) as they are a useful tool for studying our Galaxy’s history and large-scale structure (Eyre & Binney, 2009; Law & Majewski, 2010; Bonaca et al., 2019; Malhan & Ibata, 2019).
A number of extant star clusters have been found to have extra-tidal features or streams associated with them (e.g., Odenkirchen et al., 2001; Belokurov et al., 2006; Olszewski et al., 2009; Kuzma et al., 2018; Palau & Miralda-Escudé, 2019; Carballo-Bello, 2019). Such links are particularly valuable, as they can provide a strong test for models of the gravitational field of the Milky Way. Simply put, any successful model must correctly predict the location and motion of the stream relative to the progenitor cluster.
Ibata et al. (2019b) identified a new cluster-stream pairing using Gaia DR2, finding that the massive globular cluster Cen could be linked to one of their newly discovered streams, which they named Fimbulthul. They found that Fimbulthul and Cen had similar orbital energies and angular momenta. The relationship was explored further in Ibata et al. (2019a, hereafter I+19), where the authors estimated the metallicities of four stream members, finding them to be metal poor. Since I+19 had only metallicities for their stars to compare to Cen, and Cen has a large metallicity range (; e.g., Johnson & Pilachowski, 2010), it is prudent to explore a larger set of elemental abundance distributions of the stream stars, and to determine if they can be chemically tagged to Cen. The chemical tagging of stars in streams to progenitors is a burgeoning field of research. Hasselquist et al. (2019) found stars in the APOGEE survey that had kinematics consistent with those predicted by N-body simulations of the Sagittarius dwarf spheroidal galaxy stream and chemical abundances like those found in it.
In general, chemically tagging stars to globular clusters takes advantage of the fact that almost111The notable exception is Ruprecht 106 (Villanova et al., 2013; Dotter et al., 2018). every Milky Way globular cluster studied in detail exhibits star-to-star variations in light-element abundances222The formation mechanisms of globular clusters are hotly debated; see the review of Bastian & Lardo (2018) and references therein., typically with anti-correlations between & , and & . In globular cluster research, the stars with abundance patterns like the Galactic halo (e.g., low sodium and high oxygen) are commonly referred to as ‘primordial’ or ‘first population’ stars. The stars with enhanced abundances of sodium and depleted oxygen are ‘enriched’ or ‘second population’ stars. It is these second population stars that can be most readily identified in the field (as they are only about per cent of the halo, e.g., Martell et al., 2011) and chemically tagged as having come from globular clusters (e.g., Martell & Grebel, 2010; Fernández-Trincado et al., 2016, 2017; Schiavon et al., 2017; Tang et al., 2019).
In addition to the light element abundance dispersions, Cen exhibits large metallicity and s-process element abundance ranges (e.g., Norris & Da Costa, 1995b; Marino et al., 2012; Johnson & Pilachowski, 2010; Simpson et al., 2012; Simpson & Cottrell, 2013), neither of which are typically observed in globular clusters (there are some notable exceptions, e.g., M22; Marino et al., 2011a). Along with its retrograde orbit about the Milky Way, these abundance patterns have led to the hypothesis that Cen is the core of an accreted dwarf galaxy (Bekki & Freeman, 2003). If so, there should be a large amount of tidal debris in the Milky Way halo that was stripped from Cen’s parent galaxy.
There have been many searches for such stars. The obvious place to search for tails is within 10 deg of the cluster, where the kinematic and distance properties will still be similar to those of the cluster. Marconi et al. (2014) and I+19 both find evidence for tails in star counts. While those photometric surveys have provided some evidence for extra-tidal features, spectroscopic searches within a few degrees have not identified significant quantities of Cen stars beyond the tidal radius. Da Costa & Coleman (2008) searched up to 2 deg from the cluster and found only six stars outside the tidal radius with radial velocities expected for Cen — and we note that with Gaia proper motions only two of these are consistent with membership.
A few field stars have been associated with Cen. Lind et al. (2015) found a star with low and high that they conjectured could have been ejected at high speed from Cen. Fernández-Trincado et al. (2015) found eight stars in RAVE that they calculated to have been ejected from Cen. Both of these works warrant follow-up in light of the new precision proper motions from Gaia. Myeong et al. (2018) identified retrograde substructures in the halo based upon clustering in action space, and some of these structures they associated with Cen.
In this work we aim to chemically tag stars of the Fimbulthul stream to Cen using the second data release of the GALactic Archaeology with HERMES (GALAH) survey (De Silva et al., 2015; Buder et al., 2018). The GALAH survey is a large and ambitious spectroscopic investigation of the local stellar environment. One of its principal aims is to determine precise abundances of up to 30 elements from one million stars, and to use chemical tagging to identify dispersed stellar clusters in the field of the disk and halo (for the initial motivating chemical tagging papers, see Freeman & Bland-Hawthorn, 2002; Bland-Hawthorn et al., 2010). The results from the GALAH survey have already been used to explore stellar streams (Quillen et al., 2018), have shown that chemical tagging can work on co-moving pairs of stars (Simpson et al., 2019), and have found additional members of the Pleiades (Kos et al., 2017). It has also had the interesting null result of showing that several purported clusters do not exist (Kos et al., 2018).
2 Data
In this work, we use the second public data release of the GALAH survey (GALAH DR2; see the release paper: Buder et al., 2018), as well as Cen stars observed by GALAH that were not part of the public release. Overall, this gives 375,688 stars with up to 23 elemental abundances per star. The GALAH survey’s observing procedures can be found in Martell et al. (2017). In-depth descriptions of the spectral reduction, stellar parameter and abundance inference pipelines can be found in Kos et al. (2016) and Buder et al. (2018). Below we will briefly describe the details from those papers pertinent to this work.
These data are based upon spectra obtained between 2013 November and 2017 September using the 3.9-metre Anglo-Australian Telescope with the HERMES spectrograph (Sheinis et al., 2015) and the Two-Degree Field fibre positioner top-end (Lewis et al., 2002). HERMES simultaneously acquires spectra for science targets using four independent cameras with non-contiguous wavelength coverage totalling Å at a spectral resolving power of . The spectra were reduced using an iraf-based pipeline that was developed specifically for GALAH and optimized for speed, accuracy, and consistency (Kos et al., 2016).
The GALAH DR2 stellar parameter and abundance pipeline used a two-step process (Buder et al., 2018). In the first step, spectra with high signal-to-noise were identified and analyzed with the spectrum synthesis code Spectroscopy Made Easy (sme; Valenti & Piskunov, 1996; Piskunov & Valenti, 2016) to determine the stellar labels (e.g., , , , , , , and [X/Fe]). In the second step, the cannon (Ness et al., 2015) learned these training set labels from sme and built a quadratic model at each pixel of the normalized spectrum as a function of the labels. Abundance estimates were then generated from the cannon model for all of the spectra. It is these the cannon values that we use in this work.
For some stars, the label results from the cannon are not necessarily reliable. For stellar parameters, these are flagged in the flag_cannon value, and for individual elements in the flag_x_fe value (where x is the element symbol). Buder et al. (2018) recommends to only use stellar parameters from stars where , and for a given elemental abundance where . However, this would restrict the number of possible Cen-like stars we could investigate, as the training set was not highly populated at the metal-poor end of the iron abundance distribution function. Of the 9090 stars in the dataset with , only 66 per cent (5987/9090) have , and 1929 stars have (this indicates that the cannon started to extrapolate outside of the training set bounds to estimate the abundance). For the elements of interest for chemical tagging stars to Cen, many of the metal-poor stars would be excluded with a strict flagging criterion: for and only stars of these metal-poor stars have , and for it is only 628 stars. In this work, we decided to loosen the flagging criteria and use iron abundance values for stars where (i.e., no flags; or the cannon started to extrapolate) and individual elemental abundances where (i.e., no flags; the cannon started to extrapolate; or line strength was below the 2- upper limit). This increases the number of useful stars to 7916, 4326, 5225, and 1886 for , , , and respectively.
The GALAH survey data was combined with the astrometric and proper motion data from the second data release (DR2) from the Gaia mission. GALAH’s input catalogue is based upon 2MASS (Skrutskie et al., 2006), so we used the tmass_best_neighbour table produced by the Gaia collaboration for the cross-match. To exclude stars with likely poor astrometry, we required that the Renormalised Unit Weight Error (defined in Lindegren, 2018) be . As Gaia photometry is less reliable in crowded regions (e.g., globular clusters) due to source confusion in the blue and red photometers (Evans et al., 2018), we excluded stars which did not fall in the range , where CE is the phot_bp_rp_excess_factor (Babusiaux et al., 2018).
From both the GALAH dataset and the full Gaia dataset we identified likely Cen members. For both datasets we selected stars within 1 deg of , proper motions within 2 of (Helmi et al., 2018), and parallaxes of mas. The proper motion distance of was selected as it encompassed an obvious over-density in the proper motion distribution of the GALAH-observed stars. The systemic radial velocity of Cen has a large offset from the bulk of stars along the line-of-sight: 232 (see, e.g., Da Costa & Coleman, 2008). For the GALAH dataset we required that every star be within 40 of this value. For the Gaia dataset, the bulk of stars do not have measured radial velocities, so we excluded only the few stars that met the other criteria but were outside the range. In total, these selection criteria identified 352 members of Cen observed by the GALAH survey (with a radial velocity mean and standard deviation of ), and 66,597 from Gaia DR2.
3 Identification of new candidate stream members
| source_id | Symbol | G | |||||||
|---|---|---|---|---|---|---|---|---|---|
| (deg) | (deg) | () | (K) | ||||||
| 6192933650707925376 | 311.06 | 37.19 | 218.5 | 1.03 | 12.40 | ||||
| 6182748015506372480 | 308.75 | 32.86 | 214.8 | 1.28 | 12.17 | ||||
| 6086940734091928064 | 307.93 | 15.89 | 240.3 | 1.34 | 13.72 | ||||
| 6137654604109711360 | ✚ | 306.18 | 20.92 | 213.5 | 1.31 | 12.83 | |||
| 6140730767063538048 | ✖ | 305.96 | 21.51 | 261.4 | 1.39 | 13.67 |
The proposed Fimbulthul stream members (from supplementary table 1 of I+19, ) are dominated by dwarf stars with a handful of giant stars. With a distance of 4 kpc, almost all of the stream stars are much fainter than the typical apparent magnitude range observed by GALAH (), and none of the proposed stream members were observed by GALAH.
The streamfinder software (Malhan & Ibata, 2018) as implemented by Ibata et al. (2019b) avoided the region within 30 deg of the Galactic plane due to confusion from the high stellar density and differential reddening. This means that they excluded stars within deg of Cen, so we extended our search for possible Fimbulthul stars into this “zone of avoidance”. We also looked along the known stream region for stars observed by GALAH to identify if there were stars that also shared the kinematics of the known stream stars that may have been missed by Ibata et al. (2019b).
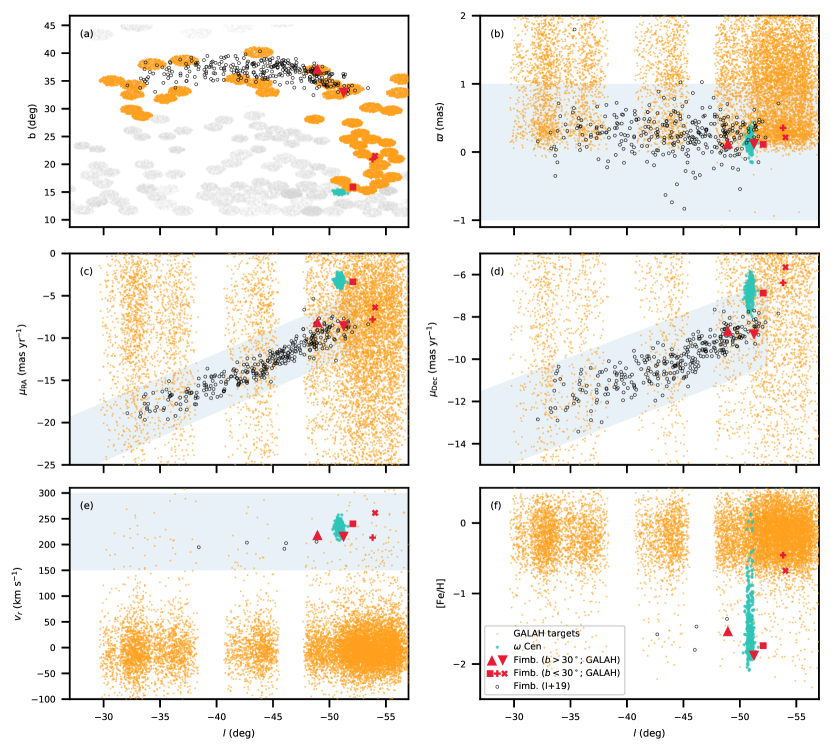
Figure 1 shows the stars observed by GALAH in the region of the sky around Cen and the Fimbulthul stream, as well as the Fimbulthul members identified by I+19. Along the known stream region (i.e., deg), we selected stars observed by GALAH that were from fields with centres within 4 deg of the fiducial line of the stream and applied the following selection criteria: radial velocity in the range (the radial velocities predicted by I+19 for the stream) and parallax in the range mas. For the proper motion criterion, we noted that the proper motion of the stream is approximately linear with Galactic longitude, so a straight line was fitted to this correlation, and it was required that and of stars were within 3.4 and 1.9 respectively of these linear fits (these limits were chosen to encompass almost all of the members identified by I+19; they are shown as the shaded regions on Figure 1b and c). These criteria identified two stars observed by the GALAH survey that are consistent with the sky position and kinematic properties of the Fimbulthul stream, but had not been associated with the stream by I+19. Their details (source_id of \StrLeft61827480155063724801[\firstletter]\StrRight61827480155063724803[\lastletter]\firstletter…\lastletter and \StrLeft61929336507079253761[\firstletter]\StrRight61929336507079253763[\lastletter]\firstletter…\lastletter) are given in Table 1 and Table 2 and they are shown as large red triangle symbols on Figures 1, 2, 4, 5, and 6.
For the zone of avoidance region, we selected the stars observed by GALAH that are along the likely fiducial line of the stream (see figure 1 of I+19, ). We used the same radial velocity and parallax criteria as above, but with a proper motion selection of , and , again based upon figure 1 of I+19. These criteria identified three stars that could possibly be associated with Cen and the Fimbulthul stream. Their details are given in Table 1 and Table 2 and they are shown as the cross, plus, and square symbols on Figures 1, 2, 4, 5, and 6.
The two stars at the location of the stream (i.e., deg) are metal poor (), but only one of the zone of avoidance stars (\StrLeft60869407340919280641[\firstletter]\StrRight60869407340919280643[\lastletter]\firstletter…\lastletter) is very metal poor: . The other two stars are only relatively metal poor: and . We explore the abundance properties of the stars further in Section 4, but we note here that although their iron abundance is within the observed distribution of Cen (see Figure 1f), these two more metal-rich stars (\StrLeft61376546041097113601[\firstletter]\StrRight61376546041097113603[\lastletter]\firstletter…\lastletter, \StrLeft61407307670635380481[\firstletter]\StrRight61407307670635380483[\lastletter]\firstletter…\lastletter) do not have the expected s-process abundances for their iron abundance to be chemically tagged to Cen (see e.g., Johnson & Pilachowski, 2010; Marino et al., 2011b). The very metal-poor star is incidentally the star closest to Cen on the sky, less than 1.5 deg from the cluster centre. This places it just outside of the tidal radius of Cen ( deg; Da Costa & Coleman, 2008).
3.1 Colour-absolute magnitude diagram
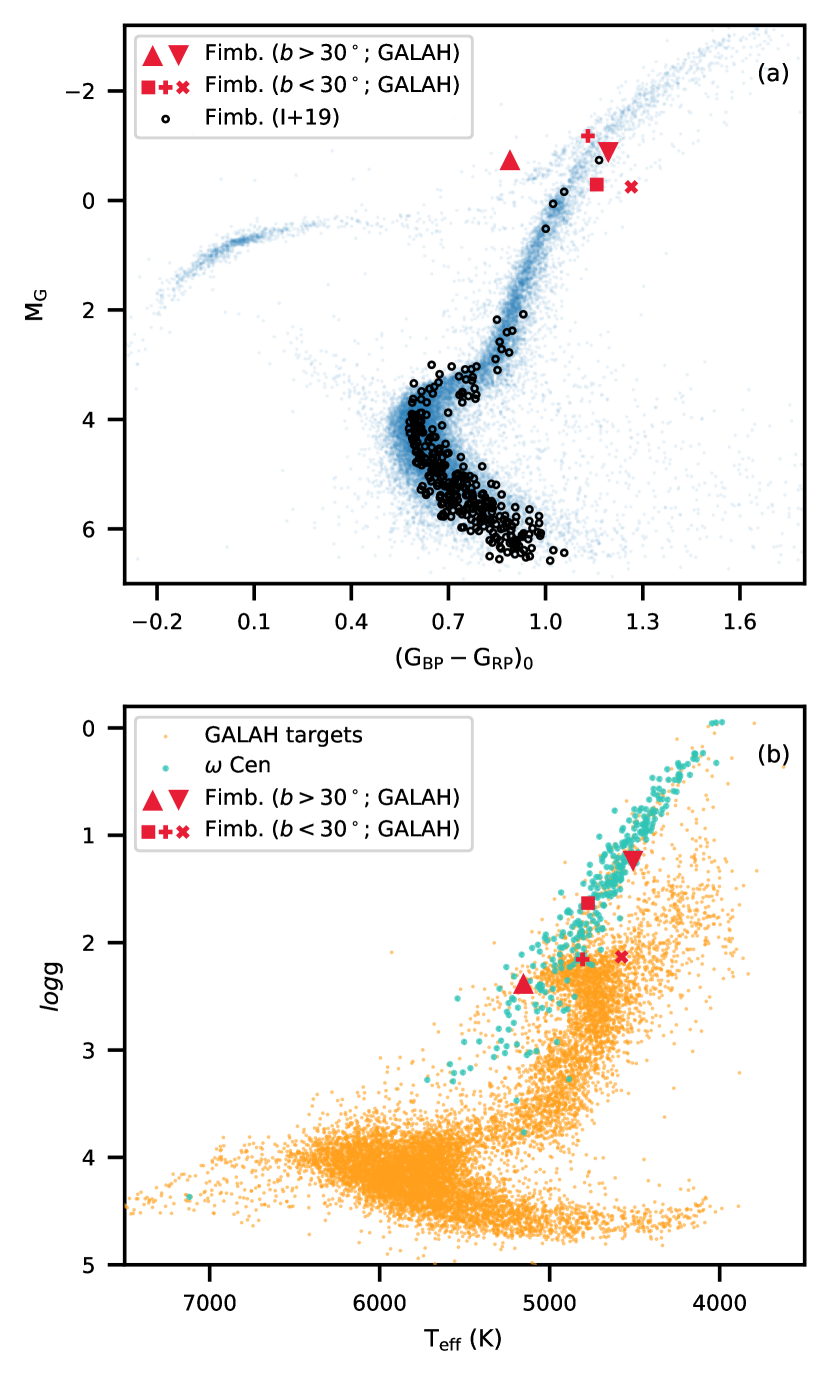
Figure 2 shows the extinction-corrected colour-absolute-magnitude diagram (CMD) of the Fimbulthul stream stars from GALAH and I+19 stream stars compared to the cluster sequence of Cen. The photometry has been adjusted to absolute magnitudes and de-reddened colours, assuming , and the reddening and extinction corrections are from equation 1 and table 1 of Babusiaux et al. (2018). The values for each star were calculated from the Schlafly & Finkbeiner (2011) reddening maps using the dustmaps interface (Green, 2018), except for the Cen stars, for which we assumed a single reddening value of (Harris, 1996).
The distance modulus of Cen is well-constrained (e.g., Braga et al., 2018), and we assumed that Cen and proposed stream members with deg are the same distance, namely . As found in I+19, the stream and Cen are not at the same distance. For the I+19 sample of Fimbulthul stars, we used a distance modulus of , i.e., the stream is about 1.7 kpc closer to the Sun than Cen. We note that I+19 had a distance modulus difference between the cluster and the stream of 0.7 mag, compared to our 0.8 mag.
The photometry of the bluest of the GALAH stars on the stream (\StrLeft61929336507079253761[\firstletter]\StrRight61929336507079253763[\lastletter]\firstletter…\lastletter) places it on the asymptotic giant branch (AGB) of Cen. We also inspected CMDs generated from SkyMapper DR2 (Onken et al 2019, in prep) and Pan-STARRS1 DR2 (Chambers et al., 2016), finding the same result, i.e., \StrLeft61929336507079253761[\firstletter]\StrRight61929336507079253763[\lastletter]\firstletter…\lastletter is clearly bluer than the RGB for its luminosity. This is consistent with the GALAH Kiel diagram (Figure 2b), which identifies it as an AGB star from its and .
4 Chemical tagging
| source_id | Symbol | ||||||
|---|---|---|---|---|---|---|---|
| 6192933650707925376 | |||||||
| 6182748015506372480 | |||||||
| 6086940734091928064 | |||||||
| 6137654604109711360 | ✚ | ||||||
| 6140730767063538048 | ✖ |
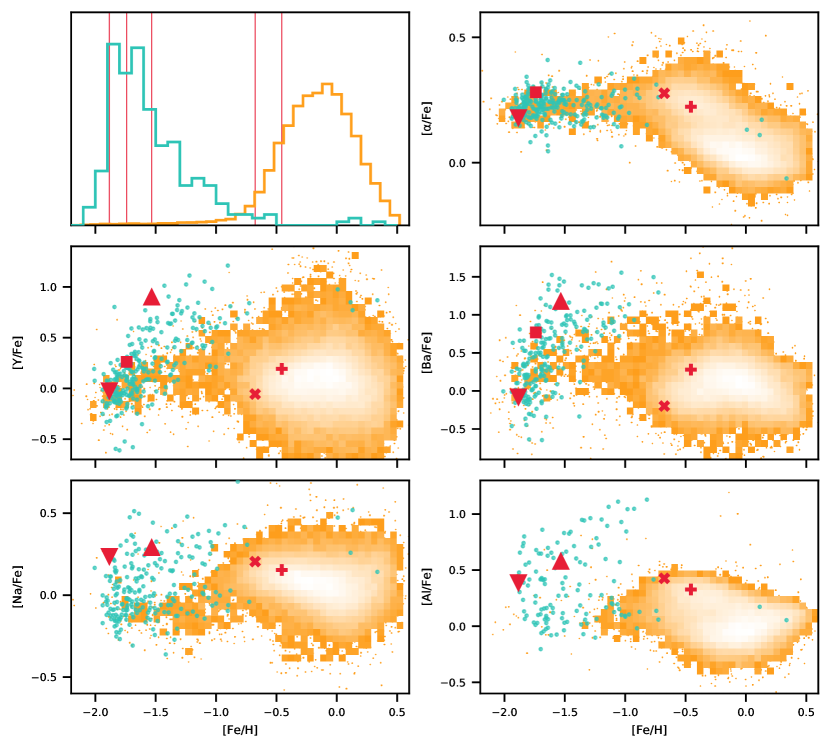
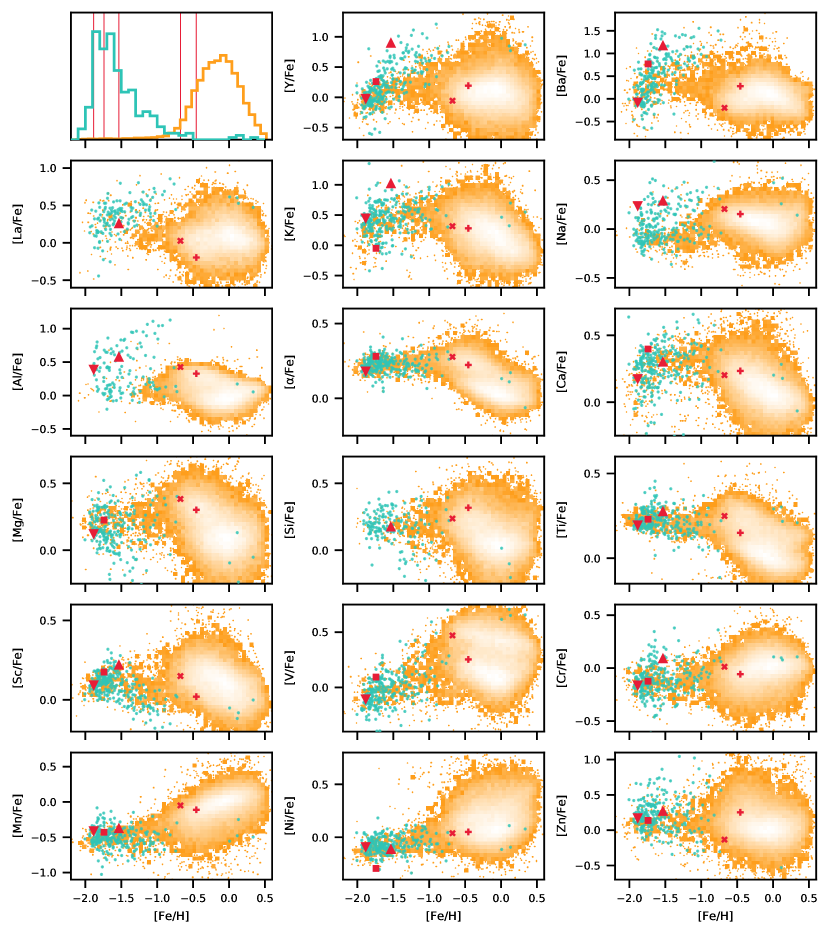
As discussed in Section 1, globular clusters, and in particular Cen, display star-to-star abundance patterns that are not observed in the vast majority of field stars. Relevant to this work, the elemental abundances of stars in Cen have been found to cover large ranges in light elements (e.g. sodium333Although oxygen is typically part of the analysis of second population stars in globular clusters, the wavelength coverage of HERMES does not include useful oxygen lines in cool, metal-poor giants. It would therefore be useful to follow up these stars (e.g., in the infrared) to obtain oxygen abundances. and aluminium). In addition, unlike almost every other globular cluster, the stars also exhibit a large range of iron abundances () and the abundances of s-process elements (e.g., lanthanum, yttrium, and barium; see e.g., Norris & Da Costa, 1995a, b; Stanford et al., 2010; Johnson & Pilachowski, 2010; Marino et al., 2012; Simpson & Cottrell, 2013). These provide useful markers for chemically tagging stars to Cen.
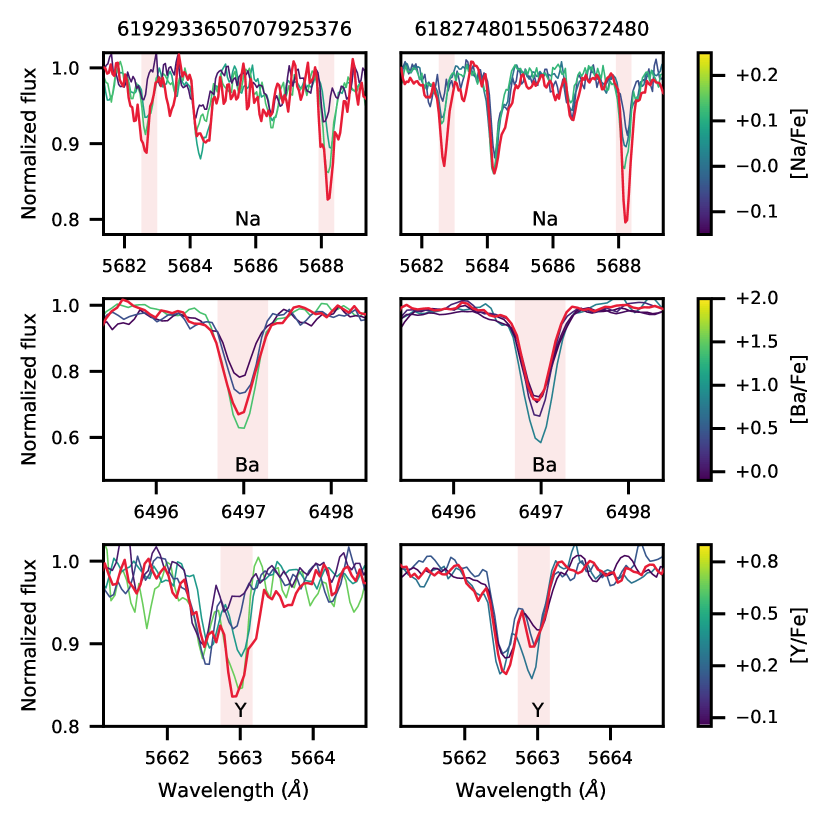
In Figure 4 we show the iron abundance, , and abundance distributions for , , , and for the 40,040 stars in the region of the sky within the box and (i.e., the region of the sky shown in Figure 1a). The abundances of the Cen stars and our proposed Fimbulthul stream members observed by GALAH are highlighted. The full abundance set is shown in Figure 6. In Figure 3 we show small regions of the HERMES spectrum surrounding the regions used by the cannon for Na, Ba and Y abundance determination. Spectra of the two new Fimbulthul stream stars are shown with heavier red lines, and spectra of other GALAH stars with similar stellar parameters but different elemental abundances are shown with thin lines colour-coded by their abundance. The higher Ba and Y abundances in \StrLeft61929336507079253761[\firstletter]\StrRight61929336507079253763[\lastletter]\firstletter…\lastletter and the enhanced Na abundance in both stars can be seen directly in the spectra.
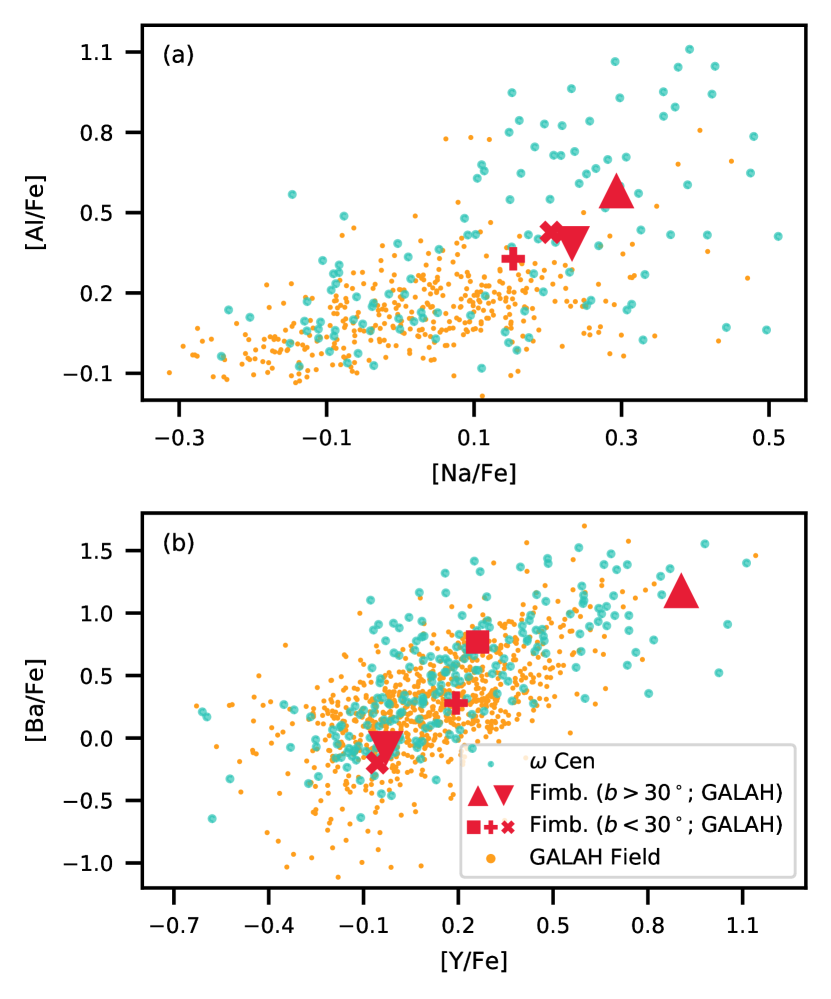
Overall, our results show that we recover the known iron abundance distribution of Cen 444Four of the Cen stars have implausible, super-solar iron abundances. In the provisional internal third data release of GALAH, these stars have much more reasonable metallicities of , while the other Cen stars are relatively unchanged., with most of the stars much more metal poor than the bulk of the stars in this region of the sky. For the light elements and , we find the large star-to-star abundance ranges known to exist in Cen (e.g., Norris & Da Costa, 1995a). The two stars identified in the Fimbulthul region (i.e., deg) also are enhanced in these elements, strongly indicative of them being second population globular cluster stars. In Figure 5a, we highlight the correlation between and for all stars with observed by GALAH in this region of the sky. The bulk of the field stars have and less than 0.4 dex, but many of the Cen stars are enhanced in these elements like the two GALAH-Fimbulthul stars.
Further evidence for chemically tagging these stars to Cen can be found in their s-process abundances. The Cen stars show the characteristic rapid increase in s-process abundance with iron found in other work. The star that is more metal rich (\StrLeft61929336507079253761[\firstletter]\StrRight61929336507079253763[\lastletter]\firstletter…\lastletter) has and . Figure 5b shows that such abundances are rarely seen in the field. Finding a metal-poor star that is both enhanced in s-process elements and light elements like aluminium is rare. There are stars with in the entire GALAH dataset with and and most are found in Cen. The other stars with enhanced light element abundances warrant follow up to understand their origins. The more metal-poor star (\StrLeft61827480155063724801[\firstletter]\StrRight61827480155063724803[\lastletter]\firstletter…\lastletter; the reddest GALAH-Fimbulthul star on Figure 2) shows no enhancement in nor relative to the field, but this would be expected at its iron abundance if it had been lost from Cen.
Both \StrLeft61827480155063724801[\firstletter]\StrRight61827480155063724803[\lastletter]\firstletter…\lastletter and \StrLeft61929336507079253761[\firstletter]\StrRight61929336507079253763[\lastletter]\firstletter…\lastletter have second population abundances, they follow the -[s/Fe] trend of Cen, and they are spatially and kinematically compatible with being members of the Fimbulthul stream. As a result, we are confident about chemically tagging these stars to Cen, and therefore the rest of the Fimbulthul stream to Cen.
We now briefly consider the three stars from the zone of avoidance (i.e., , outside of the region considered by Ibata et al., 2019b). The abundances of two metal-rich stars are not consistent with their being former members of Cen. Although somewhat enhanced in light elements, they do not show the level of enhancement in s-process elements expected for an Cen star of their iron abundance (see e.g., Johnson & Pilachowski, 2010; Marino et al., 2011b). Unfortunately, the extra-tidal star closest to Cen did not have reliable light element abundances, but it does have a moderate enhancement in its s-process abundances. Its closeness to the cluster (only 1.5 deg away), and kinematics basically identical to rest of the cluster point to it being a relatively recently escaped extra-tidal star. Its position on the sky aligns with the direction of the extra-tidal features found by I+19.
4.1 Abundance flagging
| source_id | sobject_id | Symbol | flag_cannon | flag_y_fe | flag_ba_fe | flag_na_fe | flag_al_fe |
|---|---|---|---|---|---|---|---|
| 6192933650707925376 | 170512001301266 | 0 | 1 | 1 | 1 | 2 | |
| 6182748015506372480 | 170513003501228 | 0 | 0 | 2 | 1 | 1 | |
| 6086940734091928064 | 170404002101197 | 0 | 0 | 0 | 4 | 5 | |
| 6137654604109711360 | 170408004001066 | ✚ | 0 | 0 | 0 | 0 | 0 |
| 6140730767063538048 | 170408004001278 | ✖ | 0 | 0 | 0 | 0 | 0 |
As discussed in Section 2, we have included stars in our sample that were flagged as having potentially unreliable abundance values. In Table 3 we give the flag_cannon and flag_x_fe values for the five stars highlighted throughout this work. Of note is that the two likely Fimbulthul stream stars (\StrLeft61827480155063724801[\firstletter]\StrRight61827480155063724803[\lastletter]\firstletter…\lastletter and \StrLeft61929336507079253761[\firstletter]\StrRight61929336507079253763[\lastletter]\firstletter…\lastletter) both have their , , and abundances flagged as either 1 (the cannon started to extrapolate) or 2 (Line strength below 2- upper limit). In the case of the , this occurs because the training set does not include metal-poor stars with abundances like those seen in second population globular cluster stars. As such, the cannon needs to extrapolate in order to estimate abundances. This does not necessarily mean that the values are inaccurate; moreover abundance accuracy is not the key aim of this work. Instead, our goal was to identify stars with enhanced abundances of light elements relative to the bulk of the metal-poor halo population, in order to chemically tag them as second population Cen stars. We can be confident that the cannon will have estimated abundances that reflect these stars are enhanced in the particular elements of interest.
4.2 Abundances on the asymptotic giant branch
As noted in Section 3, \StrLeft61929336507079253761[\firstletter]\StrRight61929336507079253763[\lastletter]\firstletter…\lastletter is an asymptotic giant branch (AGB) star. There has been much discussion in the literature about differences in the abundances of stars on the AGB versus those on the RGB in globular clusters (Norris et al., 1981; Campbell et al., 2013; Campbell et al., 2017; MacLean et al., 2016; MacLean et al., 2018), in particular with respect to apparent differences in their derived metallicities and light element abundances (Lapenna et al., 2016; Mucciarelli et al., 2019). There are two related effects that are causing these discrepancies. First, the iron abundance derived from neutral and ionized species differ in AGB stars. Second, on the AGB, the derived from the infrared flux method gives significantly different values to those derived from spectroscopic analysis — while in RGB stars, the two methods give the same values. These discrepancies are likely the result of the current treatment of stellar atmospheres using 1D-LTE, and the potential for 3D and/or NLTE effects to be larger in AGB stars than in RGB stars. For GALAH DR2 abundances there was an effort to include non-LTE calculations for key elements, including Na and Al (Buder et al., 2018).
5 Concluding remarks
In this work, we have shown that two stars observed by the GALAH survey are associated with the Fimbulthul stellar stream, and can be chemically tagged to the massive globular cluster Cen. We find another star that has likely just escaped from the cluster. Cen is the most massive of the Milky Way’s known clusters and has a broad iron distribution, abundance patterns not otherwise seen in globular clusters, and a retrograde orbit about the Galaxy. This has led to the hypothesis that Cen is the core of an accreted dwarf galaxy. The progenitor galaxy of Cen would have been to times larger than the present day mass of Cen (Tsuchiya et al., 2003, 2004), which means that there should be tidal tails and debris lost from Cen and its host galaxy throughout the Milky Way. Confirming the association of Fimbulthul to Cen by I+19 marks the first time that tidal arms have been found well away from the cluster.
Overall, we have only identified three stars observed by GALAH, outside of the tidal radius that we are confident to associate with Cen. As discussed in Da Costa & Coleman (2008), the current orbit of Cen is such that it is strongly influenced by tidal shocks. Stars leaving the cluster with a relative velocity of (the velocity dispersion in the outer parts is a few ; see, e.g., Da Costa, 2012) can transverse the region between 1 and 2 tidal radii in less than the orbital period around the Galaxy. At this point the next disk crossing likely gives them sufficient kick to move further away. As such, we would expect there to be few stars remaining close to cluster — there is effectively just too much gravitational energy being pumped in. Note that this is quite different to the situation for an orbit with a larger ratio of Galactic apocentre to pericentre, in which the unbound stars do not dissipate as rapidly and we would expect tidal debris near the cluster.
In the next few years, both the Gaia and GALAH surveys should produce their third data releases, which will add a vast amount of new and improved data by which our study could be expanded. Having demonstrated here the power of chemical tagging in aiding the identification of stellar streams from Cen, it will be interesting to see whether those new and expanded data sets allow us to further strengthen the connection between the Fimbulthul stream and Cen, and to potentially draw conclusions on the timescales on which the disruption of the postulated progenitor galaxy by the Milky Way has occurred.
Acknowledgements
The GALAH survey is based on observations made at the Anglo-Australian Telescope, under programmes A/2013B/13, A/2014A/25, A/2015A/19, A/2017A/18. We acknowledge the traditional owners of the land on which the AAT stands, the Gamilaraay people, and pay our respects to elders past and present. This paper includes data that have been provided by AAO Data Central (datacentral.org.au).
We thank the referee for their helpful comments that improved the manuscript, in particular regarding AGB stars.
The following software made this research possible: configure (Miszalski et al., 2006); iraf (Tody, 1986); python (version 3.7.4); matplotlib (v3.1.1 Hunter, 2007; Caswell et al., 2019) astropy (version 3.2.2; Robitaille et al., 2013; Price-Whelan et al., 2018b), a community-developed core python package for Astronomy; pandas (version 0.25.1; McKinney, 2010); topcat (version 4.6-3; Taylor, 2005).
This work has made use of data from the European Space Agency (ESA) mission Gaia (https://www.cosmos.esa.int/gaia), processed by the Gaia Data Processing and Analysis Consortium (DPAC, https://www.cosmos.esa.int/web/gaia/dpac/consortium). Funding for the DPAC has been provided by national institutions, in particular the institutions participating in the Gaia Multilateral Agreement.
Parts of this research were conducted by the Australian Research Council Centre of Excellence for All Sky Astrophysics in 3 Dimensions (ASTRO 3D), through project number CE170100013. JDS, SLM and DZ acknowledge the support of the Australian Research Council through Discovery Project grant DP180101791. SB acknowledges funds from the Alexander von Humboldt Foundation in the framework of the Sofja Kovalevskaja Award endowed by the Federal Ministry of Education and Research. TZ acknowledge the financial support from the Slovenian Research Agency (research core funding No. P1-0188). KF and Y-ST are grateful for support from Australian Research Council grant DP160103747. Y-ST is grateful to be supported by the NASA Hubble Fellowship grant HST-HF2-51425.001 awarded by the Space Telescope Science Institute.
References
- Babusiaux et al. (2018) Babusiaux C., et al., 2018, A&A, 616, A10
- Bastian & Lardo (2018) Bastian N., Lardo C., 2018, ARA&A, 56, 83
- Bekki & Freeman (2003) Bekki K., Freeman K. C., 2003, MNRAS, 346, L11
- Bellazzini et al. (2019) Bellazzini M., Ibata R. A., Martin N., Malhan K., Marasco A., Famaey B., 2019, preprint (arXiv:1910.04899)
- Belokurov et al. (2006) Belokurov V., Evans N. W., Irwin M. J., Hewett P. C., Wilkinson M. I., 2006, ApJ, 637, L29
- Bland-Hawthorn et al. (2010) Bland-Hawthorn J., Krumholz M. R., Freeman K., 2010, ApJ, 713, 166
- Bonaca et al. (2019) Bonaca A., Hogg D. W., Price-Whelan A. M., Conroy C., 2019, ApJ, 880, 38
- Braga et al. (2018) Braga V. F., et al., 2018, AJ, 155, 137
- Brown et al. (2018) Brown A. G. A., et al., 2018, A&A, 616, A1
- Buder et al. (2018) Buder S., et al., 2018, MNRAS, 478, 4513
- Campbell et al. (2013) Campbell S. W., et al., 2013, Nature, 498, 198
- Campbell et al. (2017) Campbell S. W., MacLean B. T., D’Orazi V., Casagrande L., de Silva G. M., Yong D., Cottrell P. L., Lattanzio J. C., 2017, A&A, 605, A98
- Carballo-Bello (2019) Carballo-Bello J. A., 2019, MNRAS, 486, 1667
- Caswell et al. (2019) Caswell T. A., et al., 2019, matplotlib/matplotlib v3.1.0, doi:10.5281/zenodo.2893252, https://doi.org/10.5281/zenodo.2893252
- Chambers et al. (2016) Chambers K. C., et al., 2016, preprint (arXiv:1612.05560)
- Cole et al. (2002) Cole S., Lacey C. G., Baugh C. M., Frenk C. S., 2002, MNRAS, 319, 168
- Côté et al. (1998) Côté P., Marzke R. O., West M. J., 1998, ApJ, 501, 554
- Côté et al. (2000) Côté P., Marzke R. O., West M. J., Minniti D., 2000, ApJ, 533, 869
- Da Costa (2012) Da Costa G. S., 2012, ApJ, 751, 6
- Da Costa & Coleman (2008) Da Costa G. S., Coleman M. G., 2008, AJ, 136, 506
- De Silva et al. (2015) De Silva G. M., et al., 2015, MNRAS, 449, 2604
- Dotter et al. (2018) Dotter A., Milone A. P., Conroy C., Marino A. F., Sarajedini A., 2018, ApJ, 865, L10
- Evans et al. (2018) Evans D. W., et al., 2018, A&A, 616, A4
- Eyre & Binney (2009) Eyre A., Binney J., 2009, MNRAS, 400, 548
- Fernández-Trincado et al. (2015) Fernández-Trincado J. G., et al., 2015, A&A, 583, A76
- Fernández-Trincado et al. (2016) Fernández-Trincado J. G., et al., 2016, ApJ, 833, 132
- Fernández-Trincado et al. (2017) Fernández-Trincado J. G., et al., 2017, ApJ, 846, L2
- Freeman & Bland-Hawthorn (2002) Freeman K., Bland-Hawthorn J., 2002, ARA&A, 40, 487
- Green (2018) Green G. M., 2018, J. Open Source Softw., 3, 695
- Harris (1996) Harris W. E., 1996, AJ, 112, 1487
- Hasselquist et al. (2019) Hasselquist S., et al., 2019, ApJ, 872, 58
- Helmi et al. (2018) Helmi A., et al., 2018, A&A, 616, A12
- Hunter (2007) Hunter J. D., 2007, Comput. Sci. Eng., 9, 90
- Ibata et al. (2018) Ibata R. A., Malhan K., Martin N. F., Starkenburg E., 2018, ApJ, 865, 85
- Ibata et al. (2019a) Ibata R. A., Bellazzini M., Malhan K., Martin N., Bianchini P., 2019a, Nat. Astron., 3, 667
- Ibata et al. (2019b) Ibata R. A., Malhan K., Martin N. F., 2019b, ApJ, 872, 152
- Johnson & Pilachowski (2010) Johnson C. I., Pilachowski C. A., 2010, ApJ, 722, 1373
- Koppelman et al. (2018) Koppelman H., Helmi A., Veljanoski J., 2018, ApJ, 860, L11
- Kos et al. (2016) Kos J., et al., 2016, MNRAS, 464, 1259
- Kos et al. (2017) Kos J., et al., 2017, MNRAS, 473, 4612
- Kos et al. (2018) Kos J., et al., 2018, MNRAS, 480, 5242
- Kuzma et al. (2018) Kuzma P. B., Da Costa G. S., Mackey A. D., 2018, MNRAS, 473, 2881
- Lapenna et al. (2016) Lapenna E., et al., 2016, ApJ, 826, L1
- Law & Majewski (2010) Law D. R., Majewski S. R., 2010, ApJ, 714, 229
- Lewis et al. (2002) Lewis I. J., et al., 2002, MNRAS, 333, 279
- Li et al. (2019) Li T. S., et al., 2019, MNRAS
- Lind et al. (2015) Lind K., et al., 2015, A&A, 575, L12
- Lindegren (2018) Lindegren L., 2018, Technical report, Re-normalising the astrometric chi-square in Gaia DR2, http://www.rssd.esa.int/doc_fetch.php?id=3757412. Lund Observatory, http://www.rssd.esa.int/doc_fetch.php?id=3757412
- Lynden-Bell & Lynden-Bell (1995) Lynden-Bell D., Lynden-Bell R. M., 1995, MNRAS, 275, 429
- MacLean et al. (2016) MacLean B. T., Campbell S. W., De Silva G. M., Lattanzio J., D’Orazi V., Simpson J. D., Momany Y., 2016, \mnrasl, 460, L69
- MacLean et al. (2018) MacLean B. T., et al., 2018, MNRAS, 481, 373
- Malhan & Ibata (2018) Malhan K., Ibata R. A., 2018, MNRAS, 477, 4063
- Malhan & Ibata (2019) Malhan K., Ibata R. A., 2019, MNRAS, 486, 2995
- Malhan et al. (2018) Malhan K., Ibata R. A., Martin N. F., 2018, MNRAS, 481, 3442
- Marconi et al. (2014) Marconi M., et al., 2014, MNRAS, 444, 3809
- Marino et al. (2011a) Marino A. F., et al., 2011a, A&A, 532, A8
- Marino et al. (2011b) Marino A. F., et al., 2011b, ApJ, 731, 64
- Marino et al. (2012) Marino A. F., et al., 2012, ApJ, 746, 14
- Martell & Grebel (2010) Martell S. L., Grebel E. K., 2010, A&A, 519, A14
- Martell et al. (2011) Martell S. L., Smolinski J. P., Beers T. C., Grebel E. K., 2011, A&A, 534, A136
- Martell et al. (2017) Martell S. L., et al., 2017, MNRAS, 465, 3203
- Mateu et al. (2018) Mateu C., Read J. I., Kawata D., 2018, MNRAS, 474, 4112
- McKinney (2010) McKinney W., 2010, in van der Walt S., Millman J., eds, 9th Python Sci. Conf.. SciPy, Austin, USA, pp 51–56
- Meingast et al. (2019) Meingast S., Alves J., Fürnkranz V., 2019, A&A, 622, L13
- Miszalski et al. (2006) Miszalski B., Shortridge K., Saunders W., Parker Q. A., Croom S. M., 2006, MNRAS, 371, 1537
- Mucciarelli et al. (2019) Mucciarelli A., Lapenna E., Lardo C., Bonifacio P., Ferraro F. R., Lanzoni B., 2019, ApJ, 870, 124
- Myeong et al. (2018) Myeong G. C., Evans N. W., Belokurov V., Sanders J. L., Koposov S. E., 2018, MNRAS, 478, 5449
- Ness et al. (2015) Ness M., Hogg D. W., Rix H. W., Ho A. Y. Q., Zasowski G., 2015, ApJ, 808, 16
- Nidever et al. (2019) Nidever D. L., et al., 2019, preprint (arXiv:1910.05360)
- Norris & Da Costa (1995a) Norris J. E., Da Costa G. S., 1995a, ApJ, 441, L81
- Norris & Da Costa (1995b) Norris J. E., Da Costa G. S., 1995b, ApJ, 447, 680
- Norris et al. (1981) Norris J., Cottrell P. L., Freeman K. C., Da Costa G. S., 1981, ApJ, 244, 205
- Odenkirchen et al. (2001) Odenkirchen M., et al., 2001, ApJ, 548, L165
- Olszewski et al. (2009) Olszewski E. W., Saha A., Knezek P., Subramaniam A., de Boer T., Seitzer P., 2009, AJ, 138, 1570
- Oser et al. (2010) Oser L., Ostriker J. P., Naab T., Johansson P. H., Burkert A., 2010, ApJ, 725, 2312
- Palau & Miralda-Escudé (2019) Palau C. G., Miralda-Escudé J., 2019, MNRAS, 488, 1535
- Piskunov & Valenti (2016) Piskunov N., Valenti J. A., 2016, A&A, 597, A16
- Price-Whelan et al. (2018a) Price-Whelan A. M., Nidever D. L., Choi Y., Schlafly E. F., Morton T., Koposov S. E., Belokurov V., 2018a, preprint (arXiv:1811.05991)
- Price-Whelan et al. (2018b) Price-Whelan A. M., et al., 2018b, AJ, 156, 123
- Prusti et al. (2016) Prusti T., et al., 2016, A&A, 595, A1
- Quillen et al. (2018) Quillen A. C., et al., 2018, MNRAS, 478, 228
- Robitaille et al. (2013) Robitaille T. P., et al., 2013, A&A, 558, A33
- Schiavon et al. (2017) Schiavon R. P., et al., 2017, MNRAS, 465, 501
- Schlafly & Finkbeiner (2011) Schlafly E. F., Finkbeiner D. P., 2011, ApJ, 737, 103
- Searle & Zinn (1978) Searle L., Zinn R., 1978, ApJ, 225, 357
- Sheinis et al. (2015) Sheinis A., et al., 2015, J. Astron. Telesc. Instruments, Syst., 1, 35002
- Simpson & Cottrell (2013) Simpson J. D., Cottrell P. L., 2013, MNRAS, 433, 1892
- Simpson et al. (2012) Simpson J. D., Cottrell P. L., Worley C. C., 2012, MNRAS, 427, 1153
- Simpson et al. (2019) Simpson J. D., et al., 2019, MNRAS, 482, 5302
- Skrutskie et al. (2006) Skrutskie M. F., et al., 2006, AJ, 131, 1163
- Stanford et al. (2010) Stanford L. M., Da Costa G. S., Norris J. E., 2010, ApJ, 714, 1001
- Tang et al. (2019) Tang B., Liu C., Fernández-Trincado J. G., Geisler D., Shi J., Zamora O., Worthey G., Moreno E., 2019, ApJ, 871, 58
- Taylor (2005) Taylor M. B., 2005, in Shopbell P., Britton M., Ebert R., eds, ADASS XIV. p. 29
- Tody (1986) Tody D., 1986, in Crawford D. L., ed., 1986 Astron. Conf.. SPIE, p. 733, doi:10.1117/12.968154
- Tsuchiya et al. (2003) Tsuchiya T., Dinescu D. I., Korchagin V. I., 2003, ApJ, 589, L29
- Tsuchiya et al. (2004) Tsuchiya T., Korchagin V. I., Dinescu D. I., 2004, MNRAS, 350, 1141
- Valenti & Piskunov (1996) Valenti J. A., Piskunov N., 1996, A&AS, 118, 595
- Venn et al. (2004) Venn K. A., Irwin M., Shetrone M. D., Tout C. A., Hill V., Tolstoy E., 2004, AJ, 128, 1177
- Villanova et al. (2013) Villanova S., Geisler D., Carraro G., Moni Bidin C., Muñoz C., 2013, ApJ, 778, 186
- White & Frenk (1991) White S. D. M., Frenk C. S., 1991, ApJ, 379, 52
Affiliations
1School of Physics, UNSW, Sydney, NSW 2052, Australia
2Centre of Excellence for Astrophysics in Three Dimensions (ASTRO-3D), Australia
3Research School of Astronomy & Astrophysics, Australian National University, ACT 2611, Australia
4Centre for Astrophysics, University of Southern Queensland, Toowoomba, QLD 4350, Australia
5Department of Physics and Astronomy, Johns Hopkins University, Baltimore, MD 21218, USA
6Institute for Advanced Study, Princeton, NJ 08540, USA
7Department of Astrophysical Sciences, Princeton University, Princeton, NJ 08544, USA
8Observatories of the Carnegie Institution of Washington, 813 Santa Barbara Street, Pasadena, CA 91101, USA
9Sydney Institute for Astronomy, School of Physics, A28, The University of Sydney, NSW, 2006, Australia
10Max Planck Institute for Astronomy (MPIA), Koenigstuhl 17, 69117 Heidelberg, Germany
11Australian Astronomical Optics, Faculty of Science and Engineering, Macquarie University, Macquarie Park, NSW 2113, Australia
12Faculty of Mathematics and Physics, University of Ljubljana, Jadranska 19, 1000 Ljubljana, Slovenia
13Department of Physics and Astronomy, Uppsala University, Box 517, SE-751 20 Uppsala, Sweden
14Department of Physics and Astronomy, Macquarie University, Sydney, NSW 2109, Australia
15School of Physical and Chemical Sciences, University of Canterbury, New Zealand
16Monash Centre for Astrophysics, School of Physics and Astronomy, Monash University, Australia
Appendix A Full abundance set