Two successive partial mini-filament confined ejections
Abstract
Active region (AR) NOAA 11476 produced a series of confined plasma ejections, mostly accompanied by flares of X-ray class M, from 08 to 10 May 2012. The structure and evolution of the confined ejections resemble that of EUV surges; however, their origin is associated to the destabilization and eruption of a mini-filament, which lay along the photospheric inversion line (PIL) of a large rotating bipole. Our analysis indicate that the bipole rotation and flux cancellation along the PIL have a main role in destabilizing the structure and triggering the ejections. The observed bipole emerged within the main following AR polarity. Previous studies have analyzed and discussed in detail two events of this series in which the mini-filament erupted as a whole, one at 12:23 UT on 09 May and the other at 04:18 UT on 10 May. In this article we present the observations of the confined eruption and M4.1 flare on 09 May 2012 at 21:01 UT (SOL2012-05-09T21:01:00) and the previous activity in which the mini-filament was involved. For the analysis we use data in multiple wavelengths (UV, EUV, X-rays, and magnetograms) from space instruments. In this particular case, the mini-filament is seen to erupt in two different sections. The northern section erupted accompanied by a C1.6 flare and the southern section did it in association with the M4.1 flare. The global structure and direction of both confined ejections and the location of a far flare kernel, to where the plasma is seen to flow, suggest that both ejections and flares follow a similar underlying mechanism.
keywords:
Solar Physics , Solar activity , Solar flares , Solar ultraviolet emission , Solar X-ray and gamma-ray emissionPACS:
96.60.-j , 96.60.Q- , 96.50.qe , 96.60.Tf, *96.60.tj , 96.60.Tf, *96.60.tk1 Introduction
Solar activity produces several kinds of ejecta from full-fledge coronal mass ejections (CMEs) to surges, jets, and sprays. These ejections are characterized by their evolution, observed size, geometry, associated energies, and masses involved, and sometimes are classified considering the instruments with which they have been observed (Webb and Howard, 2012; Raouafi et al., 2016; Canfield et al., 1996; Schmieder et al., 1996). For instance, the classification of phenomena like surges and sprays has its origin in H observations (see e.g. Foukal, 2004). The main difference between them is that while material in surges falls back down through the same magnetic structure through which it was ejected, in sprays the ejected mass apparently reaches escape velocity continuously ascending away from its point of origin in the chromosphere or very low corona (see Webb and Jackson, 1981).
Recent investigations have associated coronal jets to the eruption of so-called mini-filaments, whose plasma provides most of the ejected material (Shen et al., 2012; Adams et al., 2014; Sterling et al., 2015, 2016; Panesar et al., 2016; Joshi et al., 2018; Yang and Zhang, 2018; Moore et al., 2018). Even in cases of lower resolution observations, mini-filament reformation and eruption has been postulated as the origin of a series of blow-out jets and related events (Chandra et al., 2017). In all the previous works, the mechanism proposed for the destabilization of the mini-filament is the magnetic flux cancellation along the polarity inversion line (PIL) above which the mini-filament lays. Given the appropriate magnetic configuration, two reconnection processes may occur: a first, ”inner”, reconnection process in the magnetic field below the mini-filament, usually associated to a flare, and a second, ”external” process produced by the ascent of the mini-filament, whose supporting magnetic field lines reconnect with the ones of the overlying magnetic field yielding the injection of material into open lines producing the jet (Sterling et al., 2016).
The role of mini-filaments in the process just described led Wyper et al. (2017, 2018) to suggest that jets are produced by the same kind of mechanism, namely breakout reconnection, proposed to explain larger scale phenomena like CMEs (see e.g. Karpen et al., 2012). The numerical configuration in those simulations consists of a magnetic bipole emerging in a uniform unipolar magnetic flux area. This kind of configuration leads to the appearence of a coronal null-point above the bipole. Shearing motions imposed on the system provide free magnetic energy and produce a small flux rope that supports the mini-filament. The sheared magnetic structure expands and a reconnection process is triggered in the region around the coronal null point. As in the classical breakout model of CMEs, the reconnection removes part of the field restraining the flux rope, so it is propeled to rapidly ascend. At the same time, reconnection below the twisted flux rope is stimulated, consistently with the phenomenology described in the previous paragraph.
It has been observed in occasions that only part of the full structure of the filament is ejected (see e.g. Cheng et al., 2018, and references therein). In those cases, the filament splits in two or more segments, some of which erupt at different times or not at all (Zuccarello et al., 2009; Tripathi et al., 2006; Chandra et al., 2010). This behaviour has been identified also in the case of mini-filament eruptions associated to coronal jets (see e.g. Panesar et al., 2017).
The ejections studied in this article occurred in a similar magnetic configuration to that proposed to explain coronal jets, i.e. the presence of bipolar structures in the middle of a more extended unipolar region, in this case, the extended following polarity of active region (AR) NOAA 11576. A large magnetic bipole is observed to rotate along serveral tens of hours accompanied by a series of eruptions associated to flares. One of these, which occurred on 09 May 2012 at 12:23 UT, has been extensively analyzed by us in previous articles (López Fuentes et al., 2015, 2018), and another, which occurred on 10 May 2012 04:18 UT, was studied by Yang and Zhang (2018). The main difference between the events studied here and a regular jet is that the ejected material remained confined within the closed magnetic structure of the AR instead of reaching open field lines. After the eruption, the ejected material ascended along field lines that connected the main polarities of the AR, part of it reached the farther footpoints of the lines, and part of it fell back to the region where the ejection initiated. This observed evolution resembled that of H and EUV surges (see the aforementioned references).
The main EUV event analyzed here occurred in AR 11576 on 09 May 2012 and was associated to an M4.1 flare with a peak in GOES soft X-ray light curve at 21:01 UT. A close inspection of high resolution observations previous to the event, in the 304 Å band of the Atmospheric Imaging Assembly (AIA: Lemen et al., 2012), onboard the Solar Dynamics Observatory (SDO), indicates the presence of a mini-filament whose following eruption, accompanied by reconnection with the overlaying field, constitutes the main source of the ejected material. The extended analysis some tens of minutes before the main M4.1 event indicates that a previous smaller ejection ocurred 36 min before, involving the eruption of a different section of the same mini-filament. This previous event was associated to a less energetic C1.6 flare with peak intensity at 20:25 UT.
In Sections 2.2–2.4, we analyze the evolution of both confined eruptions and accompanying flares in several wavelengths using data from the instruments described in Section 2.1. In Section 3 we compare these successive events with the one analyzed by López Fuentes et al. (2018) and interperet our observations in the frame of that study. In Section 4 we present our concluding remarks.
2 Observations and Characteristics of the Events
2.1 The Data Used
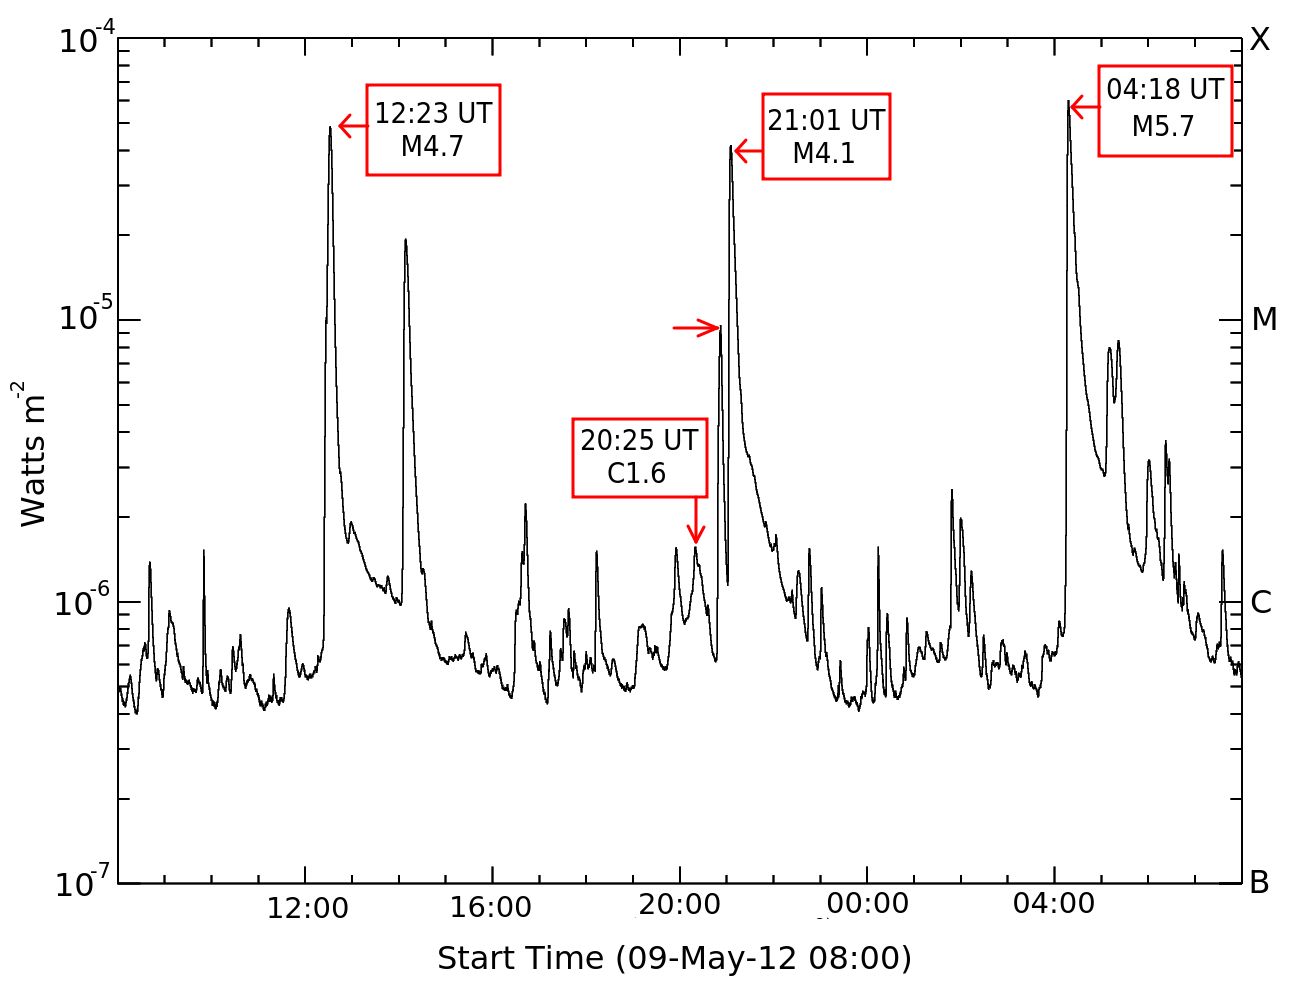
To study the flares and confined eruptions we use UV continuum and EUV data from the Atmospheric Imaging Assembly (AIA: Lemen et al., 2012), onboard the Solar Dynamics Observatory (SDO), and EUV observations from the Sun-Earth Connection Coronal and Heliospheric Investigation (SECCHI: Howard et al., 2008), onboard the Solar Terrestrial Relations Observatory (STEREO) spacecraft B, soft X-ray data from the X-ray Telescope (XRT: Golub et al., 2007) onboard Hinode, and magnetograms from the Helioseismic and Magnetic Imager (HMI: Scherrer et al., 2012), onboard SDO. Figure 1 depicts the soft X-ray curve in the 1 – 8 Å channel, where we have identified with arrows and labels both flaring events, as well as the one that occurred at 12:23 UT (López Fuentes et al., 2018), and the one that occurred at 04:18 UT on May 10 (Yang and Zhang, 2018).
SDO/AIA data are from the 1700 Å channel (from now on AIA 1700, 5000 K) and 304 Å channel (AIA 304, 5104 K). Both events are observed in AIA 304, while only the flare at 21:01 UT is observed in AIA 1700. We select subimages containing AR 11576 from full-disk data for the temporal range covering the analyzed events. We coalign the subimages and construct movies that are associated to the figures of Section 2.3. All images are displayed in logarithmic intensity scales for better contrast. We complement the SDO/AIA EUV data with images of the events from the 195 Å channel of the SECCHI instrument. We use this band because it has the highest temporal resolution (5 minutes) in SECCHI. On the day of our events, STEREO-B was at an Earth ecliptic (HEE) longitude of -118∘ away from Earth, from this location AR 11576 was seen in the solar limb. SDO/HMI data are line-of-sight (LOS) magnetograms, which are selected from full-disk images to study the evolution of the AR magnetic field (see Section 2.2).
2.2 Summary of the Photospheric Magnetic Field Evolution
The magnetic evolution of AR 11476 from appearance, on the eastern solar limb, on 04 May 2012 until the end of 10 May has been discussed in detail by López Fuentes et al. (2018). We summarize here their main results.
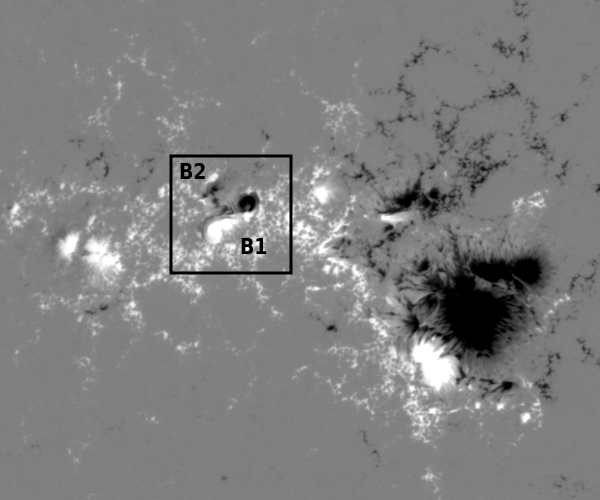
AR 11476 had a global bipolar structure; its preceding negative polarity was compact and was followed by a very dispersed following positive polarity (see Figure 2). By 7 May two bipoles, which we have labeled as B1 and B2 in Figure 2, were seen in the middle of the AR main positive polarity. The magnetogram in this figure corresponds to 20:00 UT, 25 min before the first event analyzed here. In the panels of Figure 3 we show the bipole orientations at the times of particular events. Figure 3a corresponds roughly to the time of GOES soft X-ray peak of the M4.7 flare on 9 May at 12:23 UT, Figure 3b to approximately the time of GOES peak of the M4.1 flare analyzed in this article, Figure 3c depicts the bipole locations at approximately the time of an M5.7 flare peak at 04:18 UT on 10 May, while the last panel shows the magnetic configuration of the AR much later, when both bipoles had long ago stopped rotating and the negative polarity of B1 had almost disappeared. Both flares studied here and their related confined eruptions or surges, originated in the neighborhood of B1 and B2.
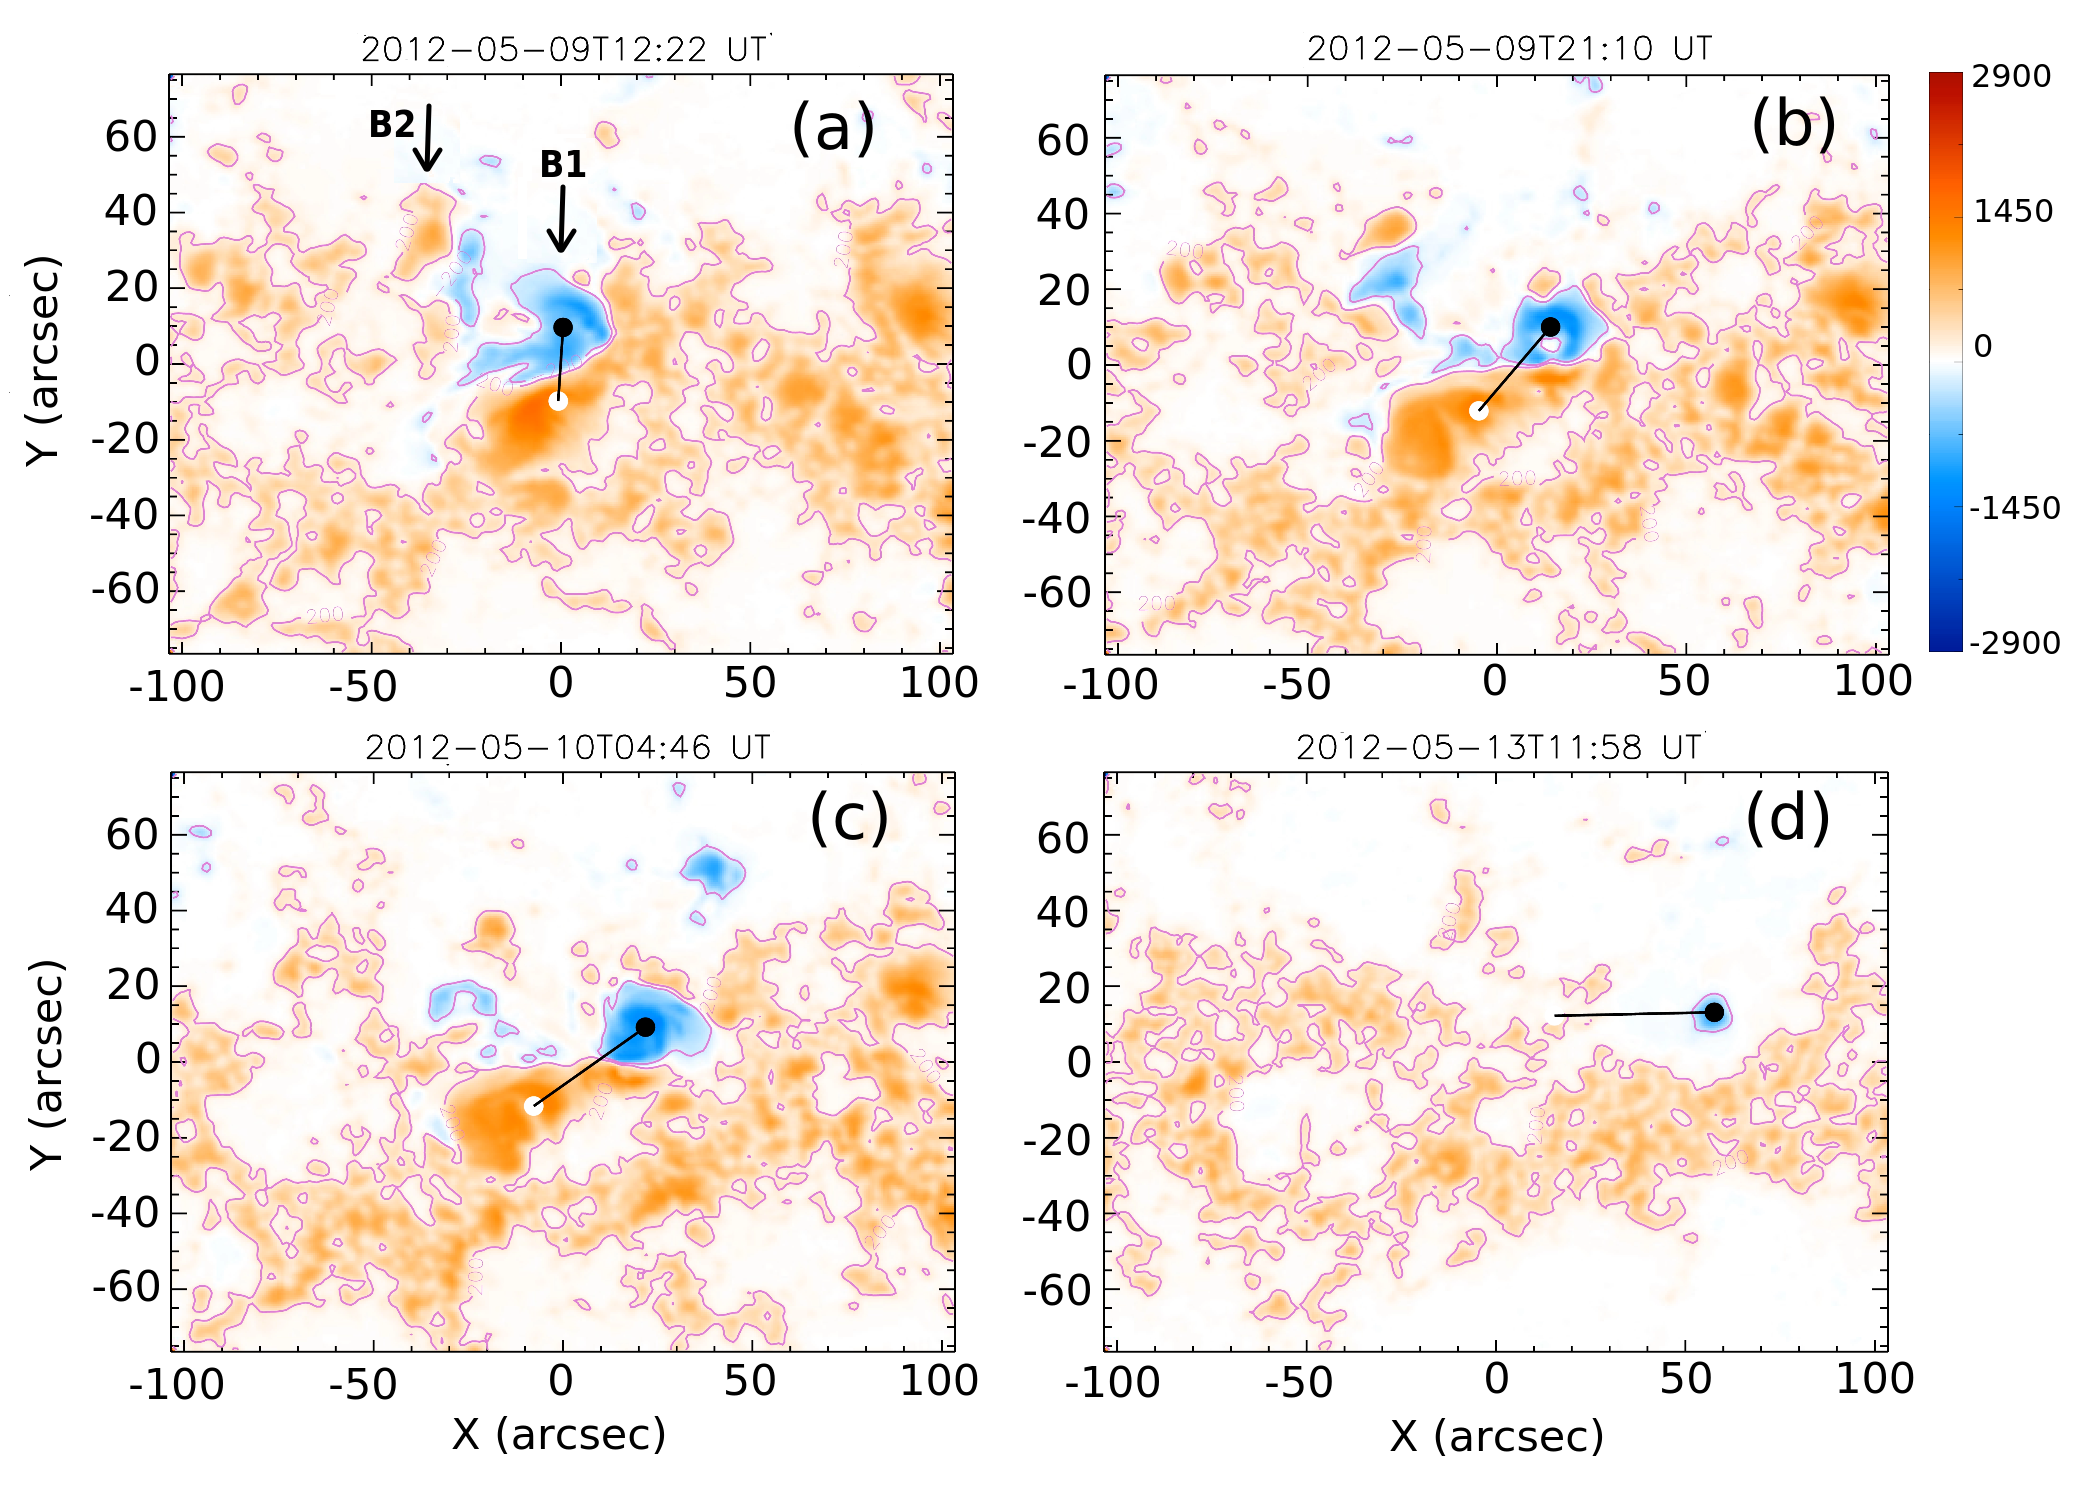
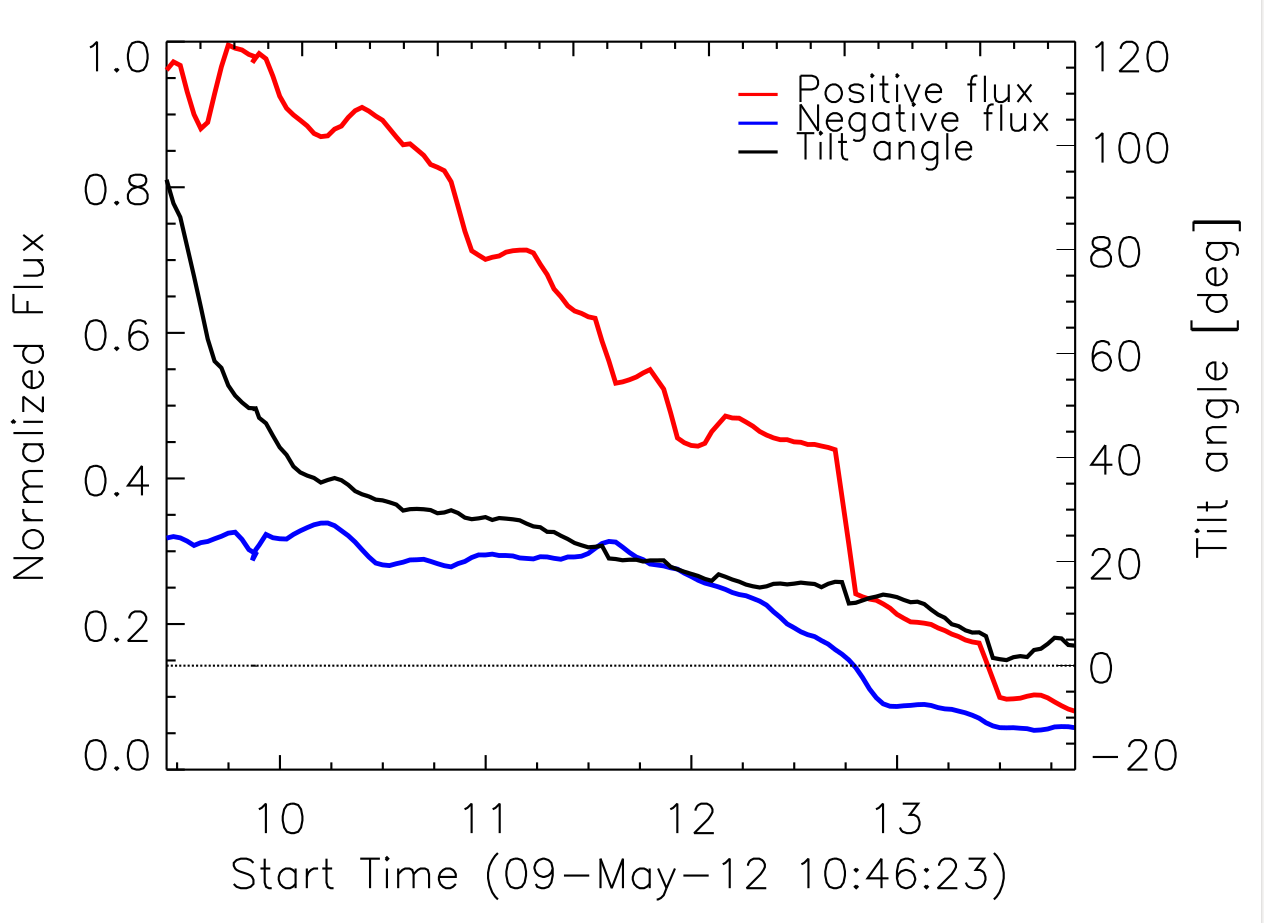
The bipoles, B1 and B2 were seen rotating clockwise. B1 rotated by 180∘ from 8 May at 00:00 UT to 10 May at 22:00 UT, while B2 rotated by 100∘ from the same starting time until 10:00 UT on 10 May. The rotation of each bipole is characterized by the rotation of their tilt angle, which is determined following the method developed by Poisson et al. (2015). We include a movie showing the bipole rotations (bipole-rotation.mov) as supplementary material. The bipole rotations imply the injection of magnetic helicity and consequently the accumulation of free magnetic energy; this evolution might contribute to the destabilization and eruption of the mini-filament during all the observed flares as proposed by Wyper et al. (2017, 2018). Furthermore, as we measured the bipole rotations, we also computed their magnetic flux. We found that the fluxes of B1 and B2 decreased steeply. In the case of B1 its flux mainly cancelled with the surrounding magnetic field, while in the case of B2 it was probably mostly dispersed. As discussed in Section 1, magnetic flux cancellation has been observed associated with surges and jets. Figure 4 depicts the rotation of the tilt angle and the magnetic flux evolution of B1 from 8 May to 10 May. B1 is the largest and main bipole involved in the events studied in this article.
2.3 UV Continuum and EUV Evolution as Seen from Earth
Figures 5 and 7 show AIA 304 images at the times of the first partial mini-filament eruption and accompanying C1.6 flare, and of the M4.1 flare and second partial mini-filament eruption, respectively. An HMI magnetogram contour is overlaid on the images in Figure 5a and Figure 7a as a reference.
As discussed in Section 1, recent observations relate jets to the eruption of mini-filaments, which are smaller versions of normal large-scale filaments. In the events analyzed in this article we find evidence of the partial eruption of a curved mini-filament that extends all along the PIL of B1. This mini-filament is observed to erupt and reform several times from 8 May to 10 May. We infer that the continuous rotation and flux cancellation of B1 along these days contribute to the mini-filament reformation and destabilization. We include as supplementary material a movie with high temporal resolution (5 images per minute) in AIA 304 showing both flares and mini-filament eruptions (aia304.mp4). In the movie a jet is also observed at the east of the AR (right at the left border of the images) occurring around 20:45 UT. This event is unrelated to those studied here as it occurred away from the bipole areas where the mini-filament eruptions and flares took place. A flare associated to this jet is identified in Figure 1 with a red arrow (no label) between the C1.6 and M4.1 flares.
Figure 5 illustrates the initiation and evolution of the first event. High resolution imagers, like SDO/AIA, allow us to clearly observe a curved dark structure with one section oriented in the NE–SW direction (henceforth, the northern section) and another oriented in the NW-SE direction (henceforth, the southern section, see also Figure 6b). These two sections have been pointed with black arrows in Figure 5b. Figure 5c shows the appearance of two bright kernels (indicated with a white arrow) that we consider to be the footpoints of a short arcade formed as the mini-filament northern section erupts. At the same time, a dense plasma eruption is seen extending towards the W. Figure 5d shows the eruption at its maximum extension reaching a far kernel, indicated with a white arrow, that globally has the same shape as the far kernel observed during the earlier event at 12:23 UT. Another elongated brightening, pointed by a white arrow in Figure 5b and d, is also seen to the W on the main negative AR polarity. The location of the first flare kernels, as well as the place from where the mini-filament eruption initiates, indicates that only the northern section of the mini-filament erupts.
In Figure 6 we show an enlargement of the image in Figure 5a and b. Figure 6a shows the magnetic map as a reference. In this panel we have numbered the main polarities involved in the events studied in this article. Figure 6b corresponds to the AIA 304 image where the shape of the mini-filament before both eruptions can be more clearly seen. For an easier identification of the mini-filament portions we added an inset showing a further enlargement of the bipole area. The north and south portions for the mini-filament are indicated both in Figure 6b and in the inset. Notice the presence of a circular-shape brightening, pointed by a white arrow in Figure 5b (also observable in Figure 6b), that surrounds all the negative and part of the postitive polarity of B1 and all of B2, as happened in the event at 12:23 UT. This circular brightening is present since around 08 May, which strongly suggests that energy release at a very low rate occurred accompanying the rotation of the bipoles plausibly because of their interaction with the overlaying magnetic field.
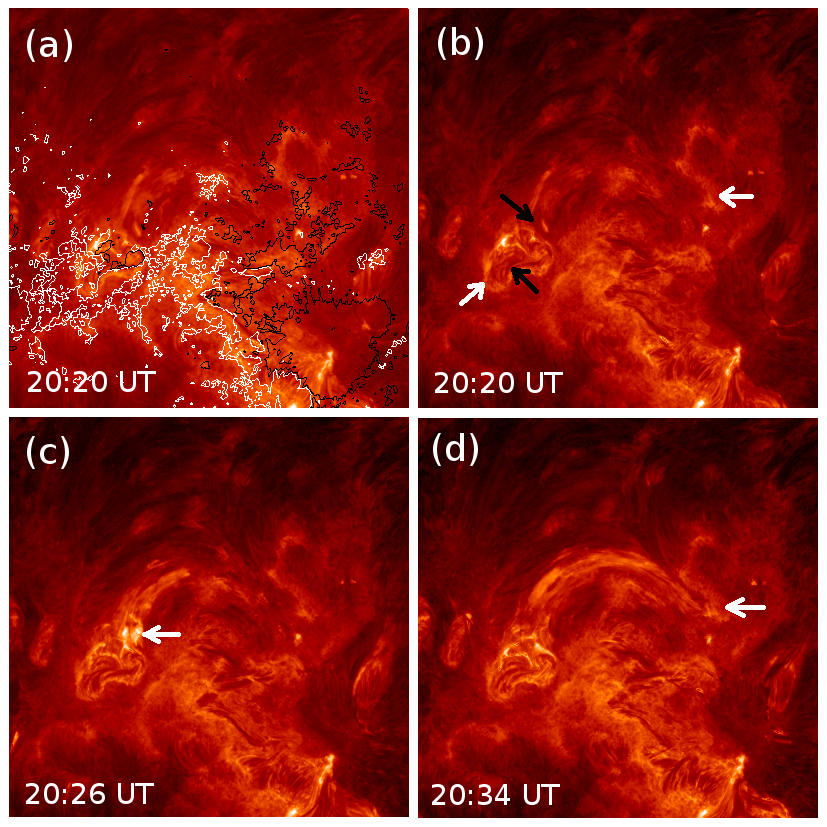
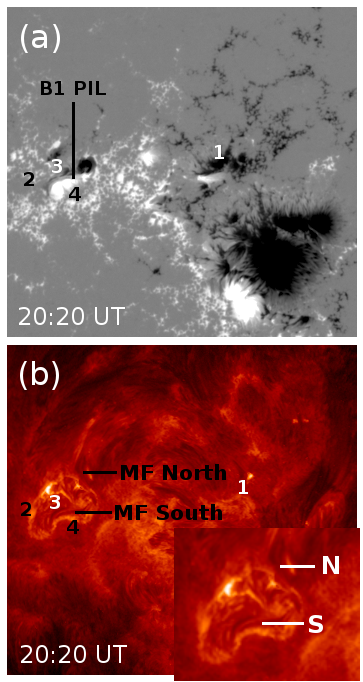
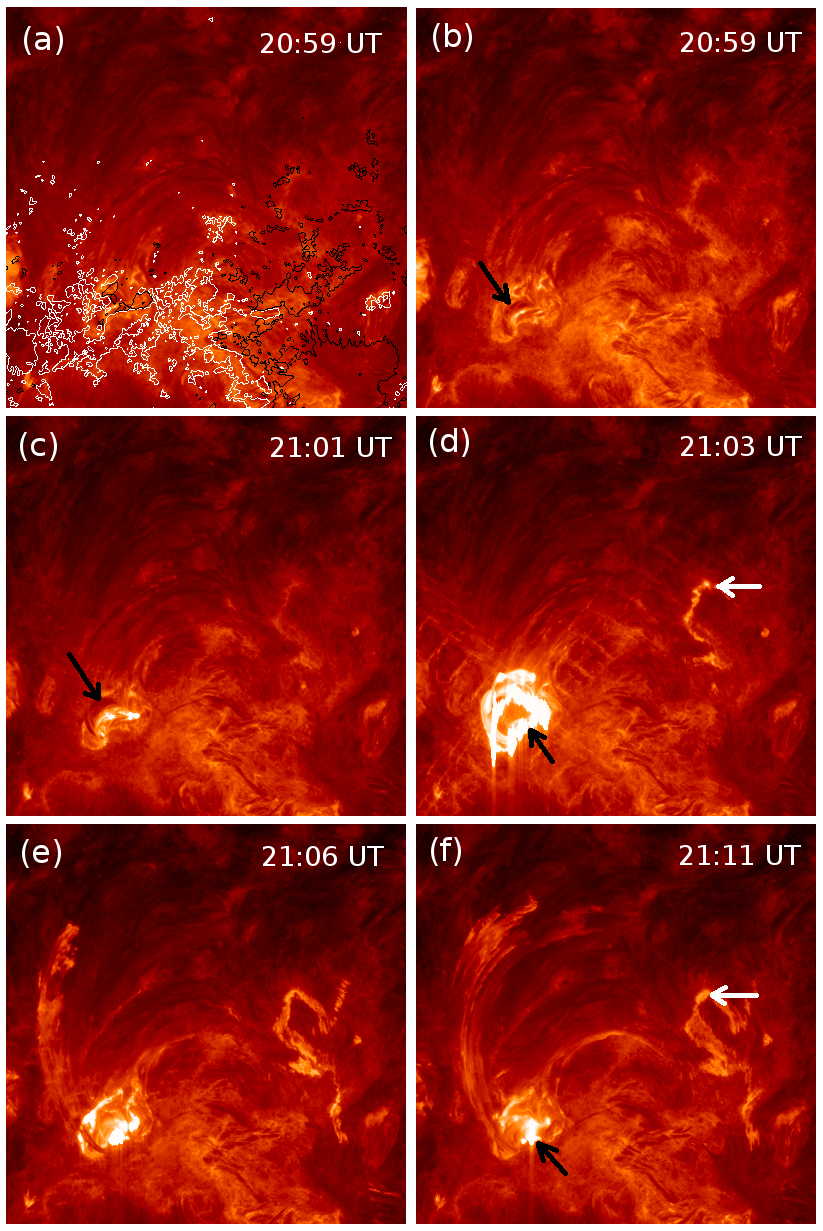
Figure 7 shows the evolution of the second surge and associated M4.1 flare as observed in the AIA 304 band. As in Figure 5, in Figure 7a we include an SDO/HMI contour as a reference to easily identify the location of the main AR polarities and B1 and B2 bipoles. In Figure 7b we indicate with a black arrow the remaining southern portion of the mini-filament, which is seen prominently right before starting to rise. In Figure 7c, the mini-filament is observed already ascending and an incipient brightening is noticeable below it. In Figure 7d, all the area around B1 is seen bright as the peak intensity of the flare happens. The mini-filament material is ejected and it is part of the ascending bright front whose evolution is seen in the following panels (e and f). The full evolution can be followed in the AIA 304 movie accompanying this article as supplementary material (aia304.mp4). Notice also the far brightening located at the AR main negative polarity and indicated with white arrows in Figure 7d and f. As this area brightens consequently with the M4.1 flare development, we infer that it is another kernel of the flare, as we show in the description of Figure 8 in what follows. As observed in Figure 7e and f, and in the accompanying movie, the ejected material travels along magnetic loops connecting the area surrounding the bipoles with this far kernel.
From the observed evolution of the ascending surge front in AIA 304 data we can estimate its velocity in the plane of the sky. By following the vertical motion of the bright front from the original location of the mini-filament to the maximum volumetric extent of the surge we estimate a mean velocity of approximately 280 km s-1. We obtained this velocity by tracking the front along successive images and then computing the slope of the position versus time curve, from the original filament location to the farthest position reached by the surge front. Although this velocity is higher than the 190 km s-1 obtained for the 12:23 UT surge studied by López Fuentes et al. (2018), it is still within the usual values observed in this kind of events (Raouafi et al., 2016).
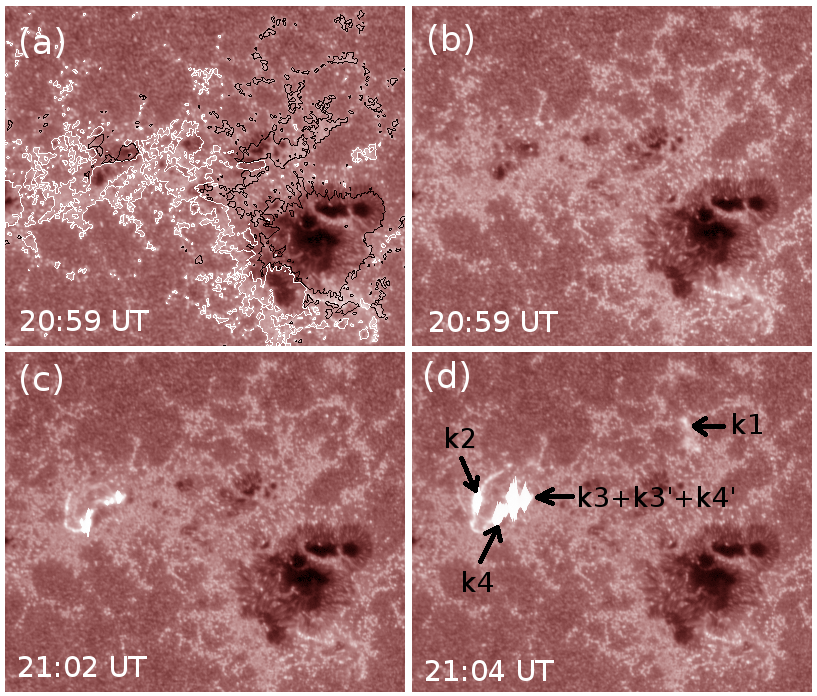
In order to identify the locations of the main M4.1 flare kernels, we analyze AIA 1700 images. The C1.6 flare is not visible in this AIA band. Figure 8 shows a series of images in AIA 1700. In Figure 8b–d the flare kernels and their evolution is clearly seen. In Figure 8d we have labeled the different kernels using the same letters as López Fuentes et al. (2018) used in their analysis of the event at 12:23 UT. The location of the initial emission in this band, as well as its evolution, together with the AIA 304 evolution discussed in the previous paragraph, suggests that it is the southern section of the mini-filament that erupts in association with the M4.1 flare. Notice that the far kernel to where the plasma is observed to flow in AIA 304 during this second mini-filament eruption is barely seen in this band. We include as supplementary material a movie with the highest temporal resolution in AIA 1700 showing the M4.1 flare and the second mini-filament partial eruption (aia1700.mp4); in this movie we can see that some plasma appears flowing up at this temperature range. Notice the bright kernels associated to the jet at the east of the AR (right at the left border of the images) that starts at approximately 20:45 UT. As we mentioned before, this event is unrelated to those studied here.
As mentioned in López Fuentes et al. (2018), several EUV surges can be identified in AIA 304 when examining images in this band in Helioviewer (www.helioviewer.org). All these surges are associated to M-class flares, except the first partial eruption studied in this article at 20:25 UT. The more extended surges are: one on 8 May at 13:05 UT (flare M1.4), another one on 9 May at 12:23 UT (flare M4.7, see López Fuentes et al., 2018), the one analyzed here at 21:01 UT (flare M4.1), and two on 10 May at 04:15 UT (flare M5.7, see Yang and Zhang, 2018) and at 20:25 UT (flare M1.7). All these M-class flares and surges started mainly at the location of the largest rotating bipole (B1) and the plasma was launched along large-scale loops with far footpoints on the negative main AR polarity to the W. This series of events suggests a recurrence of energy storage, mini-filament reformation as proposed by Chandra et al. (2017) (see also the simulations of Wyper et al., 2017, 2018), and energy release processes in a time range between around 8 and 23 hours.
2.4 EUV Evolution as Seen by STEREO-B
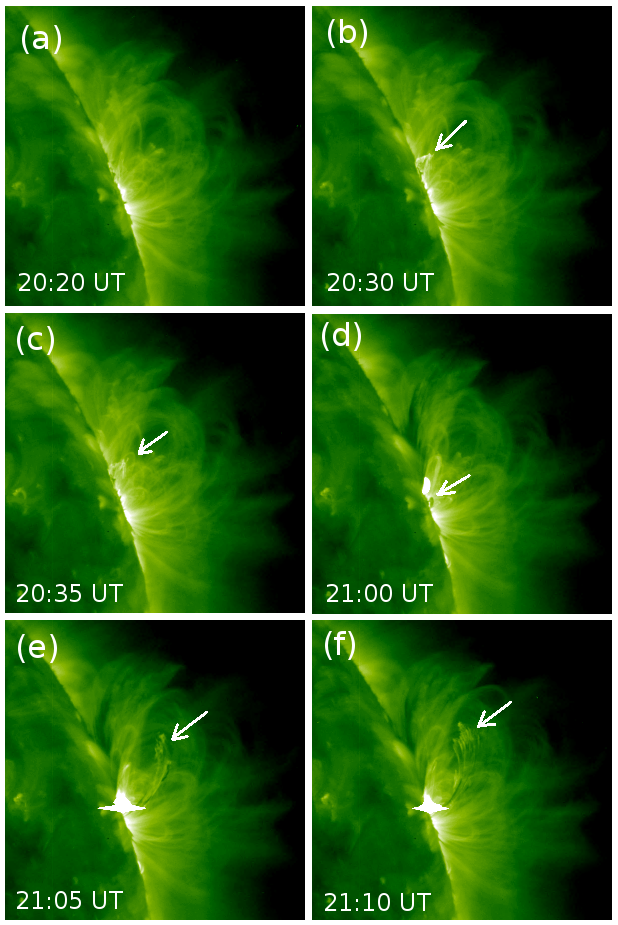
As described in Section 2.1, at the time of the studied events the STEREO probe B was located in an orbital position from which AR 11576 was observable on the solar limb. This provides us the vantage point of a side view to observe the ejections. In Figure 9 we show a series of SECCHI images in the 195Å band (hereafter SECCHI 195) covering both surge evolutions. The cadence of this set of images is 5 min. In Figure 9a we show an image of AR 11576 right before the first event took place (at 20:20 UT). By 20:30 UT (Figure 9b) we identify a bright ascending front, indicated with a white arrow, that coresponds to our first surge. It can be still observed progressing in Figure 9c (20:35 UT), where we identified the highest point of the surge front with a white arrow. Regarding the evolution of the second surge, in Figure 9d (21:00 UT), we point with a white arrow the location of the mini-filament portion associated to this eruption, as observed from STEREO. In Figure 9e and f (21:05 UT and 21:10 UT, respectively), the white arrows indicate the position of the ascending surge front. Notice the bright saturated pixels at the base of the erupting material produced by the associated M4.1 flare. The evolution can be fully observed in the short movie accompanying this article as supplementary material (stereo195.mp4).
Although the cadence of the SECCHI 195 data does not allow a continuous track of the erupted material as in the case of AIA 304, we can still observe the mini-filament just before the ejection begins and the ejected material at a high altitude 5 min later. Therefore, we can make a very rough estimation of the mean velocity of the surge by dividing the observed distance traveled by the material by the time difference between the images in Figure 9d and f. The mean velocity estimated in this way is approximately 300 km s-1, which is consistent with the result obtained from the AIA 304 analysis.
3 Comparing the phenomenology of the confined ejections on 9 May 2012
In this section we compare the confined eruptions of 9 May 2012, which were associated to the M4.7, the C1.6, and M4.1 flares occurring at 12:23, 20:25, and 21:01 UT, respectively, as identified in Figure 1. In López Fuentes et al. (2018) we performed a detailed study of the magnetic field connectivity in the regions where the flare kernels were located and interpreted our observational results in terms of the magnetic field topology of AR 11576. We interpret the observations of the two successive flares and confined eruptions, just discussed, in the context of our previous results in view that the magnetic field configuration has not changed substantially, i.e. the main change is the continuous rotation of B1 and B2.
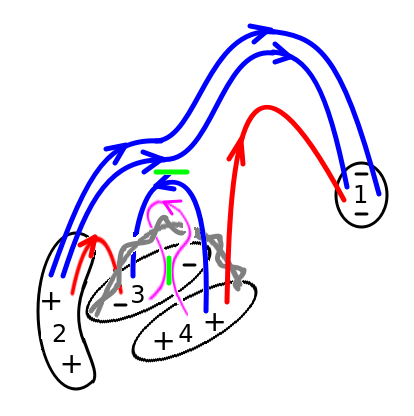
It is clear from Figure 5 that only the northern section of the mini-filament erupts at around 20:25 UT, when two small flare kernels are seen at both sides of the northern section of the PIL of B1. A C1.6 flare accompanies the eruption; this is a faint event compared to the other ones on 9 May, in particular, it is not even classified as a flare in SolarMonitor (https://www.solarmonitor.org/). Based on the magnetic field topology computed in López Fuentes et al. (2018), the evolution seen in the movie that accompanies this article (aia304.mp4), and the different panels in Figure 5, we infer that the continuous rotation of B1 and flux cancellation at its PIL, produces an instability triggering this ejection. When this happens, the mini-filament starts to rise and two reconnection processes set in. Magnetic field lines connecting polarities 3 and 4 (see Figure 6a), at both sides of the PIL, reconnect below the mini-filament, in what is called internal reconnection. Figure 10 shows a 3D sketch of the magnetic field lines connecting the different polarities and the relative position of the mini-filament. The internal reconnection site is identified with a thick green segment below the mini-filament location in Figure 10. This process creates a new set of field lines whose footpoints are located at both sides of the PIL, clearly seen in Figure 5c as the two bright kernels pointed with a white arrow. The other set of reconnected field lines surrounds the mini-filament. Simultaneously, and as the mini-filament rises, the closed field lines above it that still connect 3 and 4 are forced to reconnect with those connecting 2 and 1. This reconnection process is called external and is identified with a thick green segment above the mini-filament location in Figure 10. In this process the mini-filament plasma has access to the large-scale field lines connecting 4 and 1 and we observe the surge flowing towards the southern portion of the far kernel to the W in 1, pointed with a white arrow in Figure 5d. Notice that in this case the loops connecting 4 and 1 are shorter and probably not as high as those in the surge observed associated to the flare at 12:23 UT and the later one at 21:01 UT. Because of the surge and other brightenings, the counterpart kernel in 4 is not evident in AIA images. At the same time we should have seen part of the mini-filament plasma reaching a flare kernel located in 2, in a similar way as happens with the surge at 12:23 UT; however as these events are less energetic than the latter one, this is not visible in the 304 movie. Anyway, a flare kernel is located in 2 at around 20:23 UT and later (see the white arrow to the east in Figure 5c. Summarizing, this fainter flare and confined ejection can be explained in a similar way as the events at 12:23 UT, but in this particular case only the northern portion of the mini-filament is ejected.
As we show in Figure 7 the origin of the events at 21:01 UT was the ejection of the southern portion of the mini-filament on the PIL of bipole B1. In this particular case, the flare and eruption are homologous to the events studied by López Fuentes et al. (2018). In Figure 8b we have labeled the flare kernels as k1, k2, k3 and k3’, and k4 and k4’, using the same notation as in that article. We associate these kernels to the location of the polarity regions labeled as shown in Figure 6a. Kernels k3’and k4’ are located in polarities 3 and 4 and are the result of the internal reconnection process that sets in when the southern portion of the mini-filament destabilizes and starts rising. Kernels k4 and k1, as well as kernels k2 and k3, result from the external reconnection process when the loops above the rising mini-filament and linking polarities 3 and 4 reconnect with the overlying closed field lines connecting 2 and 1 (see Figure 10).
Finally, we notice that, even with the high spatial resolution of AIA images, it is not clear if the mini-filament at the time of the events studied here is formed by two sections and, therefore, we have no clue of why the mini-filament erupts in two sections.
4 Concluding Remarks
We studied a two-step mini-filament eruption in AR NOAA 11576 on 9 May 2012, at 20:25 UT and 21:01 UT. These eruptions were observed as EUV surges in SDO/AIA data and occurred in conjunction with a C1.6 and an M4.1 flares, identified in the GOES soft X-ray emission curve. We studied the evolution of the photospheric magnetic field of the AR, observed in SDO/HMI magnetograms, and related these events to the rotation and flux cancellation of bipolar structures located in the middle of the AR main positive polarity.
By identifying the flare kernels and comparing them with the previous event at 12:23 UT, in Section 3 we propose a phenomenological explanation of both eruptions. This is done in terms of the ejection of two sections of a mini-filament located along the PIL of the largest rotating bipole, magnetic connections between the magnetic polarities of the AR configuration, and reconnection processes between field lines connecting these polarities. The location of flare kernels, the shape of the brightened structures, and the observed evolution suggest that the same magnetic topology found by López Fuentes et al. (2018) is present during the events studied in this article.
Except for the fact that the mini-filament material is ejected through closed magnetic field lines that connect the main polarities of the AR, the studied events resemble the kind of evolution observed and modeled in previous works for jets (see e.g. Sterling et al., 2016; Wyper et al., 2017, 2018, and other references in the Introduction), for which the material is ejected along open magnetic field lines. Our study confirms the role of mini-filaments in the development of jets and surges and contributes to understand the magnetic configurations and evolution associated to this kind of events. In particular, we further confirm the suggestion proposed in previous works (see references in Section 1), that the repeated mini-filament reconstructions and eruptions accompanied by flares, as observed in AR 11576, are sustained by the continuous rotation and flux cancellation of the bipolar structures located in the middle of the AR main positive polarity. Although our study focuses on events of the surge type, in which the ejected material falls back to the coronal base, the similarity of the processes producing the events analyzed here and jet observations (both standard and blow-out) studied elsewhere, suggest the possibility that other typical ejections, such as H sprays (see references in Section 1), might be produced by similar mechanisms. This possibility would need to be addressed in future high resolution studies of solar ejective phenomena.
Acknowledgements
The authors thank the anonymous reviewers for useful comments and suggestions. MLF, CHM and GC are members of the Carrera del Investigador Científico of the Consejo Nacional de Investigaciones Científicas y Técnicas (CONICET) of Argentina. MP is a CONICET Fellow. MP, MLF, GC and CHM acknowledge financial support from the Argentinean grant PICT 2012-0973 (ANPCyT).
References
- Adams et al. (2014) Adams, M., Sterling, A. C., Moore, R. L., Gary, G. A., Mar. 2014. A Small-scale Eruption Leading to a Blowout Macrospicule Jet in an On-disk Coronal Hole. Astrophys. J. 783, 11.
- Canfield et al. (1996) Canfield, R. C., Reardon, K. P., Leka, K. D., Shibata, K., Yokoyama, T., Shimojo, M., Jun. 1996. H alpha Surges and X-Ray Jets in AR 7260. Astrophys. J. 464, 1016–1029.
- Chandra et al. (2017) Chandra, R., Mandrini, C. H., Schmieder, B., Joshi, B., Cristiani, G. D., Cremades, H., Pariat, E., Nuevo, F. A., Srivastava, A. K., Uddin, W., Feb. 2017. Blowout jets and impulsive eruptive flares in a bald-patch topology. Astron. Astrophys. 598, A41.
- Chandra et al. (2010) Chandra, R., Pariat, E., Schmieder, B., Mandrini, C. H., Uddin, W., Jan. 2010. How Can a Negative Magnetic Helicity Active Region Generate a Positive Helicity Magnetic Cloud? Solar Phys. 261, 127–148.
- Cheng et al. (2018) Cheng, X., Kliem, B., Ding, M. D., Mar 2018. Unambiguous Evidence of Filament Splitting-induced Partial Eruptions. Astrophys. J. 856, 48.
- Foukal (2004) Foukal, P. V., 2004. Solar Astrophysics, 2nd, Revised Edition.
- Golub et al. (2007) Golub, L., Deluca, E., Austin, G., Bookbinder, J., Caldwell, D., Cheimets, P., et al., Jun. 2007. The X-Ray Telescope (XRT) for the Hinode Mission. Solar Phys. 243, 63–86.
- Howard et al. (2008) Howard, R. A., Moses, J. D., Vourlidas, A., Newmark, J. S., Socker, D. G., Plunkett, S. P., et al., Apr. 2008. Sun Earth Connection Coronal and Heliospheric Investigation (SECCHI). Space Sci. Rev. 136, 67–115.
- Joshi et al. (2018) Joshi, N. C., Nishizuka, N., Filippov, B., Magara, T., Tlatov, A. G., May 2018. Flux rope breaking and formation of a rotating blowout jet. Mon. Not. Roy. Astron. Soc. 476, 1286–1298.
- Karpen et al. (2012) Karpen, J. T., Antiochos, S. K., DeVore, C. R., Nov. 2012. The Mechanisms for the Onset and Explosive Eruption of Coronal Mass Ejections and Eruptive Flares. Astrophys. J. 760, 81.
- Lemen et al. (2012) Lemen, J. R., Title, A. M., Akin, D. J., Boerner, P. F., Chou, C., Drake, J. F., et al., Jan. 2012. The Atmospheric Imaging Assembly (AIA) on the Solar Dynamics Observatory (SDO). Solar Phys. 275, 17–40.
- López Fuentes et al. (2018) López Fuentes, M., Mandrini, C. H., Poisson, M., Démoulin, P., Cristiani, G., López, F. M., Luoni, M. L., Dec. 2018. Physical Processes Involved in the EUV “Surge” Event of 9 May 2012. Solar Phys. 293, 166.
-
López Fuentes et al. (2015)
López Fuentes, M. C., Poisson, M., Mandrini, C. H., Luoni, M. L.,
Cristiani, G. D., Démoulin, P., Sep. 2015. Análisis de un evento
eyectivo en una arcada cerrada (Analysis of an ejective event in a closed
magnetic arcade). In: Abstract in CRAAA. Vol. 58. p. 37.
URL http://www.astronomiaargentina.org.ar/uploads/docs/craaa58.pdf - Moore et al. (2018) Moore, R. L., Sterling, A. C., Panesar, N. K., May 2018. Onset of the Magnetic Explosion in Solar Polar Coronal X-Ray Jets. Astrophys. J. 859, 3.
- Panesar et al. (2017) Panesar, N. K., Sterling, A. C., Moore, R. L., Aug 2017. Magnetic Flux Cancellation as the Origin of Solar Quiet-region Pre-jet Minifilaments. Astrophys. J. 844, 131.
- Panesar et al. (2016) Panesar, N. K., Sterling, A. C., Moore, R. L., Chakrapani, P., Nov. 2016. Magnetic Flux Cancelation as the Trigger of Solar Quiet-region Coronal Jets. Astrophys. J. Lett. 832, L7.
- Poisson et al. (2015) Poisson, M., Mandrini, C. H., Démoulin, P., López Fuentes, M., Mar. 2015. Evidence of Twisted Flux-Tube Emergence in Active Regions. Solar Phys. 290, 727–751.
- Raouafi et al. (2016) Raouafi, N. E., Patsourakos, S., Pariat, E., Young, P. R., Sterling, A. C., Savcheva, A., Shimojo, M., Moreno-Insertis, F., DeVore, C. R., Archontis, V., Török, T., Mason, H., Curdt, W., Meyer, K., Dalmasse, K., Matsui, Y., Nov. 2016. Solar Coronal Jets: Observations, Theory, and Modeling. Space Sci. Rev. 201, 1–53.
- Scherrer et al. (2012) Scherrer, P. H., Schou, J., Bush, R. I., Kosovichev, A. G., Bogart, R. S., Hoeksema, J. T., et al., Jan. 2012. The Helioseismic and Magnetic Imager (HMI) Investigation for the Solar Dynamics Observatory (SDO). Solar Phys. 275, 207–227.
- Schmieder et al. (1996) Schmieder, B., Mein, N., Shibata, K., van Driel-Gesztelyi, L., Kurokawa, H., Jan 1996. Chromospheric ejections and their signatures in X-ray observed by YOHKOH. Advances in Space Research 17 (4-5), 193–196.
- Shen et al. (2012) Shen, Y., Liu, Y., Su, J., Deng, Y., Feb. 2012. On a Coronal Blowout Jet: The First Observation of a Simultaneously Produced Bubble-like CME and a Jet-like CME in a Solar Event. Astrophys. J. 745, 164.
- Sterling et al. (2015) Sterling, A. C., Moore, R. L., Falconer, D. A., Adams, M., Jul. 2015. Small-scale filament eruptions as the driver of X-ray jets in solar coronal holes. Nature 523, 437–440.
- Sterling et al. (2016) Sterling, A. C., Moore, R. L., Falconer, D. A., Panesar, N. K., Akiyama, S., Yashiro, S., Gopalswamy, N., Apr. 2016. Minifilament Eruptions that Drive Coronal Jets in a Solar Active Region. Astrophys. J. 821, 100.
- Tripathi et al. (2006) Tripathi, D., Isobe, H., Mason, H. E., Jul 2006. On the propagation of brightening after filament/prominence eruptions, as seen by SoHO-EIT. Astron. Astrophys. 453, 1111–1116.
- Webb and Howard (2012) Webb, D. F., Howard, T. A., Jun. 2012. Coronal Mass Ejections: Observations. Living Reviews in Solar Physics 9, 3.
- Webb and Jackson (1981) Webb, D. F., Jackson, B. V., Oct 1981. Kinematical Analysis of Flare Spray Ejecta Observed in the Corona. Solar Phys. 73 (2), 341–361.
- Wyper et al. (2017) Wyper, P. F., Antiochos, S. K., DeVore, C. R., Apr. 2017. A universal model for solar eruptions. Nature 544, 452–455.
- Wyper et al. (2018) Wyper, P. F., DeVore, C. R., Antiochos, S. K., Jan. 2018. A Breakout Model for Solar Coronal Jets with Filaments. Astrophys. J. 852, 98.
- Yang and Zhang (2018) Yang, S., Zhang, J., Jun. 2018. Mini-filament Eruptions Triggering Confined Solar Flares Observed by ONSET and SDO. Astrophys. J. Lett. 860, L25.
- Zuccarello et al. (2009) Zuccarello, F., Romano, P., Farnik, F., Karlicky, M., Contarino, L., Battiato, V., Guglielmino, S. L., Comparato, M., Ugarte-Urra, I., Jan 2009. The X17.2 flare occurred in NOAA 10486: an example of filament destabilization caused by a domino effect. Astron. Astrophys. 493, 629–637.