Achieving the depairing limit along axis in Fe1+yTe1-xSex single crystals
Abstract
We report the achieving of depairing current limit along -axis in Fe1+yTe1-xSex single crystals. A series of crystals with ranging from 8.6 K to 13.7 K (different amount of excess Fe, ) were fabricated into -axis bridges with a square-micrometer cross-section. The critical current density, , was directly estimated from the transport current-voltage measurements. The transport reaches a very large value, which is about one order of magnitude larger than the depinning , but comparable to the calculated depairing 2 106 A/cm2 at 0 K, based on the Ginzburg-Landau (GL) theory. The temperature dependence of the depairing follows the GL-theory ( (1-)3/2) down to 0.83 , then increases with a reduced slope at low temperatures, which can be qualitatively described by the Kupriyanov-Lukichev theory. Our study provides a new route to understand the behavior of depairing in iron-based superconductors in a wide temperature range.
I introduction
Iron chalcogenide superconductors have attracted much attention because of the discovery of high temperature superconductivity. Although the superconducting (Sc) transition temperature, , in FeSe is only 9 K Hsu et al. (2008), it can be easily enhanced to 14 K by Te substitution Sales et al. (2009), up to 37 K under pressure Medvedev et al. (2009), and over 40 K by intercalating spacer layers Burrard-Lucas et al. (2013). More interestingly, the monolayer of FeSe grown on SrTiO3 shows a large 65 K He et al. (2013). Fe1+yTe1-xSex is unique in their structural simplicity, consisting of only FeTe/Se layers, which is favorable for probing the superconducting mechanism. Recently, a topological surface superconductivity Zhang et al. (2018, 2019), and the possible Majorana bound state have been observed Wang et al. (2018); Machida et al. (2019), which make Fe1+yTe1-xSex the first high temperature topological superconductor. On the other hand, its high upper critical field ( 50 Tesla) and less toxic nature compared with iron pnictides suggest that Fe1+yTe1-xSex are also favorable to applications. Until now, the superconducting tapes with the transport critical current density, , over 106 A/cm2 under self-field and over 105 A/cm2 under 30 T at 4.2 K have already been fabricated Si et al. (2013).
The transport determined by the depairing process of Cooper pairs, called depairing , is crucial for the study of the superconducting mechanism, because it directly provides information on the critical velocity of superfluids, and the magnitude as well as the symmetry of the SC gap Tinkham (1996). The depairing process occurs when the kinetic energy of the supercurrent exceeds the condensation energy ( SC gap) Tinkham (1996); Dew-Hughes (2001). However, it is difficult to be achieved, since the vortex flow occurs preceding the depairing at much smaller current density. The critical current density determined by the vortex flow, which occurs when the Lorentz force exceeds the pinning force of vortex, is usually called depinning Dew-Hughes (2001); Blatter et al. (1994). The depinning obtained from the magnetic hysteresis loops (MHLs) by using the Bean model Bean (1964) is mainly determined by the defects, disorders, and the geometry of the samples Blatter et al. (1994). On the other hand, can be also obtained from the direct transport measurements on thin films de Vries et al. (1989); Hänisch et al. (2019). The small thickness of thin films allows us to reach the critical limit by applying not so large current. However, single-crystalline thin films without weak links are hard to fabricate due to the presence of grain boundaries and twin boundaries from the growth technique Hilgenkamp and Mannhart (2002); Durrell et al. (2011).
To achieve the depairing , direct transport current-voltage (-) measurement on a single crystal is required. However, it is very difficult for bulk samples to achieve this limit since the extremely large current is needed. To solve this problem, micro-fabrication technique is used to reduce the size of the crystal to micrometer or sub-micrometer scale. Fiory et al. (1978); Skocpol (1976); Xu et al. (2010); Romijn et al. (1982); Yang and Lieber (1996); Rusanov et al. (2004); Cirillo et al. (2007); Moll et al. (2010); Nawaz et al. (2013); Liang et al. (2013); Li et al. (2013). Until now, studies on the depairing have been mainly performed on low- superconductors, especially at low temperatures Fiory et al. (1978); Skocpol (1976); Xu et al. (2010); Romijn et al. (1982); Rusanov et al. (2004); Cirillo et al. (2007); Kunchur (2004). For iron-based superconductors (IBSs), the depairing has been probed on the micro-fabricated Ba1-xKxFe2As2 single crystal with current flowing in the -plane Li et al. (2013). Nonetheless, it was only performed at the temperatures close to due to the extremely large in-plane depairing . The depairing for Ba1-xKxFe2As2 is found to follow the prediction of the GL-theory at temperatures close to Li et al. (2013). However, the behavior of the depairing at low temperatures for IBSs still remains unknown.
| (0) (m) | (0) (m) | (0) (nm) | (0) (nm) | () (A/cm2) | () (A/cm2) | |
| FeTe1-xSex | 0.49 Bendele et al. (2010) | 1.32 Bendele et al. (2010) | 2.8 Lei et al. (2010) | 3 Lei et al. (2010) | 1.5 107 | 2.0 106 |
| FeSe | 0.45 Kasahara et al. (2014) | 1.1 Cao et al. (2019) | 4.3 Lei et al. (2011) | 2.9 Vedeneev et al. (2013) | 1.2 107 | 2.9 106 |
| NdFeAsO1-xFx | 0.2 Prozorov et al. (2009) | 3.7 Prozorov et al. (2009) | 2.3 Jia et al. (2008) | 0.26 Jia et al. (2008) | 1.1 108 | 2.8 106 |
| Ba1-xKxFe2As2 | 0.25 Prozorov et al. (2009) | 1.8 Prozorov et al. (2009) | 2.2 Yuan et al. (2009) | 2.2 Yuan et al. (2009) | 7.4 107 | 1.4 106 |
| Ba(Fe1-xCox)2As2 | 0.2 Prozorov and Kogan (2011) | 1.0 Prozorov and Kogan (2011) | 2.4 Yamamoto et al. (2009) | 1.2 Yamamoto et al. (2009) | 1.1 108 | 8.4 106 |
| BaFe2(As1-xPx)2 | 0.2 Hashimoto et al. (2012) | - | 3.2 Chong et al. (2010) | 1.3 Chong et al. (2010) | 7.9 107 | - |
| KxFe2Se2 | 0.29 Torchetti et al. (2011) | - | 2.3 Mun et al. (2011) | 1.42.3 Mun et al. (2011) | 5.2 107 | - |
| LiFeAs | 0.21 Inosov et al. (2010) | - | 4.8 Zhang et al. (2011) | 1.7 Zhang et al. (2011) | 4.8 107 | - |
To reveal the behavior of the depairing at lower temperatures, we turn eyes on the along -axis. As summarized in Table \Romannum1, the theoretical depairing along -axis for IBSs is about one order smaller than that in the -plane due to the larger penetration depth , which is advantageous for achieving the depairing limit. Until now, the along -axis in micro-fabricated single crystals has already been studied in IBSs (V2Sr4O6)Fe2As2 and Sm/PrFeAs(O,F). However, the depairing limit is not achieved because of the possible formation of intrinsic Josephson junctions Moll et al. (2014, 2010); Kashiwaya et al. (2010). In this study, we focus on the Fe1+yTe1-xSex single crystals, whose depinning for both and are typically 3 105 A/cm2 at 2 K Sun et al. (2013a, 2015). When the current is flowing in the -plane, the depairing is estimated as 1.5 107 A/cm2 (see Table \Romannum1). On the other hand, when the current is flowing along -axis, the depairing is estimated as 2.0 106 A/cm2 (see Table \Romannum1), which is more suitable for probing the depairing at low temperatures.
In this report, we successfully achieve the depairing limit in Fe1+yTe1-xSex single crystals by fabricating narrow bridges along -axis. The obtained transport is about one order of magnitude larger than the depinning , indicating the obtained is the depairing . Besides, the temperature dependence of the depairing is studied down to 0.3 , which can be qualitatively described by the Kupriyanov-Lukichev (KL) theory.
II experiment
Fe1+yTe1-xSex ( = 0.2, 0.3, and 0.4) single crystals were grown by slow cooling method Noji et al. (2010); Sun et al. (2013b). All the crystals show plate-like morphology, and can grow up to the size of centimeter. Only the (00) peaks are observed in the single crystal x-ray diffraction, suggesting that the crystallographic -axis is perfectly perpendicular to the plane of the single crystal Sun et al. (2016). Crystal composition is evaluated by the inductively-coupled plasma (ICP) atomic emission spectroscopy, which confirms that the actual Se-doping level is very close to the nominal one Noji et al. (2010); Sun et al. (2016). On the other hand, the as-grown crystals usually contain some amount of excess Fe (represented by , 0.14 in the Fe1+yTe0.6Se0.4 single crystal Sun et al. (2014a)) residing in the interstitial sites of the Te/Se layer. The excess Fe was removed and its amount was tuned by both the post annealing and electrochemical reaction method, as reported in our previous publications Sun et al. (2014a); Okada et al. (2018). Together with the removing of excess Fe, is found to be spontaneously increased Sun et al. (2014a, b). In the fully-annealed crystals, the excess Fe was totally removed as been confirmed by the scanning tunneling microscopy (STM) measurements Machida et al. (2019); Sun et al. (2014a). By these methods, a series of single crystals with different , i.e. different amount of excess Fe, were prepared. More details about the crystal, excess Fe, and the basic properties can be seen in a recent review paper Sun et al. (2019).
| (K) | (m) | (m) | (m) |
|---|---|---|---|
| 8.6 | 2.0 | 1.1 | 4.7 |
| 8.8 | 2.0 | 1.1 | 4.7 |
| 9.3 | 1.4 | 1.3 | 3.9 |
| 9.5 | 1.4 | 1.0 | 5.1 |
| 10.9 | 0.8 | 1.2 | 4.3 |
| 11.9 | 1.7 | 1.5 | 3.4 |
| 12.8 | 1.4 | 0.9 | 5.7 |
| 13.7 | 3.4 | 1.0 | 5.1 |
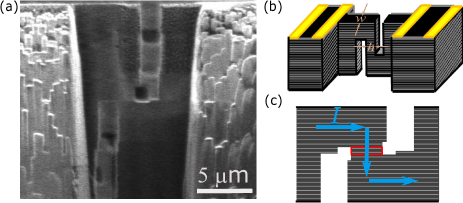
The -axis bridge, as shown schematically in Fig. 1(b), was fabricated by using the focused ion beam (FIB) technique Kakehi et al. (2016); Kakizaki et al. (2017); Ayukawa et al. (2014). The single crystal was first cleaved into a slice with a thickness smaller than 10 m, and fixed on a sapphire substrate. Then the central part of the crystal was necked down to a length of 5 10 m and a width of 1 m from the top by FIB. The necked part was further fabricated into two separated slits with a typical overlap of 100 200 nm, which will enforce the current to flow along -axis in the bridge region as marked by the rectangular frame in Fig. 1(c). With such a structure, the critical current density of the device is determined by the -axis bridge since the other parts of the crystal have much larger cross area. The scanning ion microscopy image of a typical -axis bridge structure is shown in Fig. 1(a). The cross-section areas ( ) of the bridges together with the value of are listed in Table \Romannum2.
Resistance measurements were performed by a standard four-probe method. The - measurements were performed below by applying two kinds of pulse currents to the -axis bridge. In the first method, the bias current was linearly swept up and down through a standard resistance (1 k) by using an arbitrary-waveform generator (Agilent 33220A). The width of such a ramped current pulse is 5 ms, and the repetition period is 143 ms. In the second method, the pulse current was applied by using a Keithley Delta Pulse System. Rectangular 100 s current pulses were passed through the sample at 3 s intervals (duty ratio 3.3 10-5) to avoid heating effect. The voltage drop across the bridge was integrated for 55 s. To avoid damage to the -axis bridge, the pulse current was stopped when the voltage reaches the threshold value of 30 V.
Here, we point out that the resistance measurements probe the region intervening between the two voltage contacts on the crystal, where the narrow bridge and other crystalline parts are included. On the other hand, the - measurements performed below probe only the part of micro-fabricated narrow bridge. Thus, the effects of sample inhomogeneity in the resistance measurements should be carefully distinguished with those in the - measurements, as will be discussed in the next section.
III results and discussion
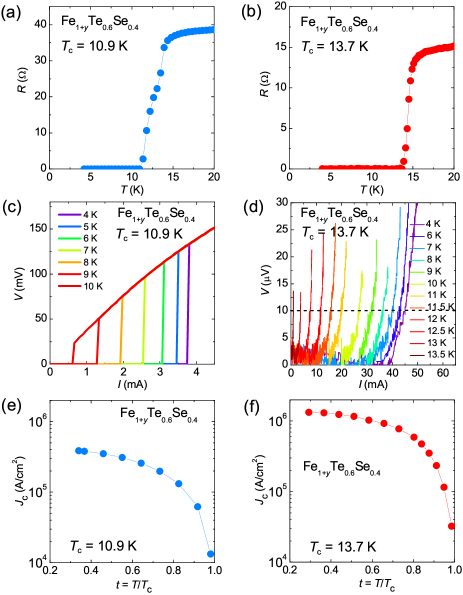
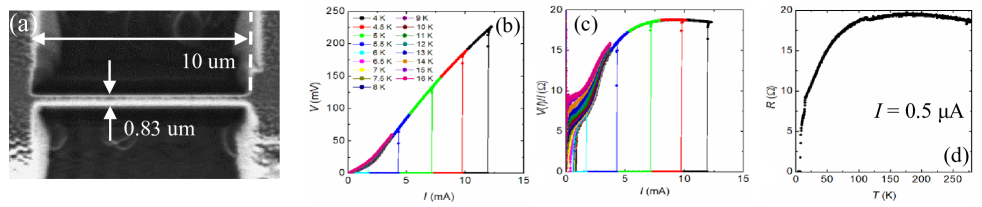
Figures 2(a) and 2(b) show the temperature dependence of the resistance for two typical micro-fabricated crystals with = 10.9 K and 13.7 K, respectively. The value of is determined by the zero resistance. According to our previous studies, the increase of is due to the reduction of excess Fe Sun et al. (2014a); Okada et al. (2018). The well-annealed crystal without excess Fe (e.g. the crystal with = 13.7 K) shows a sharp SC transition width as shown in Fig. 2(b), while the crystals with some amount of left excess Fe show slightly broader transition (e.g. the crystal with = 10.9 K shown in Fig. 2(a)). This transition suggests the slight inhomogeneity, which is derived from the residual excess Fe or the small damage due to the FIB fabrication in the narrow bridge Moll (2018); Kakizaki et al. (2017). However, as described in detail below, such a broad transition does not affect the determination of the transport in the - measurements performed below .
The - curves for the two samples measured at different temperatures are presented in Figs. 2(c) and 2(d). The - characteristics in Fig. 2(c) were measured by using the first method. The critical current, , was simply determined by the current where the voltage abruptly jumps from zero to a finite value. When the current sweeps up and down, hysteresis loops in the - characteristics are observed, which are due to the Joule heating effect (see Supplemental Material sup ). Such heating effects only occur when the applied current exceeds the critical current, which will not affect the determination of . To minimize the degradation of by repeating the relatively large pulse current, the - characteristics in Fig. 2(d) was measured by using the second method. A criterion of 10 V (indicated as the dashed line in Fig. 2(d)) was used to define the critical current. In both methods, we emphasize that the is determined by the SC current passing through a minimum cross-sectional area, , of the bridge in the zero-resistance state below , since the SC current flows avoiding the non-SC region in the bridge. Thus, the SC transition region showing a finite resistance above is clearly out of the scope of the measurements performed below . Furthermore, although the effective value of can be changed by the secondary SC transiton of the non-SC region in the bridge, we confirmed that the effective for both samples was independent of temperature below , based on the following two facts. One is the smooth increase of given by shown in Figs. 2(e) and 2(f). The other is the excellent agreement between the scaled for both crystals with = 10.9 K and 13.7 K (see Fig. 3). Thus, we conclude that the broader SC transition observed in Fig. 2(a) has no influence on the behavior of .
As shown in Figs. 2(e) and 2(f), the values of are obviously enhanced with the increase of . In the crystal with = 13.7 K (see Fig. 2(f)), reaches a very large value 1.3 106 A/cm2 at 4 K. This value of the transport is about one order of magnitude larger than the depinning ( 1.3 105 A/cm2 at 4 K), which has been estimated from the MHLs for both and Sun et al. (2013a, 2015). On the other hand, the depairing along -axis given in the GL-theory by is estimated as 2106 A/cm2 using the coherence length (0 K) 3.0 nm Lei et al. (2010), and penetration depth (0 K) 1.32 m Bendele et al. (2010). The calculated (0 K) is comparable to our experimental value 1.3106 A/cm2 at 4 K.
In general, the critical current density at zero applied magnetic field is determined by the edge barrier for current-induced vortices, which prevents the vortex from entering the bridge. The edge barrier decreases with increasing the applied current, and will be completely suppressed when the current density approaching the critical limit, where the vortex begins to enter the bridge Tinkham (1996). Theoretically, the depairing current density can be obtained when the transverse dimension of the bridge is made small compared to both the coherence length and the penetration depth Tinkham (1996). In high- superconductors, the condition is hard to be fulfilled since their coherence length is too small, typically several nanometers. In practice, the depairing limit can be achieved if the current is homogeneously distributed in the bridge Tinkham (1996); Nawaz et al. (2013). However, the supercurrent tends to pile up at the edges of the bridge because the magnetic flux density is the largest there as the flux lines circle the bridge Skocpol (1976); Tinkham (1996). This effect makes the current density nonuniform. In this case, the vortex begins to enter the bridge from edges when the averaged current density is still much smaller than the depairing limit. In other words, the obtained is much smaller than the depairing .
This effect has been overcome when the width of the bridge () is reduced to the Pearl length = 2, where is the penetration depth and is the thickness of the bridge Clem and Berggren (2011). In this case, the current density is uniformly distributed in the bridge, and the depairing limit can be achieved. Such a method has been successfully applied to achieve the depairing limit in the YBa2Cu3O7-δ and Ba0.5K0.5Fe2As2 Nawaz et al. (2013); Li et al. (2013). In the present study, the size and the calculated Pearl length for the -axis bridges are listed in Table \Romannum2 (To directly compare with the experiments which are down to 4 K, the penetration depth at 5 K rather than 0 K is used for calculation.). The width () of the bridge is smaller than the Pearl length , and comparable to the for all the fabricated -axis bridges, which guarantees the uniform current density. Thus, the large transport observed in the -axis bridge of Fe1+yTe1-xSex single crystal is attributed to the depairing current limit. In the following paragraphs, we use to express the depairing current density.
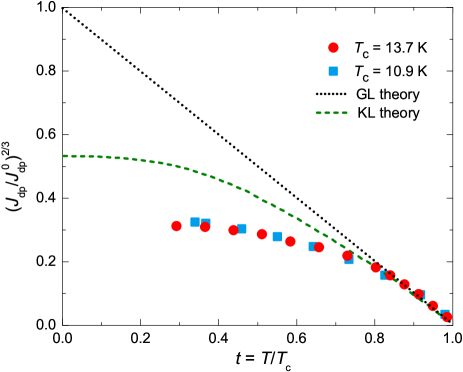
In the GL theory, close to can be described as a function of the reduced temperature = / by the formula ()=(0)(1-)3/2 Tinkham (1996). To compare our experimental data with the theory, we fit the linear behavior of close to , and extrapolate it to = 0 to extract as used in the previous reports Rusanov et al. (2004); Cirillo et al. (2007). The reduced temperature dependences of the normalized depairing current density (/)2/3 are shown in Fig. 3, together with the theoretical results from the GL-theory (dotted line) and KL-theory (dashed line) Kupriyanov and Lukichev (1980). We find that (/)2/3 for the crystal of 10.9 K falls onto an identical curve for the crystal of 13.9 K, confirming that is homogeneous in the bridge part in spite of the broader resistive transition. The experimental data follows the GL-behavior, which increases linearly with decreasing down to 0.83 . Then, (/)2/3 gradually deviates from the GL-behavior with a reducing slope at lower . Such saturation behavior was similar to those observed in low temperature superconductors Skocpol (1976); Romijn et al. (1982); Rusanov et al. (2004); Cirillo et al. (2007), and can be qualitatively described by the microscopic KL-theory, where the was numerically calculated from the Eilenberger equations by assuming that the velocity of supercurrent is proportional to a phase gradient of the SC order parameter Kupriyanov and Lukichev (1980).
Quantitatively, the values of (/)2/3 are smaller than the theoretical ones at low temperatures. The fact that (/)2/3 of the two Fe1+yTe0.6Se0.4 bridges with different almost fall into an identical curve suggests the unified origin of the smaller value rather than the impurity level of the sample. The smaller than the theoretical one has also been observed in the micro-fabricated YBa2Cu3O7-δ Nawaz et al. (2013) and some Nb thin films Rusanov et al. (2004). The former one is attributed to the current crowding at the inner corners of the junction between the bridge and electrode, which makes the local current density at the inner corners larger than the averaged one at the center of the bridge Nawaz et al. (2013). The later one is discussed to be the heating effect on the contacts, which cause extra vortex flowing Rusanov et al. (2004). Besides, the GL-theory and KL-theory are all based on the conventional superconductors with one band structure. A recent theoretical calculation shows that the depairing for the real material should be smaller than that expected from the KL-theory due to the broadening of the peaks in the quasi-particle density of states Kubo (2019). Moreover, Fe1+yTe1-xSex is a multiband system with strong inter-band scattering Chen et al. (2010). Future efforts of theoretical consideration on the multiband effect may be required to understand the temperature dependence of the depairing property.
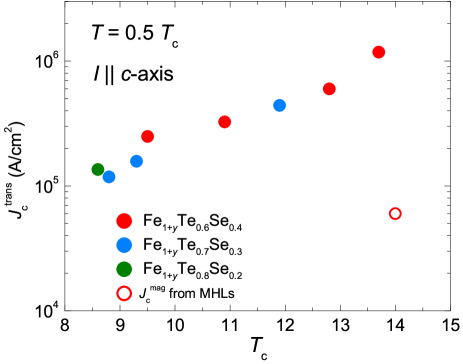
To directly observe the evolution of transport with the value of , (i.e. the amount of excess Fe), we summarized the for all the crystals at = 0.5 , and plotted versus their values of in Fig. 4. It is clear that increases monotonically with independent of the amount of Se. Note that of the crystal with minimum is still larger than the depinning estimated from MHLs (See the open symbol in Fig. 4) Sun et al. (2013a, 2015). It indicates that the depairing current limit is achieved in all the samples. On the other hand, the depairing decreases quickly with the suppression of . Such a strong decrease of depairing cannot be explained by the difference in bridge dimensions, since the sample with the highest has the largest width close to the Pearl length. The decrease of depairing may be due to the effect of excess Fe. Density functional study shows that the excess Fe is strongly magnetic, providing local moments, which will act as a pair breaker Zhang et al. (2009). In addition, the edge barriers in the disordered region around the excess Fe is considered to be weakened, which will cause local suppression of . Our results suggest that removing the excess Fe is crucial for the increase of the current capacity limit as well as the depairing for the Fe1+yTe1-xSex, which is instructive for other studies on thin films, tapes, and the nanoscale devices such as the single photon detectors and the nanoSQUIDs.
IV conclusions
In conclusion, we investigated the transport critical current density along -axis in Fe1+yTe1-xSex single crystals. A series of crystals containing different amounts of excess Fe with ranging from 8.6 K to 13.7 K were fabricated into -axis bridges for the transport - measurements. reaches a much larger value than the magnetic obtained from MHLs, which is explained by reaching the depairing limit. The depairing follows the GL-theory down to 0.83 , then increases with a reducing slope at lower temperatures, which can be qualitatively described by the KL-theory. This work indicates that the depairing current limit of high- superconductors can be explored by fabricating the -axis narrow bridges. Future efforts on fabricating other IBSs are expected to reveal the common behavior of the depairing at the whole temperature range.
Acknowledgements.
The present work was partly supported by KAKENHI (JP20H05164, 19K14661, 18K03547, 16K13841, 18H05853, and 17H01141) from JSPS. FIB microfabrication performed in this work was supported by Center for Instrumental Analysis, College of Science and Engineering, Aoyama Gakuin University.References
- Hsu et al. (2008) F. C. Hsu, J. Y. Luo, K. W. Yeh, T. K. Chen, T. W. Huang, P. M. Wu, Y. C. Lee, Y.-L. Huang, Y.-Y. Chu, D. C. Yan, and M. K. Wu, Proc. Nat. Acad. Sci. 105, 14262 (2008).
- Sales et al. (2009) B. C. Sales, A. S. Sefat, M. A. McGuire, R. Y. Jin, D. Mandrus, and Y. Mozharivskyj, Phys. Rev. B 79, 094521 (2009).
- Medvedev et al. (2009) S. Medvedev, T. M. McQueen, I. A. Troyan, T. Palasyuk, M. I. Eremets, R. J. Cava, S. Naghavi, F. Casper, V. Ksenofontov, G. Wortmann, and C. Felser, Nat. Mater. 8, 630 (2009).
- Burrard-Lucas et al. (2013) M. Burrard-Lucas, D. G. Free, S. J. Sedlmaier, J. D. Wright, S. J. Cassidy, Y. Hara, A. J. Corkett, T. Lancaster, P. J. Baker, S. J. Blundell, and S. J. Clarke, Nat. Mater. 12, 15 (2013).
- He et al. (2013) S. He, J. He, W. Zhang, L. Zhao, D. Liu, X. Liu, D. Mou, Y. B. Ou, Q. Y. Wang, Z. Li, L. Wang, Y. Peng, Y. Liu, C. Chen, L. Yu, G. Liu, X. Dong, J. Zhang, C. Chen, Z. Xu, X. Chen, X. Ma, Q. Xue, and X. J. Zhou, Nat. Mater. 12, 605 (2013).
- Zhang et al. (2018) P. Zhang, K. Yaji, T. Hashimoto, Y. Ota, T. Kondo, K. Okazaki, Z. Wang, J. Wen, G. D. Gu, H. Ding, and S. Shin, Science 360, 182 (2018).
- Zhang et al. (2019) P. Zhang, Z. Wang, X. Wu, K. Yaji, Y. Ishida, Y. Kohama, G. Dai, Y. Sun, C. Bareille, K. Kuroda, T. Kondo, K. Okazaki, K. Kindo, X. Wang, C. Jin, J. Hu, R. Thomale, K. Sumida, S. Wu, K. Miyamoto, T. Okuda, H. Ding, G. D. Gu, T. Tamegai, T. Kawakami, M. Sato, and S. Shin, Nat. Phys. 15, 41 (2019).
- Wang et al. (2018) D. Wang, L. Kong, P. Fan, H. Chen, S. Zhu, W. Liu, L. Cao, Y. Sun, S. Du, J. Schneeloch, R. Zhong, G. Gu, L. Fu, H. Ding, and H.-J. Gao, Science 362, 333 (2018).
- Machida et al. (2019) T. Machida, Y. Sun, S. Pyon, S. Takeda, Y. Kohsaka, T. Hanaguri, T. Sasagawa, and T. Tamegai, Nat. Mater. 18, 811 (2019).
- Si et al. (2013) W. Si, S. J. Han, X. Shi, S. N. Ehrlich, J. Jaroszynski, A. Goyal, and Q. Li, Nat. Commun. 4, 1347 (2013).
- Tinkham (1996) M. Tinkham, Introduction to superconductivity (Courier Corporation, New York, 1996).
- Dew-Hughes (2001) D. Dew-Hughes, Low Temp. Phys. 27, 713 (2001).
- Blatter et al. (1994) G. Blatter, M. V. Feigel’man, V. B. Geshkenbein, A. I. Larkin, and V. M. Vinokur, Rev. Mod. Phys. 66, 1125 (1994).
- Bean (1964) C. P. Bean, Rev. Mod. Phys. 36, 31 (1964).
- de Vries et al. (1989) J. de Vries, G. Stollman, and M. Gijs, Physica C 157, 406 (1989).
- Hänisch et al. (2019) J. Hänisch, K. Iida, R. Hühne, and C. Tarantini, Supercond. Sci. Technol. 32, 093001 (2019).
- Hilgenkamp and Mannhart (2002) H. Hilgenkamp and J. Mannhart, Rev. Mod. Phys. 74, 485 (2002).
- Durrell et al. (2011) J. H. Durrell, C.-B. Eom, A. Gurevich, E. E. Hellstrom, C. Tarantini, A. Yamamoto, and D. C. Larbalestier, Rep. Prog. Phys. 74, 124511 (2011).
- Fiory et al. (1978) A. T. Fiory, A. F. Hebard, and S. Somekh, Appl. Phys. Lett. 32, 73 (1978).
- Skocpol (1976) W. J. Skocpol, Phys. Rev. B 14, 1045 (1976).
- Xu et al. (2010) K. Xu, P. Cao, and J. R. Heath, Nano Lett. 10, 4206 (2010).
- Romijn et al. (1982) J. Romijn, T. M. Klapwijk, M. J. Renne, and J. E. Mooij, Phys. Rev. B 26, 3648 (1982).
- Yang and Lieber (1996) P. Yang and C. M. Lieber, Science 273, 1836 (1996).
- Rusanov et al. (2004) A. Y. Rusanov, M. B. S. Hesselberth, and J. Aarts, Phys. Rev. B 70, 024510 (2004).
- Cirillo et al. (2007) C. Cirillo, A. Rusanov, C. Bell, and J. Aarts, Phys. Rev. B 75, 174510 (2007).
- Moll et al. (2010) P. J. W. Moll, R. Puzniak, F. Balakirev, K. Rogacki, J. Karpinski, N. D. Zhigadlo, and B. Batlogg, Nat. Mater. 9, 628 (2010).
- Nawaz et al. (2013) S. Nawaz, R. Arpaia, F. Lombardi, and T. Bauch, Phys. Rev. Lett. 110, 167004 (2013).
- Liang et al. (2013) M. Liang, M. N. Kunchur, L. Fruchter, and Z. Li, Physica C: 492, 178 (2013).
- Li et al. (2013) J. Li, J. Yuan, Y.-H. Yuan, J.-Y. Ge, M.-Y. Li, H.-L. Feng, P. J. Pereira, A. Ishii, T. Hatano, A. V. Silhanek, L. F. Chibotaru, J. Vanacken, K. Yamaura, H.-B. Wang, E. Takayama-Muromachi, and V. V. Moshchalkov, Appl. Phys. Lett. 103, 062603 (2013).
- Kunchur (2004) M. N. Kunchur, J. Phys. Condens. Matter 16, R1183 (2004).
- Prozorov et al. (2009) R. Prozorov, M. Tanatar, R. Gordon, C. Martin, H. Kim, V. Kogan, N. Ni, M. Tillman, S. Bud’ko, and P. Canfield, Physica C 469, 582 (2009).
- Bendele et al. (2010) M. Bendele, S. Weyeneth, R. Puzniak, A. Maisuradze, E. Pomjakushina, K. Conder, V. Pomjakushin, H. Luetkens, S. Katrych, A. Wisniewski, R. Khasanov, and H. Keller, Phys. Rev. B 81, 224520 (2010).
- Lei et al. (2010) H. Lei, R. Hu, E. S. Choi, J. B. Warren, and C. Petrovic, Phys. Rev. B 81, 094518 (2010).
- Kasahara et al. (2014) S. Kasahara, T. Watashige, T. Hanaguri, Y. Kohsaka, T. Yamashita, Y. Shimoyama, Y. Mizukami, R. Endo, H. Ikeda, K. Aoyama, T. Terashima, S. Uji, T. Wolf, H. von Löhneysen, T. Shibauchi, and Y. Matsuda, Proc. Nat. Acad. Sci. 111, 16309 (2014).
- Cao et al. (2019) R. X. Cao, J. Dong, Q. L. Wang, Y. J. Yang, C. Zhao, X. H. Zeng, D. A. Chareev, A. N. Vasiliev, B. Wu, and G. Wu, AIP Adv. 9, 045220 (2019).
- Lei et al. (2011) H. Lei, R. Hu, and C. Petrovic, Phys. Rev. B 84, 014520 (2011).
- Vedeneev et al. (2013) S. I. Vedeneev, B. A. Piot, D. K. Maude, and A. V. Sadakov, Phys. Rev. B 87, 134512 (2013).
- Jia et al. (2008) Y. Jia, P. Cheng, L. Fang, H. Luo, H. Yang, C. Ren, L. Shan, C. Gu, and H.-H. Wen, Appl. Phys. Lett. 93, 032503 (2008).
- Yuan et al. (2009) H. Q. Yuan, J. Singleton, F. F. Balakirev, S. A. Baily, G. F. Chen, J. L. Luo, and N. L. Wang, Nature 457, 565 (2009).
- Prozorov and Kogan (2011) R. Prozorov and V. G. Kogan, Rep. Prog. Phys. 74, 124505 (2011).
- Yamamoto et al. (2009) A. Yamamoto, J. Jaroszynski, C. Tarantini, L. Balicas, J. Jiang, A. Gurevich, D. C. Larbalestier, R. Jin, A. S. Sefat, M. A. McGuire, B. C. Sales, D. K. Christen, and D. Mandrus, Appl. Phys. Lett. 94, 062511 (2009).
- Hashimoto et al. (2012) K. Hashimoto, K. Cho, T. Shibauchi, S. Kasahara, Y. Mizukami, R. Katsumata, Y. Tsuruhara, T. Terashima, H. Ikeda, M. A. Tanatar, H. Kitano, N. Salovich, R. W. Giannetta, P. Walmsley, A. Carrington, R. Prozorov, and Y. Matsuda, Science 336, 1554 (2012).
- Chong et al. (2010) S. Chong, S. Hashimoto, and K. Kadowaki, Solid State Commun. 150, 1178 (2010).
- Torchetti et al. (2011) D. A. Torchetti, M. Fu, D. C. Christensen, K. J. Nelson, T. Imai, H. C. Lei, and C. Petrovic, Phys. Rev. B 83, 104508 (2011).
- Mun et al. (2011) E. D. Mun, M. M. Altarawneh, C. H. Mielke, V. S. Zapf, R. Hu, S. L. Bud’ko, and P. C. Canfield, Phys. Rev. B 83, 100514 (2011).
- Inosov et al. (2010) D. S. Inosov, J. S. White, D. V. Evtushinsky, I. V. Morozov, A. Cameron, U. Stockert, V. B. Zabolotnyy, T. K. Kim, A. A. Kordyuk, S. V. Borisenko, E. M. Forgan, R. Klingeler, J. T. Park, S. Wurmehl, A. N. Vasiliev, G. Behr, C. D. Dewhurst, and V. Hinkov, Phys. Rev. Lett. 104, 187001 (2010).
- Zhang et al. (2011) J. L. Zhang, L. Jiao, F. F. Balakirev, X. C. Wang, C. Q. Jin, and H. Q. Yuan, Phys. Rev. B 83, 174506 (2011).
- Moll et al. (2014) P. J. W. Moll, X. Zhu, P. Cheng, H.-H. Wen, and B. Batlogg, Nat. Phys. 10, 644 (2014).
- Kashiwaya et al. (2010) H. Kashiwaya, K. Shirai, T. Matsumoto, H. Shibata, H. Kambara, M. Ishikado, H. Eisaki, A. Iyo, S. Shamoto, I. Kurosawa, and S. Kashiwaya, Appl. Phys. Lett. 96, 202504 (2010).
- Sun et al. (2013a) Y. Sun, T. Taen, Y. Tsuchiya, Q. Ding, S. Pyon, Z. Shi, and T. Tamegai, Appl. Phys. Express 6, 043101 (2013a).
- Sun et al. (2015) Y. Sun, T. Taen, T. Yamada, Y. Tsuchiya, S. Pyon, and T. Tamegai, Supercond. Sci. Technol. 28, 044002 (2015).
- Noji et al. (2010) T. Noji, T. Suzuki, H. Abe, T. Adachi, M. Kato, and Y. Koike, J. Phys. Soc. Jpn. 79, 084711 (2010).
- Sun et al. (2013b) Y. Sun, T. Taen, Y. Tsuchiya, Z. X. Shi, and T. Tamegai, Supercond. Sci. Technol. 26, 015015 (2013b).
- Sun et al. (2016) Y. Sun, T. Yamada, S. Pyon, and T. Tamegai, Sci.Rep. 6, 2045 (2016).
- Sun et al. (2014a) Y. Sun, Y. Tsuchiya, T. Taen, T. Yamada, S. Pyon, A. Sugimoto, T. Ekino, Z. Shi, and T. Tamegai, Sci. Rep. 4, 4585 (2014a).
- Okada et al. (2018) K. Okada, T. Takagi, M. Kobayashi, H. Ohnuma, T. Noji, Y. Koike, S. Ayukawa, and H. Kitano, Jpn. J. Appl. Phys. 57, 040305 (2018).
- Sun et al. (2014b) Y. Sun, T. Taen, T. Yamada, S. Pyon, T. Nishizaki, Z. Shi, and T. Tamegai, Phys. Rev. B 89, 144512 (2014b).
- Sun et al. (2019) Y. Sun, Z. Shi, and T. Tamegai, Supercond. Sci. Technol. 32, 103001 (2019).
- Clem and Berggren (2011) J. R. Clem and K. K. Berggren, Phys. Rev. B 84, 174510 (2011).
- Kakehi et al. (2016) D. Kakehi, Y. Takahashi, H. Yamaguchi, S. Koizumi, S. Ayukawa, and H. Kitano, IEEE Trans. Appl. Supercond. 26, 1 (2016).
- Kakizaki et al. (2017) Y. Kakizaki, J. Koyama, A. Yamaguchi, S. Umegai, S. Ayukawa, and H. Kitano, Jpn. J. Appl. Phys. 56, 043101 (2017).
- Ayukawa et al. (2014) S. Ayukawa, H. Kitano, T. Noji, and Y. Koike, JPS Conf. Proc. 1, 012123 (2014).
- Moll (2018) P. J. Moll, Annu. Rev. Condens. Matter Phys. 9, 147 (2018).
- (64) See Supplemental Material at [http://link.aps.org/supplemental/10.1103/PhysRevB. 101.134516] for the discussion about the hysteresis loops in the - characteristics.
- Kupriyanov and Lukichev (1980) M. Y. Kupriyanov and V. F. Lukichev, Fiz. Nizk. Temp. 6, 445 (1980), [Sov. J. Low Temp. Phys. 6, 210 (1980)].
- Kubo (2019) T. Kubo, arXiv:1912.01822 (2019).
- Chen et al. (2010) F. Chen, B. Zhou, Y. Zhang, J. Wei, H.-W. Ou, J.-F. Zhao, C. He, Q.-Q. Ge, M. Arita, K. Shimada, H. Namatame, M. Taniguchi, Z.-Y. Lu, J. Hu, X.-Y. Cui, and D. L. Feng, Phys. Rev. B 81, 014526 (2010).
- Zhang et al. (2009) L. Zhang, D. J. Singh, and M. H. Du, Phys. Rev. B 79, 012506 (2009).
Supplemental information
V Hysteresis loops in the I-V characteristics

The - curves of the -axis bridged Fe1+yTe1-xSex measured by the ramped bias current sometimes manifest hysteresis loops, which are reminiscent of the feature of underdamped Josephson junctions, as reported previously [62]. Figure S1(a) shows a typical hysteretic - curve measured at 4 K with the repetition frequency of 23 Hz on the crystal with 10 K. When ramping up the current, the voltage jumps from zero to a finite value at 3.2 mA, however, the voltage does not turn back to zero until the current ramping down to a much smaller value 0.2 mA. We found that the size of hysteresis loop is strongly dependent on the repetition frequency of the ramped bias current, as shown in Figs. S1(a) to S1(c). The diminishing behavior of the hysteresis with increasing frequencies strongly suggest that the observed hysteretic behavior is attributed to the Joule heating effect, occurring in the finite voltage state above the critical current . If the frequency is enough low, the sample will be heated up above and be cooled down during ramping down the current, producing a large hysteresis in the - curve. On the other hand, at higher frequencies, the zero voltage state disappears since there is no time period where the sample is cooled down, showing no hysteresis in the - curve.
To confirm the Joule heating effect, we micro-fabricated an in-plane bridge with length 10 m, and cross-section area 15.6 m2. The scanning ion microscopy image from the top view is shown in Figure S2(a). Such a long bridge of superconductors must show no Josephson effect. However, the - curves also show hysteresis loops, as shown in Fig. S2(b). We replot the - curves into / versus in Fig. S2(c), where /() represents the chordal resistance of the sample in the finite voltage state. The current dependence of /() was found to be very similar to the temperature dependence of the DC resistance (see Fig. S2(d)), confirming that the observed hysteresis in the - curves are caused by the Joule heating effect. Similar hysteretic behavior in the - curves has also been observed in micro-fabricated Ba1-xKxFe2As2 [29]. Thus, we conclude that the superconducting state of Fe1+yTe1-xSex does not belong to the intrinsic Josephson junction systems, in contrast to the (V2Sr4O6)Fe2As2 [48].