Which oxidation state of uranium and thorium as point defects in xenotime is favorable?
Abstract
Relativistic study of xenotime, YPO4, containing atoms thorium and uranium as point defects is performed in the framework of cluster model with using the compound-tunable embedding potential (CTEP) method proposed by us recently Maltsev et al. (2019). The Y–(PO4)6–Y’22–O’104 cluster for xenotime is considered, in which central part, [Y–(PO4)6]-15, is the main cluster, whereas outermost 22 atoms of yttrium and 104 atoms of oxygen are treated as its environment and compose electron-free CTEP with the total charge of . The P and O atoms of the orthophosphate groups nearest to the central Y atom are treated at all-electron level. The central Y, its substitutes, Th and U, together with environmental Y atoms are described within different versions of the generalized relativistic pseudopotential method Titov and Mosyagin (1999). Correctness of our cluster and CTEP models, constructed in the paper, is justified by comparing the Y-O and P-O bond lengths with corresponding periodic structure values of the YPO4 crystal, both experimental and theoretical.
Using this cluster model, chemical properties of solitary point defects, X = U, Th, in xenotime are analyzed. It has been shown that the oxidation state is energetically more profitable than not only for thorium but for uranium as well ( eV) despite the notably higher ionic radius of U+3 compared to Y+3, whereas ionic radii of U+4 and Y+3 are close. This leads to notable local deformation of crystal geometry around the U+3 impurity in xenotime and contradicts to widespread opinion about favorite oxidation state of uranium in such kind of minerals M. (1954).
Introduction
Natural orthophosphates of yttrium and rare earth elements (minerals like xenotime YPO4 and monazite CePO4) are characterized by high chemical and radiation resistance Nasdala et al. (2018) and are considered as natural analogues of matrices for immobilization of actinides Dacheux et al. (2004); Ji et al. (2017); Popa et al. (2016).
Methods for the high-temperature synthesis of ceramics based on these orthophosphates have been developed in detail, conditions for the stabilization of actinides in the tri- and/or tetravalent states have been found Vance et al. (2011); Arinicheva et al. (2017); Yingjie and Vance (2008). (Higher degrees of oxidation of actinides are not formed in this case.) It is assumed that the resulting composites will be buried in deep geological formations for a period of at least 10,000 years Lumpkin and Geisler-Wierwille (2012).
An understanding of the immobilization properties of such matrices at the atomic level can be achieved only on the basis of quantum-chemical modeling the electronic structure of the considered actinide-containing materials.
Calculations concerning the electronic structure of solids are usually carried out taking into account their periodic structure, however, it is reasonable to utilize cluster models for these minerals due to relatively low concentration of the impurity actinides in solids.
In this case, the calculation is carried out only for the small region that includes an impurity atom and its environment. The remaining part of the crystal is modeled by an embedding potential, to account for influence of environment on the selected fragment of the crystal. Such a modeling scheme is known as the embedded cluster method Abarenkov and Boyko (2016).
While good incorporation of Th into monazite is naturally justified by approximately the same ionic radii of Ce and Th atoms Bugaenko et al. (2008) and similarity of their electronic structure, there is no such analogy between Y and U (Th) atoms for the case of xenotime. Therefore, one needs more detailed consideration based on theoretical electronic structure modeling of xenotime with the impurity actinide atoms.
The grounds of new, combined approach based on the relativistic study of materials and their fragments with inclusion of impurity atoms (which can be and heavy elements) were recently developed by us based on the compound-tunable embedding potential (CTEP) method Maltsev et al. (2019). Electronic structure calculations with CTEP of the point defects containing uranium and thorium made it possible to determine a number of their characteristics. One of the most interesting questions is that about the energetically preferred oxidation state of thorium and uranium in xenotime. According to Goldschmidt’s long-standing paper M. (1954) it should be +4, not +3. More recently, Vance et al. wrote in Vance et al. (2011) “Thus overall the results for U were broadly similar to those for Np and Pu, except that only tetravalent U was observed” and “U+3 should also be able to be incorporated in principle but the necessary conditions would likely be so reducing that the xenotime and monazite structures would be destabilized by the reduction of phosphate to elemental P.” Thus, the question about the +3 oxidation state of U in xenotime is yet open and one of goals of this research is to discuss this problem from theoretical point of view.
Note, that we consider here only the single-atom point defects, though more complicated substitutes like 4Y 3U + (where is a Y–site vacancy, see Vance et al. (2011) and refs.) are also possible and will be considered in the other study.
Our cluster model is given in section “Computational details”, results of calculation are considered in “Results”, and discussion about absence of experimental data with trivalent U is given in “Conclusions”.
To summarize, the CTEP-based combined approach developed here to actinide-containing impurities in xenotime is quite versatile and can be used to study very different electronic properties of materials with point defects Maltsev et al. (2019) and various processes, in particular, such as localized vibrations, rotations and electronic excitations in crystals, as well as to study sorption processes of heavy atoms. In paper Shakhova et al. (2019) it is applied to YbF2 and YbF3 crystals containing -element, Yb, as regular atom of periodic structure.
Computational details
To carry out calculations of the electronic structure of the xenotime crystal the DFT method with hybrid PBE0 Adamo and Barone (1999) functional implemented in the crystal code Dovesi et al. (2018) was used. This code allows us to use the same DFT PBE0 functional and basis sets as that in the cluster model calculations, both one- and two-component, which are discussed below. Thus, one can directly juxtapose results of these calculations.
The cluster model calculations were carried out with using the two-component DFT code van Wüllen (2010). For simulating the crystal structure, basis set superposition error (BSSE) arising from presence of diffuse type orbitals is significant, thus we use the relatively small basis sets for such calculations. It is also important to note, that using the same basis sets, atomic pseudopotentials (PPs) and DFT-functional for the periodic crystal and cluster model calculations allows one to estimate reliably the errors arising from using the embedded cluster model simulating the crystal fragment.
The PPs for yttrium developed by our group Titov and Mosyagin (1999); URL: http://www.qchem.pnpi.spb.ru/Basis/ was applied to exclude core shells from calculation such that only 11 outermost yttrium electrons are treated explicitly. The uncontracted basis set (5s4p3d) URL: http://www.qchem.pnpi.spb.ru/Basis/ was used for these electrons.
The oxygen and phosphorus atoms are treated at all-electron level, basis sets for them are taken from Peintinger et al. (2013).
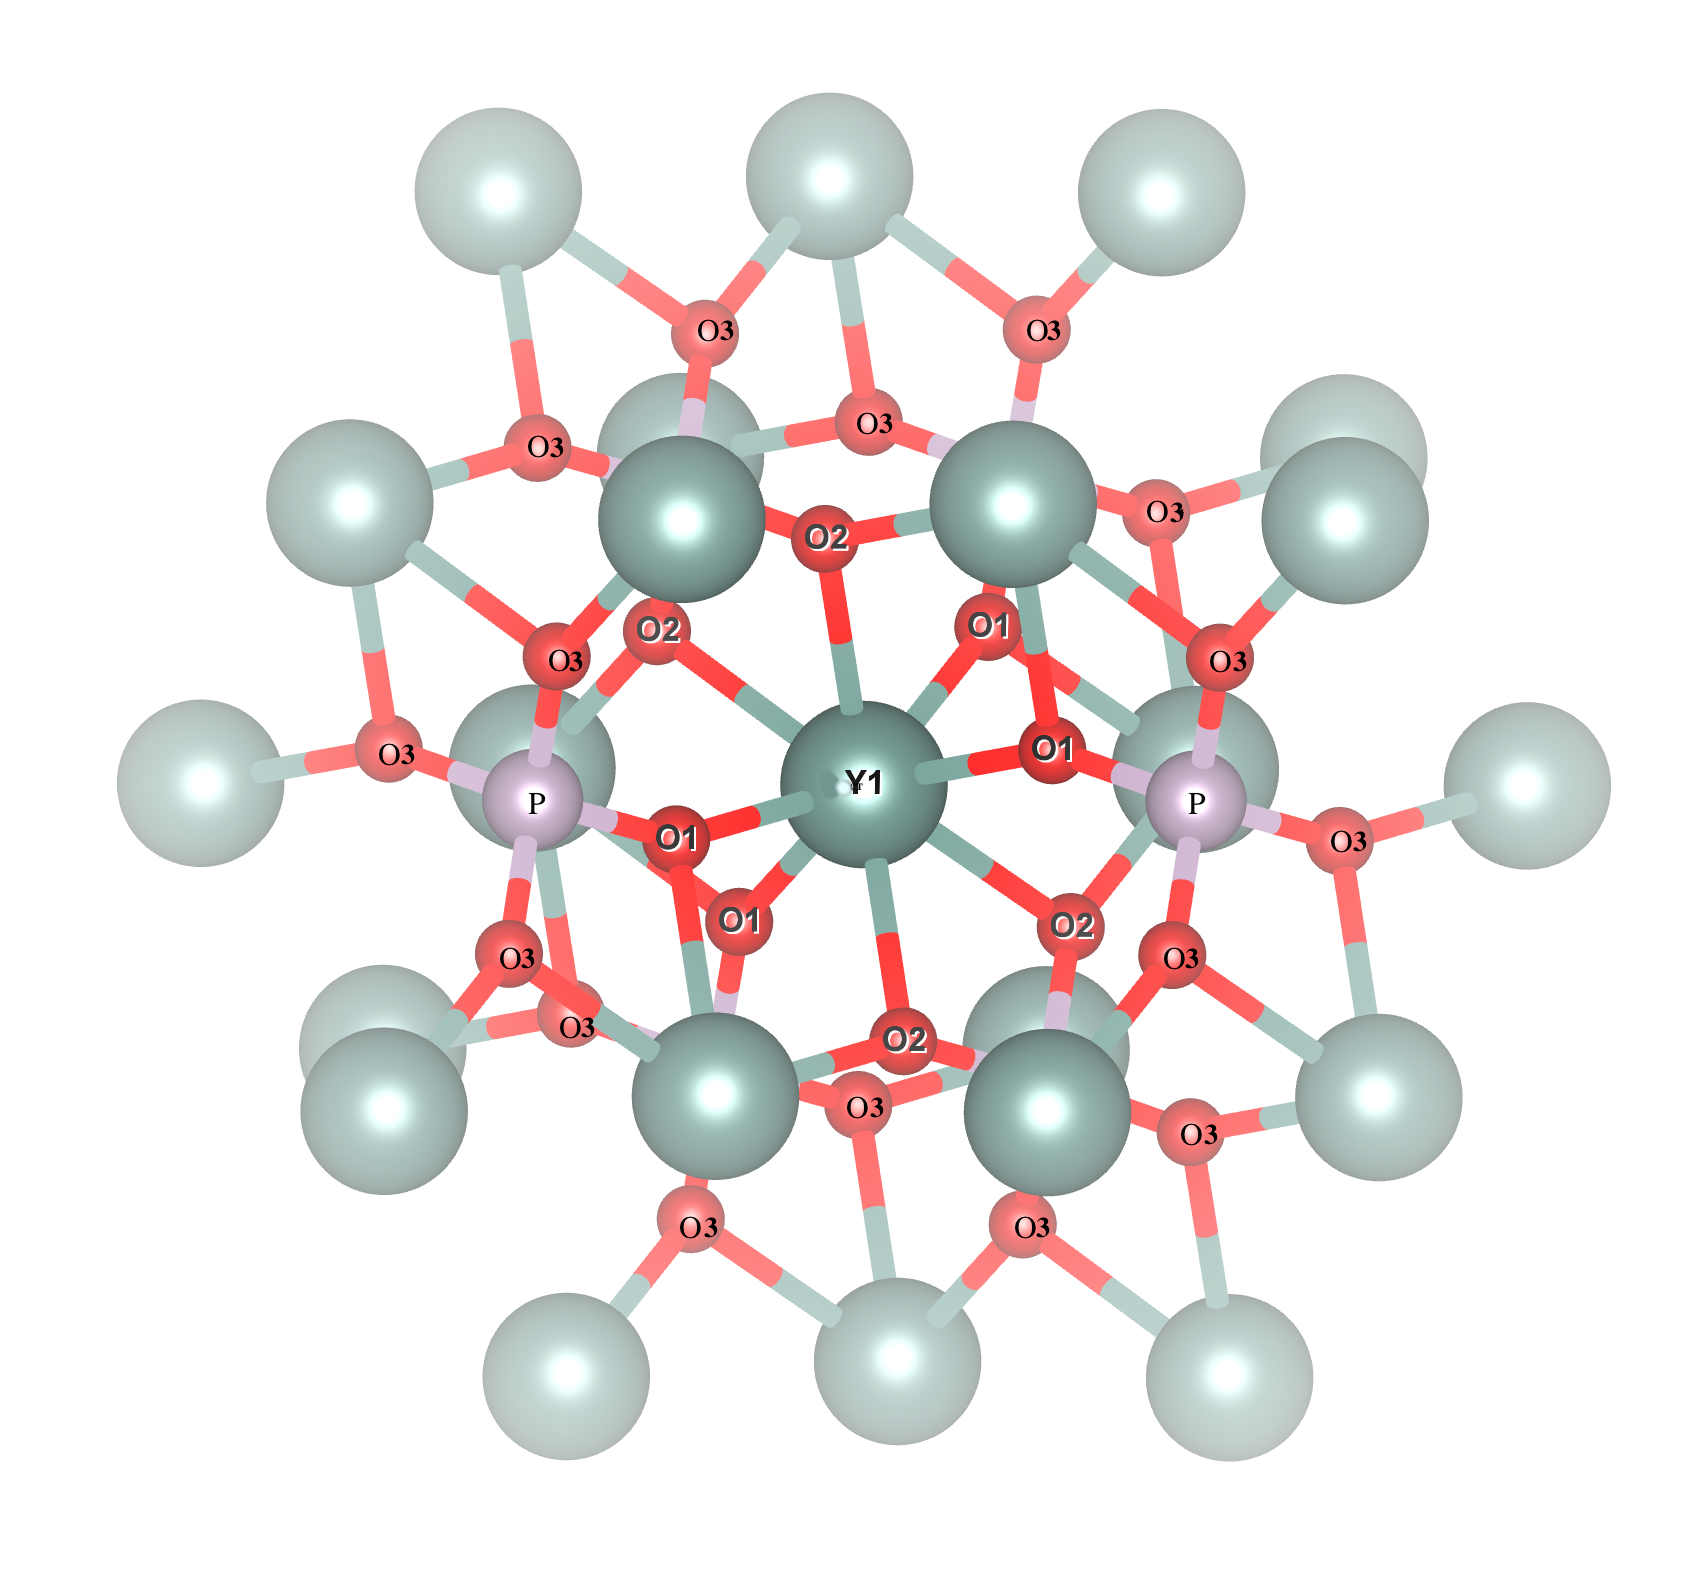
We consider the following cluster model of xenotime crystal to perform calculations of properties of Y, Th, U atoms in xenotime: the structural formula of our cluster is Y-(PO4)6-Y’22-O’104. The main cluster, Y-(PO4)6, consists of the central yttrium (substituted later by uranium or thorium) atom and surrounding six orthophosphate groups PO4 (see Figure 1). For the main-cluster atoms, the same pseudopotential and basis sets for Y, P, O atoms were used as for the periodic structure calculations. To reproduce the electronic structure of a fragment in a crystal (in particular, saturate chemical bonds properly) we need first reproduce the oxidation states of the atoms inside the fragment. For the main cluster we have +3 for oxidation state of Y and -3 for each PO4 group. Thus, 15 additional electrons should added to the main cluster, which, in turn, should be compensated by the charge of environment (see below).
The cationic layer of the cluster model, Y’22, consists of 22 yttrium pseudoatoms, which are modeled with using particular kind of the “electron free” pseudopotential Maltsev et al. (2019), with respect to the Y+3 oxidation state (“electron free” PP means here that we do not introduce additional electrons to the extended cluster under consideration compared to the main one). The basis sets used for these atoms were taken here the same as for the central yttrium atom.
The anionic layer, O’104, consists of the 104 oxygen-site negative point charges without addition of electrons to the cluster as well. The net charge of 15 additional electrons to the main cluster is completely compensated by the corresponding fractional charges on yttrium (cationic) and oxygen (anionic) sites of the environmental layers. In our approach, the additional charges on these yttrium pseudoatoms as well as on oxygen-site negative point charges of the anion layer are considered as adjustable parameters of the CTEP for xenotime.
In the present work, values of these charges were obtained by minimizing root mean square (RMS) force acting on the atoms of the main cluster. This value is calculated as
| (1) |
where is the evaluated total energy of the cluster, – number of atoms in the main cluster ( for the xenotime cluster model), and is the gradient operator with respect to coordinates of -th atom.
The basis sets and pseudopotentials developed by our group URL: http://www.qchem.pnpi.spb.ru/Basis/ were used for calculations of xenotime with the U and Th point defect substitutes of Y.
results
.1 Periodic structure calculation results
| expt. data | crystal | cluster | |
| calculations | model calculations | ||
| , Å111The lattice parameters obtained from the DFT PBE0 Adamo and Barone (1999) periodic structure calculations using the crystal Dovesi et al. (2018) code; the experimental data are taken from Ni et al. (1995). | 6.89 | 6.93 | – |
| , Å111The lattice parameters obtained from the DFT PBE0 Adamo and Barone (1999) periodic structure calculations using the crystal Dovesi et al. (2018) code; the experimental data are taken from Ni et al. (1995). | 6.03 | 6.06 | – |
| , a. u.222The and are average additional charge values on the Y’ pseudoatoms of cluster cation layer Y’22 and on the O’ pseudoatoms of cluster anion layer, correspondingly. The whole sets of these values were optimized to minimize RMS force acting on the main-cluster atoms, when the atom nuclei positions obtained from the crystal calculations are used. | 333Standard deviation of the value calculated on the sets of additional charges of cation layer atoms for and of anion layer atoms for . These values are not zero, due to the fact that symmetry of the cluster model is lower than symmetry of the xenotime crystal. There is only the one atom of the each kind (Y, O, or P) in the unit cell of xenotime, but there are several non equivalent Y and O atoms in the cluster model. | ||
| , a. u.222The and are average additional charge values on the Y’ pseudoatoms of cluster cation layer Y’22 and on the O’ pseudoatoms of cluster anion layer, correspondingly. The whole sets of these values were optimized to minimize RMS force acting on the main-cluster atoms, when the atom nuclei positions obtained from the crystal calculations are used. | 333Standard deviation of the value calculated on the sets of additional charges of cation layer atoms for and of anion layer atoms for . These values are not zero, due to the fact that symmetry of the cluster model is lower than symmetry of the xenotime crystal. There is only the one atom of the each kind (Y, O, or P) in the unit cell of xenotime, but there are several non equivalent Y and O atoms in the cluster model. | ||
| , a.u.444RMS force acting on the atoms of the main cluster Y-(PO4)6. This value is calculated from equation (1). | |||
| Y–O1, Å555The P–O, Y–O1 and Y–O2 bond lengths (see Figure 1). In the cluster model calculations column, average values for the atoms of the main cluster are represented. Errors for them are estimated as corresponding standard deviations. It follows from provided data that errors associated with the embedded cluster model are much less then the errors arising from using DFT approximation. | |||
| Y–O2, Å555The P–O, Y–O1 and Y–O2 bond lengths (see Figure 1). In the cluster model calculations column, average values for the atoms of the main cluster are represented. Errors for them are estimated as corresponding standard deviations. It follows from provided data that errors associated with the embedded cluster model are much less then the errors arising from using DFT approximation. | |||
| P–O, Å555The P–O, Y–O1 and Y–O2 bond lengths (see Figure 1). In the cluster model calculations column, average values for the atoms of the main cluster are represented. Errors for them are estimated as corresponding standard deviations. It follows from provided data that errors associated with the embedded cluster model are much less then the errors arising from using DFT approximation. |
According to the experimental data Ni et al. (1995) the crystal system of the xenotime YPO4 is tetragonal (lattice parameters , ). The space group is and there are 3 non-equivalent atoms Y, P, O in the unit cell. The lattice parameters as well as positions of the atomic nuclei within the unit cell of the crystal were optimized to achieve minimum of the total energy of the system.
.2 Calculation of CTEP parameters for cluster studies
Using the calculated periodic structure data one can consider the cluster model of the xenotime Y-(PO4)6-Y’22-O’104 (see Figure 1) to generate CTEP. Due to the lower symmetry of the cluster, for which only point group can be taken into account as compared with xenotime crystal, the yttrium pseudoatoms of the cationic layer are not equivalent to each other; the same is true for the oxygen-site negative point charges of the anionic layer. This fact leads to dispersion in values of additional charges on yttrium pseudoatoms and on oxygen pseudoatoms. The results of charge optimization procedure are listed in Table 1.
Optimal values of charges are spread around average value , this value is in qualitative agreement with the corresponding formal charge +3. RMS force acting on the main-cluster atoms is of the order of a. u.
To obtain more illustrative estimate of quality of the described cluster model, positions of the main-cluster atoms were optimized to achieve minimum of the total energy of the system. During this optimization process, positions of pseudoatoms from cationic and anionic environmental layers were considered as fixed together with the values of additional charges and . Difference between the optimized cluster and calculated crystal values for the Y–O and P–O bond lengths is of the order of Å, this value is much less than the difference between the results of crystal calculation and experimental data.
To estimate the reproducibility of the electronic properties of the original non-substituted cluster, compared to the solid-state calculations, electronic density cube files were obtained for the periodic crystal study and for the cluster with CTEP. The cube grid was chosen to be the same in both cases with the orthogonal unit vectors of about 0.053 a.u.
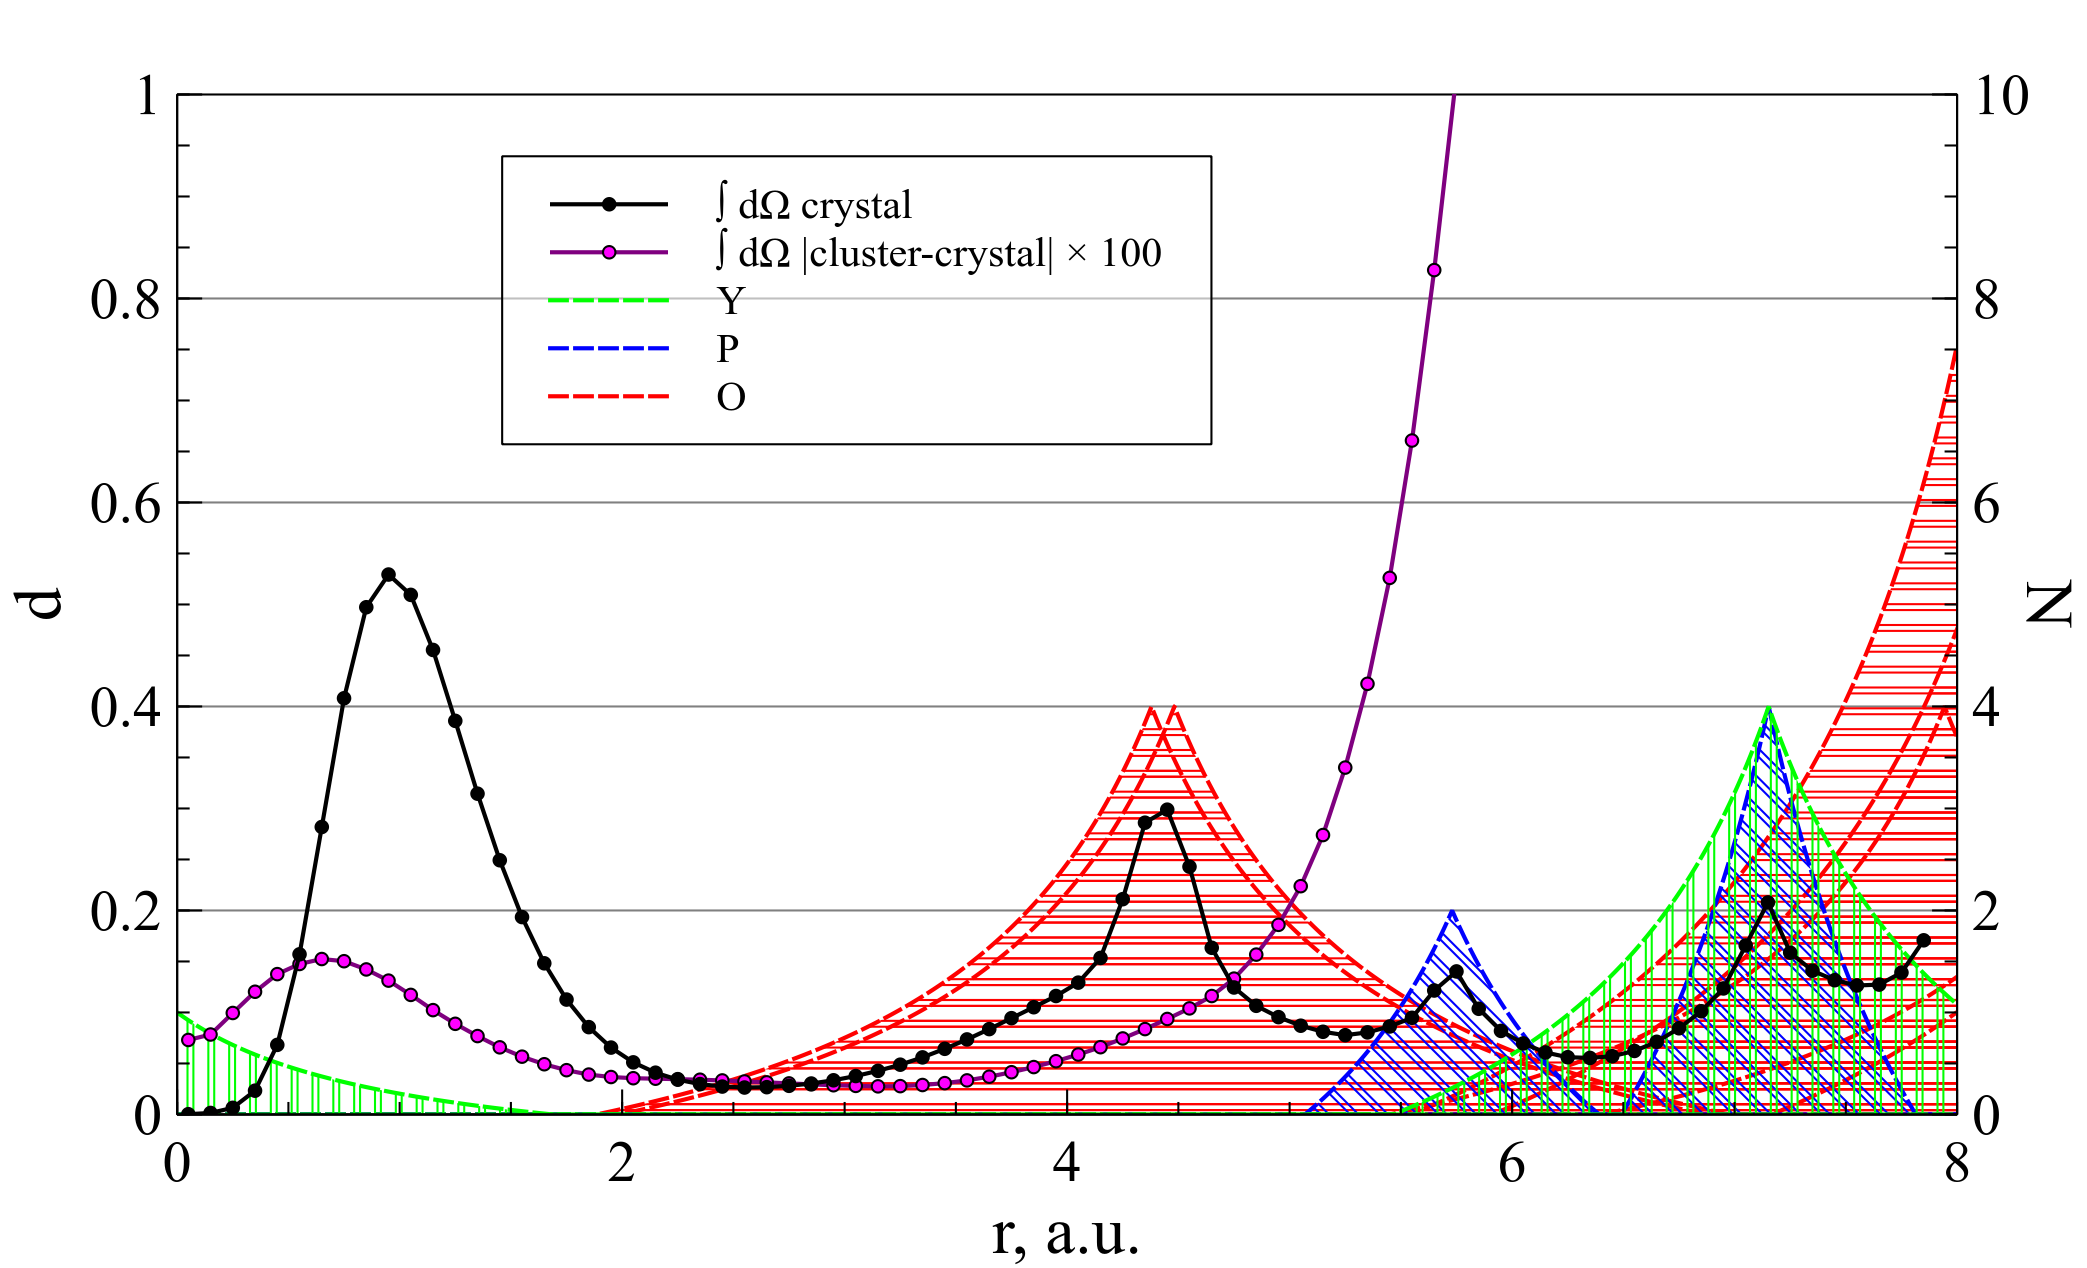
As a quantitative criterion we provide the angle-averaged difference between the cluster and crystal electronic densities, calculated by the following formula:
where the is the radius vector of the point with origin in the central atom nucleus site, the is the differential solid angle, and the represents the absolute magnitude of difference.
This value is plotted at the Figure 2 as the solid line. The bottom curves qualitatively represent the electronic density of atoms from the main cluster. The black curve is the total density, and the difference curve is multiplied by factor of 100.
.3 Properties of Th and U in xenotime
With the above constructed xenotime cluster model, effective states of impurity uranium and thorium atoms in xenotime were studied in calculations of the clusters with the above generated CTEP, in which the central yttrium atom is substituted by the U or Th atom. For both cases four different types of calculations were carried out, with 15, 14, 13 and 12 additional electrons in the main cluster (that is not neutral in the last three cases in contrast to the extended one at the CTEP generation step). The first two calculations are corresponding to the cases of X+3 and X+4 (X= Th, U) oxidation states of the appropriate defects in xenotime. While the clusters with 13 and 12 additional electrons for central uranium atom case correspond to the cases of the U+5 and U+6 oxidation states, analogous clusters with central thorium atom correspond to the Th+4 oxidation state and ionized neighboring PO4 groups (see Table 2). Positions of atoms in the main cluster with actinides were optimized to minimize its total energy. Results of these calculations are listed in Table 2.
| YPO4 111Results of the two-component DFT PBE0 calculations of the cluster models. The YPO4 column coressponds to the xenotime cluster model Y – (PO4)6-Y’22-O’104, TPO and UPO correspond to the X – (PO4)6-Y’22-O’104, X = Th, U clusters, columns (XPO)+n , , X=Th, U correspond to the ionized clusters. | TPO | (TPO)+1 | (TPO)+2 | (TPO)+3 | UPO | (UPO)+1 | (UPO)+2 | (UPO)+3 | |
| , bader charge, a. u.222The Bader net charge values of the central atom (X=Y, Th, U) are obtained with using the computer code Tang et al. (2009). It worth mentioning that the bader charges of Th and U ions with equal formal charges also approximately equal. The equal Thorium ion charge values for the cases of (TPO)+1 , (TPO)+2 and (TPO)+3 clusters prove that ionization of the PO4 group occurs instead of further ionization of the central atom in the former two cases. | 2.4 | 3.0 | 3.0 | 3.0 | 2.3 | 2.8 | 3.0 | 3.2 | |
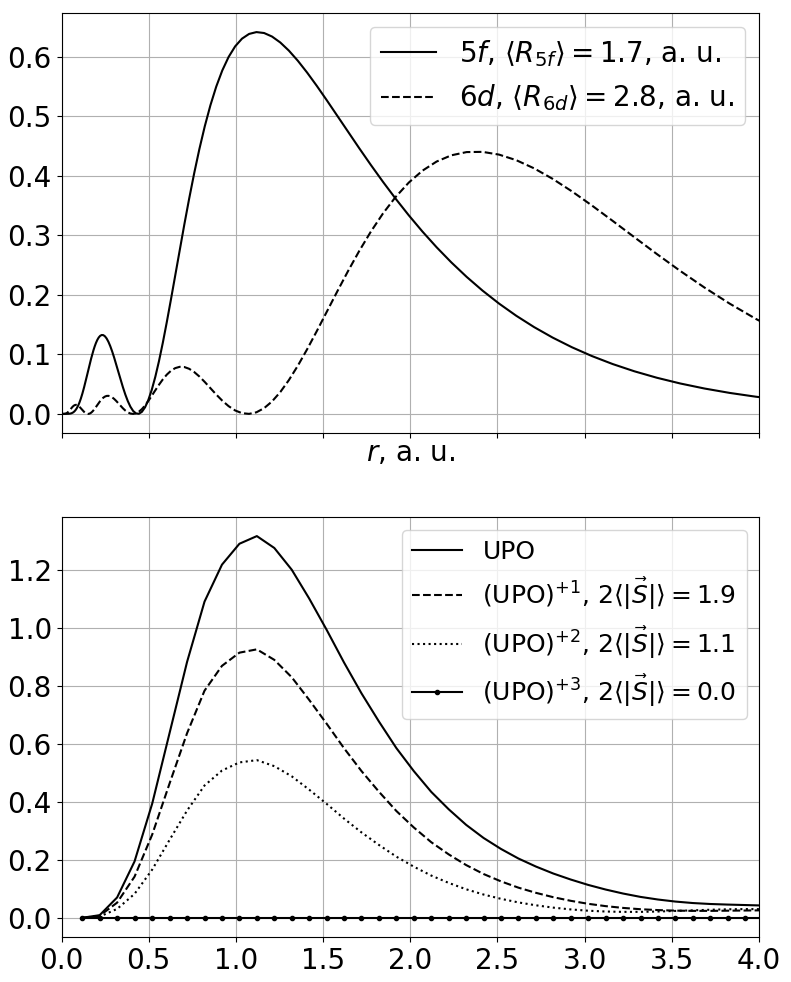
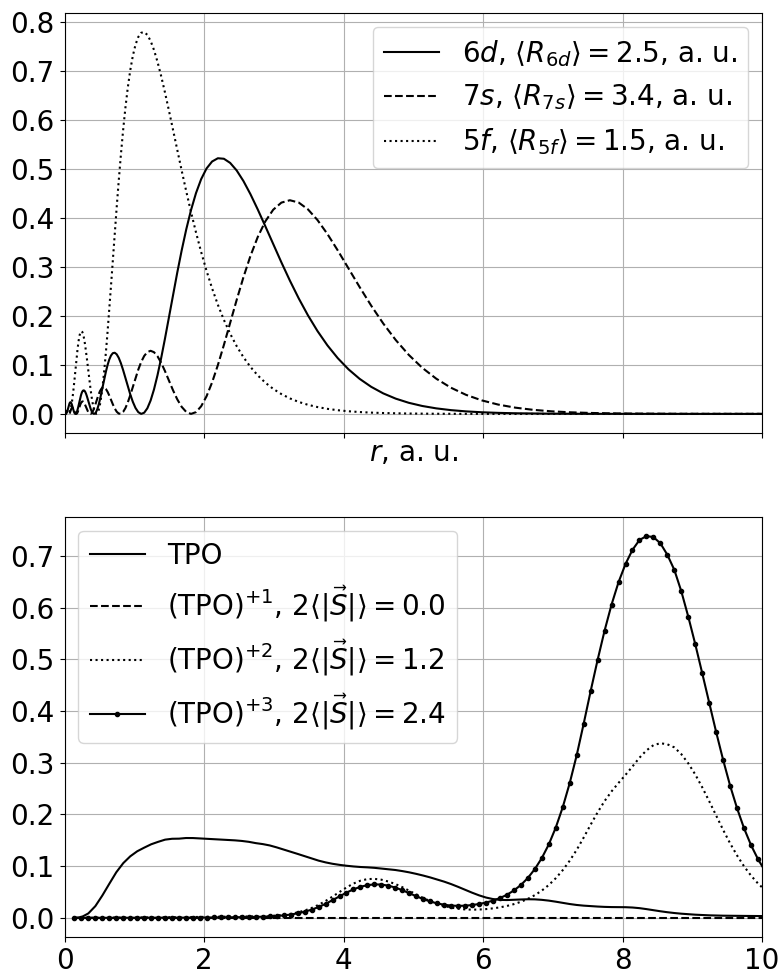
| , a. u.333 The value of total spin for the system, calculated as . For the spin density distribution in the considered clusters, see Fig 3 and Fig 4. The non-zero values of spin of the clusters (TPO)+2 and (TPO)+3 correspond to the unpaired electrons on the PO4 groups in these cases. | 1.1 | 0.0 | 1.2 | 2.4 | 2.8 | 1.9 | 1.1 | 0.0 | |
| P - O, Å444Lengths of the P – O and X – O bonds. Ionic radii of the Th+4 and U+4 (see paper Bugaenko et al. (2008) and row of this table) are approximately equal to that of the Y+3 cation. This statement agrees with that the U+4, Th+4 substitutes incapsulated in the crystal deform their nearest environment in much less extent than U+3 and Th+3 substitutes. | 1.56 | 1.56 | 1.54 – 1.58 | 1.54 – 1.58 | 1.54 – 1.56 | 1.56 | 1.55 – 1.59 | 1.54 – 1.62 | 1.51 – 1.67 |
| X - O1, Å444Lengths of the P – O and X – O bonds. Ionic radii of the Th+4 and U+4 (see paper Bugaenko et al. (2008) and row of this table) are approximately equal to that of the Y+3 cation. This statement agrees with that the U+4, Th+4 substitutes incapsulated in the crystal deform their nearest environment in much less extent than U+3 and Th+3 substitutes. | 2.32 | 2.42 | 2.32 | 2.32 | 2.32 | 2.40 | 2.29 | 2.15 – 2.34 | 2.06 – 2.10 |
| X - O2, Å | 2.37 | 2.47 | 2.40 | 2.37 | 2.4 | 2.45 | 2.37 | 2.15 – 2.34 | 2.25 – 2.29 |
| RX, Å444Lengths of the P – O and X – O bonds. Ionic radii of the Th+4 and U+4 (see paper Bugaenko et al. (2008) and row of this table) are approximately equal to that of the Y+3 cation. This statement agrees with that the U+4, Th+4 substitutes incapsulated in the crystal deform their nearest environment in much less extent than U+3 and Th+3 substitutes. | 0.9 | 1.04 | 0.94 | 1.00 | 0.89 | ||||
| , eV 555Energy of the cluster ionization , , X = U, Th calculated as difference between total energies of the corresponding systems. | – | – | 3.5 | 18.0 | 35.0 | – | 6.2 | 11.2 | 25.0 |
To determine if the cases of 14, 13 and 12 additional electrons in the main cluster correspond to the X+4, X+5, X+6 oxidation states of the central atom X (Th or U), or not, Bader’s charge analysis Bader (1998) were performed for all the studied clusters with using bader code Tang et al. (2009). The evaluated Bader net charges show that the case of 14 additional electrons corresponds to the X+4 substitute in the main cluster (X=Th, U), whereas 13 and 12 additional electrons in the main cluster correspond to X+5 and X+6 substitute only for case of X=U. Additionally, we present the spin density distribution in the clusters on Figures 3 and 4. It follows from the data that numbers of electrons on the open -shell of U correlate with the numbers of additional electrons in the cluster. Note that one cannot extract the corresponding information from the conventional population or Bader analyses since they take into account contribution of the -orbitals to U-O bonding states that largely compensate (more than on 50%) the change in the number of open -shell electrons in the clusters with different number of additional electrons.
There are experimentally measurable properties of atom in compound Titov et al. (2014) that correlate with its oxidation state. First of all they are the x-ray emission spectra chemical shifts of lines (transitions , , correspondingly, see Lomachuk and Titov (2013); Lomachuk et al. (2018)). We estimated values of the chemical shifts of the lines of thorium and uranium substitutes in xenotime with respect to the corresponding free ion by the method described in papers Titov et al. (2014); Lomachuk and Titov (2013). These data are presented in Table 3.
The evaluated Y–O and P–O bond lengths shows that the defects Th and U being in the +3 oxidation state deform crystal cell much more than those in the +4 oxidation state. This can be explained by the fact, that despite the trivalent Th and U have the same formal charge as Y+3 in YPO4, the tetravalent ones have significantly smaller ionic radii Bugaenko et al. (2008), which are comparable with that of Y+3.
The chemical shifts are evaluated for the cluster models with 14, 13 and 12 additional electrons in the considered clusters. For the cases corresponding to different oxidation states of U and Th cations in xenotime, they differ from each other by meV, while the difference between Th-centered clusters with the same oxidation state of thorium is almost zero.
| U+4111Free , U4+, Th3+, Th4+ ions with the electronic configurations calculated using the two-component DFT PBE0 framework. | U3+ | UPO 222Cluster model calculations of Uranium and Thorium atoms in xenotime (see the Table 2 and the text of the paper for details.) | (UPO)+1 | (UPO)+2 | (UPO)+3 | |
| , meV 333The chemical shifts values of the energies of Uranium and Thorium transitions in xenotime with respect to the corresponding X+4 free ion are obtained from the results of electronic structure calculations by the method described in works Titov et al. (2014); Lomachuk and Titov (2013). It is follows from the presented data, that chemical shifts of values of energies of these transitions correlate with the formal charges of corresponding Uranium and Thorium admixture ions in the xenotime, spin density distributions presented on the Fig. 3 and Fig. 4, and Bader net charge values listed in the Tabl. 2. | 0 | 259 | 189 | -10 | -174 | -285 |
| , meV 333The chemical shifts values of the energies of Uranium and Thorium transitions in xenotime with respect to the corresponding X+4 free ion are obtained from the results of electronic structure calculations by the method described in works Titov et al. (2014); Lomachuk and Titov (2013). It is follows from the presented data, that chemical shifts of values of energies of these transitions correlate with the formal charges of corresponding Uranium and Thorium admixture ions in the xenotime, spin density distributions presented on the Fig. 3 and Fig. 4, and Bader net charge values listed in the Tabl. 2. | 0 | 332 | 240 | -15 | -227 | -372 |
| Th+4 111Free , U4+, Th3+, Th4+ ions with the electronic configurations calculated using the two-component DFT PBE0 framework. | Th3+ | TPO 222Cluster model calculations of Uranium and Thorium atoms in xenotime (see the Table 2 and the text of the paper for details.) | (TPO)+1 | (TPO)+2 | (TPO)+3 | |
| , meV 333The chemical shifts values of the energies of Uranium and Thorium transitions in xenotime with respect to the corresponding X+4 free ion are obtained from the results of electronic structure calculations by the method described in works Titov et al. (2014); Lomachuk and Titov (2013). It is follows from the presented data, that chemical shifts of values of energies of these transitions correlate with the formal charges of corresponding Uranium and Thorium admixture ions in the xenotime, spin density distributions presented on the Fig. 3 and Fig. 4, and Bader net charge values listed in the Tabl. 2. | 0 | 265 | 869 | 798 | 796 | 795 |
| , meV 333The chemical shifts values of the energies of Uranium and Thorium transitions in xenotime with respect to the corresponding X+4 free ion are obtained from the results of electronic structure calculations by the method described in works Titov et al. (2014); Lomachuk and Titov (2013). It is follows from the presented data, that chemical shifts of values of energies of these transitions correlate with the formal charges of corresponding Uranium and Thorium admixture ions in the xenotime, spin density distributions presented on the Fig. 3 and Fig. 4, and Bader net charge values listed in the Tabl. 2. | 0 | 338 | 461 | 372 | 370 | 369 |
conclusions
Results of the embedded cluster calculations of properties of point defects in xenotime containing Th and U atoms are presented and discussed. The electronic structure studies are performed using hybrid DFT functional, PBE0 Adamo and Barone (1999), and different versions of the generalized relativistic pseudopotential theory Titov and Mosyagin (1999). The cluster model Y–(PO4)6–Y’22–O’104 for xenotime YPO4 was used.
The correctness of this model is justified by comparing the optimal Y-O and P-O bond lengths obtained from the cluster calculations and corresponding values from the YPO4 periodic study. Differences between the bond lengths obtained from the cluster model and periodic crystal calculations are of the order of Å and are much smaller than differences between results of the crystal structure calculations and experimental data, which are about Å. One can conclude that the errors, arising from using the cluster model are smaller by order of magnitude than those arising from using the DFT PBE0 approximation.
A good agreement of results of cluster modeling and periodic structure calculations for xenotime shows that the suggested cluster model with CTEP provides reliable data on the total energy as function of coordinates for the main-cluster atoms. This leads to the possibility of studying embedding of uranium and thorium atoms into the crystal in the framework of the suggested cluster model.
Using this model, the properties of X = U, Th in xenotime were calculated. It has been shown that the oxidation states X(III) are energetically more favorable than X(IV)( eV; to avoid misleadings arabian designation of both ionic and oxidation states for U and Th, we use below only roman designations for their oxidation states).
The x-ray emission spectra chemical shifts of lines of Th and U in xenotime compared to the free Th4+, U4+ ions were calculated within the cluster models corresponding to the U(III), U(IV), U(V), U(VI) as well as Th(III) and Th(IV) oxidation states of the actinide cations in xenotime. The chemical shifts values correlate with the formal charge of the cations, Bader net charges and spin density cluster distributions. Both Th–(PO4)6–Y’22–O’104 cluster models with 13 and 12 additional electrons describe Th(IV) oxidation state in different environments, accordingly; the thorium lines chemical shifts in these cluster models almost equal to each other.
The obtained result about energetically most profitable oxidation state uranium(III) is in somewhat contradiction with only observed oxidation state U(IV) Vance et al. (2011). As is shown here, substitution of U(III) instead of Y(III) does not lead to local geometry perturbation of the U-neighboring orthophosphate groups; they are rather shifted and rotated as a whole (xenotime-to-monazite like structure transformation) compared to the central atom. Authors of Vance et al. (2011) explained unobservability of U(III) by too reducing conditions to form trivalent U in xenotime (see “Introduction”). However, why the trivalent uranium was also not found in single-atom point defects in natural xenotime, i.e. after geologic-scale storage time?
Our calculations show (see Table 2) that ionization of any electron in the U(III)–(PO4)6 fragment leads to its [U(IV)–(PO4)6]+ state (note, that ionizing radiation is inherent to actinide-containing minerals). In turn, electron attachment (EA) to the orthophosphate groups in [U(IV)–(PO4)6]+ can hardly be suggested as expected (LUMO energy for orthophosphate group is positive) and only direct EA to vacant states of U(IV) is energetically profitable (-LUMO energy of U(IV) is a. u.) but its ionic radius (-orbital size), that is only nm compared to that of whole main cluster, nm, and high angular momentum () dramatically reduce such a probability. So, we expect that ionization of U(III)-in-xenotime is much more likely than the electron affinity in U(IV)-in-xenotime. Add here that ambient-electron transfer through the orthophosphate barrier from other defects is also unlikely. In turn, ionization of U(IV)-in-xenotime is not profitable compared to the electron affinity to U(V)-in-xenotime since the total Bader charge on neighboring orthophosphate groups, (PO4)6, is about 1.3 a.u. smaller for U(V)-in-xenotime than that for the case of lowest-energy U(III)-in-xenotime as one can see from Table 2. As a consequence, the (PO4)6 group around U(V) has a positive electron affinity in our eatimates. The detailed radiation analysis of actinide-containing xenotime is not the subject of present quantum-chemical research, it requires particular consideration elsewhere. The other reason for unobservability of U(III)-in-xenotime is that substitution of neighboring atoms by those with smaller oxidation state takes place in natural xenotime since it may also contain minor Ca(II) on Y site, Si(IV) on P(V) site, F(I) on O site and other elements, which can dramatically change the relative profitability of U(IV) vs. U(III) as is estimated here.
Acknowledgements
Calculations in the paper were carried out using resources of the collective usage centre “Modeling and predicting properties of materials” at NRC “Kurchatov Institute” - PNPI. We are grateful to Prof. C. van Wullen for the code of modeling the electronic structure with the use of two-component DFT version van Wüllen (2010) and to Demidov Yu. A. for the provided yttrium basis set. This study was supported by the Russian Science Foundation (Grant No. 14-31-00022).
References
- Maltsev et al. (2019) D. A. Maltsev, Y. V. Lomachuk, V. M. Shakhova, N. S. Mosyagin, L. V. Skripnikov, and A. V. Titov, (2019), to be published.
- Titov and Mosyagin (1999) A. V. Titov and N. S. Mosyagin, Int. J. Quantum Chem. 71, 359 (1999).
- M. (1954) G. V. M., Geochemistry (Oxford, Clarendon Press, 1954) p. 730.
- Nasdala et al. (2018) L. Nasdala, S. Akhmadaliev, A. Artac, C. Chanmuang N., G. Habler, and C. Lenz, Physics and Chemistry of Minerals 45, 855 (2018).
- Dacheux et al. (2004) N. Dacheux, N. Clavier, A.-C. Robisson, O. Terra, F. Audubert, J.-E. Lartigue, and C. Guy, Comptes Rendus Chimie 7, 1141 (2004).
- Ji et al. (2017) Y. Ji, G. Beridze, D. Bosbach, and P. M. Kowalski, Journal of Nuclear Materials 494, 172 (2017).
- Popa et al. (2016) K. Popa, M. Cologna, L. Martel, D. Staicu, A. Cambriani, M. Ernstberger, P. E. Raison, and J. Somers, Journal of the European Ceramic Society 36, 4115 (2016).
- Vance et al. (2011) E. R. Vance, Y. Zhang, T. McLeod, and J. Davis, Journal of Nuclear Materials 409, 221 (2011).
- Arinicheva et al. (2017) Y. Arinicheva, K. Popa, A. C. Scheinost, A. Rossberg, O. Dieste-Blanco, P. Raison, A. Cambriani, J. Somers, D. Bosbach, and S. Neumeier, Journal of Nuclear Materials 493, 404 (2017).
- Yingjie and Vance (2008) Z. Yingjie and E. R. Vance, Journal of Nuclear Materials 375, 311 (2008).
- Lumpkin and Geisler-Wierwille (2012) G. Lumpkin and T. Geisler-Wierwille, in Comprehensive Nuclear Materials, edited by R. J. Konings (Elsevier, Oxford, 2012) pp. 563 – 600.
- Abarenkov and Boyko (2016) I. V. Abarenkov and M. A. Boyko, Int. J. Quantum Chem. 116, 211–236 (2016).
- Bugaenko et al. (2008) L. T. Bugaenko, S. M. Ryabyh, and A. L. Bugaenko, Vestnik Moscovskogo universiteta, seriya ”khimiya” 49 (2008).
- Shakhova et al. (2019) V. M. Shakhova, Y. V. Lomachuk, D. A. Maltsev, N. S. Mosyagin, A. V. Titov, et al., arXiv (2019), to be published.
- van Wüllen (2010) C. van Wüllen, Z. Phys. Chem. 224, 413 (2010).
- Adamo and Barone (1999) C. Adamo and V. Barone, J. Chem. Phys. 110, 6158 (1999).
- Dovesi et al. (2018) R. Dovesi, A. Erba, R. Orlando, C. M. Zicovich-Wilson, B. Civalleri, L. Maschio, M. Rérat, S. Casassa, J. Baima, S. Salustro, and B. Kirtman, Wiley Interdisciplinary Reviews: Computational Molecular Science 8, 1360 (2018).
- (18) URL: http://www.qchem.pnpi.spb.ru/Basis/ , GRECPs and basis sets.
- Peintinger et al. (2013) M. F. Peintinger, D. V. Oliveira, and T. Bredow, Journal of Computational Chemistry 34, 451 (2013).
- Ni et al. (1995) Y. Ni, J. M. Hughes, and A. N. Mariano, American Mineralogist 80, 21 (1995).
- Tang et al. (2009) W. Tang, E. Sanville, and G. Henkelman, J. Phys.: Condensed Matter 21, 084204 (2009).
- Bader (1998) R. F. W. Bader, in Encyclopedia of Computational Chemistry, Vol. 1 (Wiley, Chichester, U.K., 1998) pp. 64–86.
- Titov et al. (2014) A. V. Titov, Y. V. Lomachuk, and L. V. Skripnikov, Phys. Rev. A 90, 052522 (2014).
- Lomachuk and Titov (2013) Y. V. Lomachuk and A. V. Titov, Phys. Rev. A 88, 062511 (2013).
- Lomachuk et al. (2018) Y. V. Lomachuk, Y. A. Demidov, L. V. Skripnikov, A. V. Zaitsevskii, S. G. Semenov, N. S. Mosyagin, and A. V. Titov, Optics and Spectroscopy 124, 472 (2018).
- Tupitsyn et al. (2002) I. I. Tupitsyn, G. B. Deyneka, and V. F. Bratzev, ““hfd”,” (1977–2002), hfd, a program for atomic finite-difference four-component Dirac-Hartree-Fock calculations on the base of the HFD code Bratzev et al. (1977).
- Bratzev et al. (1977) V. F. Bratzev, G. B. Deyneka, and I. I. Tupitsyn, Bull. Acad. Sci. USSR, Phys. Ser. 41, 173 (1977).