Non-uniform growth and surface friction determine
bacterial biofilm morphology on soft substrates
Abstract
During development, organisms acquire three-dimensional shapes with important physiological consequences. While the basic mechanisms underlying morphogenesis are known in eukaryotes, it is often difficult to manipulate them in vivo. To circumvent this issue, here we present a study of developing Vibrio cholerae biofilms grown on agar substrates in which the spatiotemporal morphological patterns were altered by varying the agar concentration. Expanding biofilms are initially flat, but later experience a mechanical instability and become wrinkled. Whereas the peripheral region develops ordered radial stripes, the central region acquires a zigzag herringbone-like wrinkle pattern. Depending on the agar concentration, the wrinkles initially appear either in the peripheral region and propagate inward (low agar concentration) or in the central region and propagate outward (high agar concentration). To understand these experimental observations, we developed a model that considers diffusion of nutrients and their uptake by bacteria, bacterial growth/biofilm matrix production, mechanical deformation of both the biofilm and the agar, and the friction between them. Our model demonstrates that depletion of nutrients beneath the central region of the biofilm results in radially-dependent growth profiles, which in turn, produce anisotropic stresses that dictate the morphology of wrinkles. Furthermore, we predict that increasing surface friction (agar concentration) reduces stress anisotropy and shifts the location of the maximum compressive stress, where the wrinkling instability first occurs, toward the center of the biofilm, in agreement with our experimental observations. Our results are broadly applicable to bacterial biofilms with similar morphologies and also provide insight into how other bacterial biofilms form distinct wrinkle patterns.
The intricate shapes of organisms are determined by the spatiotemporal patterns of growth as well as the mechanical properties of their underlying biological components goriely2017mathematics ; de2018physical ; genet2015heterogeneous . Three-dimensional (3D) shape transformations in developing organisms often arise via differential growth of connected tissues thompson1917growth ; goriely2017mathematics . Such asymmetric growth patterns generate compressive stresses within the faster growing tissues, which may cause mechanical instabilities klein2007shaping ; huxley1993problems ; sachs1875text . Growth-induced mechanical instabilities drive the formation of many convoluted morphologies, such as the gyrification of brains de2018physical ; tallinen2016growth ; budday2014role , the vilification and looping of guts shyer2013villification ; savin2011growth , and the branching of lungs kim2015localized as well as 3D structures of synthetic systems with patterned swelling klein2007shaping ; kim2012designing ; modes2016shape ; gladman2016biomimetic ; yang2010harnessing .
Biofilms, which are surface-associated bacterial communities encapsulated by a self-produced extracellular matrix o2000biofilm ; teschler2015living , also display a variety of 3D developmental morphologies ranging from radial stripes, to concentric rings, to disordered labyrinth and herringbone patterns serra2013microanatomy ; serra2013cellulose ; dietrich2013bacterial ; romero2010amyloid ; yan2017extracellular . In the case of Vibrio cholerae, a model biofilm former, quantitative imaging revealed a 3D undulating topography with an intrinsic wavelength that depends on the stiffnesses of both the substrate and the biofilm yan2019mechanical . Over the course of growth on an agar substrate, an initially flat V. cholerae biofilm expands and forms a 3D pattern in which a disordered core is surrounded by radial stripes extending to the edge beyhan2007smooth . These morphological transitions in V. cholerae biofilms are proposed to be caused by mechanical instabilities.
The major components of the V. cholerae biofilm matrix and their roles in defining the biofilm’s bulk and interfacial mechanical properties have been well explored yildiz1999vibrio ; yildiz2014structural ; fong2007rbmbcdef ; berk2012molecular ; fong2017structural ; teschler2015living . V. cholerae biofilms behave as soft viscoelastic solids similar to hydrogels, and possess finite adhesion to the agar surface on which they are grown yan2018bacterial . Thus, as the biofilm expands, it is mechanically constrained by the friction with the agar substrate. Mechanical compression due to constrained biofilm expansion ultimately triggers instabilities that result in out-of-plane deformation and the 3D biofilm morphology zhang2016morphomechanics ; yan2019mechanical .
A key to understanding the full 3D morphodynamics of V. cholerae biofilms involves the cells’ spatially heterogeneous physiology stewart2008physiological . Soon after the initial expansion of the biofilm, growth occurs primarily at the edge of the biofilm due to nutrient limitation near the center anderl2003role ; seminara2012osmotic ; yan2017extracellular ; yan2019mechanical . However, little is known about how this non-uniform growth profile, combined with the mechanical interaction between the biofilm and substrate, lead to the observed morphodynamics. While a mechanical basis for instability-induced pattern formation in biofilms has been suggested previously zhang2016morphomechanics ; zhang2017experimental , the dynamics of stress accumulation during biofilm expansion and the consequences for global pattern formation remain largely unknown.
Here, we determine the biophysical mechanisms controlling V. cholerae biofilm expansion and pattern formation. We show that the observed kinematic and morphodynamic features of growing biofilms are well captured by a reduced two-dimensional (2D) chemo-mechanical model. Consistent with experimentally measured velocity profiles, our model predicts three distinct kinematic stages of biofilm expansion, even before the formation of wrinkles. We also demonstrate that non-uniform growth due to nutrient depletion generates anisotropic compressive stresses in the outer biofilm region leading to radial stripes; by contrast, in the interior of the biofilm, the compressive stresses are more isotropic, leading to zigzag herringbone-like patterns. We conclude that the spatiotemporal distribution of mechanical stresses dictates the morphodynamics of experimental biofilms grown on substrates of different agar concentrations. Our model thus illustrates the mechanical principles underlying how growth drives the emergent 3D morphologies of biofilms.
Results
Biofilm morphodynamics depends on substrate stiffness
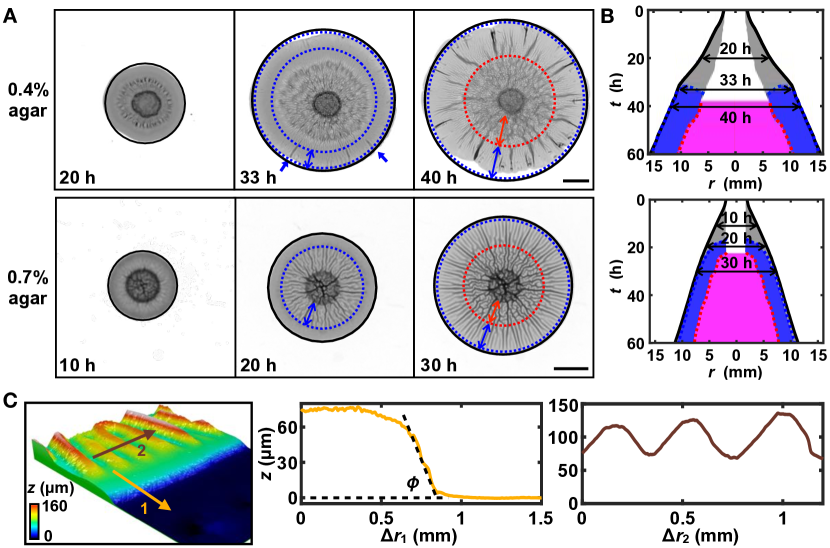
After a liquid drop inoculates V. cholerae on an agar substrate, a biofilm initially expands radially and remains flat with no recognizable morphological features except at the center where inoculation occured (Fig. 1A and B). Expansion occurs because bacteria consume nutrients from the agar substrate, proliferate, and produce extracellular matrix. Growing biofilms adhere to the non-growing agar substrate, and the sliding friction between biofilm and agar mechanically constrains biofilm expansion. Thus, growing biofilms become compressed and build up mechanical stresses. When the compressive stress reaches a critical value, a mechanical instability generates wrinkles (Fig. 1A). Wrinkles are vertical deformations of the biofilm together with the adhered substrate with a characteristic wavelength (Fig. 1C) that depends on the thickness of the biofilm and on the mechanical properties of the biofilm and the agar substrate yan2019mechanical ; chen2004herringbone ; huang2005nonlinear . Subsequently, as compressive stresses continue to build up, a biofilm can partially detach from the agar substrate, forming delaminated blisters yan2019mechanical . In this manuscript, however, we restrict our focus to exploring the original wrinkle patterns outside the inoculation core – localized cell death has been shown to facilitate pattern formation inside the inoculation core asally2012localized .
Notably, the development of wrinkle patterns depends on the stiffness of the agar substrate. For V. cholerae, after about 30 h of growth on soft substrates (low agar concentration), a pattern of radial wrinkles initially appears at the outer edge of the biofilm and subsequently propagates towards the center (Fig. 1A and B, top). By contrast, on stiff substrates (high agar concentration), radial wrinkles initially form near the center and propagate outward (Fig. 1A and B, bottom). After about 40 h of growth, herringbone-like zigzag patterns emerge in the central region, surrounded by the outer region of radial stripes. Both of these regions expand outward at approximately the same speed as the expanding edge of the biofilm (Fig. 1B). In this steadily expanding state, surface profiling by confocal microscopy reveals a wedge-shaped rim (m in width) with a constant leading angle , followed by a narrow region (m in width) of nearly constant height, followed, in turn, by the region of radial stripe patterns (Fig. 1C).
Chemo-mechanical model of biofilm development
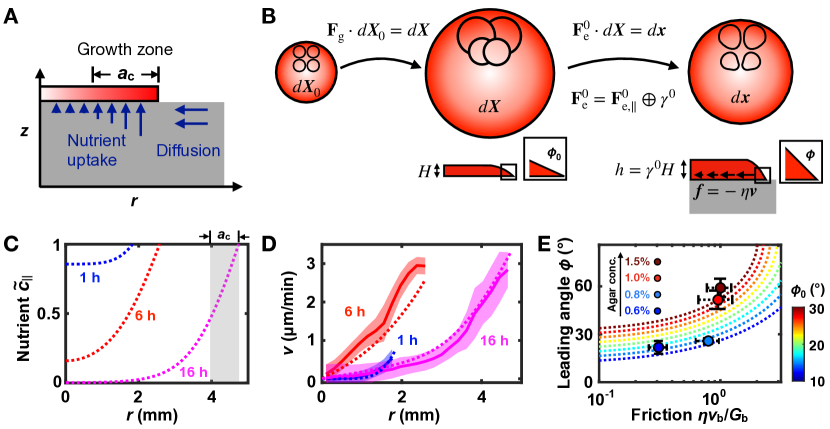
To understand the observations described in the previous section, we developed a chemo-mechanical model of biofilm development that takes into account the diffusion of nutrients and their uptake by bacteria (Fig. 2A), growth of the biofilm, mechanical deformation of the biofilm and the agar substrate, and the friction between them (Fig. 2B). In this section, we focus on the early stage of development, when the biofilm surface is still flat. We denote by superscript 0 the deformations of the flat biofilm. The modifications of the model required to describe the wrinkled morphologies are discussed in a later section.
The kinematics of biofilm development are described by a time-varying mapping between an internal material coordinate system and the laboratory frame , i.e. . Following the finite-strain formalism ogden1997non , we define the deformation gradient , which captures the local change in shape and volume of a biofilm relative to its initial configuration. The overall change in shape arises from both growth and mechanical deformation. Accordingly, we follow the convention of multiplicative decomposition rodriguez1994stress ; goriely2005differential ; dervaux2008morphogenesis , and decompose into a contribution due to growth (which results in a post-growth intermediate configuration , where neighboring regions may overlap creating incompatibility; Fig. 2B) and a contribution due to elastic deformation, characterizing the reorganization required to ensure compatibility (deformed contours in Fig. 2B). Using this theoretical framework, we next specify our model of biofilm growth and mechanics (see also Supplementary Notes I and II for details).
During development, V. cholerae biofilms on agar stabilize at a thickness of roughly 100 m, which is set by the penetration depth of oxygen costerton1995microbial , and subsequently extend primarily in 2D along the substrate. Experimentation shows that bacterial cells in V. cholerae biofilms grown on agar do not locally order in the horizontal directions yan2018bacterial . Therefore, we model the growth part of the deformation gradient as , reflecting an isotropic increase in size in the planar direction by a factor , and neglecting growth in the vertical direction (the thickness of the undeformed biofilm is assumed to be constant). The thin-film geometry also permits a simplified 2D representation of a biofilm in which physical quantities are expressed as functions of an in-plane coordinate .
In order to account for nutrient-dependent biofilm growth, we consider the kinematics of a 2D nutrient field :
| (1) |
Here, is the diffusion constant, spatial derivatives are taken with respect to , and the final term describes the uptake of nutrients by bacteria according to the Monod law monod1949growth , where is the concentration of nutrients at the half-maximal uptake rate, is the maximum uptake rate per unit area in the intermediate grown configuration, and the factor is included to account for the change in areal density of bacteria due to elastic deformation (see Methods and description below). The growth field evolves in time according to the consumption of nutrients , where the growth rate is related to the Monod law described above (see Supplementary Note II for details). This reduced 2D model provides a reasonable approximation to the full 3D diffusion dynamics of nutrients in the agar (see Supplementary Note IIE and Figs. S2 and S3). Importantly, the 2D model is sufficient to capture the spatially non-uniform growth that plays an essential role in biofilm morphodynamics.
Mechanically, we model the biofilm as a plane-stress thin film, where it is assumed that the stress components perpendicular to the biofilm surface are negligible. The plane-stress simplification allows for the elastic deformation to be decomposed into the in-plane compression and the vertical stretch (see Supplementary Note IIB and Fig. 2B), leading to a quasi-2D description of a biofilm with varying thickness .
In our model, mechanical stresses in the biofilm arise from elastic deformation, and are specified by the constitutive relation , where is the in-plane stress tensor. Biofilms are complex hydrogel-like materials, whose constitutive relations are well approximated by nearly incompressible neo-Hookean elasticity (see Supplementary Note IIF and Fig. S4). Here, we modeled the biofilm as an incompressible neo-Hookean elastic material budday2014mechanical ; shyer2013villification ; tallinen2016growth , but our results are largely insensitive to any plausible choice of rheological model for the biofilm (see Supplementary Note VII and Fig. S14).
We obtain the expansion velocity of a growing biofilm from a differential equation for local force balance,
| (2) |
Here, we assume that friction between the growing biofilm and the agar arises from binding and unbinding of biofilm matrix polymers with the adhesive biofilm proteins that have been secreted onto the agar surface berk2012molecular . In particular, we model the friction as viscous friction, and we assume the friction coefficient to be proportional to the shear modulus of the agar substrate walcott2010mechanical ; sens2013rigidity ; schwarz2013physics (see Supplementary Note IIG and Fig. S5). The partial differential equations for this model were solved numerically in the Lagrangian coordinate system with the open source computing platform FEniCS (see Methods for details). Next, we present model results for the early stages of biofilm development, prior to wrinkling.
Biofilm expansion has three kinematic stages
In the model, nutrients are gradually depleted underneath the growing biofilm (Fig. 2C). Once a steadily expanding state is achieved after about 15 h, most of the growth is restricted to the narrow nutrient-rich zone near the rim of the biofilm (Figs. 2C and S3), which is consistent with experiment yan2019mechanical .
Our model predicts three stages of biofilm expansion with distinct radial velocity profiles (Figs. 2D and S6), where is the distance from the center of the biofilm. In the initial stage, the interior of the biofilm is stationary while the biofilm edge moves slowly outward. The magnitude of radial velocity and the size of the moving region gradually increase until, at the second stage, the entire biofilm undergoes uniform expansion with a radial velocity that is linearly proportional to . At later times, in the third stage, the biofilm expansion in the central region slows due to the depletion of nutrients while the edge of the biofilm continues to move outward with a steady velocity (Fig. S6). These three kinematic stages are also observed in experiments and our model predictions closely match the measured velocity profiles (Fig. 2D).
The three kinematic stages can be understood in the following way: During the first stage, which corresponds to early times ( where is the maximal growth rate of a biofilm), friction with the agar substrate prevents the growing biofilm from expanding radially in the central region. As stresses gradually build up (Fig. 3A and B), the width of the mobile annular zone at the biofilm edge increases in proportion to (see Supplementary Note III and Fig. S7). The second stage ensues once this mobile zone spreads through the entire biofilm, so that the radial velocity becomes approximately a linear function of the distance from the center (see Supplementary Note III and Figs. 2D and S8). The third stage follows once the nutrients in the central region are depleted, which slows down biofilm growth and reduces the radial velocity in that region (Fig. 2C and D).
Higher friction increases the biofilm leading angle
We next investigate how friction shapes the edge of an expanding biofilm. Specifically, we consider the local deformation of the wedge-shaped edge of a biofilm when sliding on a surface with velocity . The surface provides a frictional shear force of magnitude acting on the bottom of the biofilm edge, and thus generates a simple shear parallel to the horizontal plane. This shear deformation increases the leading angle from in the rest state to in the deformed state (Fig. 2B).
To quantify how the biofilm leading angle increases with friction, we decomposed the elastic part of the deformation gradient into the product of rotations and principal stretches to connect the geometry, characterized by the angles and , to the stress state of the biofilm edge (see Supplementary Note IV and Fig. S9). This analysis yields the following relation
| (3) |
between the leading angle and friction, where denotes the scaled friction normalized by the biofilm shear modulus , and describes the circumferential compression at the biofilm edge. In the absence of friction, i.e., when , Eq. (3) reduces to . In the presence of friction, our analysis predicts that the leading angle increases with when , while the biofilm edge bulges out and constantly tumbles (no steady-state translation) if .
The experimental difficulty in measuring the friction coefficient and the circumferential compression precludes a direct quantitative comparison with theory; nevertheless, it is clear from the measured of experimental biofilms that higher friction (i.e., higher concentration agar) increases the biofilm leading angle (see Methods and Figs. 2E and S9).
Non-uniform biofilm growth results in anisotropic stress
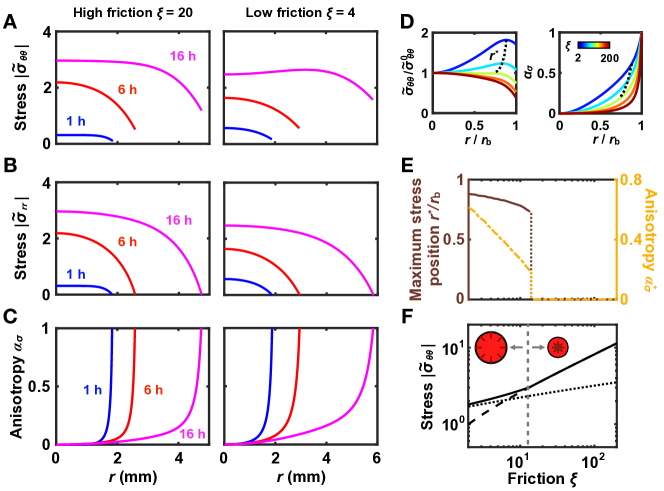
The evolution of mechanical stresses during the early stages of biofilm growth dictates the onset of mechanical instability and the consequent morphology of the wrinkles. Thus, we investigate the evolution of the magnitude of radial stress , the magnitude of circumferential/hoop stress , and the stress anisotropy defined as chen2018stress . The isotropic stress state corresponds to , while pure hoop stress corresponds to and pure radial stress corresponds to .
The spatial distributions of stresses have distinctive characteristics during each of the three kinematic stages of biofilm expansion. Initially, the inner core of the biofilm only minimally expands (), which, given the material growth of the biofilm, , must result in a compensating isotropic in-plane deformation (), and thus an isotropic compressive stress state with (Figs. 3A-C). Moreover, stresses are approximately uniform in magnitude throughout the immobile core region of the biofilm, but decline in the outer mobile region. Note that the value of radial stress necessarily decreases to zero at the edge of the biofilm, while the hoop stress can be nonzero. Therefore, the stress anisotropy is initially localized to the outer mobile region.
As the biofilm continues to grow, internal stresses increase exponentially in time, and eventually overcome friction, enabling the entire biofilm to expand uniformly (Figs. 2D and 3A-C). During this second stage, mechanical stresses continue to increase exponentially and acquire a characteristic parabolic profile (see Supplementary Note III and Fig. 3). During the third stage when nutrients become depleted, stresses increase more slowly near the center of the biofilm due to the reduced rate of biofilm growth, while the magnitude of hoop stress near the edge still increases exponentially due to continuous biofilm growth in this nutrient-rich region (Fig. 2C). As a result, when friction is low, the location of the maximum hoop stress shifts away from the center of the biofilm during the later stages (Fig. 3A). Note that the stress anisotropy is always positive (Fig. 3C), meaning that the compressive hoop stress is always larger in magnitude than the radial stress.
We found that the region of the biofilm under anisotropic stress becomes larger during the third stage of development (Fig. 3C). Thus, we hypothesized that the non-uniform growth pattern due to depletion of nutrients plays an important role in generating anisotropic stresses. To quantify the extent of stress anisotropy for the entire biofilm, we computed the normalized range of anisotropy , defined as the radial range of the area where relative to the biofilm radius , as a function of time. According to our model, the increase of is accompanied by a narrowing of the nutrient-rich zone (Fig. S10). To further explore this connection, we also computed the normalized anisotropy range for a uniformly growing biofilm, which we found to be close to zero (Fig. S10). We conclude that the faster growth at the biofilm edge promotes predominantly circumferential stress (see Supplementary Note V), which explains the appearance of radial wrinkles in the peripheral regions in experiments (Fig. 1A).
Friction favors isotropic stress and shifts the position of maximal circumferential stress
How does friction affect the distribution of mechanical stresses in a growing biofilm? To address this question, we compared the distribution of circumferential stress and stress anisotropy for a series of simulations with different friction coefficients (see Fig. 3D). Notably, at a typical time when biofilms start to form patterns in experiments, our simulations show that the radial position , corresponding to the maximal circumferential stress, varies with the magnitude of friction: is near the biofilm edge when friction is small, while is near the biofilm center when friction is large (Figs. 3D and E). Moreover, the stress anisotropy at decreases towards zero (isotropic stress state) with increasing friction (Fig. 3D and E).
Intuitively, these differences in stress distribution result from the counteracting effects of friction and non-uniform growth. Friction impedes biofilm expansion ( when ), retards the relaxation of growth-induced isotropic compression ( when ), and thus favors isotropic stress in the biofilm center. By contrast, non-uniform growth favors peripheral circumferential stress due to the mismatch between the biofilm perimeter that increases only linearly in time, and the exponential material growth of the biofilm at the edge. The fact that when friction is small the circumferential stress close to the biofilm rim is larger than that at the center (Fig. 3D and F) explains why, in experiments, the wrinkle pattern emerges from the outer region (Fig. 1A and B). In contrast, in experiments with high concentration agar, the wrinkle pattern first appears in the center of the biofilm because the large friction results in strong isotropic compression in that region.
The in-plane stress field determines the morphology of biofilm wrinkle patterns
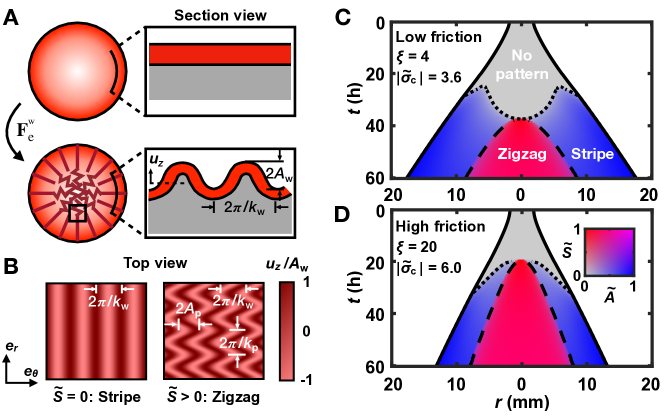
Lastly, we address how the stress profiles discussed above dictate the morphology of biofilm wrinkles. As the biofilm grows, the magnitude of compressive stresses increases (Fig. 3). Once compressive stresses reach a critical value , the flat state becomes unstable to the formation of wrinkles cai2011periodic ; audoly2008buckling ; yan2019mechanical . The critical compressive stress increases with , and scales as in the asymptotic limit where the shear modulus of the biofilm is much larger than that of the agar substrate (see Methods and yan2019mechanical for details). It was previously shown that, for highly anisotropic stresses, wrinkles are oriented orthogonal to the direction of maximum compressive stress, whereas for isotropic stresses, wrinkles form zigzag herringbone-like patterns cai2011periodic ; audoly2008buckling (Fig. S11). The stress profiles in Fig. 3 are thus consistent with the experimental observations in Fig. 1A that radial wrinkles form in the outer regions, where the stress is predominantly circumferential, whereas zigzag wrinkles form in the core region where the stress is largely isotropic.
In order to more quantitatively understand the spatiotemporal evolution of biofilm wrinkle patterns, we developed a 2D coarse-grained model that employs two scalar order parameter fields and to describe, respectively, the amplitude and the shape of the wrinkle patterns. Specifically, corresponds to the flat (wrinkled) state, and () corresponds to striped (zigzag) wrinkles. The total elastic deformation of a biofilm is decomposed as the superposition of the wrinkling deformation , which also deforms the agar, and the planar compression (Fig. 4A). We follow previous work cai2011periodic ; audoly2008buckling to describe wrinkles of different morphologies, and we use the herringbone ansatz to approximate the out-of-plane displacement in coarse-grained patches of the biofilm (see Supplementary Note VI and Fig. 4B). The primary sinusoidal wrinkling with amplitude (in the vertical direction) and wavelength occurs along the direction that corresponds to the maximum compressive stress (circumferential direction in our case). The secondary sinusoidal wiggles with amplitude (in the horizontal direction) and wavelength appear in the orthogonal direction (Fig. 4B). In terms of these quantities, the relevant dimensionless order parameters are and .
The formation of wrinkles relaxes the elastic compressional energy of the biofilm, but at the expense of the bending energy of the biofilm and the elastic deformation energy of the agar. By taking into account these energy contributions and using the above ansatz for the shape of wrinkles, we derived the following total free-energy density per unit area (see Supplementary Note VI)
| (4) | |||||
which is valid for stresses near the critical stress of the wrinkling instability. Here, stresses are normalized by the biofilm shear modulus . and , respectively, denote the circumferential and radial pre-stress due to the planar compression . We set to ensure that the relaxed stresses due to wrinkling remain isotropic when the imposed pre-stress is isotropic (see Supplementary Note VI).
Here, we assume that the dynamics of wrinkling is determined by the slower dynamics of the stress field. Under this approximation, the predicted wrinkled morphology corresponds to the minimum of the free energy in Eq. (4). The wrinkling instability occurs via two successive continuous phase transitions controlled by the magnitude and by the anisotropy of the pre-stress (see Supplementary Note VI and Fig. S11). The primary bifurcation from the planar state () to the wrinkled state () occurs if the magnitude of the maximum compressive stress exceeds the critical value , while a secondary bifurcation from striped wrinkles () to zigzag wrinkles () occurs only when the stress anisotropy is sufficiently small, . Note that for isotropic compressive pre-stresses () the free-energy density is minimized by .
The evolution of the stress field determines the biofilm wrinkling morphodynamics
Wrinkling relaxes the mechanical stresses in the biofilm by releasing the in-plane compressive strain through out-of-plane deformation. Once wrinkling occurs, this relaxation mechanism prevents the magnitude of compressive stresses from increasing beyond the critical stress (see Methods, Supplementary Note VI and Fig. S11).
We incorporated the above mean-field description of the wrinkling instability and consequent stress relaxation into our chemo-mechanical model (see Methods and Supplementary Note VI for details). Consistent with the experimental observations in Fig. 1B, we find that for biofilms grown on low concentration agar (low shear modulus of the substrate and small friction since we assume ), radial wrinkles initiate near the outer edge, then propagate inward and once they reach the center, zigzag wrinkles form in the core region (Fig. 4C). On the other hand, for biofilms grown on high concentration agar (high shear modulus of the substrate and large friction) radial wrinkles initiate in the center and expand outward, while zigzag wrinkles simultaneously appear in the core region (Figs. 1B and 4D). According to our model, compared to the case where the wrinkling instability is prevented, the expansion of the wrinkled biofilm is slowed, the stress anisotropy is reduced, and the magnitude of compressive stress is reduced as well (Figs. S11 and S12). Thus, our model suggests that wrinkling due to a growth-induced mechanical instability feeds back and further influences biofilm expansion and pattern formation by modifying the distribution of internal stress.
Discussion
Our experimental and modeling results highlight the connections between nutrient supply, bacterial growth, biofilm and substrate mechanics, and friction in shaping the morphology of developing bacterial biofilms on soft substrates. The depletion of nutrients beneath the center of the biofilm leads to localized growth primarily near the biofilm edge, consistent with previous experiments yan2019mechanical ; srinivasan2019multiphase ; liu2015metabolic . This uneven growth profile, in turn, produces anisotropic compressive stresses, which are predominantly circumferential at the periphery of the biofilm, but are largely isotropic in the central region. The consequence of such a stress profile is the formation of radial wrinkles in the outer region of the biofilm and a zigzag herringbone-like pattern in the central region. Moreover, the location of the maximum circumferential stress – where wrinkles first appear once the magnitude of the stress reaches a critical value – varies with the magnitude of friction, from near the outer edge when friction is small to near the center when friction is large. As a result, for biofilms grown on soft agar substrates with low friction, wrinkles first appear in the peripheral region and propagate inward. In contrast, for biofilms grown on stiff agar substrates with high friction, wrinkles first appear in the central region and propagate outward.
What are the biological implications of forming 3D biofilm structures? One possibility is that the wrinkled thin film structure provides a larger surface area-to-volume ratio compared to a flat film, thereby enhancing access to nutrients and conferring growth advantages to the bacterial population kempes2014morphological ; stewart2008physiological . Furthermore, under adverse nutrient conditions, biofilms disassemble through a process called dispersal, and dispersing cells primarily depart from the biofilm’s outer surface singh2017vibrio . Therefore, the large surface area of wrinkled biofilms may facilitate dispersal when submerged. The convoluted 3D structure of biofilms also reduces the average distances between cells compared to a flat film of the same area, which might enhance communication between bacterial cells, e.g. via quorum-sensing signaling miller2001quorum ; hammer2003quorum . Finally, the 3D biofilm structure positions biofilm cells at different heights, potentially generating a “bet hedging” strategy under particular conditions. For example, the rough surfaces of wrinkled biofilms exposed to external flows will alter the flow field, forming large (small) shear stress zone near the peaks (valleys) of wrinkles. Consequently, the cells near the peaks will exhibit a larger probability to detach while the cells near the valleys will tend to stay attached to the surfaces. shen2015role .
Our results provide insight into the spatiotemporal development of V. cholerae biofilm morphology, but it remains to be explored whether and how the increasing mechanical stress and/or the formation of the 3D biofilm structure affect the proliferation rate of bacteria, alter biofilm matrix production, or promote survival success of cells in particular biofilm regions. Additional experimental studies will be required to complete our understanding of how growth, mechanical stresses, and morphological transitions are coupled to drive biofilm development. Furthermore, our study focused only on the initial stages of wrinkling, during which the amplitudes of wrinkles are small and biofilms remain in contact with the agar substrate. We previously demonstrated that at later stages of development, biofilms can locally delaminate from the agar substrate, which significantly influences the subsequent development of morphological patterns yan2019mechanical .
In this work, we modeled the rheology of growing V. cholerae biofilms as that of a hyperelastic material. However, our previous measurements show that V. cholerae biofilms actually behave as more complex viscoelastic media that yield upon large shear deformation yan2018bacterial . Indeed, our elastic material model leads to stresses that are larger than the measured yield stress. We thus suspect that yielding constantly occurs during V. cholerae biofilm growth. More generally, reorganization and yielding of growing biological materials are commonly observed during morphogenesis, for example in plants dumais2006anisotropic , fruit flies he2014apical ; guirao2017biomechanics and brain tissues foubet2018mechanical . Thus, the effects of viscoelasticity matoz2019wrinkle and elastoplasticity (Figs. S13 and S14) of biofilms on their morphological development will be an important topic for future studies.
The concepts we presented here to analyze the development of V. cholerae biofilms should also be applicable to biofilms of many other bacterial species that form similar morphological patterns wilking2013liquid ; dervaux2014growth ; haussler2013biofilms . However, there are also examples of biofilms with distinct morphologies, such as the distorted concentric rings observed in wild-type Pseudomonas aeruginosa PA14 biofilms madsen2015facultative and biofilms formed by Escherichia coli K-12 strain W3110 serra2013microanatomy . Our model suggests that if biofilm growth and/or matrix production is faster in the central region than the outer region, one expects a region in which the radial compressive stress surpasses the circumferential stress. In this case, our model predicts that wrinkles will form as concentric (possibly distorted) rings (see Fig. S11). Such a pattern of matrix production is indeed reported in the two biofilm formers mentioned above. For example, in wild-type P. aeruginosa biofilms, cells at the biofilm center display upregulated matrix production due to oxygen limitation, whereas cells located in the oxygen rich periphery downregulate matrix production madsen2015facultative . In biofilms formed by E. coli K-12 strain W3110, cells generate matrix components (amyloid curli fibers) only upon entry into stationary phase when nutrients are depleted, which typically occurs first at the biofilm center serra2013microanatomy . Thus, we expect that similar physical mechanisms to those underlying the dynamics of expansion and pattern formation of V. cholerae biofilms may be widely applicable to other bacterial biofilms, including those with distinct morphologies.
Materials and Methods
Growing and imaging experimental biofilms
Bacterial strain and biofilm growth
The V. cholerae strain used in this study is a derivative of the V. cholerae O1 biovar El Tor strain C6706str2 thelin1996toxin that harbors a missense mutation in the vpvC gene (VpvC W240R), which elevates the levels of c-di-GMP and confers a rugose biofilm phenotype beyhan2007smooth . Standard lysogeny broth (LB) medium solidified with different percentages of agar was used as the solid support on which biofilms were grown. Initially, V. cholerae was streaked onto LB plates containing 1.5% agar and grown at 37∘C overnight. Individual colonies were selected and inoculated into 3 mL of LB liquid medium containing 10 glass beads (MP Biomedicals Roll and Grow Plating Beads, 4 mm diameter) and these cultures were then grown at 37∘C with shaking to mid-exponential phase (about 5 h). Subsequently, the cultures of bacteria were mixed by vortex to break changeclumps up into individual cells, the OD600 was measured with a cell density meter (Amersham Biosciences Ultrospec 10), and then the cultures were diluted back to an OD600 value of 0.5. 1 L of these preparations were spotted onto pre-warmed agar plates made with different concentrations of agar. Subsequently, the plates were incubated at 37∘C. During the first 10 h after inoculation, bacterial colonies formed the initial biofilms without extending beyond the inoculated circle (radius mm). These biofilms were used as the initial/reference configurations for modeling, with in our simulations corresponding to the time when a biofilm starts expanding radially. Four biofilms were grown per agar plate for the surface topography measurements, while for the time-lapse imaging, one biofilm was grown on each agar plate.
Time-lapse transmission imaging
The imaging system has been described previously yan2019mechanical . Briefly, an agar plate containing the inoculum was placed on an LED illumination pad (Huion L4S Light Box) and imaged with a Nikon D3300 SLR camera equipped with a Sigma 105 mm F2.8 Macro Lens. The entire setup was placed in a 37∘C environmental room and was covered to exclude light. The camera was controlled with DigiCamControl software. Imaging started 5 h after inoculation when the camera was capable of focusing on the growing biofilms. Image snapshots were taken automatically every 15 min for 3 days.
Image processing
The protocol and Matlab codes used to analyze the morphological features of biofilms have been reported previously yan2019mechanical . In brief, an intensity-based thresholding method was used to binarize the pre-processed transmission images (using a built-in thresholding function in Matlab) and to separate the biofilm region from the background. For each biofilm, the transmission image taken 12 h after inoculation was used to define the biofilm center for the entire time course. The biofilm radius was computed by averaging the distance between each point on the circumference and the center.
Regions of the biofilm were binned into rings of width for further analysis. First, we took the Fourier transform of the image intensity in the circumferential direction for each separate ring at distance from the center of the biofilm. Radial stripes appear in the resulting power spectrum as a sharp maximum at non-zero spatial frequency . The radial coordinate, at which the peak power instead appears at zero spatial frequency, was defined as the boundary of the region with a radial stripe pattern. Next, the radial intensity distribution was obtained by averaging the intensity values over the circumferential direction for each ring. The intensity for the disordered core is distinctly different (darker) from that of the outer region of the biofilm. Thus, we set a threshold intensity value for each biofilm to identify the central region with a disordered zigzag pattern, enabling us to measure this central region’s radius as a function of time.
The velocity field of an expanding biofilm was measured by particle image velocimetry (PIV) performed with the open source tool PIVlab thielicke2014pivlab . The 2D displacement field between two successive frames (separated by 30 min) was computed via a Fourier transform correlation with three passes. The sizes of interrogation windows for the three passes were chosen to be 128 pixels, 64 pixels, and 32 pixels, respectively. By averaging the radial components of the coarse-grained velocity vectors over the circumferential direction for each ring, we obtained the radial velocity field in Fig. 2D. Error bands correspond to standard deviations of the means.
3D confocal profiling and leading angle measurement
The surface profiles of biofilms grown for different times were analyzed with a Leica DCM 3D Micro-optical System. A 10 objective was used to image a roughly 3 mm 3 mm region of the biofilm, with a step size of 2 m in the direction. Subsequent processing and analyses were performed using Leica Map software. First, the three-point flattening procedure was performed on the agar surface to level the image. 3D views of biofilms were then rendered with a built-in function in the software.
To measure the leading angle of an expanding biofilm, line profiles perpendicular to the biofilm periphery and spanning the region from the agar surface to the top surface of the biofilm were generated at five different locations. For each line profile, two points were manually selected on the biofilm edge, which were used to obtain a sloped line. The leading angle was then extracted with a built-in function in the software from the slope of this line. The measurements of the initial angle were performed 12 h after inoculation. The steady-state leading angles were measured every 4 h from 24 h to 48 h after inoculation.
Modeling biofilms
Continuum modeling
To model the combined role of growth and mechanics in the morphological transition of V. cholerae biofilms, we adopted the formulation of elastic growth rodriguez1994stress ; goriely2005differential , where the total geometric stretches , defined as the deformation gradient from the initial configuration to the current configuration , are decomposed into stretches due to growth and stretches due to elastic deformation. Below, we describe a 2D chemo-mechanical model of biofilm development that includes diffusion of nutrients and their uptake by bacteria, bacterial growth/extracellular matrix production, and mechanical deformation. The subscript is used to denote the in-plane components of 3D vectors/tensors and reduced 2D variables, while a tilde above a variable is used to denote a dimensionless variable.
Growth: Local growth of the V. cholerae biofilm is treated as horizontal isotropic growth, i.e., , where denotes the 2D identity matrix. describes the stretch in the horizontal direction due to growth, while there is no growth in the direction because biofilms maintain approximately constant thickness. The stretch due to growth evolves as , where denotes the local growth rate. To capture the nutrient-dependent spatially non-uniform growth, is assumed to be a function of the normalized 2D nutrient field (normalized by the concentration of nutrients at the edge of the biofilm, i.e., ), which reflects the nutrient availability in the agar medium. The equation that describes diffusion and uptake of nutrients is , where is the nutrient diffusion coefficient, characterizes the maximum nutrient uptake rate by bacteria in the undeformed grown configuration, and is introduced to account for the increased areal density of bacterial cells upon elastic deformation of the biofilm. The characteristic width of the nutrient-rich annulus near the biofilm edge is given by . We assume that the uptake of nutrients depends on the local availability of nutrients via the Monod law, i.e., , where is the concentration of nutrients at the half-maximal uptake rate monod1949growth (Note that our model results are insensitive to the specific choice of : for a different , a similar profile can be obtained by adjusting the uptake rate ; see below for the fitting procedure). Finally, the growth rate is specified as , where is the maximum rate of nutrient-dependent growth and a small, constant nutrient-independent growth rate is added to account for the residual biofilm growth due to the vertical diffusion of nutrients (see Supplementary Note II and Figs. S2 and S3).
Mechanics: The growth of the biofilm drives its expansion. As the biofilm moves relative to the agar, the friction between the biofilm and the agar impedes biofilm expansion and induces internal mechanical stresses . Friction is modeled as a viscous drag, i.e., , which is proportional to the expansion velocity of the biofilm , and the drag coefficient is assumed to be proportional to the agar shear modulus walcott2010mechanical ; zemel2010optimal ; marcq2011rigidity ; sens2013rigidity ; schwarz2013physics (see Supplementary Note IIG and Fig. S5). In order to relate stress to elastic deformation , we leverage the fact that the thickness of the biofilm (m) is always about 10 to 100 times smaller than its radius ( mm), and we treat the biofilm as a plane stress thin film made from nearly incompressible hyperelastic material. Thus, the thin-film deformation is decomposed into the product of a wrinkling deformation and a planar deformation , where denotes the in-plane compression and denotes the resulting vertical stretch. Lateral force balance yields , where denotes biofilm thickness in the undeformed configuration, and is a factor that accounts for the increase of the contact area between the biofilm and the agar due to the wrinkling profile.
Prior to wrinkling, the biofilm is flat and thus and . The deformation can be obtained from , and from due to incompressibility. The in-plane stresses are calculated to be , where denotes the biofilm shear modulus (see Supplementary Notes I,II for details). A wrinkling instability occurs once compressive stresses reach the critical value. To describe the wrinkling deformation we use two coarse-grained scalar fields, the amplitude and the shape (see Fig. 4 and Supplementary Note VI). The fields and are computed from a Landau-Ginzburg-type free energy density Eq. (4) and the factor is approximated as , where (see Supplementary Note VI for details). The stress relaxation from the pre-stress to the true stress due to wrinkling is described by (see Supplementary Note VI)
| (5) |
Note that for isotropic compressive pre-stresses (), the relaxed stresses remain isotropic (, ).
Dimensionless governing equations: We define dimensionless variables , , and , where the shear modulus of the biofilm was chosen as the scale for stresses, the initial biofilm radius as the characteristic length scale, and the inverse of the growth rate at the edge of the biofilm as the characteristic time scale associated with biofilm expansion. Upon non-dimensionalizing the equations describing biofilm growth and mechanics discussed above, we obtain the following equations
| (6c) | ||||
| (6f) | ||||
| Force balance: | (6g) | |||
| (6j) | ||||
where , , and the dimensionless friction is identified to be a control parameter of the model. Before wrinkling occurs, . After wrinkling occurs, Eq. (6j) describes the pre-stress , and the actual stress is computed from Eq. (5). Taken together, the set of dimensionless governing equations is able to describe both the planar expansion of the biofilm () and the 3D biofilm wrinkling morphology (). The parameters in our model are either estimated directly from experiment or are obtained by fitting to experimental data (see Fig. S1 and Table S2).
Numerical simulations
The numerical solutions of Eq. (6) were obtained by performing finite element simulations. Rather than solving Eqs. (6c) and (6g) in the Eulerian frame, these equations were rewritten and solved in the Lagrangian frame of reference (see Supplementary Note IID for details). We further assumed axisymmetric solutions and expressed the governing equations in polar coordinates to numerically solve for six scalar fields , , , , , and as functions of the dimensionless initial radial coordinate . The validity of the axisymmetry assumption was verified by comparing to simulations on 2D circular domains with no assumption of symmetry. We used a fixed 1D domain of that was discretized and generated by Gmsh geuzaine2009gmsh . The geometric stretch near the edge is larger than that near the center due to the non-uniform growth. Therefore, we used a finer discretization of the domain near to ensure high precision numerical solutions.
The initial conditions are , , , , , and boundary conditions , . Partial differential equations were then converted to their equivalent weak forms and computationally discretized by first-order (2 noded) linear elements langtangen2019introduction , and implemented in the open-source computing platform FEniCS alnaes2015fenics . The time increment was set to be . At each time step, we used the standard Crank-Nicolson method to perform the numerical integration crank1947practical . To ensure numerical convergence, we checked explicitly whether the wrinkling instability occurred by evaluating the difference between the circumferential stress and the critical stress . We required that at for the wrinkling to occur at .
Choice of parameters
Critical stress for wrinkling: Our previous study revealed that a trilayer model quantitatively captures the biofilm wrinkle wavelength yan2019mechanical . The trilayer theory also predicts how the critical stress varies with the stiffness contrast between the biofilm and the substrate lejeune2016understanding (see also yan2019mechanical for the calculated values of critical stress and for different agar concentrations). However, our chemo-mechanical model (Eq. (6)) reaches the theoretical critical stress earlier than the time when wrinkling occurs in the experiments because we model biofilms as elastic materials and do not consider viscoelasticity and plasticity (see Discussion and Supplementary Note VII). In practice, we rescale the critical stress in Fig. 4C and D such that wrinkling instability in the simulations occurs at a time similar to that in experiment.
Fitting parameters from the velocity profiles: The dimensionless friction parameter and the dimensionless maximum rate of nutrient uptake were determined by fitting the radial velocity profiles of the modeled biofilm to those extracted from experiments at different times. The similarity between the radial velocity profiles was assessed in terms of the normalized mean squared distance (MSD). In experiments, we measured the radial velocity profiles for a biofilm grown on 0.7% agar concentration at 40 different time points separated by 30 min from h to h (before the wrinkling instability occurs) as described above in the Image Processing section. At each time , the experimental data were represented as (; averaged over the circumferential direction). The number of data points at each time point is equal to the ratio of the biofilm radius to the width of radial bins. For a particular set of parameters , we first numerically computed the velocity profiles of the modeled biofilm. For each time point we computed the normalized squared distance (SD) between the experimental data points and the simulated profile as where we used a characteristic length scale mm and a characteristic velocity m/min. The normalized SD between the radius and edge velocity for the experimental biofilm and those of the modeled biofilm was used as one additional data point associated with time . Finally, the normalized MSD was calculated as . We searched the parameter space to find the optimal parameter values and that minimize the normalized MSD (Fig. S1). For simulations with different friction, we varied the parameter keeping all the other parameters fixed.
Analysis of the biofilm leading angle
To compare the biofilm leading angles in experiments with theoretical predictions, we inferred the value of for biofilms grown on 0.7% agar by fitting the velocity profiles as described above, i.e., . Next, we inferred the normalized friction for biofilms grown on different agar concentrations (agar shear modulus denoted by ) by making the assumption that , i.e., . The uncertainty of these values (Fig. 2E horizontal error bars) was estimated by taking into account the measurement errors of , , and . The value of the circumferential compression in Eq. (3) remains undetermined. Nevertheless, we can estimate from the wrinkling instability analysis yan2019mechanical . The specific choice of in this range only minimally affects the results (Fig. S9).
Data and software availability
Code availability
Matlab codes for the image processing have been described in a previous publication yan2019mechanical . The simulation codes used to model the biofilm are available on GitHub (https://github.com/f-chenyi/biofilm-mechanics-theory).
Data availability
The data are available upon request.
Acknowledgements
This work was supported by the Howard Hughes Medical Institute (B.L.B., etc.), National Science Foundation Grants MCB-1713731 (B.L.B.), MCB-1853602 (B.L.B., H.A.S., and N.S.W.), NIH Grant 1R21AI144223 (B.L.B., H.A.S., and N.S.W.), NIH Grant 2R37GM065859 (B.L.B.), NIH Grant GM082938 (N.S.W.), the NSF through the Princeton University Materials Research Science and Engineering Center DMR-1420541 (B.L.B., H.A.S., A.K.), and the Max Planck Society-Alexander von Humboldt Foundation (B.L.B.). J.Y. holds a Career Award at the Scientific Interface from the Burroughs Wellcome Fund. R.A. acknowledges support from the Human Frontiers of Science Program (LT-000475/2018-C). We thank Dr. Maria Holland for helpful discussions.
References
- (1) A. Goriely, The Mathematics and Mechanics of Biological Growth, vol. 45. Springer, 2017.
- (2) R. de Rooij and E. Kuhl, “A physical multifield model predicts the development of volume and structure in the human brain,” J Mech Phys Solids, vol. 112, pp. 563–576, 2018.
- (3) M. Genet, M. Rausch, L. C. Lee, S. Choy, X. Zhao, G. S. Kassab, S. Kozerke, J. M. Guccione, and E. Kuhl, “Heterogeneous growth-induced prestrain in the heart,” J Biomech, vol. 48, no. 10, pp. 2080–2089, 2015.
- (4) D. W. Thompson, On Growth and Form. Cambridge Univ. Press, 1917.
- (5) Y. Klein, E. Efrati, and E. Sharon, “Shaping of elastic sheets by prescription of non-euclidean metrics,” Science, vol. 315, no. 5815, pp. 1116–1120, 2007.
- (6) J. Huxley, F. Churchill, and R. Strauss, Problems of Relative Growth. Johns Hopkins University Press, 1993.
- (7) J. Sachs, Text-book of Botany: Morphological and Physiological. Clarendon Press, 1875.
- (8) T. Tallinen, J. Y. Chung, F. Rousseau, N. Girard, J. Lefèvre, and L. Mahadevan, “On the growth and form of cortical convolutions,” Nat Phys, vol. 12, no. 6, p. 588, 2016.
- (9) S. Budday, P. Steinmann, and E. Kuhl, “The role of mechanics during brain development,” J Mech Phys Solids, vol. 72, pp. 75–92, 2014.
- (10) A. E. Shyer, T. Tallinen, N. L. Nerurkar, Z. Wei, E. S. Gil, D. L. Kaplan, C. J. Tabin, and L. Mahadevan, “Villification: How the gut gets its villi,” Science, vol. 342, no. 6155, pp. 212–218, 2013.
- (11) T. Savin, N. A. Kurpios, A. E. Shyer, P. Florescu, H. Liang, L. Mahadevan, and C. J. Tabin, “On the growth and form of the gut,” Nature, vol. 476, no. 7358, pp. 57–62, 2011.
- (12) H. Y. Kim, M.-F. Pang, V. D. Varner, L. Kojima, E. Miller, D. C. Radisky, and C. M. Nelson, “Localized smooth muscle differentiation is essential for epithelial bifurcation during branching morphogenesis of the mammalian lung,” Dev Cell, vol. 34, no. 6, pp. 719–726, 2015.
- (13) J. Kim, J. A. Hanna, M. Byun, C. D. Santangelo, and R. C. Hayward, “Designing responsive buckled surfaces by halftone gel lithography,” Science, vol. 335, no. 6073, pp. 1201–1205, 2012.
- (14) C. Modes and M. Warner, “Shape-programmable materials,” Physics Today, vol. 69, no. 1, p. 32, 2016.
- (15) A. S. Gladman, E. A. Matsumoto, R. G. Nuzzo, L. Mahadevan, and J. A. Lewis, “Biomimetic 4D printing,” Nat Mater, vol. 15, no. 4, pp. 413–418, 2016.
- (16) S. Yang, K. Khare, and P.-C. Lin, “Harnessing surface wrinkle patterns in soft matter,” Adv Funct Mater, vol. 20, no. 16, pp. 2550–2564, 2010.
- (17) G. O’Toole, H. B. Kaplan, and R. Kolter, “Biofilm formation as microbial development,” Annu Rev Microbiol, vol. 54, no. 1, pp. 49–79, 2000.
- (18) J. K. Teschler, D. Zamorano-Sánchez, A. S. Utada, C. J. Warner, G. C. Wong, R. G. Linington, and F. H. Yildiz, “Living in the matrix: assembly and control of Vibrio cholerae biofilms,” Nat Rev Microbiol, vol. 13, no. 5, pp. 255–268, 2015.
- (19) D. O. Serra, A. M. Richter, G. Klauck, F. Mika, and R. Hengge, “Microanatomy at cellular resolution and spatial order of physiological differentiation in a bacterial biofilm,” mBio, vol. 4, no. 2, pp. e00103–13, 2013.
- (20) D. O. Serra, A. M. Richter, and R. Hengge, “Cellulose as an architectural element in spatially structured Escherichia coli biofilms,” J Bacteriol, vol. 195, no. 24, pp. 5540–5554, 2013.
- (21) L. E. Dietrich, C. Okegbe, A. Price-Whelan, H. Sakhtah, R. C. Hunter, and D. K. Newman, “Bacterial community morphogenesis is intimately linked to the intracellular redox state,” J Bacteriol, vol. 195, no. 7, pp. 1371–1380, 2013.
- (22) D. Romero, C. Aguilar, R. Losick, and R. Kolter, “Amyloid fibers provide structural integrity to Bacillus subtilis biofilms,” Proc Natl Acad Sci USA, vol. 107, no. 5, pp. 2230–2234, 2010.
- (23) J. Yan, C. D. Nadell, H. A. Stone, N. S. Wingreen, and B. L. Bassler, “Extracellular-matrix-mediated osmotic pressure drives Vibrio cholerae biofilm expansion and cheater exclusion,” Nat Commun, vol. 8, no. 1, p. 327, 2017.
- (24) J. Yan, C. Fei, S. Mao, A. Moreau, N. S. Wingreen, A. Košmrlj, H. A. Stone, and B. L. Bassler, “Mechanical instability and interfacial energy drive biofilm morphogenesis,” eLife, vol. 8, p. e43920, 2019.
- (25) S. Beyhan and F. H. Yildiz, “Smooth to rugose phase variation in Vibrio cholerae can be mediated by a single nucleotide change that targets c-di-GMP signalling pathway,” Mol Microbiol, vol. 63, no. 4, pp. 995–1007, 2007.
- (26) F. H. Yildiz and G. K. Schoolnik, “Vibrio cholerae O1 El Tor: Identification of a gene cluster required for the rugose colony type, exopolysaccharide production, chlorine resistance, and biofilm formation,” Proc Natl Acad Sci USA, vol. 96, no. 7, pp. 4028–4033, 1999.
- (27) F. Yildiz, J. Fong, I. Sadovskaya, T. Grard, and E. Vinogradov, “Structural characterization of the extracellular polysaccharide from Vibrio cholerae O1 El-Tor,” PLoS One, vol. 9, no. 1, p. e86751, 2014.
- (28) J. C. Fong and F. H. Yildiz, “The rbmBCDEF gene cluster modulates development of rugose colony morphology and biofilm formation in Vibrio cholerae,” J Bacteriol, vol. 189, no. 6, pp. 2319–2330, 2007.
- (29) V. Berk, J. C. Fong, G. T. Dempsey, O. N. Develioglu, X. Zhuang, J. Liphardt, F. H. Yildiz, and S. Chu, “Molecular architecture and assembly principles of Vibrio cholerae biofilms,” Science, vol. 337, no. 6091, pp. 236–239, 2012.
- (30) J. C. Fong, A. Rogers, A. K. Michael, N. C. Parsley, W.-C. Cornell, Y.-C. Lin, P. K. Singh, R. Hartmann, K. Drescher, E. Vinogradov, et al., “Structural dynamics of RbmA governs plasticity of Vibrio cholerae biofilms,” eLife, vol. 6, p. e26163, 2017.
- (31) J. Yan, A. Moreau, S. Khodaparast, A. Perazzo, J. Feng, C. Fei, S. Mao, S. Mukherjee, A. Košmrlj, N. S. Wingreen, et al., “Bacterial biofilm material properties enable removal and transfer by capillary peeling,” Adv Mater, vol. 30, no. 46, p. 1804153, 2018.
- (32) C. Zhang, B. Li, X. Huang, Y. Ni, and X.-Q. Feng, “Morphomechanics of bacterial biofilms undergoing anisotropic differential growth,” Appl Phys Lett, vol. 109, no. 14, p. 143701, 2016.
- (33) P. S. Stewart and M. J. Franklin, “Physiological heterogeneity in biofilms,” Nat Rev Microbiol, vol. 6, no. 3, pp. 199–210, 2008.
- (34) J. N. Anderl, J. Zahller, F. Roe, and P. S. Stewart, “Role of nutrient limitation and stationary-phase existence in Klebsiella pneumoniae biofilm resistance to ampicillin and ciprofloxacin,” Antimicrob Agents Chemother, vol. 47, no. 4, pp. 1251–1256, 2003.
- (35) A. Seminara, T. E. Angelini, J. N. Wilking, H. Vlamakis, S. Ebrahim, R. Kolter, D. A. Weitz, and M. P. Brenner, “Osmotic spreading of bacillus subtilis biofilms driven by an extracellular matrix,” Proceedings of the National Academy of Sciences, vol. 109, no. 4, pp. 1116–1121, 2012.
- (36) C. Zhang, B. Li, J.-Y. Tang, X.-L. Wang, Z. Qin, and X.-Q. Feng, “Experimental and theoretical studies on the morphogenesis of bacterial biofilms,” Soft Matter, vol. 13, no. 40, pp. 7389–7397, 2017.
- (37) X. Chen and J. W. Hutchinson, “Herringbone buckling patterns of compressed thin films on compliant substrates,” J Appl Mech, vol. 71, no. 5, pp. 597–603, 2004.
- (38) Z. Huang, W. Hong, and Z. Suo, “Nonlinear analyses of wrinkles in a film bonded to a compliant substrate,” J Mech Phys Solids, vol. 53, no. 9, pp. 2101–2118, 2005.
- (39) M. Asally, M. Kittisopikul, P. Rué, Y. Du, Z. Hu, T. Çağatay, A. B. Robinson, H. Lu, J. Garcia-Ojalvo, and G. M. Süel, “Localized cell death focuses mechanical forces during 3D patterning in a biofilm,” Proceedings of the National Academy of Sciences, vol. 109, no. 46, pp. 18891–18896, 2012.
- (40) R. W. Ogden, Nonlinear Elastic Deformations. Courier Corporation, 1997.
- (41) E. K. Rodriguez, A. Hoger, and A. D. McCulloch, “Stress-dependent finite growth in soft elastic tissues,” J Biomech, vol. 27, no. 4, pp. 455–467, 1994.
- (42) A. Goriely and M. B. Amar, “Differential growth and instability in elastic shells,” Phys Rev Lett, vol. 94, no. 19, p. 198103, 2005.
- (43) J. Dervaux and M. B. Amar, “Morphogenesis of growing soft tissues,” Phys Rev Lett, vol. 101, no. 6, p. 068101, 2008.
- (44) J. W. Costerton, Z. Lewandowski, D. E. Caldwell, D. R. Korber, and H. M. Lappin-Scott, “Microbial biofilms,” Annu Rev Microbiol, vol. 49, no. 1, pp. 711–745, 1995.
- (45) J. Monod, “The growth of bacterial cultures,” Annu Rev Microbiol, vol. 3, no. 1, pp. 371–394, 1949.
- (46) S. Budday, C. Raybaud, and E. Kuhl, “A mechanical model predicts morphological abnormalities in the developing human brain,” Sci Rep, vol. 4, p. 5644, 2014.
- (47) S. Walcott and S. X. Sun, “A mechanical model of actin stress fiber formation and substrate elasticity sensing in adherent cells,” Proc Natl Acad Sci USA, vol. 107, no. 17, pp. 7757–7762, 2010.
- (48) P. Sens, “Rigidity sensing by stochastic sliding friction,” EPL, vol. 104, no. 3, p. 38003, 2013.
- (49) U. S. Schwarz and S. A. Safran, “Physics of adherent cells,” Rev Mod Phys, vol. 85, pp. 1327–1381, Aug 2013.
- (50) S. Chen, T. Bertrand, W. Jin, M. D. Shattuck, and C. S. O’Hern, “Stress anisotropy in shear-jammed packings of frictionless disks,” Phys Rev E, vol. 98, p. 042906, Oct 2018.
- (51) S. Cai, D. Breid, A. J. Crosby, Z. Suo, and J. W. Hutchinson, “Periodic patterns and energy states of buckled films on compliant substrates,” J Mech Phys Solids, vol. 59, no. 5, pp. 1094–1114, 2011.
- (52) B. Audoly and A. Boudaoud, “Buckling of a stiff film bound to a compliant substrate - Part I: Formulation, linear stability of cylindrical patterns, secondary bifurcations,” J Mech Phys Solids, vol. 56, no. 7, pp. 2401–2421, 2008.
- (53) S. Srinivasan, C. N. Kaplan, and L. Mahadevan, “A multiphase theory for spreading microbial swarms and films,” eLife, vol. 8, p. e42697, 2019.
- (54) J. Liu, A. Prindle, J. Humphries, M. Gabalda-Sagarra, M. Asally, D. L. Dong-yeon, S. Ly, J. Garcia-Ojalvo, and G. M. Süel, “Metabolic co-dependence gives rise to collective oscillations within biofilms,” Nature, vol. 523, no. 7562, pp. 550–554, 2015.
- (55) C. P. Kempes, C. Okegbe, Z. Mears-Clarke, M. J. Follows, and L. E. Dietrich, “Morphological optimization for access to dual oxidants in biofilms,” Proc Natl Acad Sci USA, vol. 111, no. 1, pp. 208–213, 2014.
- (56) P. K. Singh, S. Bartalomej, R. Hartmann, H. Jeckel, L. Vidakovic, C. D. Nadell, and K. Drescher, “Vibrio cholerae combines individual and collective sensing to trigger biofilm dispersal,” Curr Biol, vol. 27, no. 21, pp. 3359–3366, 2017.
- (57) M. B. Miller and B. L. Bassler, “Quorum sensing in bacteria,” Annu Rev Microbiol, vol. 55, no. 1, pp. 165–199, 2001.
- (58) B. K. Hammer and B. L. Bassler, “Quorum sensing controls biofilm formation in Vibrio cholerae,” Mol Microbiol, vol. 50, no. 1, pp. 101–104, 2003.
- (59) Y. Shen, G. L. Monroy, N. Derlon, D. Janjaroen, C. Huang, E. Morgenroth, S. A. Boppart, N. J. Ashbolt, W.-T. Liu, and T. H. Nguyen, “Role of biofilm roughness and hydrodynamic conditions in Legionella pneumophila adhesion to and detachment from simulated drinking water biofilms,” Environ Sci Technol, vol. 49, no. 7, pp. 4274–4282, 2015.
- (60) J. Dumais, S. L. Shaw, C. R. Steele, S. R. Long, and P. M. Ray, “An anisotropic-viscoplastic model of plant cell morphogenesis by tip growth,” Int J Dev Biol, vol. 50, pp. 209–222, 2006.
- (61) B. He, K. Doubrovinski, O. Polyakov, and E. Wieschaus, “Apical constriction drives tissue-scale hydrodynamic flow to mediate cell elongation,” Nature, vol. 508, no. 7496, pp. 392–396, 2014.
- (62) B. Guirao and Y. Bellaïche, “Biomechanics of cell rearrangements in Drosophila,” Curr Opin Cell Biol, vol. 48, pp. 113–124, 2017.
- (63) O. Foubet, M. Trejo, and R. Toro, “Mechanical morphogenesis and the development of neocortical organisation,” Cortex, 2018.
- (64) D. Matoz-Fernandez, F. A. Davidson, N. R. Stanley-Wall, and R. Sknepnek, “Wrinkle patterns in active viscoelastic thin sheets.” preprint, arXiv:1904.08872, 2019.
- (65) J. N. Wilking, V. Zaburdaev, M. De Volder, R. Losick, M. P. Brenner, and D. A. Weitz, “Liquid transport facilitated by channels in Bacillus subtilis biofilms,” Proc Natl Acad Sci USA, vol. 110, no. 3, pp. 848–852, 2013.
- (66) J. Dervaux, J. C. Magniez, and A. Libchaber, “On growth and form of Bacillus subtilis biofilms,” Interface Focus, vol. 4, no. 6, p. 20130051, 2014.
- (67) S. Haussler and C. Fuqua, “Biofilms 2012: New discoveries and significant wrinkles in a dynamic field,” J Bacteriol, vol. 195, no. 13, pp. 2947–2958, 2013.
- (68) J. S. Madsen, Y.-C. Lin, G. R. Squyres, A. Price-Whelan, A. de Santiago Torio, A. Song, W. C. Cornell, S. J. Sørensen, J. B. Xavier, and L. E. Dietrich, “Facultative control of matrix production optimizes competitive fitness in Pseudomonas aeruginosa PA14 biofilm models,” Appl Environ Microbiol, vol. 81, no. 24, pp. 8414–8426, 2015.
- (69) K. H. Thelin and R. K. Taylor, “Toxin-coregulated pilus, but not mannose-sensitive hemagglutinin, is required for colonization by Vibrio cholerae O1 El Tor biotype and O139 strains.,” Infection and Immunity, vol. 64, no. 7, pp. 2853–2856, 1996.
- (70) W. Thielicke and E. Stamhuis, “PIVlab - towards user-friendly, affordable and accurate digital particle image velocimetry in MATLAB,” J Open Res Softw, vol. 2, no. 1, p. e30, 2014.
- (71) A. Zemel, F. Rehfeldt, A. Brown, D. Discher, and S. Safran, “Optimal matrix rigidity for stress-fibre polarization in stem cells,” Nat Phys, vol. 6, no. 6, pp. 468–473, 2010.
- (72) P. Marcq, N. Yoshinaga, and J. Prost, “Rigidity sensing explained by active matter theory,” Biophys J, vol. 101, no. 6, pp. L33–L35, 2011.
- (73) C. Geuzaine and J.-F. Remacle, “Gmsh: A 3-D finite element mesh generator with built-in pre-and post-processing facilities,” Int J Numer Meth Eng, vol. 79, no. 11, pp. 1309–1331, 2009.
- (74) H. Langtangen and K. Mardal, Introduction to Numerical Methods for Variational Problems. Texts in Computational Science and Engineering, Springer International Publishing, 2019.
- (75) M. Alnæs, J. Blechta, J. Hake, A. Johansson, B. Kehlet, A. Logg, C. Richardson, J. Ring, M. E. Rognes, and G. N. Wells, “The FEniCS project version 1.5,” Arch Numer Software, vol. 3, no. 100, pp. 9–23, 2015.
- (76) J. Crank and P. Nicolson, “A practical method for numerical evaluation of solutions of partial differential equations of the heat-conduction type,” in Mathematical Proceedings of the Cambridge Philosophical Society, vol. 43, pp. 50–67, Cambridge University Press, 1947.
- (77) E. Lejeune, A. Javili, and C. Linder, “Understanding geometric instabilities in thin films via a multi-layer model,” Soft Matter, vol. 12, no. 3, pp. 806–816, 2016.