Very early warning signal for El Niño in 2020 with a 4 in 5 likelihood
Abstract
The El Niño Southern Oscillation (ENSO) is the most important driver of climate variability and can trigger extreme weather events and disasters in various parts of the globe. Recently we have developed a network approach, which allows forecasting an El Niño event about 1 year ahead [1]. Here we communicate that since 2012 this network approach, which does not involve any fit parameter, correctly predicted the absence of El Niño events in 2012, 2013 and 2017 as well as the onset of the large El Niño event that started in 2014 and ended in 2016 [2]. Our model also correctly forecasted the onset of the last El Niño event in 2018. In September 2019, the model indicated the return of El Niño in 2020 with an 80% probability.
1 The El Niño Southern Oscillation
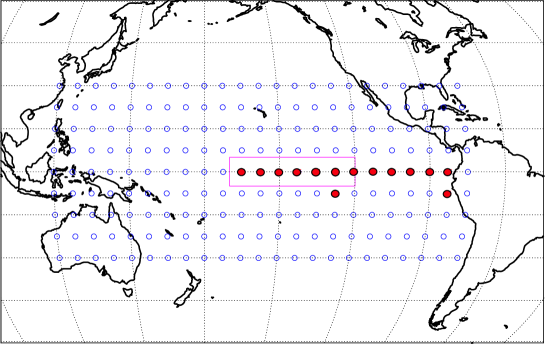
The El Niño-Southern Oscillation (ENSO) phenomenon [4, 5, 6, 3, 7, 8] can be perceived as a self-organized dynamical see-saw pattern in the Pacific ocean-atmosphere system, featured by rather irregular warm (“El Niño”) and cold (“La Nina”) excursions from the long-term mean state. The ENSO phenomenon is quantified by the Oceanic Niño Index (ONI), which is based on the average of the sea-surface temperatures (SST) in the Niño3.4 region in the Pacific (see Fig. 1). The ONI is defined as the three-month running-mean SST anomaly in the Niño3.4 region and is a principal measure for monitoring, assessing and predicting ENSO. We will refer to the ONI also as NINO3.4 index.
An El Niño-episode is said to occur when the index is 0.5°C above the average for at least 5 months. Table 1 shows the ONI between 2012 and present, as communicated by the National Oceanic and Atmospheric Administration (NOAA) [9]. The El Niño periods are in boldface. The table shows that there were no El Niño events in 2012, 2013 and 2017. Between 2011 and present, there were 2 El Niño events. One started in late 2014 and ended in the middle of 2016, the other one started in late 2018 and ended in the middle of 2019. It seems unlikely that the conditions for an El Niño episode will be met again in late 2019 [10, 9].
| Year | DJF | JFM | FMA | MAM | AMJ | MJJ | JJA | JAS | ASO | SON | OND | NDJ |
|---|---|---|---|---|---|---|---|---|---|---|---|---|
| 2012 | -0.8 | -0.6 | -0.5 | -0.4 | -0.2 | 0.1 | 0.3 | 0.3 | 0.3 | 0.2 | 0.0 | -0.2 |
| 2013 | -0.4 | -0.3 | -0.2 | -0.2 | -0.3 | -0.3 | -0.4 | -0.4 | -0.3 | -0.2 | -0.2 | -0.3 |
| 2014 | -0.4 | -0.4 | -0.2 | 0.1 | 0.3 | 0.2 | 0.1 | 0.0 | 0.2 | 0.4 | 0.6 | 0.7 |
| 2015 | 0.6 | 0.6 | 0.6 | 0.8 | 1.0 | 1.2 | 1.5 | 1.8 | 2.1 | 2.4 | 2.5 | 2.6 |
| 2016 | 2.5 | 2.2 | 1.7 | 1.0 | 0.5 | 0.0 | -0.3 | -0.6 | -0.7 | -0.7 | -0.7 | -0.6 |
| 2017 | -0.3 | -0.1 | 0.1 | 0.3 | 0.4 | 0.4 | 0.2 | -0.1 | -0.4 | -0.7 | -0.9 | -1.0 |
| 2018 | -0.9 | -0.8 | -0.6 | -0.4 | -0.1 | 0.1 | 0.1 | 0.2 | 0.4 | 0.7 | 0.9 | 0.8 |
| 2019 | 0.8 | 0.8 | 0.8 | 0.8 | 0.6 | 0.5 | 0.3 | 0.1 |
2 The forecasting algorithm
Since strong El Niño episodes can wreak havoc in various parts of the world (through extreme weather events and other environmental perturbations) [12, 15, 14, 13, 11], early-warning schemes based on robust scientific evidence are highly desirable. Sophisticated global climate models taking into account the atmosphere-ocean coupling as well as statistical approaches like the dynamical systems schemes approach, autoregressive models and pattern-recognition techniques have been proposed to forecast the pertinent index with lead times between 1 and 24 months [4, 16, 17, 19, 20, 21, 24, 22, 26, 25, 27, 29, 30, 31, 23, 28, 18, 32, 34, 33].
Unfortunately, the forecasting methods in use so far have quite limited anticipation power. In particular, they generally fail to overcome the so-called “spring barrier” (see, e.g., [35, 36]), which shortens their warning time to around 6 months.
To resolve this problem, we have recently introduced an alternative forecasting approach [1] based on complex-networks analysis [39, 37, 38, 40, 41] that can considerably shift the probabilistic prediction horizon. The approach exploits the remarkable observation that a large-scale cooperative mode linking the “El Niño basin” (i.e., the equatorial Pacific corridor) and the rest of the Pacific ocean (see Fig. 1) builds up in the calendar year before an El Niño event. An appropriate measure for the emerging cooperativity can be derived from the time evolution of the teleconnections (“links“) between the atmospheric temperatures at the grid points (”nodes“) inside and outside of the El Niño basin. The strengths of those links are represented by the values of the respective cross correlations (see Data and Methods Section). The crucial entity is the mean link strength as obtained by averaging over all individual links in the network at a given instant (for details, see [1] and Data and Methods Section). rises when the cooperative mode builds up and drops again when this mode collapses rather conspicuously with the onset of the El Niño event. The rise of in the year before an El Niño event starts serves as a precursor for the event.
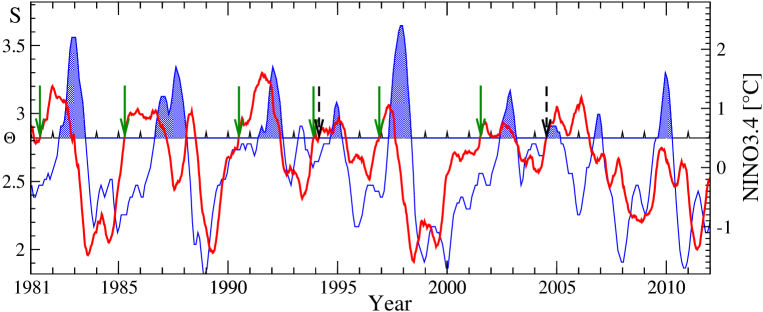
For the sake of concrete forecasting, we employed in [1] high-quality atmospheric temperature data for the 1950-2011 period. The optimized algorithm (see Data and Methods Section) involves an empirical decision threshold . Whenever crosses from below while the most recent ONI is below 0.5°C, the algorithm sounds an alarm and predicts an El Niño inception in the following year. For obtaining and testing the appropriate thresholds, we divided the data into two halves. In the first part (1950-1980), which represents the learning phase, all thresholds above the temporal mean of are considered and the optimal ones, i.e., those that lead to the best predictions in the learning phase, have been determined. We found that -values between and lead to the best performance [1], with a false alarm rate of 1/20. In the second part of the data set (1981-2011), which represents the prediction (hindcasting) phase, the performance of these thresholds has been tested. We found that the thresholds between 2.815 and 2.826 gave the best results (see Fig. 2, where ). The alarms were correct in 75% and the non-alarms in 86.4% of the cases. For -values between and , the performance was only slightly weaker.
3 Forecasting the next El Niño (2011 - present)
Based on this hindcasting capacity, the approach already has been used in [2] to extend the prediction phase from the end of 2011 until November 2013. We like to emphasize that in the forecasting phase, the algorithm does not contain any fit parameter, since the decision thresholds are fixed and the mean link strengths only depend on the atmospheric temperature data.
In 2011 and 2012 (see Fig. 3), did not cross the threshold from below, this way correctly forecasting the absence of El Niño events in both 2012 and 2013. These predictions, made by the end of 2011 and 2012, respectively, are not trivial. For example, as late as August 2012, the CPC/IRI Consensus Probabilistic ENSO forecast yielded a 3 in 4 likelihood for an El Niño event in 2012, which turned out to be incorrect only a few months later [10, 9].
In 2013, our algorithm predicted the return of an El Niño event in 2014, since, in September 2013, transgressed the alarm threshold band while the last available ONI (JJA 2013) was below 0.5°C, indicating the return of El Niño in 2014 (see Fig. 3). This early prediction was correct (see Table 1): The El Niño event started in November 2014 (and ended in May 2016).
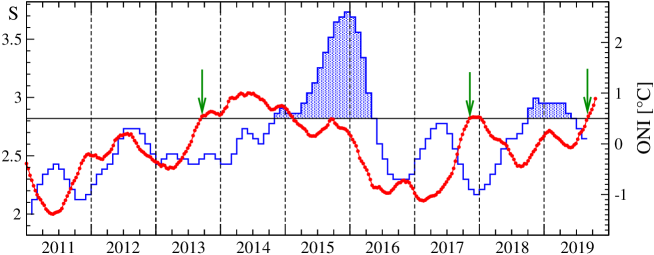
Here, we extend the prediction period further, until 29 October 2019 (present), see Fig. 3. In 2014, the mean link strength did not cross any decision thresholds from below, this way correctly forecasting the absence of a new El Niño in 2015.
In 2015, since the ONI was above 0.5°C for all months, our algorithm did not deliver an alarm. This turned out to be correct since there was no onset of a new El Niño in late 2016.
In 2016 the mean link strength was well below the decision thresholds. Accordingly, at the end of 2016, our algorithm predicted the absence of an El Niño event in 2017. Also this prediction is far from being trivial. As late as April/May 2017, the major forecast schemes (ECMWF, CPC/IRI Model based ENSO forecast, CPC/IRI Official Probabilistic ENSO forecast) predicted an event in 2017 with 3 in 4, 2 in 3, and 1 in 2 likelihoods.
In November 2017, transgressed from below the lower threshold band between and 2.826. Since the last ONI, for ASO 2017, was below 0.5°C (-0.4°C), this indicated the return of El Niño in 2018 (see Fig. 3), now with a 7 in 9 likelihood (78%). The prediction turned out to be correct. Indeed, the forecasted El Niño started in October 2018 and ended in June 2019.
Before coming to the next forecasts, let us discuss the probability that the same or better outcomes can be obtained by simply guessing. In the 69 years between 1950 and 2018, 23 El Niños started. Accordingly, the probability that an El Niño starts in a certain year is 1/3. The probability to correctly forecast the El Niños between 2012 and 2018 is, therefore, . Similarly, one can obtain the probability that in the whole hindcasting and forecasting period, between 1982 and 2018, random guessing would yield better or equal forecasts than our algorithm to be .
In 2018, did not cross any of the decision thresholds from below, this way forecasting at the end of 2018 that in late 2019, with 89% probability, no new El Niño will start. Right now, this seems likely to be correct. Also, the current official CPC/IRI forecast [10] suggests (with 73% probability) that there will be no new El Niño this year.
Finally, we find that in September 2019, transgressed all thresholds. Since the last ONI, for JJA 2019, is below 0.5°C (0.3°C), this indicates the return of El Niño in 2020. Since in the past (1981-August 2019) our algorithm generated 10 alarms and 8 were correct, now the likelihood of the El Niño event is 80 percent.
We like to note that our algorithm only can warn of the El Niño event next year but not forecast its strength and duration. Accordingly, we do not know if the next El Niño will be strong or not. We hope that in the near future, reasonable early forecasts of the El Niño magnitudes will be available by a complexity based approach using information entropy[42].
An average El Niño event typically increases the climate anomaly (deviation of global mean surface temperature from pre-industrial level) by about 0.1°C. This suggests that a strong El Niño event in late 2020 can make 2021 a new record year, since air temperature rise lags Pacific warming by about 3 months.
4 Data and Methods
This Section follows closely [2]. For the prediction of El Niño events or non-events, we use the cooperative behavior of the atmospheric temperatures in the Pacific as a precursor. To obtain a measure for the cooperativity we consider the daily surface atmospheric temperatures (SAT) between June 1948 and October 2019 temperature data at the grid points (”nodes”) of a Pacific network, see Fig. 1.
We analyse the time evolution of the teleconnections (“links”) between the temperatures at nodes inside the “El Niño basin” and nodes outside the basin. The strengths of these links are represented by the strengths of the cross correlations between the temperature records at these sites [40].
(1) At each node of the network shown in Fig. 1, the daily atmospheric temperature anomalies (actual temperature value minus climatological average for each calendar day, see below) at the surface level is determined. For the calculation of the climatological average, the leap days have been removed. The data have been obtained from the National Centers for Environmental Prediction/National Center for Atmospheric Research Reanalysis I project [43, 44].
(2) For obtaining the time evolution of the strengths of the links between the nodes inside the El Niño basin and the nodes outside we compute, for each 10th day in the considered time span between January 1950 and November 2017, the time-delayed cross-correlation function defined as
| (1) |
and
| (2) |
where the brackets denote an average over the past 365 d, according to
| (3) |
We consider time lags between 0 and 200 d, where a reliable estimate of the background noise level can be guaranteed.
(3) We determine, for each point in time , the maximum, the mean, and the standard deviation around the mean of the absolute value of the cross-correlation function and define the link strength as the difference between the maximum and the mean value, divided by the standard deviation. Accordingly, describes the link strength at day t relative to the underlying background noise (signal-to-noise ratio) and thus quantifies the dynamical teleconnections between nodes i and j.
(4) To obtain the desired mean strength of the dynamical teleconnections in the climate network we simply average over all individual link strengths.
(5) Finally, we compare with a decision threshold . When the link strength crosses the threshold from below and the last available ONI at that time is below 0.5°C, we give an alarm and predict that an El Niño episode will start in the following calendar year. Since the decision threshold has been fixed in the learning phase between 1950 and 1980, the forecasting algorithm does not contain any fit parameter.
We like to add that for the calculation of the climatological average in the learning phase, all data within this time window have been taken into account, while in the prediction phase, only data from the past up to the prediction date have been considered.
Note added: After submitting this article to arXiv, the new information entropy based method proposed by Meng et al. [42] also forecasted the onset of an El Niño in 2020 with a magnitude of . The method correctly hindcasted 9 out of 10 events between 1984 and 2018.
Acknowledgments
We thank the “East Africa Peru India Climate Capacities - EPICC” project, which is part of the International Climate Initiative (IKI), supported by the German Federal Ministry for the Environment, Nature Conservation and Nuclear Safety (BMU).
References
- [1] Ludescher J, Gozolchiani A, Bogachev MI, Bunde A, Havlin S, Schellnhuber HJ (2013) Improved El Niño forecasting by cooperativity detection. Proc Natl Acad Sci USA 110:11742-11745; ibid. doi:10.1073/pnas.1317354110.
- [2] Ludescher J, Gozolchiani A, Bogachev MI, Bunde A, Havlin S, Schellnhuber HJ (2014) Very early warning of next El Niño. Proc Natl Acad Sci USA 111:2064-2066; ibid. doi: 10.1073/pnas.1323058111.
- [3] Dijkstra HA (2005) Nonlinear Physical Oceanography: A Dynamical Systems Approach to the Large-Scale Ocean Circulation and El Niño (Springer, New York).
- [4] Clarke AJ (2008) An Introduction to the Dynamics of El Niño and the Southern Oscillation (Elsevier Academic Press, London).
- [5] Sarachik ES, Cane MA (2010) The El Niño-Southern Oscillation Phenomenon (Cambridge University Press, Cambridge).
- [6] Power S, Delage F, Chung C, Kociuba G, Keay K (2013) Robust twenty-first-century projections of El Niño and related precipitation variability. Nature 502:541-545.
- [7] Wang C, et al. (2017) El Niño and Southern Oscillation (ENSO): A review, in: Coral Reefs of the Eastern Tropical Pacific, eds Glymn PW, Manzello D, Enochs IC (Springer, Berlin).
- [8] Timmermann A, et al. (2018) El Niño-Southern Oscillation complexity. Nature 559:535-545.
- [9] National Oceanic and Atmospheric Administration, Climate Prediction Center. https://origin.cpc.ncep.noaa.gov/products/analysis_monitoring/ensostuff/ONI_v5.php
- [10] International Research Institute for Climate and Society, Earth Institute. https://iri.columbia.edu/our-expertise/climate/forecasts/enso/current/
- [11] Davis M (2001) Late Victorian Holocaust: El Niño Famines and the Making of the Third World (Verso, London & New York).
- [12] Wen C (2002) Impacts of El Niño and La Niña on the cycle of the East Asian winter and summer monsoon. Chin J Athmos Sci 26:359-376.
- [13] Kovats RS, Bouma MJ, Hajat S, Worrall E, Haines A (2003) El Niño and health. Lancet 362:1481–1489.
- [14] Donnelly JP, Woodruff JD (2007) Intense hurricane activity over the past 5,000 years controlled by El Niño and the West African monsoon. Nature 447:465-468.
- [15] Corral A, Ossó A, Llebot JE (2010) Scaling of tropical-cyclone dissipation. Nature Phys 6:693-696.
- [16] Cane MA, Zebiak SE, Dolan SC (1986) Experimental forecasts of El Niño. Nature 321:827-832.
- [17] Latif M et al. (1994) A review of ENSO prediction studies. Clim Dyn 9:167-179.
- [18] Penland C und Sardeshmukh PD (1995) The optimal growth of tropical sea surface temperature anomalies. J Clim 8:1999-2024.
- [19] Tziperman E, Scher H, Zebiak SE, Cane MA (1997) Controlling Spatiotemporal Chaos in a Realistic El Niño Prediction Model. Phys Rev Lett 79:1034-1037.
- [20] Kirtman BP, Schopf PS (1998) Decadal Variability in ENSO Predictability and Prediction. J Clim 11:2804-2822.
- [21] Landsea CW, Knaff JA (2000) How much skill was there in forecasting the very strong 1997-98 El Niño? Bull Amer Meteor Soc 81:2107-2119.
- [22] Fedorov AV, Harper SL, Philander SG, Winter B, Wittenberg A (2003) How Predictable is El Niño? Bull Amer Meteor Soc 84:911-919.
- [23] Galanti E, Tziperman E, Rosati A, Sirkes Z (2003) A Study of ENSO Prediction Using a Hybrid Coupled Model and the Adjoint Method for Data Assimilation. Mon Weather Rev 131:2748-2764.
- [24] Kirtman BP (2003) The COLA anomaly coupled model: Ensemble ENSO prediction. Monthly Weather Review 131:2324-2341.
- [25] Chen D, Cane MA, Kaplan A, Zebiak SE, Huang D (2004) Predictability of El Niño over the past 148 years. Nature 428:733-736.
- [26] Müller P, von Storch H (2010) Computer modelling in atmospheric and oceanic sciences: Building Knowledge (Springer, Berlin).
- [27] Palmer T, Hagedorn R (2006) Predictability of Wheather and Climate (Cambridge Univ Press, Cambridge, UK).
- [28] Chen D, Cane MA (2008) El Niño prediction and predictability. J Comput Phys 227:3625–3640.
- [29] Luo JJ, Masson S, Behera SK, Yamagata T (2008) Extended ENSO predictions using a fully coupled ocean-atmosphere model. J Clim 21(1):84-93.
- [30] Yeh SW et al. (2009) El Niño in a changing climate. Nature 461:511-514.
- [31] Chekroun MD, Kondrashov D, Ghil M (2011). Predicting stochastic systems by noise sampling, and application to the El Niño-Southern Oscillation. Proc Nat Acad Sci USA 108(29):11766–11771.
- [32] Chapman D, Cane MA, Henderson N, Lee DE, Chen C (2015) A Vector Autoregressive ENSO Prediction Model. J Clim 28:8511-8520.
- [33] Meng J, Fan J, Ashkenazy Y, Bunde A, Havlin S (2018) Forecasting the magnitude and onset of El Niño based on climate network New J Phys 20:043036.
- [34] Noteboom PD, Feng QY, Lopez C, Hernández-García, Dijkstra HA (2018) Using network theory and machine learning to predict El Niño. Earth Syst Dynam 9:969-983.
- [35] Webster PJ (1995) The annual cycle and the predictability of the tropical coupled ocean-athomosphere system. Meteorol Atmos Phys 56:33-55.
- [36] Goddard L et al. (2001) Current approaches to seasonal to interannual climate predictions. Int J Clim 21:1111-1152.
- [37] Tsonis AA, Swanson KL, Roebber PJ (2006) What do networks have to do with climate? Bull Amer Meteor Soc 87:585-595.
- [38] Yamasaki K, Gozolchiani A, Havlin S (2008) Climate networks around the globe are significantly effected by El Niño. Phys Rev Lett 100:228501.
- [39] Donges JF, Zou Y, Marwan N, Kurths, J (2009) The backbone of the climate network. EPL (Europhysics Letters) 87:48007.
- [40] Gozolchiani A, Havlin S, Yamasaki K (2011) Emergence of El Niño as an autonomous component in the climate network. Phys Rev Lett 107:148501.
- [41] Dijkstra HA, Hernández-García E, Masoller C, Barreiro M (2019) Networks in Climate (Cambridge Univ Press, Cambridge, UK).
- [42] Meng J, Fan J, Ludescher J, Ankit A, Chen X, Bunde A, Kurths J, Schellnhuber HJ (2019) Complexity based approach for El Niño magnitude forecasting before the spring predictability barrier. Proc Natl Acad Sci USA 117:177-183.
- [43] Kalnay et al (1996) The NCEP/NCAR 40-year reanalysis project. Bull Am Meteorol Soc 77:437-471.
- [44] National Oceanic and Atmospheric Administration, Earth System Research Laboratory. http.//www.esrl.noaa.gov/psd/data/gridded/data.ncep/reanalyis.html