Deep ATCA and VLA radio observations of short-GRB host galaxies.
Constraints on star-formation rates, afterglow flux, and
kilonova radio flares.
Abstract
We report the results of an extensive radio-continuum observing campaign of host galaxies of short gamma-ray bursts (GRBs). The goal of this survey was to search for optically obscured star formation, possibly indicative of a population of young short-GRB progenitors. Our sample comprises the hosts and host-galaxy candidates of 16 short-GRBs from 2005 to 2015, corresponding to roughly 1/3 of the presently known ensemble of well-localized short bursts. Eight GRB fields were observed with ATCA (at 5.5 and 9.0 GHz), and eight fields with the VLA (mostly at 5.5 GHz). The observations typically achieved a 1 of 5 to 8 Jy. In most cases they were performed years after the corresponding burst. No new short-GRB host with optically obscured star formation was found. Only one host galaxy was detected, the one of GRB 100206A at =0.407. However, its starburst nature was already known from optical/IR data. Its measured radio flux can be interpreted as being due to a star formation rate (SFR) of about 60 M⊙ yr-1. This is in good agreement with earlier expectations based on the observed broad-band spectral energy distribution of this galaxy. The 15 non-detections constrain the SFRs of the suspected host galaxies and provide upper limits on late-time luminosities of the associated radio afterglows and predicted kilonova radio flares. The non-detection of radio emission from GRB explosion sites confirms the intrinsically low luminosity of short-GRB afterglows and places significant constraints on the parameter space of magnetar-powered radio flares. Luminous radio flares from fiducial massive magnetars have not been found.
1 Introduction
The last 20 years have seen a revolution in gamma-ray burst (GRB) science, driven by new dedicated satellite missions, a deeper theoretical understanding of stellar explosions, and substantial efforts in sophisticated world-wide observing campaigns. On the one hand, long GRBs, which represent about 90% of all well-localized bursts, have been found to originate in the collapse of very massive stars (e.g., Hjorth & Bloom, 2012; Woosley & Bloom, 2006; Cano, 2016). On the other hand, the link of short GRBs to merging compact stars was unambiguously confirmed by the gravitational wave event GW 170817 (e.g., Abbott et al., 2017, 2017; Coulter et al., 2017; Kasen et al., 2017).
In order to understand diversity in burst populations, host galaxy studies are an important observational tool. Such studies have shown that long bursts appear to originate exclusively from late-type galaxies (e.g., Fruchter et al., 2006; Wainwright et al., 2007; Lyman et al., 2017), with star-formation rates (SFRs) spanning a wide range from 0.01 to 100 M⊙ yr-1(e.g., Sokolov et al., 2001; Christensen et al., 2004; Castro Cerón et al., 2006, 2010; Fan et al., 2010; Hunt et al., 2011). Short bursts on the other hand arise from all morphological types of galaxies (e.g., Fong et al., 2010, 2013; Berger, 2014). By the end of 2018, well-defined positions had been found for 50 short GRBs, allowing for an identification and investigation of their hosts or host-galaxy candidates (for a review, see Berger, 2014). These observations show that about 3/4 of all short GRBs originated in star-forming galaxies (e.g., Leibler & Berger, 2010; Fong et al., 2011; Fong & Berger, 2013; Fong et al., 2013), with SFRs similar to what has been found for the hosts of long GRBs.
Star-formation rates in GRB host galaxies (long and short) are often derived from measured emission line fluxes in optical bands (e.g., D’Avanzo et al., 2009). However, these lines can be affected by extinction from cosmic dust. Radio observations on the other hand trace synchrotron radiation from relativistic electrons originating from supernova remnants. Since the supernova rate is directly related to the star formation rate, radio-continuum observations provide an unobscured view of the star-forming activity in a galaxy over the last 10 to 100 Myr (e.g., Greis et al., 2017).
Consequently, in recent years radio emission of host galaxies of long GRBs has been studied with the goal of deriving the unobscured SFR based on the measured radio-continuum flux (e.g., Berger et al., 2003; Stanway et al., 2010; Hatsukade et al., 2012; Michałowski et al., 2012; Perley & Perley, 2013; Perley et al., 2015). In a comprehensive analysis, Greiner et al. (2016) list 61 long-GRB host galaxies at redshifts that have been observed in the radio band. Among these, 18 were detected and 12 (i.e., 20%) have a radio-derived SFR larger than 20 M⊙ yr-1.
Given these results for long-GRB host galaxies, the identification of three star-bursting hosts among the relatively small short-GRB ensemble (GRB 100206A, GRB 120804A, GRB 071227: Perley et al., 2012; Berger et al., 2013b; Nicuesa Guelbenzu et al., 2014, respectively) deserves attention. More such cases could be indicative of a population of young merger systems (neutron star - neutron star, neutron star - black hole) associated with short GRBs, as predicted by some stellar population synthesis models (Voss & Tauris 2003; Belczynski et al. 2006, 2007; Mapelli et al. 2018; Kruckow et al. 2018; Belczynski et al. 2018). Indeed, a general existence of young merger systems has been observationally supported by the discovery of the galactic NS-NS binary PSR J07373039 which will merge within only 85 Myr (Burgay et al. 2003; Tauris et al. 2017).
With this motivation in mind, we describe the results of a comprehensive radio-continuum study of star-forming hosts (and host-galaxy candidates; e.g., Giacomazzo et al. 2013; Berger 2014) of 16 short GRBs.111Host-galaxy candidates have no secure association with the burst under consideration but are selected according to a chance coincidence analysis given their apparent magnitude in a certain photometric band and their angular offset from the burst position (Bloom et al., 2002). This is roughly 1/3 of all well-localized short bursts. The observations were performed using NSF’s Karl G. Jansky Very Large Array (VLA) and the Australia Telescope Compact Array (ATCA).
In the following we adopt a flat CDM cosmology with Hubble constant H km s-1 Mpc-1 and density parameters and (Planck Collaboration et al., 2016). For the observed flux density we use the convention , where is the frequency and is the spectral slope (in energy space, not photon number space).
2 Target selection
Short GRBs were selected according to the compilations in Kann et al. (2011) and Berger (2014), supplemented by the database maintained by one of us (J.G.)222http://www.mpe.mpg.de/jcg/grbgen.html. One controversial case was added to our list of short bursts (GRB 100816A, = 2.90.6 s; see Appendix).
Following the approach in Nicuesa Guelbenzu et al. (2014, 2015), in our radio survey we focused on a search for optically obscured star-forming activity in short-GRB hosts. We excluded events securely categorized as having early-type hosts since in these cases we did not expect a detectable radio emission due to star-forming activity. In doing so, our first reference concerning the host-galaxy classification was the list of short-GRB host-galaxies provided by Berger (2014), which containes events until mid 2013 (his table 2). We updated this list if additional imaging data were available that required to re-consider the original classification of a host (see Appendix). Concerning short GRBs not listed in Berger (2014), we made use of publicely available data or performed our own observations in order to classify suspected host galaxies. Cases with no clear host-galaxy classification (early or late-type galaxy) were not rejected. This concerned two events (GRB 090621B and 101224A). Once this step was done our first choice were short-GRB hosts that were detected in the infrared bands by the Wide-field Infrared Survey Explorer (WISE) satellite (Wright et al., 2010) but which are not elliptical galaxies. Cases with more than one host-galaxy candidate were included in our target list as long as at least one candidate is not an elliptical galaxy. Radio observations could in principle reveal if one host-galaxy candidate is special in some sense, e.g., exhibits a high SFR.
WISE observed the entire sky in four bands at 3.4, 4.6, 12, and 22m (W1, W2, W3, W4, see Wright et al., 2010). The WISE catalog333http://wise.ssl.berkeley.edu/ lists all sources with a measured signal-to-noise ratio greater than 5 in at least one band. Even though the catalog does not have the same sensitivity in all directions, for our purpose it was the best available infrared all-sky data base.
Our analysis showed that 12 short-GRB host galaxies were detected by WISE in at least one band (Table 1). This is 1/3 of the sample of short-GRB hosts (by the year 2015). No host galaxy has been detected at the longest wavelength (W4), while five hosts were detected in the W1, W2 and W3 bands: GRB 060502B at =0.287, GRB 071227 at =0.381, GRB 100206A at =0.407, GRB 150101B at =0.134, and GRB 161104A with an unknown . It is noteworthy that these are not the cosmologically nearest short-GRB hosts. According to their position in the WISE color-color diagram, which combines the W1-W2 color with the W2-W3 color (Wright et al., 2010, their figure 12), the hosts of GRB 071227 and 100206A fall into the starburst category. Similarly, the host of GRB 060502B might be a spiral, while the hosts of GRB 150101B and 161104A could be elliptical galaxies. (see also Fong et al., 2016a; Fong & Chornock, 2016; Xie et al., 2016). Moreover, the host of GRB 150101B is the first GRB host galaxy that harbors an AGN (Xie et al., 2016).
A subset of six host galaxies (or host-galaxy candidates) were detected by WISE in W1 and W2 but not in W3 and W4, while two hosts have only a detection in filter W1. The former group includes GRB 050724, 070724, 070729, 111222A, 130603B, and 150424A, the latter group GRB 070429B and 100816A. Among these, the field of GRB 070729 contains several host-galaxy candidates. Unfortunately, no redshift is known in this case.
| GRB | Decl. | W1 | W2 | W3 | W4 | W1-W2 | W2-W3 | gal. type |
|---|---|---|---|---|---|---|---|---|
| (1) | (2) | (3) | (4) | (5) | (6) | (7) | (8) | (9) |
| 050724 | 27 | 15.350.05 | 15.410.13 | 12.37 | 8.42 | 0.06 0.14 | 3.04 0.13 | |
| 060502B | +52 | 15.290.03 | 14.940.04 | 12.880.35 | 9.65 | 0.35 0.05 | 2.06 0.35 | Spiral |
| 070429B | 32 | 17.380.15 | 16.68 | 12.44 | 9.01 | 0.70 0.15 | – | |
| 070724 | 18 | 17.030.11 | 16.370.22 | 12.340.37 | 9.13 | 0.66 0.25 | 4.03 0.43 | |
| 070729 | 39 | 16.540.05 | 16.690.18 | 13.22 | 9.34 | 0.15 0.19 | 3.47 0.18 | |
| 071227 | 55 | 15.580.03 | 15.150.05 | 11.880.16 | 9.70 | 0.43 0.06 | 3.27 0.17 | LIRG |
| 100206A | +13 | 15.710.05 | 15.150.10 | 11.310.18 | 8.57 | 0.56 0.11 | 3.84 0.21 | LIRG |
| 100816A | +26 | 17.080.12 | 16.870.36 | 12.05 | 8.79 | 0.21 0.38 | 4.82 0.36 | |
| 111222A | +65 | 13.260.02 | 13.160.03 | 12.45 | 8.91 | 0.10 0.04 | 0.71 0.03 | |
| 130603B | +17 | 17.050.11 | 16.950.37 | 12.53 | 8.91 | 0.10 0.39 | 4.42 0.37 | |
| 150101B | 10 | 13.430.03 | 13.180.03 | 12.390.48 | 8.78 | 0.25 0.04 | 0.79 0.48 | Elliptical |
| 150424A | 26 | 16.440.07 | 16.100.17 | 12.12 | 8.69 | 0.34 0.18 | 3.98 0.17 |
Note. — Listed here are all short-GRB hosts and host-galaxy candidates with detections in at least one of the four WISE bands (Wright et al. 2010). Upper limits are given according to the WISE catalog. Column #2 gives the Declination (J2000) in degrees (which decides between a potential ATCA or VLA target), columns #3 to #6 the magnitudes on the four WISE bands, and columns #7 and #8 the corresponding W1-W2 and W2-W3 color (in mag), respectively, which enters the WISE color-color diagram and provides the type of the galaxy (column #9; LIRG = Luminous Infrared Galaxy). All magnitudes refer to the Vega photometric system.
Additional targets were selected according to redshift, because for sensitivity considerations, we wanted to include nearby hosts if possible; thus an additional group of 5 targets entered our list because of their redshift (0.5), even though they were not seen by WISE in any band (GRB 061006, 061201, 061210A, 070809, and 080123).
Finally, we observed three additional short-GRB hosts with unknown redshifts (GRB 090621B, 101224A, and 130515A). The common trait of these hosts is that there was no optically-detected transient. The status of the identification of their host galaxies is thus very different, ranging from ”no known host-galaxy candidate” (GRB 090621B) to ”a host-galaxy candidate outside the Swift/XRT error circle” (GRB 130515A). If they were dusty star-bursting galaxies similar to the host of the short GRB 120804A (SFR300 M⊙ yr-1; Berger et al., 2013b), we would have been able to detect them up to a redshift .
Altogether, our sample consists of 16 short-GRB host galaxies which span a redshift range from =0.1 to 0.8. According to Bromberg et al. (2013) (see also Wanderman & Piran 2015), bursts with 0.8 s represent a much cleaner short-burst sample than longer short-GRB events. Most of our targets belong to this 0.8 s category, i.e., based on their duration these events are confidently a merger and not a collapsar.
| GRB | select. | R.A. (J2000) | Decl. | position | [s] | |
|---|---|---|---|---|---|---|
| (1) | (2) | (3) | (4) | (5) | (6) | (7) |
| ATCA | ||||||
| 050724 | WISE | 0.258 | 16:24:44.36 | 27:32:27.5 | OT | |
| 061006 | redshift | 0.4377 | 07:24:07.66 | 79:11:55.1 | OT | 0.42 |
| 061201 | redshift | 0.111 | 22:08:32.09 | 74:34:47.1 | OT | |
| 070729 | WISE | 03:45:15.97 | 39:19:20.5 | XRT | ||
| 070809 | redshift | 0.2187 | 13:35:04.55 | 22:08:30.8 | OT | |
| 080123 | redshift | 0.496 | 22:35:46.33 | 64:54:02.7 | XRT | |
| 130515A | noOT | 18:53:45.71 | 54:16:45.5 | XRT | ||
| 150424A | WISE | 0.2981 | 10:09:13.38 | 26:37:51.5 | OT | 0.4 |
| VLA | ||||||
| 060502B | WISE | 0.287 | 18:35:44.97 | 52:37:52.4 | XRT | |
| 061210 | redshift | 0.4095 | 09:38:05.17 | 15:37:17.5 | XRT | |
| 070724A | WISE | 0.457 | 01:51:14.07 | 18:35:39.3 | OT | |
| 090621B | noOT | 20:53:53.16 | 69:01:41.5 | XRT | ||
| 100206A | WISE | 0.4068 | 03:08:39.00 | 13:09:24.8 | XRT | |
| 100816A | WISE | 0.8049 | 23:26:57.56 | 26:34:42.9 | OT | |
| 101224A | noOT | 19:03:41.72 | 45:42:49.5 | XRT | ||
| 130603B | WISE | 0.3565 | 11:28:48.15 | 17:04:18.0 | OT |
Note. — Column #2 classifies the used selection criteria: (i) WISE all-sky survey, (ii) small redshift, or (iii) no detected optical transient (noOT; see Sect. 2). Column #3 provides the redshift (see Appendix), if available. Columns #4 and #5 either give the position of the OT or the central coordinates of the XRT error circle (http://www.swift.ac.uk/xrt-positions/; Goad et al. 2007; Evans et al. 2009) as of January 2019. Column #6 distinguishes between the OT and the XRT position of the afterglow. Column #7 provides the burst duration , mostly measured in the Swift/BAT energy band (15-350 keV). For references see the Appendix.
3 Observations and data reduction
3.1 Radio data
All radio-continuum observations were performed with ATCA and VLA in the years 2013 to 2015.
| GRB | date obs. | config. | time | flux calib. | phase calib. | freq. | beam size | 1 |
|---|---|---|---|---|---|---|---|---|
| (1) | (2) | (3) | (4) | (5) | (6) | (7) | (8) | (9) |
| ATCA | ||||||||
| 050724 | 23-10-2015 | 6A | 10.4 | 0823–500 | 1622–253 | 5.5 | 4.4 1.5 | 5.0 |
| 9.0 | 2.7 0.9 | 5.2 | ||||||
| 061006 | 20-07-2013 | 6A | 7.0 | 1934–638 | 0637–752 | 5.5 | 3.0 1.3 | 7.8 |
| 9.0 | 1.9 0.8 | 9.3 | ||||||
| 061201 | 21-07-2013 | 6A | 11.5 | 0823–500 | 2142–758 | 5.5 | 2.3 1.5 | 5.2 |
| 9.0 | 1.4 0.9 | 5.2 | ||||||
| 26-07-2013 | 6A | 3.2 | 1934–638 | 2142–758 | 5.5,9.0 | |||
| 25-07-2013 | 6A | 0.7 | 1934–638 | 2142–758 | 5.5,9.0 | |||
| 070729 | 28-04-2015 | 6A | 11.0 | 0823–500 | 1934–638 | 5.5 | 4.5 2.5 | 7.3 |
| 9.0 | 2.7 1.5 | 6.9 | ||||||
| 070809 | 19-06-2013 | 6A | 9.5 | 1934–638 | 1308–220 | 5.5 | 7.7 1.7 | 6.0 |
| 9.0 | 4.7 1.1 | 6.4 | ||||||
| 080123 | 25-07-2013 | 6A | 8.7 | 1934–638 | 2353–686 | 5.5 | 2.6 1.5 | 6.4 |
| 9.0 | 1.6 0.9 | 6.6 | ||||||
| 130515A | 26-10-2015 | 6A | 7.1 | 1934–638 | 1824–582 | 5.5 | 3.6 1.3 | 6.2 |
| 9.0 | 2.2 0.8 | 7.3 | ||||||
| 150424A | 19-06-2015 | 6D | 1.8 | 1934–638 | 1034–293 | 5.5 | 12.0 1.5 | 7.1 |
| 9.0 | 7.0 0.9 | 8.0 | ||||||
| 23-10-2015 | 6A | 3.2 | 0823–500 | 1034–293 | 5.5,9.0 | |||
| VLA | ||||||||
| 060502B | 18-01-2014 | B | 0.75 | 3C286 | J1829+4844 | 3.0 | 3.0 2.0 | 8.8 |
| 09-10-2014 | C | 1.0 | 3C286 | J1740+5211 | 5.5 | 4.0 3.4 | 6.4 | |
| 061210 | 16-10-2014 | C | 1.0 | 3C286 | J0854+2006 | 5.5 | 3.7 3.2 | 5.3 |
| 070724A | 19-09-2014 | DnC | 1.5 | 3C147 | J0204–1701 | 5.5 | 11.2 7.0 | 7.6 |
| 090621B | 08-10-2015 | D | 0.75 | 3C286 | J2022+6136 | 5.5 | 16.2 10.6 | 5.7 |
| 17-10-2015 | D | 0.5 | 3C286 | J2022+6136 | 5.5 | |||
| 24-10-2015 | D | 0.5 | 3C286 | J2022+6136 | 5.5 | |||
| 28-10-2015 | D | 0.5 | 3C147 | J2022+6136 | 5.5 | |||
| 100206A | 10-10-2014 | C | 1.5 | 3C147 | J0318+1628 | 5.5 | 4.0 3.9 | 13 |
| 100816A | 09-10-2014 | C | 1.5 | 3C147 | J2340+2641 | 5.5 | 5.8 3.8 | 5.8 |
| 101224A | 12-10-2015 | D | 0.5 | 3C286 | J1845+4007 | 5.5 | 11.2 10.0 | 6.4 |
| 14-10-2015 | D | 0.75 | 3C48 | J1845+4007 | 5.5 | |||
| 20-10-2015 | D | 0.75 | 3C286 | J1845+4007 | 5.5 | |||
| 27-10-2015 | D | 0.75 | 3C48 | J1845+4007 | 5.5 | |||
| 30-10-2015 | D | 0.75 | 3C286 | J1845+4007 | 5.5 | |||
| 130603B | 13-11-2014 | C | 1.5 | 3C286 | J1120+1420 | 5.5 | 3.9 3.5 | 6.5 |
Note. — Column #2 provides the date of the start of the observations, column #3 gives the telescope configuration. Column #4 provides the telescope time (in hours). Columns #5 and #6 list the flux and phase calibrators, column #7 the effective frequency. The last two columns contain the size of the synthesized beam in units of arcsec and the 1 rms of the resulting image (in units of Jy beam-1; measured using the imstat task under MIDAS and CASA, respectively). Beam sizes and the rms refer to a robust parameter of 0.5. Except for the S-band (3 GHz) observations of the host of GRB 060502B on 18-01-2014, all VLA obervations were performed in the C band (effectively at 5.5 GHz). For GRB 061201, 090621B, 101224A, and 150424A the 1 rms and beam size refer to the combined data set.
ATCA observations were carried out in the 5.5 and 9.0 GHz bands (corresponding to 6 and 3 cm, respectively), using the upgraded Compact Array Broadband Backend (CABB) detector (Wilson et al., 2011) and all six 22-m antennae with the 6 km baseline (Table 3; programme ID C2840, PI: A. Nicuesa Guelbenzu). We set a technical observing constraint of Decl. (J2000) . ATCA can achieve a sensitivity at 5.5 GHz of Jy beam-1 in a 10-hour integration. Therefore, whenever possible we stayed on a target between 10 and 12 hours in order to obtain the deepest sensitivity, as well as the best coverage of the plane for image fidelity. The 5.5 GHz band is a good compromise between sensitivity and expected radio flux on the one hand, and relatively lower Radio Frequency Interference (RFI) on the other. In the observing mode used here, CABB integrates at 5.5 and 9.0 GHz simultaneously, each with 2048 spectral channels of width 1.0 MHz.
Observations with the VLA went similarly deep as those with ATCA, with integration times typically a factor of 10 smaller because of the larger number of antennas. Observations were performed via dynamical scheduling (programme ID 13B-313, 14B-201, 15B-214; PI: A. Nicuesa Guelbenzu). Most data were obtained in the C band (effectively at 5.5 GHz) in C or D telescope array configuration. One target was also observed in the S band in B configuration (effectively at 3.0 GHz; Table 3). All VLA observations used the WIDAR correlator with the wideband setup and the 8-bit samplers. They were performed in 16 spectral windows with a bandwidth of 128 MHz each, providing a total bandwidth of 2048 MHz per polarization.
In principle, observations in the 2.1 GHz band (16 cm) could provide a better signal-to-noise ratio, since for star-forming galaxies the radio flux typically scales as , 0.7 (e.g., Gioia et al., 1982; Tabatabaei et al., 2017; Klein et al., 2018). However, this band is more affected by RFI. In addition, source crowding at 2.1 GHz is higher, making the identification of faint radio sources more challenging. Moreover, compared to observations in the 2.1 GHz band, at 5.5 GHz the radio sky is less populated with bright radio sources which can also affect the image reconstruction.
During the observations, bandpass and flux calibration were performed in the usual manner. For ATCA observations in most cases the bright radio source PKS 1934–638 (R.A., Decl. J2000 = 19:39:25.026, 63:42:45.63) was used as the calibrator. If this source was not observable, then 0823–500 was observed (R.A., Decl. J2000 = 08:25:26.869, 50:10:38.49). For VLA, the bright radio sources 3C286, 3C147, and 3C48 were observed. Nearby calibrators for phase referencing were chosen depending on the target coordinates via the corresponding web interface provided by the ATCA and the VLA operating institutes CSIRO and NRAO, respectively444For the coordinates and fluxes of the ATCA phase calibrators see https://www.narrabri.atnf. csiro.au/calibrators/c007/atcat.html..
Data reduction was performed with the standard software packages. ATCA data were reduced using the Multichannel Image Reconstruction, Image Analysis and Display (MIRIAD) software package version 1.5 (Sault et al., 1995); for VLA we used the data reduction pipeline under CASA version 5.1.2-4. During the data processing, RFI was examined and eliminated as well as possible from the data. All data were Fourier-transformed using the Briggs robust weighting option (Briggs, 1995), varying this parameter between 0.5, 1.0, and 2.0, and selecting the one that gave the best compromise between the resolution and the noise.
Usually targets were observed for hr (ATCA) and hr (VLA) of elapsed telescope time. Consequently, all observations are fairly deep, typically reaching a 1 between 5 and 8 Jy beam-1 (measured in an empty field around the target position). For 11 of the 16 targets the resulting synthesized beam size was smaller than 55 arcsec2. Observing parameters are reported in Table 3.
3.2 Optical data
Imaging: Optical/near-infrared (NIR) data was downloaded from public data archives (ESO/VLT, Gemini, GTC, HST). Multi-color data were obtained using the optical/near-infrared seven-channel imager GROND mounted at the 2.2m ESO/MPG telescope on ESO/La Silla (Chile) (Greiner et al., 2007, 2008). In two cases (GRB 100816A, 150424A), the optical SFR was also estimated based on a Le Phare555http://www.cfht.hawaii.edu/ arnouts/lephare.html (Arnouts et al., 1999; Ilbert et al., 2006; Arnouts et al., 2013) analysis of the broad-band spectral energy distribution (SED) of the galaxy.
Spectroscopy: In the majority of cases the optical SFR was taken from the literature and is based on emission-line spectroscopy. In two cases the optical SFR was derived either by using our own data (GRB 080123) or by a re-analysis of archival data (GRB 150424A) using the equations relating [H II] luminosity and SFR published in Kennicutt (1998) and Savaglio et al. (2009). Additional details on individual targets are provided in the Appendix. If not otherwise stated, SFR measurements based on emission-line spectroscopy were not corrected for host-galaxy extinction, slit-losses were usually taken into account.
4 Results
4.1 Radio detection of the host of GRB 100206A
With our deep radio observations we detected only one target in our sample: the suspected host of GRB 100206A (Table 2). Using the imfit task under CASA, at 5.5 GHz we measure a flux density of Jy, centered at R.A., Decl. (J2000) = 03:08:39.148 0.017 s, 13:09:29.28 0.15 arcsec. The flux we measure from this source is in agreement with its reported non-detection by Berger et al. (2013b), who found (5.8 GHz)Jy ().
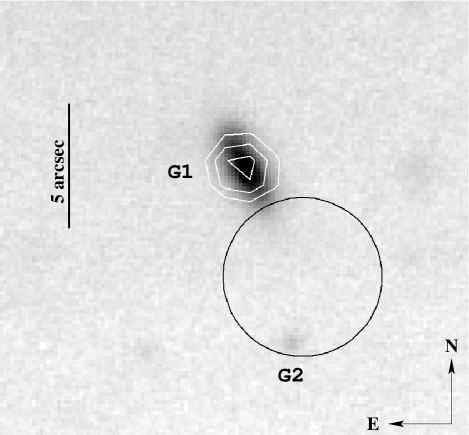
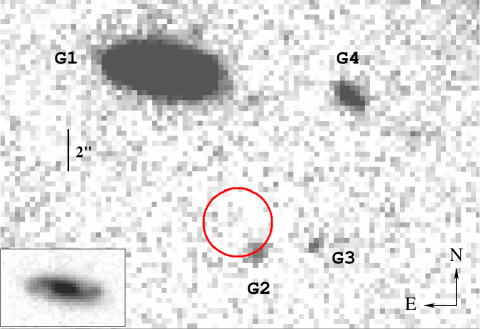
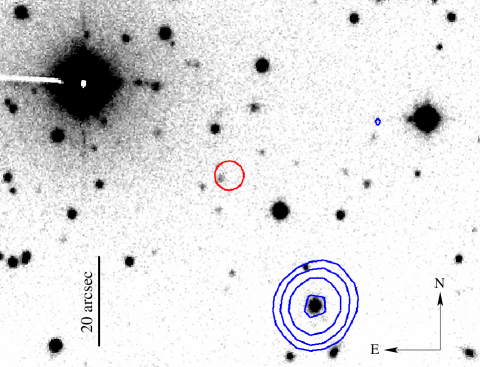
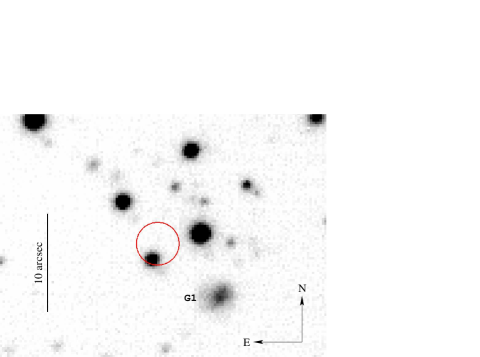
The radio centroid (positional error 0.2 arcsec) lies 5 arcsec away from the center of the Swift/XRT 90% c.l. error circle, which at =0.4068 corresponds to a projected spatial distance of 30 kpc. It coincides with the bulge of the suspected GRB host galaxy (G1; Fig. 1). Assuming a Gaussian distribution for XRT position measurements, this angular distance excludes the origin of the X-rays from the position of the radio centroid with 99% probability. Conversely, with high confidence we do not detect (Table 3) radio emission from sources inside the XRT error circle. Therefore, it is unlikely that the measured radio flux is physically related to the burst (e.g., the radio afterglow).
Furthermore, according to Perley et al. (2012) the observed [N II]/H and [O III]/H emission line ratios of this galaxy favor the interpretation that the strong H line is due to star formation and not associated with AGN activity. This would be consistent with evidence from the radio map; using the imfit task under CASA, the radio source is marginally resolved in one direction which would be unexpected in the case of an AGN.
In order to calculate the radio SFR, we follow Greiner et al. (2016) (with reference to Murphy et al., 2011), according to which666For a recent discussion on the radio-based SFR calibration we refer to the comprehensive analysis by Tabatabaei et al. (2017), Mahajan et al. (2019), and Tisanić et al. (2019).
| (1) |
Here is the luminosity distance, is the spectral slope (unlike those authors, we use the convention ).
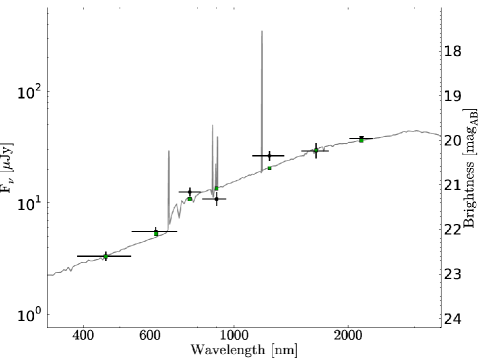
If the observed radio flux is completely due to star-forming activity, then it corresponds to a SFR of M⊙ yr-1(assuming ). This is roughly twice the value derived by Perley et al. (2012) from a study of the broad-band SED of this galaxy in the wavelength range between 0.5 and 20m (observer frame).
This picture does not change when we perform a GRASIL analysis of the SED of this galaxy from the optical to the radio band777for details of the code and the set of templates see Silva et al. (1998); Iglesias-Páramo et al. (2007); Michałowski et al. (2010), analogous to what we have done in Nicuesa Guelbenzu et al. (2014). Adding now the radio detection to the data implies a SFR of 63 M⊙ yr-1, an IR luminosity of =11.58, a mass in stars of =11.42, and a global host visual extinction of =2.10 mag.
Recently, Perley et al. (2017) reported results of a re-observation of several long-GRB host galaxies where substantial radio-derived star formation rates in excess of 100 M⊙ yr-1 had been found in previous studies. Surprisingly, for none of their 5 hosts these authors could reproduce the previously reported large SFRs. As stressed by Perley et al. (2017), radio afterglow contamination, noise fluctuations, and numerical artifacts produced by the image processing could have affected some of the previous radio detections. In the case of GRB 100206A, our detection and radio flux measurement is supported by three independent studies: The flux density we measure at 5.5 GHz fits well with what has been predicted for this galaxy based on its observed optical/infrared broad-band SED (Perley et al. 2012, Nicuesa Guelbenzu et al. 2014, their figure 4, Contini 2018, her figure 3).
Even though the host of GRB 100206A is forming stars at a high rate, a physical link between the formation of the GRB progenitor to the present epoch of star formation cannot be established. Though the (90% c.l.) XRT error circle touches the outer regions of the suspected host galaxy (G1, Fig. 1), the large (projected) spatial offset between the burst position and the centroid of the detected radio source disfavors such a conclusion.
4.2 Non-detections and upper limits on star formation rates
For the remaining 15 targets, we can only provide deep upper limits on the SFR, as given in Table 4. In the case of our ATCA observations the SFR is best constrained at 5.5 GHz. In the case of VLA all limits on the SFR refer to observations in the C band (5.5 GHz).
| GRB | SFR(radio) | SFR(opt.) | Ref. | |
|---|---|---|---|---|
| M⊙ yr-1 | M⊙ yr-1 | |||
| ATCA | ||||
| 050724 | 0.258 | 8 | 0.05–0.17 | [1] |
| 061006 | 0.438 | 42 | 0.02 | [2] |
| 061201 | 0.111 | 1.5 | 0.14 | [3] |
| 070729 | 0.8 | 160 | ||
| 070809 | 0.219 | 7 | 0.15 | [4] |
| 080123 | 0.496 | 46 | 0.7 | [5] |
| 130515A | 0.5 | 45 | ||
| 150424A | 0.298 | 16 | 0.5–7 | [5] |
| VLA | ||||
| 060502B | 0.287 | 12 | 0.4–0.8 | [6] |
| 061210 | 0.410 | 25 | 1.2 | [6] |
| 070724A | 0.457 | 45 | 8.4 (+0.6,6.1) | [11] |
| 090621B | 0.5 | 42 | ||
| 100206A | 0.407 | 30 | [8] | |
| 100816A | 0.805 | 127 | [7] | |
| 101224A | 0.5 | 47 | ||
| 130603B | 0.356 | 22 | 1.7–5 | [6,9] |
Note. — Radio-derived upper limits refer to 5 at 5.5 GHz (Eq. 1). In three cases no redshift is known and we assumed =0.5; for GRB 070729 we used a photometric redshift estimate from Leibler & Berger (2010) (see Appendix). If not otherwise stated, optical data refer to emission-line measurements. See the Appendix for more details. Additional notes to individual sources: GRB 061201: the data refer to the host-galaxy candidate G1. GRB 070809: the data refer to the host-galaxy candidate G1. The host-galaxy candidate G2 is not included in this table as it is an elliptical galaxy. GRB 100206A: the data refer to the host-galaxy candidate G1. GRB 130515A: the SFR is based on a Le Phare fit of the broad-band SED obtained with GROND (Fig. 9). GRB 150424A: the data refer to the bright spiral next to the OT. The SFR based on optical spectroscopy is 0.15 M⊙ yr-1, while the SFR based on a Le Phare fit of the galaxy’s SED is 7 M⊙ yr-1 (Fig. 10). References: [1] Berger et al. (2005); Prochaska et al. (2006); Malesani et al. (2007), [2] Berger (2009), [3] Stratta et al. (2007), [4] Perley et al. (2008), [5] this work, [6] Berger (2014), [7] Krühler et al. (2015), [8] Perley et al. (2012), [9] Cucchiara et al. (2013); Fong et al. (2014); de Ugarte Postigo et al. (2014), [10] Kocevski et al. (2010), [11] Chrimes et al. (2018).
Figure 2 summarizes the radio-derived SFRs888A similar plot is shown in Stanway et al. (2014) but for long-GRB host galaxies. Since these authors used a slightly different equation for the transformation of radio flux into SFR, their curves SFR() do not perfectly match the curves shown here. Because of analogous reasons, the radio-SFR calculated for GRB 120804A differs slightly from the SFR calculated by Berger et al. (2013b, their equation 4).. For those cases in our target list where more than one host-galaxy candidate is implicated, we only plot the result for the host-galaxy candidate with the smallest redshift (in no cases is this an elliptical galaxy). The four bursts from our sample without spectroscopic redshifts (GRB 070729, 090621B, 101224A, and 130515A) are not plotted. These data are supplemented by data taken from Nicuesa Guelbenzu et al. (2014, GRB 071227), and Berger et al. (2013b, GRB 120804A). In addition, we display data from Fong et al. (2015, their table 8) and Fong et al. (2016b, their table 1). All upper limits reported by these authors have been transformed to an observing frequency of 5.5 GHz, assuming a spectral slope =0.7. In those cases where several observations with different upper limits were reported for the same host, only the most constraining data point is plotted.999Seven bursts in our target list are also included in the summarizing table in Fong et al. (2015). Our radio upper limits are significantly deeper, however. The field of GRB 050724, 070724A, and 130603B was also observed with the VLA by Fong et al. (2016b); their upper limits agree with ours.
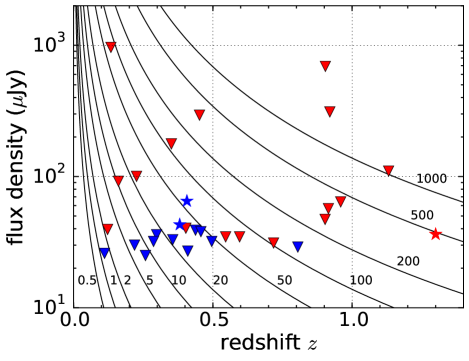
Figure 2 shows that at 5.5 GHz a sensitivity of better than about 40Jy ( rms) has been reached for more than 50% of the targeted galaxies. Reaching much deeper sensitivity limits would require much more telescope time.
If we consider a SFR sensitivity of 20 M⊙ yr-1as a minimum we would like to achieve for a target, then we are restricted to the lowest redshifts, . In our sample all 5 targeted galaxies in this redshift range remained undetected. For the nearest events at the inferred SFR upper limits do even reach 1.5 to 5 M⊙ yr-1. Though the sample size is small, one important result can be stressed: In no case evidence for intense star-forming activity close to a GRB explosion site has been found.
Going to higher redshifts increases the sample size, but already for targets with 0.5 the achieved SFR sensitivity is just sufficient to potentially find the most extreme star-forming hosts: At redshifts 0.5 even star-forming galaxies with a SFR of 50 M⊙ yr-1will not be detected anymore. All this naturally limits the meaningfulness of such radio surveys.
Nevertheless, the data clearly show that the majority of short-GRB hosts is not forming stars at a high rate, though some clearly do. This raises the question whether the percentage of heavily star-forming hosts among the short-GRB host-galaxy ensemble is unexpectedly high.
4.3 The most actively star-forming short-GRB hosts
Among the 25 short-GRB host galaxies listed in Berger (2014) which have a measured SFR (bursts from mid 2005 to 2010), 18 hosts have an optical SFR M⊙ yr-1 (in his list GRB 071227 has 0.6 M⊙ yr-1). The remaining seven hosts have an optical SFR between 2.5 and 30 M⊙ yr-1. Only the host of GRB 100206A (in his list 30 M⊙ yr-1) and GRB 101219A (16 M⊙ yr-1) lie above 10 M⊙ yr-1.
Following GRB 071227 (Nicuesa Guelbenzu et al. 2014), the host of GRB 100206A is the second short-GRB host in our sample with a radio detection due to star-formation activity. Together with the hosts of GRB 101219A (=0.718; Chornock & Berger 2011), GRB 100816A (see Table 4; Krühler et al., 2015), and GRB 120804A (SFR 300 M⊙ yr-1, 1.3; Berger et al., 2013b), these five hosts represent the current sample of very actively star-forming galaxies that hosted a short GRB (SFR 10 M⊙ yr-1). Though the sample size of these very actively star-forming galaxies is small, it represents at least 10% of the short-GRB host-galaxy population (including all morphological types of hosts).
Given this percentage, is this pointing to a subpopulation of young NS-NS merger systems which were born in recent starbursts? When exploring the consequences of the discovery of the heavily star-forming hosts of GRB 100206A and GRB 120804A, Perley et al. (2012) and Berger et al. (2013b) pointed out that in the redshift range 0.5-−1.0, i.e., close to the redshift range where massive star-forming short-GRB hosts have been found (), the comoving number density of massive, luminous and ultra-luminous infrared galaxies accounts for 10-20% of the total comoving SFR density of the Universe (Casey et al. 2014), but only a small fraction of comoving stellar mass density (Caputi et al. 2006). In this respect, the fraction of heavily star-forming short-GRB hosts found so far is not remarkably high. Thus there is currently no evidence for a subpopulation of short-lived (young) short-GRB progenitors which were born in recent starbursts. Future multi-wavelength studies of very nearby hosts are required to address this question with better statistics.
5 Constraints on radio emission from late-time short-GRB radiation components
Even though our radio data were taken with the goal of searching for optically hidden star-forming activity, our non-detections are well suited to set deep constraints on late-time radiation components of short GRBs. In the following, we quantify the observational limits that can be placed on flux from late-time radio afterglows and late-time kilonova radio flares.
5.1 Constraints on late-time radio afterglow flux
In the time window we are studying here (months to years after the corresponding burst), no radio afterglow of a short GRB has ever been detected. The short burst with the latest successful radio observation is GRB 140903A, whose radio afterglow was still found 10 days post burst (Fong et al., 2015; Zhang et al., 2017). For comparison, several long-GRB radio afterglows have been successfully observed at host-frame times 100 days (Chandra & Frail, 2012, their figure 7). The most extreme example here is the long GRB 030329 whose radio afterglow was still detected several years after the burst (van der Horst et al., 2008; Peters et al., 2019).
Chandra & Frail (2012) performed a detailed analysis of 14 years of radio follow-up observations of GRB afterglows with the VLA, including 35 short bursts (with 2 detections). These data confirmed what is known from the optical/X-ray bands (e.g., Nysewander et al., 2009; Kann et al., 2011; Nicuesa Guelbenzu et al., 2012): short-GRB afterglows are intrinsically dim sources, in each wavelength region being on average at least one order of magnitude fainter than long GRBs. According to figure 8 in Chandra & Frail (2012), in our time window we would expect an afterglow radio luminosity at 8.5 GHz far below erg s-1 Hz-1. Changing the observed frequency to 5.5 GHz does not substantially change this conclusion.
In order to calculate the -corrected luminosities we would infer from our radio observations, we followed Chandra & Frail (2012) (note our convention for ; Sect. 1):
| (2) |
Following these authors, in Table 5 the luminosity assumes an optically thin, flat, post-jet-break radio afterglow with a spectral slope (i.e., a positive radio slope) while assumes a kilonova radio flare with = 0.7 (see Sect. 5.2).
| GRB | |||||||
|---|---|---|---|---|---|---|---|
| (1) | (2) | (3) | (4) | (5) | (6) | (7) | (8) |
| ATCA | |||||||
| 050724 | 0.258 | 8.149 | 25 | 4.0 | 5.0 | 2.2 | 2.8 |
| 061006 | 0.438 | 4.721 | 39 | 17.7 | 25.8 | 9.7 | 14.2 |
| 061201 | 0.111 | 5.979 | 26 | 0.8 | 0.8 | 0.4 | 0.5 |
| 070729 | 0.8 | 4.531 | 37 | 52.8 | 96.8 | 29.0 | 53.3 |
| 070809 | 0.219 | 4.810 | 30 | 3.4 | 4.2 | 1.9 | 2.3 |
| 080123 | 0.496 | 3.678 | 32 | 18.6 | 28.1 | 10.2 | 15.5 |
| 130515A | 0.5 | 1.632 | 31 | 18.3 | 27.8 | 10.0 | 15.3 |
| 150424A | 0.298 | 0.118 | 68 | 14.3 | 18.7 | 7.9 | 10.3 |
| VLA | |||||||
| 060502B | 0.287 | 5.995 | 44 | 8.7 | 11.2 | 2.6 | 3.4 |
| 6.556 | 32 | 6.3 | 8.2 | 3.5 | 4.5 | ||
| 061210A | 0.410 | 5.569 | 27 | 10.6 | 15.1 | 5.8 | 8.3 |
| 070724 | 0.457 | 4.912 | 38 | 18.8 | 27.7 | 10.3 | 15.2 |
| 090621B | 0.5 | 4.219 | 29 | 16.8 | 25.5 | 9.2 | 14.0 |
| 100206A | 0.407 | 3.322 | 65 | 25.6 | 36.4 | 14.1 | 20.0 |
| 100816A | 0.805 | 2.298 | 29 | 42.4 | 78.0 | 23.3 | 42.9 |
| 101224A | 0.5 | 3.215 | 32 | 18.9 | 28.7 | 10.4 | 15.8 |
| 130603B | 0.356 | 1.066 | 33 | 9.8 | 13.5 | 5.4 | 7.4 |
Note. — Column #2 provides the used redshift, column #3 the time after the burst in the GRB host frame in years. Column #4 lists the observed upper limits of the flux density (in Jy). The following two columns provide the specific luminosities in erg s-1 Hz-1 (assuming isotropic emission). The two last columns contain in erg s-1. assumes a radio afterglow, a kilonova radio flare (see text). All luminosities refer to 5.5 GHz.
Table 5 presents the constraints we place on the late-time radio luminosity of the 16 short-GRB events studied here. In the case of multiple 5.5 GHz observations of the same target (GRB 061201, 090621B, 101224A) the calculated luminosities refer to the combined data set, averaged over the time of the observing runs (which were close to each other). This averaging was not done for GRB 060502B, since here the observations included two different frequencies; we used only the result for the 5.5 GHz observation in October 2014. Finally, an averaging was not done for GRB 150424A either; here only the data from the observing run in June 2015 were taken into account (see Appendix).
Table 5 shows that our observations achieved a sensitivity between 0.1 and 5 erg s-1 Hz-1. Assuming that after its peak a radio afterglow flux fades according to (Chandra & Frail, 2012), our non-detection of radio emission from short-GRB explosion sites months to years after a burst is not unexpected (see figure 8 in Chandra & Frail 2012).
Finally, we note that in our time window at 5.5 GHz radio emission from the reverse shock is not expected to be detectable (Resmi & Zhang, 2016, their figure 1).
5.2 Constraints on late-time kilonova radio flares
According to the picture emerging from GW170817 and GRB 170817A, short bursts originating from compact binary mergers with a NS component should be followed by kilonova light (Lattimer & Schramm, 1974; Symbalisty & Schramm, 1982; Li & Paczynski, 1998). Indeed, at least 5 events from our target list showed evidence for an additional radiation component in their optical/NIR afterglows: GRB 130603B (Berger et al., 2013a; Tanvir et al., 2013), GRB 070809 (Jin et al., 2019), and GRB 050724, 061210, and 150424A (Rossi et al., 2019).
Several authors have pointed out that the interaction of the dynamical mass ejecta with the circumburst medium could produce long-lasting radio emission, a radio flare (Nakar & Piran, 2011; Margalit & Piran, 2015; Hotokezaka & Piran, 2015; Horesh et al., 2016; Hotokezaka et al., 2018; Radice et al., 2018). Moreover, if the merger is followed by the formation of a rapidly spinning magnetar (period 1 ms), a deposition of this energy into the ejecta could result in an even brighter flare (Metzger & Bower, 2014; Fong et al., 2016b; Horesh et al., 2016; Kathirgamaraju et al., 2019).
Given the expected peak time, light curve, and potentially high radio luminosity, a kilonova radio flare could be unambiguously identified on times scales of 1 to 10 years (e.g., Radice et al., 2018). If detected, radio flares could act as the smoking gun of past kilonova events. However, no such signal has yet been reported.
Figure 3 summarizes the upper limits we can set for a kilonova radio signal for a total of 19 events. These include:
-
(i)
12 short bursts with known redshift from the sample discussed here (Table 2);
-
(ii)
6 additional short bursts with known redshift studied by Fong et al. (2016b): GRB 051221A, 080905A, 090510, 090515, 100117A, 101219A;
-
(iii)
the short GRB 071227 (Nicuesa Guelbenzu et al., 2014). Even though in this case the host was detected in the radio band, the emission does not arise from the position of the optical afterglow but from the central bulge of the host (=0.381). The radio data ((host frame)=4.038 yr) then constrain the flux from the GRB explosion site to (5.5 GHz) Jy (5), i.e., erg s-1.
We note that for some events several host-galaxy candidates exist. Analogous to Table 4, in these cases we used the redshift of the cosmologically less distant galaxy. Not included in Fig. 3 are those 4 events in our sample where no spectroscopic redshift is known (GRB 090621B, 070729, 101224A, 130515A).
For comparison, in Fig. 3 we also plot the peak luminosity computed at 5.5 GHz and the peak time emission of the radio flare produced by the interaction of the dynamical ejecta with the surrounding interstellar medium as given by the analytical estimate of Hotokezaka & Piran (2015). The model assumes ejecta kinetic energy erg and velocities c as inferred from numerical relativity simulations Hotokezaka et al. (2018); Radice et al. (2018). The microphysical parameters are fixed to = 0.01, =0.1, =2.4. We also plot a model for a magnetar-powered radio flare as it is discussed by Fong et al. (2016b) and where we have chosen two values for the circumburst gas density (= 10 cm-3), a rotational energy of the magnetar of erg and an ejected mass of = 0.03 M⊙(adopting = 0.1, =0.1, =2.4).
Our negative observational result augments previous unsuccessful searches for late-time radio flares following short GRBs (Metzger & Bower, 2014; Fong et al., 2016b; Horesh et al., 2016). Even though most of our data explore a parameter space similar to what was already discussed by these authors, we provide four more events with secure host-galaxy identification and spectroscopic redshift (GRB 061006, 061210A, 100206A, 100816A). GRB 100206A is included in this list, since the radio emission does not arise from a position inside the Swift/XRT error circle but from the central bulge of the suspected host (Fig. 1). In other words, this is not kilonova emission.
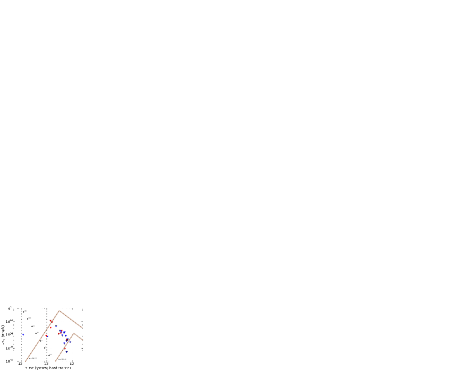
The observations imply that in the time window between about 1 and 10 years (host frame) kilonova radio flares exceeding a luminosity of erg s-1 are either rare or do not exist. In principle, a general non-detection of these flares can still be explained within the allowed broad parameter space of the underlying models, including the not well constrained microphysical parameters and and the uncertainties on the circumburst number density . In any case, the potentially very luminous radio flares predicted by models which rely on magnetar-powered energy deposition into the ejecta were not found in our investigation.
6 Summary and conclusions
We performed a deep radio-continuum survey of 16 short GRB hosts, with the original goal to search for optically obscured star-forming activity. Only one host was detected (GRB 100206A; =0.407). Its detection was not surprising, however, since a high radio flux was already expected based on its observed broad-band SED in the optical/IR bands (Perley et al., 2012; Nicuesa Guelbenzu et al., 2014).
Combining our radio data with published data shows that at least 5 of about 40 short-GRB hosts compiled by Berger (2014) have a relatively high SFR of 10 M⊙ yr-1 (GRB 071227, 100206A, 100816A, 101219A, 120804A).
The present data base show that galaxies forming stars at a high rate are not uncommon among the short-GRB host-galaxy population. However, whether or not this implies a physical link between recent star-forming activity and the formation of short-lived short-GRB progenitors is not clear. At least in the case of GRB 071227 and 100206A, the radio emission which traces the star-formation activity does not arise from the GRB explosion site. Furthermore, at least 3 of these 56 hosts are characterized by a relatively large stellar mass (GRB 071227, 100206A, 120804A; see Nicuesa Guelbenzu et al., 2014, their table 1). As noted by several authors (e.g., Leibler & Berger 2010; Fong & Berger 2013; Berger 2014), it could just be the large reservoir of stars which increases the probability of a NS-NS merger to occur (for detailed stellar population synthesis models see, e.g., Tauris et al. 2017; Belczynski et al. 2018.)
In conclusion, in the local universe (0.3) star-forming short-GRB host galaxies are not forming stars at very high rates. There is no observational evidence for optically obscured star formation. The first extensively star-forming short-GRB hosts appear in the redshift range from = 0.3 to 0.5 (GRB 071229 and 100206A). The data suggest that beyond =0.3 a non-negligible fraction of short-GRB hosts is forming stars at a high rate.
In addition to our search for optically obscured star-formation activity, we used our radio data to derive deep upper limits on the luminosity of the corresponding GRB afterglows and predicted late-time radio flares following short-GRB kilonovae. While the general non-detection of a radio afterglow on timescales of months to years after a short burst is not surprising, our data provide valuable constraints on kilonova magnetar models. By adding 12 more events with redshift information, we substantially increased the available data set for quantifying the luminosities of radio flares in the time frame between 1 and 10 years (host-frame time) post burst. Their general non-detection places severe constraints on the most extreme kilonova models (e.g., Fong et al. 2016b). The existence of very bright and long-lasting radio flares as predicted by these models is not supported by the data.
In order to draw more definitive conclusions on the age distribution of the short-GRB progenitor population and the existence or non-existence of radio flares, more and better data are needed. In particular, hosts at low redshifts may act as future “Rosetta Stone events”; the host of GRB 170817A at 40 Mpc (Abbott et al., 2017; Coulter et al., 2017; Smartt et al., 2017; Kim et al., 2017) is the first such promising case in this new sample of LIGO/Virgo-selected events. The future discovery of gravitational wave signals from short-GRBs in cosmologically local hosts suggests that the age distribution of short-GRB progenitors and the brightness of kilonova radio flares will be estabished more firmly in the near future.
Appendix A Notes on individual targets
General: Enhanced Swift/XRT error circle data were taken from http://www.swift.ac.uk/xrt- positions/ (Goad et al., 2007; Evans et al., 2009). In the following all reported XRT coordinates with their corresponding error radii refer to January 2019 (90% c.l.).
Follow-up observations of short-GRBs in the radio band are summarized in Chandra & Frail (2012) and Fong et al. (2015). The following bursts from our target list have reported radio observations within some days after the event: GRB 050724, 061210A, 070724, 070729, 090612B, 101224A, 130603B, and 150424A. Detected were only the radio afterglows of GRB 050724, 130603B, and 150424A (see Fong et al., 2015, their table 8).
GRB 050724: The initial pulse of the burst was hard and had a FRED-like profile. It was followed by softer emission; (15-350 keV)= s (Krimm et al., 2005). Its observed spectral lag is consistent with those of short bursts (Gehrels et al., 2006). The afterglow and its host galaxy are in detail discussed in the literature (Berger et al., 2005; Gorosabel et al., 2006; Prochaska et al., 2006; Malesani et al., 2007; Fong et al., 2011). The optical afterglow was located in the outskirts of a relatively bright galaxy (20 mag) at a redshift of . A global host extinction of 0.4 mag was derived by Gorosabel et al. (2006). The radio afterglow was detected with the VLA 0.6 days after the burst at 8.46 GHz ( = 173 Jy). It was only seen again one day later at 8.46 GHz ( = 465 Jy; Berger et al., 2005; Fong et al., 2015).
Several authors have classified the host as an elliptical galaxy (e.g., Berger et al., 2005). Though (Malesani et al., 2007) found that it shows a faint outer spiral structure, suggesting that is a disk galaxy with a light-dominating central bulge. This conclusion was strengthened by HST images (see figure 3 in Fong et al., 2011).
Based on optical spectroscopy, the galaxy has a very low star formation rate. Reported upper limits are 0.02 M⊙ yr-1 (Berger et al., 2005), 0.05 M⊙ yr-1 (Prochaska et al., 2006), and 0.17 M⊙ yr-1 (Malesani et al., 2007).
GRB 060502B: The Swift/BAT lightcurve consists of two spikes. According to Sato et al. (2006), (15-350 keV) = 9020 ms, while according to Krimm et al. (2006); D’Avanzo et al. (2014) it is (15-350 keV) = 140 ms. No optical afterglow was found. The burst and its suspected host are in detail discussed by Bloom et al. (2007). According to these authors, the most likely host-galaxy candidate is a relatively bright early-type galaxy galaxy ( 18.7 mag, =0.287) 17.5 arcsec south of the XRT error circle (see their figure 1). However, publicly available Gemini-N/GMOS images (programme ID GN-2006A-Q-14 PI: B. Schmidt) taken in May 2006 clearly reveal a disk component with at least one spiral arm in both directions. Based on the [O II] emission line, Bloom et al. (2007) calculated a SFR of 0.4–0.8 M⊙ yr-1. Berger et al. (2007) (their figure 1) pointed out that a much fainter galaxy ( mag) is located inside the XRT error circle. Its redshift is not known.
GRB 061006: The burst began with an intense double-spike, followed by lower-level persistent emission. Including this radiation component the duration is (15-350 keV)=13010 s (Krimm et al., 2006). The burst was also seen by the Suzaku Wideband All-sky Monitor (WAM) and (50 keV -5 MeV)=0.42 s (Urata et al., 2006a). The optical afterglow was found with VLT/FORS1 (Malesani et al., 2006a, b). In Gemini-S/GMOS images the host galaxy appears as a faint (24.0 mag) and fuzzy object (see figure 1 in Berger et al., 2007). Its shows weak emission lines from the [O III] doublet, H, and [O II] at a common redshift of . The [O II] line flux corresponds to a SFR of 0.02 M⊙ yr-1 (Berger, 2009).
HST observed the field in several occasions between October 2006 and November 2007 using ACS in the NIR (filter F814W; programme ID 10917, PI: D. Fox). The host is an inclined, nearly edge-on spiral galaxy. The optical afterglow was located close to the galactic bulge (see figure 9 in Fong et al., 2011).
GRB 061201: The burst had a double-peak structure, there is no evidence for extended emission. Its duration was (15-350 keV) = s (Markwardt et al., 2006); D’Avanzo et al. (2014) give (15-350 keV) = 0.78 s. On VLT/FORS2 images the suspected host is a bulge-dominated galaxy 17 arcsec NW from the afterglow (in the following G1; see figure 5 in Stratta et al., 2007). Long-slit spectroscopy revealed emission lines from [O II] and H at a common redshift of . Similar results were reported based on Magellan observations (Berger, 2006a). The SFR based on the H flux is 0.14 M⊙ yr-1 (Stratta et al., 2007).
The field was observed by HST in three different epochs between 2007 and 2013 (programme ID 12502, PI: A. Fruchter). Although the HST image goes deeper than the VLT image, at the position of the optical transient there is no evidence for an underlying galaxy. However, inside the 14 XRT error circle lies a faint galaxy (G2) that is not visible on the VLT/FORS2 images. It is located 18 south-east of the optical transient (25.5 mag; see figure 10 in Fong et al., 2011). There is no redshift information. The position of this galaxy close to the optical transient classifies it as second host-galaxy candidate.
GRB 061210: The Swift/BAT lightcurve shows a hard FRED-like spike, followed by extended, soft emission; (15-350 keV) is s (Palmer et al., 2006). The burst was also seen by Suzaku/WAM and (50 keV-5 MeV) = 0.047 s (Urata et al., 2006b).
No optical afterglow was found. A host-galaxy candidate was first identified by Berger (2006b), its redshift is 0.41 (Cenko et al., 2006; Berger et al., 2007). On archived Gemini-N/GMOS images the host appears as a bulge-dominated galaxy (see figure 1 in Berger et al., 2007). According to Berger (2014), its SFR is 1.2 M⊙ yr-1.
GRB 070724A: In the Swift/BAT energy band the burst showed a single spike. According to Parsons et al. (2007), (15-350 keV) was s, while according to D’Avanzo et al. (2014) it was 0.43 s. The discovery of the optical/NIR afterglow was reported by Berger et al. (2009a) (see their figure 1). These authors also studied the host galaxy which lies at a redshift of =0.457 (see also Kocevski et al., 2010, their figure 3). The optical/NIR afterglow was affected by about 2 mag host-galaxy visual extinction along the line of sight (Berger et al., 2009a), indicating that this is a dust-rich host. Optical spectra revealed a global SFR between about 1 and 100 M⊙ yr-1; internal host-galaxy extinction made a more robust measurement difficult (Kocevski et al., 2010). According to Berger (2014), the SFR is 2.5 M⊙ yr-1.
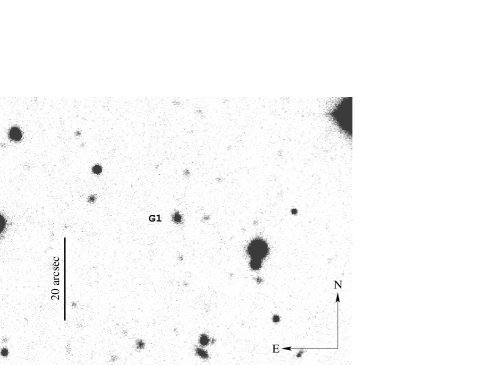
GRB 070729: The Swift/BAT light curve showed two overlapping peaks. According to Sato et al. (2007), (15-350 keV) = s, while D’Avanzo et al. (2014) measure (15-350 keV) = 0.99 s. Follow-up observations did not reveal an afterglow, either in the optical (for GROND see Küpcü Yoldaş et al., 2008) or in the radio band (Chandra & Frail, 2007). At the western border of the enhanced XRT error circle lie two (or three) faint objects (G2; Küpcü Yoldaş et al., 2008). Several additional brighter galaxies lie some arcsec away (G1, G3, and G4-G6; Fig. 4).
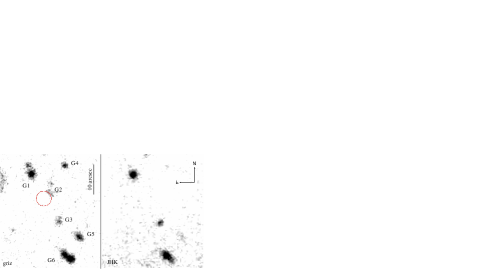
The field was also studied by Leibler & Berger (2010). Based on their broad-band photometry these authors derived a photometric redshift for G3 of . No spectroscopic redshifts are known. The GROND data suggest that G1, G3, and G6 are dusty star-forming galaxies, probably at the same redshift. G1 and G6 have been detected by the WISE satellite (G1 is listed in Table 1). G1 and G3 are very red objects 3 mag). We consider G1-G3 as host-galaxy candidates. None of these labeled galaxies (G1-G6) has been detected in our ATCA observing run.
GRB 070809: The Swift/BAT light curve shows a single peak. According to Krimm et al. (2007), (15-350 keV) = s, while according to D’Avanzo et al. (2014), it is (15-350 keV) = 1.28 s. The recent possible detection of kilonova light in the GRB afterglow confirms the short-burst nature of this event (Jin et al., 2019).
Observations with the Keck telescope did not reveal an underlying host galaxy either at the position of the optical afterglow or within the 36 XRT error circle (Perley et al., 2008). The galaxy nearest to the optical afterglow is an edge-on spiral 6 arcsec north-west (named “S2” in figure 2 in Berger, 2010). At a redshift of this galaxy lies at a projected distance of 22 kpc from the optical afterglow. Its flux in the [O II] line corresponds to an optical SFR of M⊙ yr-1. A second galaxy (named “S3” in Berger, 2010) lies 6 arcsec west from the optical transient. It is an E0 elliptical at a redshift of , with no evidence for star formation.
The field was also observed by HST in Aug 2009 and May 2010 with two different filters (F606W/F160W; programme ID 12502, PI: A. Fruchter). At the position of the optical afterglow there is no underlying host galaxy either at the optical (28.1 mag) or in the NIR (26.2 mag; Fong & Berger, 2013). The HST observations revealed the presence of a faint background galaxy inside the XRT error circle (named “S1” in Berger, 2010). Its redshift is not known.
No radio flux was detected either from the three designated galaxies or from the position of the optical transient.
GRB 080123: In the Swift/BAT energy window the burst showed a FRED-like profile, followed by soft, extended emission. (15-350 keV) was s (Tueller et al., 2008). This was refinded to 115.18 s by D’Avanzo et al. (2014). Suzaku/WAM also detected the burst with a duration (50 keV-5 MeV) of about 0.40 seconds (Uehara et al., 2008)pNo optical afterglow was found. VLT/FORS2 -band and ISAAC -band imaging of the field was obtained in May 2009 (ESO programme ID 383.A-0399; PI: S. Klose). Inside the 17 XRT error circle, the VLT images do not reveal any source down to mag and mag. An optical faint source (G2) lies at the border of the XRT error circle, another source around 3 arcsec away (G3; Fig. 5). G2 and G3 are very faint in the band (25.5 mag) and not detected down to mag.
The most prominent object in the field is a galaxy (G1, =0.496; =19.6 mag) 8 arcsec north-east of the center of the XRT error circle (Leibler & Berger, 2010). It is the most likely host-galaxy candidate. The FORS2 -band image reveals that this is an inclined, barred spiral with two symmetric spiral arms.
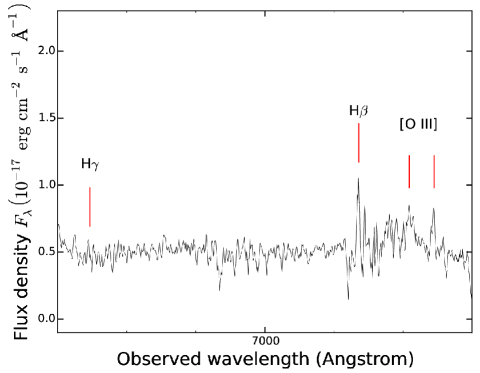
Long-slit spectroscopy of G1 was obtained with VLT/FORS2 in October and November 2011 using the GRIS 600B and GRIS 600RI grism (PI: A. Nicuesa Guelbenzu, ESO programme ID 088.D-0657), covering the wavelength range from 3300 Å to 8450 Å. The spectral slit was oriented along the major axis of the galaxy G1. The spectrum shows emission lines of H, H, and [O III] at a common redshift of =0.496, in agreement with what was reported by Leibler & Berger (2010). The blue spectrum obtained with the GRIS 600B is of less quality; no emission or absorption lines could be identified. The (not extinction-corrected) SFR based on the measured H line flux in the FORS2 spectrum is M⊙ yr-1.
No redshift could be derived for G2. Although during the FORS2 observations the spectral slit was covering this galaxy, no trace of this object could be identified. None of these galaxies was detected in our radio observations.
GRB 090621B: The bursts showed a single peak, in the Swift/BAT energy band (15-350 keV) = s (Krimm et al., 2009). The burst was also detected by Fermi/GBM and (8-1000 keV) = 0.128 s (Goldstein & Burgess, 2009). The X-ray afterglow was rather faint (Beardmore et al., 2009), no optical afterglow was found. A single, faint object inside the XRT error circle ( mag; Levan et al., 2009; Galeev et al., 2009; Cenko et al., 2009) turned out to be an M star (Berger et al., 2009b). No host-galaxy candidate has been reported so far.
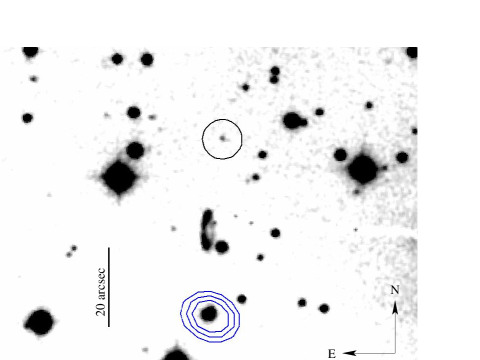
Our VLA radio data reveal a radio source ((5.5 GHz)= 58 Jy), 45 arcsec south of the XRT error circle), at coordinates R.A., Decl. (J2000) = 20:53:53.70, 69:00:55.7. A comparison with our optical observations of the field in July 2012 using the Calar Alto 2.2m telescope (observer: J. Gorosabel) shows at this position a galaxy (Fig. 6). Its morphology cannot be determined with certainty. On our 2.2m/BUSCA -band image its size is about , with the long axis oriented in northwest-southeast direction. Its redshift is not known. The GRB progenitor exploded at a projected distance of 280/340/360 kpc (for =0.5/0.8/1.0) from this object.
GRB 100206A: In the Swift/BAT energy window the burst showed a single spike, (15-350 keV) = 0.120.03 s (Sakamoto et al., 2010). Also Fermi/GBM detected the burst; (8-1000 keV) = s (von Kienlin, 2010). No optical afterglow was found. Perley et al. (2012) performed a comprehensive study of the burst and its host and concluded that this is dusty, infrared bright galaxy (L⊙) at =0.4068 with a global host extinction of = 2 mag and a star formation rate of about 30 M⊙ yr-1. According to its position in the WISE color-color diagram (Wright et al., 2010), this is a starburst galaxy (Sect. 2). Perley et al. (2012) have pointed out that close to this galaxy (in the following G1) lies a 4 mag fainter galaxy (in the following G2). Its redshift is 0.803. Several arguments suggest that G1 is the primary host galaxy candidate while G2 is a background galaxy (Fig. 1).101010Note that the revised XRT coordinates, R.A., Decl. (J2000) = 03:08:39.00, 13:09:24.8 (radius 3.2 arcsec; as of Jan 2019) are slightly different from the XRT coordinates used in Perley et al. (2012).
GRB 100816A: The burst was detected by Swift/BAT and Fermi/GBM. In the BAT energy window it consisted of a single spike with a duration (15-350 keV) = 2.90.6 s (Markwardt et al., 2010a; D’Avanzo et al., 2014), while for GBM (50-300 keV)2 s (Fitzpatrick, 2010). The nature of this burst is debated. With its duration the burst lies intermediate between long and short-population bursts. Its spectrum was hard, characteristic for a short burst, but with a low peak energy (Fitzpatrick, 2010). Its observed spectral lag in the Swift/BAT energy window is consistent with zero, though the errors are relatively large (Norris et al., 2010; Bernardini et al., 2015). Other burst and afterglow properties move the burst closer to the long-burst population (D’Avanzo et al., 2014).
Its optical afterglow was found by Swift/UVOT (Oates et al., 2010). It was well offset from its host (Im et al., 2010); its redshift is (Tanvir et al., 2010; Gorosabel et al., 2010). No late-time supernova signal was detected down to 0.1 the peak luminosity of SN 1998bw (Tunnicliffe & Levan, 2012), supporting the interpretation that GRB 100816A belongs to the short-burst population.
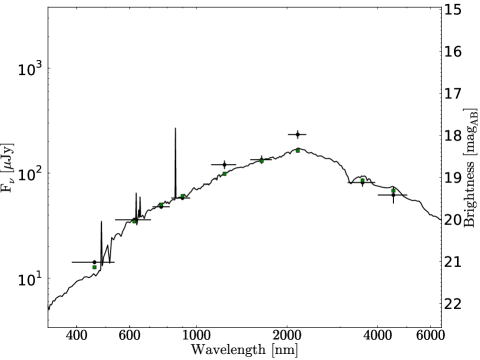
The afterglow was situated in the northern region of its host, about 1.3′′ away from the host galaxy center (for the given redshift this corresponds to about 10 kpc projected distance). In the combined GROND white-band the galaxy appears morphologically disturbed in north-east direction. It is a bulge-dominated galaxy seen nearly face-on (G1; Fig. 7). The host galaxy of GRB 100816A was also detected by WISE in the W1 and W2 bands, but not in W3 and W4.
Based on VLT/X-Shooter spectra, Krühler et al. (2015) find that the host is a dusty galaxy ( = 1.32 (+0.24, 0.22) mag) with an SFR of M⊙ yr-1 and a metallicity of 12+log(O/H)=8.75. The observed mass-metallicity relation for galaxies at (Mannucci et al., 2009; Mapelli et al., 2018) then implies a mass in stars of about log M/M⊙ . The galaxy was also studied by Pérez-Ramírez et al. (2013) using the Spanish 10m Gran Telescopio CANARIAS (GTC) and the telescopes at Calar Alto. These authors found that the SED is best fit by a starburst galaxy. According to our GROND photometry, this is a luminous (M21.7 mag), dusty ( = 0.4 mag), massive (log M/M⊙ = 10.40.4) galaxy with an SFR between 40 and 400 M⊙ yr-1 (Fig. 7).
GRB 101224A: In the Swift/BAT band the burst showed a multi-peak structure, (15-350 keV) = s (Markwardt et al., 2010b; D’Avanzo et al., 2014). It was followed by a rather faint X-ray afterglow which was rapidly fading (Pagani & Krimm, 2010). No optical afterglow was detected (Kuroda et al., 2010; Landsman & Krimm, 2010), no radio afterglow was found (Zauderer et al., 2011). A faint object inside the XRT error circle was discovered by Nugent & Bloom (2010). It was later confirmed by Xu et al. (2010) and found to be a galaxy. Its morphology cannot be determined on our images (Fig. 8).
Our VLA observations reveal a radio source ((5.5 GHz)= 2357 Jy) 35 arcsec south-west of the XRT error circle at coordinates R.A., Decl. (J2000) = 19:03:39.90, 45:42:20.5 (Fig. 8). Its redshift is not known.
GRB 130515A: The burst was seen by several instruments: (i) Swift/BAT: (15-150 keV) = 0.290.06 s (Barthelmy et al., 2013a; D’Avanzo et al., 2014), (ii) Suzaku/WAM: (50 keV-5 MeV) = 0.25 s (Iwakiri et al., 2013), (iii) Fermi/GBM: (50-300 keV) = 0.26 s (Jenke, 2013). No optical afterglow was found. Using archived VLT/FORS2 -band data (ESO programme ID 091.D-0558; PI: A. Levan; Levan & Tanvir, 2013), the galaxy closest to the 22 XRT error circle lies 8.5 arcsec south-west of the XRT position at coordinates RA, Decl. (J2000) = 18:53:44.98, 54:16:50.9 (Fig. 9). Its spectroscopic redshift is not known.
GRB 130603B: The burst was detected by Swift/BAT. It showed a single FRED-like spike, (15-350 keV) = s (Barthelmy et al., 2013b; D’Avanzo et al., 2014). Its observed spectral lag in the Swift/BAT energy window was ms, consistent with zero (Bernardini et al., 2015). The X-ray/optical afterglow and the host galaxy has been studied in detail by several groups (Cucchiara et al., 2013; Fong et al., 2014; de Ugarte Postigo et al., 2014). These authors found that the afterglow was located in a star-forming galaxy at =0.3565. The galaxy is very dusty. The line-of-sight extinction to the optical afterglow was about (host)=0.9 mag, while the global visual extinction of this galaxy is about 1.3 mag. Its extinction-corrected SFR is about 2 to 5 M⊙ yr-1.
The radio afterglow was detected with the VLA 0.37 days after the burst at 4.9 GHz ( = 125Jy) and 6.7 GHz ( = 119Jy). It was only seen again the following day at 6.7 GHz ( = 65Jy; Fong et al., 2014, 2015).
Our non-detection of this galaxy at 5.5 GHz is in agreement with the predicted radio flux of the host in model ’MS5’ discussed by Contini (2018, her figure 4). According to this model at 5.5 GHz one expects , while we measure (in units of erg cm-2 s-1).
GRB 150424A: In the Swift/BAT energy window the burst showed a bright multi-peaked episode followed by extended emission, (15-350 keV) = s (Barthelmy et al., 2015). The burst triggered also Konus-Wind. Here it showed a multipeak structure with a total duration of about 0.4 s (Golenetskii et al., 2015). The optical/X-ray afterglow parameters and its physical implications are in detail discussed in Kaplan et al. (2015), Knust et al. (2017), and Jin et al. (2018). The radio afterglow was discovered with VLA about 18 hr after the burst ( (9.8 GHz) Jy; Fong, 2015).
Follow-up observations performed with the Spanish GTC 10m telescope (programme ID GTC72-15A; PI: A. Castro-Tirado) revealed the presence of a spiral galaxy 2 arcsec south-west to the optical transient (G1; see figure 1 in Jin et al., 2018) and figure 2 in Knust et al. (2017). Castro-Tirado et al. (2015) reported a redshift of for G1. In a reanalysis of this spectrum we found emission from H, [S II] as well as the [N II] doublet at a common redshift of . The flux in the H line is more prominent in the western part than in the eastern part of the galaxy (28 erg s-1 cm-2 vs. 13 erg s-1 cm-2). In total its flux corresponds to a SFR of 0.15 M⊙ yr-1. Since the spectral slit covered only 1/3 of the apparent width of the galaxy a more realistic estimate of the optical SFR is 0.5 M⊙ yr-1.
Figure 10 shows the broad-band SED of G1. Fixing the redshift to =0.3, Le Phare finds that this is a star-forming galaxy (SFR 7 M⊙ yr-1) with an internal reddening of = 0.25 mag. Its mass in stars is about 1010 M⊙.
Follow-up observations with HST revealed the presence of a faint object underlying the position of the optical afterglow (Tanvir et al., 2015). According to these authors this is a faint galaxy at a redshift . This is the second host-galaxy candidate (G2).
The VLA detected the radio afterglow 18 hr after the burst at 9.8 GHz as a faint source ( = 31 Jy) It was not detected anymore 4.8 and 7.9 days after the burst (Fong, 2015).
ATCA observations of the field were performed in June and October 2015, = 0.15 and = 0.50 yr after the burst. Unfortunately, during the October run the source position on the sky resulted in a very elongated synthesized beam; we could not reduce these data completely, the MIRIAD/restore command failed. This problem did not occur with the combined ATCA data set. Table 3 lists the beam size and the error for the combined data set.
The problem with the October run did not affect a setting of constraints on the SFR (none of both galaxies was detected). However, the predicted flux of a kilonova radio flare can be rapidly evolving with time; it can be very different for two different times and if (see Fong et al., 2016b, their Eq. 3 and figure 1). Therefore, in Fig. 3 we plot only the constraint on for the first ATCA observing run (for a robust parameter of 0.5 the size of the synthesized beam was and Jy beam-1).
References
- Abbott et al. (2017) Abbott, B. P., Abbott, R., Abbott, T. D., et al. 2017, ApJ, 848, L12
- Abbott et al. (2017) Abbott, B. P. et al. 2017, Astrophys. J., 848, L13
- Arnouts et al. (1999) Arnouts, S., Cristiani, S., Moscardini, L., et al. 1999, MNRAS, 310, 540
- Arnouts et al. (2013) Arnouts, S., Le Floc’h, E., Chevallard, J., et al. 2013, A&A, 558, A67
- Barthelmy et al. (2015) Barthelmy, S. D., Baumgartner, W. H., Beardmore, A. P., et al. 2015, GRB Coordinates Network, Circular Service, No. 17761, #1 (2015), 17761
- Barthelmy et al. (2013a) Barthelmy, S. D., Baumgartner, W. H., Cummings, J. R., et al. 2013a, GRB Coordinates Network, Circular Service, No. 14658, #1 (2013), 14658
- Barthelmy et al. (2013b) Barthelmy, S. D., Baumgartner, W. H., Cummings, J. R., et al. 2013b, GRB Coordinates Network, Circular Service, No. 14741, #1 (2013), 14741
- Beardmore et al. (2009) Beardmore, A. P., Page, K. L., & Curran, P. A. 2009, GRB Coordinates Network, 9550
- Belczynski et al. (2018) Belczynski, K., Bulik, T., Olejak, A., et al. 2018, e-prints, arXiv:1812.10065
- Belczynski et al. (2006) Belczynski, K., Perna, R., Bulik, T., et al. 2006, ApJ, 648, 1110
- Belczynski et al. (2007) Belczynski, K., Stanek, K. Z., & Fryer, C. L. 2007, arXiv e-prints, arXiv:0712.3309
- Berger (2006a) Berger, E. 2006a, GRB Coordinates Network, 5952, 1
- Berger (2006b) Berger, E. 2006b, GRB Coordinates Network, 5922
- Berger (2009) Berger, E. 2009, ApJ, 690, 231
- Berger (2010) Berger, E. 2010, ApJ, 722, 1946
- Berger (2014) Berger, E. 2014, ARA&A, 52, 43
- Berger et al. (2009a) Berger, E., Cenko, S. B., Fox, D. B., & Cucchiara, A. 2009a, ApJ, 704, 877
- Berger et al. (2003) Berger, E., Cowie, L. L., Kulkarni, S. R., et al. 2003, ApJ, 588, 99
- Berger et al. (2009b) Berger, E., Cucchiara, A., Fox, D. B., & Levan, A. J. 2009b, GRB Coordinates Network, 9559
- Berger et al. (2013a) Berger, E., Fong, W., & Chornock, R. 2013a, ApJ, 774, L23
- Berger et al. (2007) Berger, E., Fox, D. B., Price, P. A., et al. 2007, ApJ, 664, 1000
- Berger et al. (2005) Berger, E., Price, P. A., Cenko, S. B., et al. 2005, Nature, 438, 988
- Berger et al. (2013b) Berger, E., Zauderer, B. A., Levan, A., et al. 2013b, ApJ, 765, 121
- Bernardini et al. (2015) Bernardini, M. G., Ghirlanda, G., Campana, S., et al. 2015, MNRAS, 446, 1129
- Bloom et al. (2002) Bloom, J. S., Kulkarni, S. R., & Djorgovski, S. G. 2002, AJ, 123, 1111
- Bloom et al. (2007) Bloom, J. S., Perley, D. A., Chen, H.-W., et al. 2007, ApJ, 654, 878
- Briggs (1995) Briggs, D. S. 1995, in Bulletin of the American Astronomical Society, Vol. 27, American Astronomical Society Meeting Abstracts, #112.02
- Bromberg et al. (2013) Bromberg, O., Nakar, E., Piran, T., & Sari, R. 2013, ApJ, 764, 179
- Burgay et al. (2003) Burgay, M., D’Amico, N., Possenti, A., et al. 2003, Nature, 426, 531
- Cano (2016) Cano, Z. 2016, LPI Contributions, 1962, 4116
- Caputi et al. (2006) Caputi, K. I., Dole, H., Lagache, G., et al. 2006, A&A, 454, 143
- Casey et al. (2014) Casey, C. M., Narayanan, D., & Cooray, A. 2014, Phys. Rep., 541, 45
- Castro Cerón et al. (2010) Castro Cerón, J. M., Michałowski, M. J., Hjorth, J., et al. 2010, ApJ, 721, 1919
- Castro Cerón et al. (2006) Castro Cerón, J. M., Michałowski, M. J., Hjorth, J., et al. 2006, ApJ, 653, L85
- Castro-Tirado et al. (2015) Castro-Tirado, A. J., Sanchez-Ramirez, R., Lombardi, G., & Rivero, M. A. 2015, GRB Coordinates Network, 17758
- Cenko et al. (2006) Cenko, S. B., Kasliwal, M., Cameron, P. B., Kulkarni, S. R., & Fox, D. B. 2006, GRB Coordinates Network, 5946
- Cenko et al. (2009) Cenko, S. B., Levan, A. J., Kasliwal, M. M., & Kulkarni, S. R. 2009, GRB Coordinates Network, 9557
- Chandra & Frail (2007) Chandra, P. & Frail, D. A. 2007, GRB Coordinates Network, 6742, 1
- Chandra & Frail (2012) Chandra, P. & Frail, D. A. 2012, ApJ, 746, 156
- Chornock & Berger (2011) Chornock, R. & Berger, E. 2011, GRB Coordinates Network, 11518, 1
- Chrimes et al. (2018) Chrimes, A. A., Stanway, E. R., Levan, A. J., et al. 2018, MNRAS, 478, 2
- Christensen et al. (2004) Christensen, L., Hjorth, J., & Gorosabel, J. 2004, A&A, 425, 913
- Contini (2018) Contini, M. 2018, A&A, 620, A37
- Coulter et al. (2017) Coulter, D. A., Foley, R. J., Kilpatrick, C. D., et al. 2017, Science, 358, 1556
- Cucchiara et al. (2013) Cucchiara, A., Prochaska, J. X., Perley, D., et al. 2013, ApJ, 777, 94
- D’Avanzo et al. (2009) D’Avanzo, P., Malesani, D., Covino, S., et al. 2009, A&A, 498, 711
- D’Avanzo et al. (2014) D’Avanzo, P., Salvaterra, R., Bernardini, M. G., et al. 2014, MNRAS, 442, 2342
- de Ugarte Postigo et al. (2014) de Ugarte Postigo, A., Thöne, C. C., Rowlinson, A., et al. 2014, A&A, 563, A62
- Evans et al. (2009) Evans, P. A., Beardmore, A. P., Page, K. L., et al. 2009, MNRAS, 397, 1177
- Fan et al. (2010) Fan, X. L., Yin, J., & Matteucci, F. 2010, A&A, 521, A73
- Fitzpatrick (2010) Fitzpatrick, G. 2010, GRB Coordinates Network, 11124, 1
- Fong (2015) Fong, W. 2015, GRB Coordinates Network, Circular Service, No. 17804, #1 (2015), 17804
- Fong & Berger (2013) Fong, W. & Berger, E. 2013, ApJ, 776, 18
- Fong et al. (2013) Fong, W., Berger, E., Chornock, R., et al. 2013, ApJ, 769, 56
- Fong et al. (2011) Fong, W., Berger, E., Chornock, R., et al. 2011, ApJ, 730, 26
- Fong et al. (2010) Fong, W., Berger, E., & Fox, D. B. 2010, ApJ, 708, 9
- Fong et al. (2015) Fong, W., Berger, E., Margutti, R., & Zauderer, B. A. 2015, ApJ, 815, 102
- Fong et al. (2014) Fong, W., Berger, E., Metzger, B. D., et al. 2014, ApJ, 780, 118
- Fong & Chornock (2016) Fong, W. & Chornock, R. 2016, GRB Coordinates Network, Circular Service, No. 20168, #1 (2016), 20168
- Fong et al. (2016a) Fong, W., Margutti, R., Chornock, R., et al. 2016a, ApJ, 833, 151
- Fong et al. (2016b) Fong, W., Metzger, B. D., Berger, E., & Özel, F. 2016b, ApJ, 831, 141
- Fruchter et al. (2006) Fruchter, A. S., Levan, A. J., Strolger, L., et al. 2006, Nature, 441, 463
- Galeev et al. (2009) Galeev, A., Bikmaev, I., Sakhibullin, N., et al. 2009, GRB Coordinates Network, 9549
- Gehrels et al. (2006) Gehrels, N., Norris, J. P., Barthelmy, S. D., et al. 2006, Nature, 444, 1044
- Giacomazzo et al. (2013) Giacomazzo, B., Perna, R., Rezzolla, L., Troja, E., & Lazzati, D. 2013, ApJ, 762, L18
- Gioia et al. (1982) Gioia, I. M., Gregorini, L., & Klein, U. 1982, A&A, 116, 164
- Goad et al. (2007) Goad, M. R., Tyler, L. G., Beardmore, A. P., et al. 2007, A&A, 476, 1401
- Goldstein & Burgess (2009) Goldstein, A. & Burgess, J. M. 2009, GRB Coordinates Network, 9562
- Golenetskii et al. (2015) Golenetskii, S., Aptekar, R., Frederiks, D., et al. 2015, GRB Coordinates Network, Circular Service, No. 17752, #1 (2015), 17752
- Gorosabel et al. (2006) Gorosabel, J., Castro-Tirado, A. J., Guziy, S., et al. 2006, A&A, 450, 87
- Gorosabel et al. (2010) Gorosabel, J., Castro-Tirado, A. J., Tanvir, N., et al. 2010, GRB Coordinates Network, 11125, 1
- Greiner et al. (2008) Greiner, J., Bornemann, W., Clemens, C., et al. 2008, PASP, 120, 405
- Greiner et al. (2007) Greiner, J., Bornemann, W., Clemens, C., et al. 2007, The Messenger, 130, 12
- Greiner et al. (2016) Greiner, J., Michałowski, M. J., Klose, S., et al. 2016, A&A, 593, A17
- Greis et al. (2017) Greis, S. M. L., Stanway, E. R., Levan, A. J., Davies, L. J. M., & Eldridge, J. J. 2017, MNRAS, 470, 489
- Hatsukade et al. (2012) Hatsukade, B., Hashimoto, T., Ohta, K., et al. 2012, ApJ, 748, 108
- Hjorth & Bloom (2012) Hjorth, J. & Bloom, J. S. 2012, The Gamma-Ray Burst - Supernova Connection, 169–190
- Horesh et al. (2016) Horesh, A., Hotokezaka, K., Piran, T., Nakar, E., & Hancock, P. 2016, ApJ, 819, L22
- Hotokezaka et al. (2018) Hotokezaka, K., Kiuchi, K., Shibata, M., Nakar, E., & Piran, T. 2018, Astrophys. J., 867, 95
- Hotokezaka & Piran (2015) Hotokezaka, K. & Piran, T. 2015, Mon. Not. Roy. Astron. Soc., 450, 1430
- Hunt et al. (2011) Hunt, L. K., Palazzi, E., Rossi, A., et al. 2011, ApJ, 736, L36
- Iglesias-Páramo et al. (2007) Iglesias-Páramo, J., Buat, V., Hernández-Fernández, J., et al. 2007, ApJ, 670, 279
- Ilbert et al. (2006) Ilbert, O., Arnouts, S., McCracken, H. J., et al. 2006, A&A, 457, 841
- Im et al. (2010) Im, M., Park, W.-K., Pak, S., et al. 2010, GRB Coordinates Network, 11108, 1
- Iwakiri et al. (2013) Iwakiri, W., Tashiro, M., Terada, Y., et al. 2013, GRB Coordinates Network, Circular Service, No. 14688, #1 (2013), 14688
- Jenke (2013) Jenke, P. 2013, GRB Coordinates Network, Circular Service, No. 14663, #1 (2013), 14663
- Jin et al. (2019) Jin, Z.-P., Covino, S., Liao, N.-H., et al. 2019, e-prints, arXiv:1901.06269
- Jin et al. (2018) Jin, Z.-P., Li, X., Wang, H., et al. 2018, ApJ, 857, 128
- Kann et al. (2011) Kann, D. A., Klose, S., Zhang, B., et al. 2011, ApJ, 734, 96
- Kaplan et al. (2015) Kaplan, D. L., Rowlinson, A., Bannister, K. W., et al. 2015, ApJ, 814, L25
- Kasen et al. (2017) Kasen, D., Metzger, B., Barnes, J., Quataert, E., & Ramirez-Ruiz, E. 2017, Nature, 551, 80
- Kathirgamaraju et al. (2019) Kathirgamaraju, A., Giannios, D., & Beniamini, P. 2019, e-prints, arXiv:1901.00868
- Kennicutt (1998) Kennicutt, Jr., R. C. 1998, ARA&A, 36, 189
- Kim et al. (2017) Kim, S., Schulze, S., Resmi, L., et al. 2017, ApJ, 850, L21
- Klein et al. (2018) Klein, U., Lisenfeld, U., & Verley, S. 2018, A&A, 611, A55
- Knust et al. (2017) Knust, F., Greiner, J., van Eerten, H. J., et al. 2017, A&A, 607, A84
- Kocevski et al. (2010) Kocevski, D., Thöne, C. C., Ramirez-Ruiz, E., et al. 2010, MNRAS, 404, 963
- Krimm et al. (2005) Krimm, H., Barbier, L., Barthelmy, S., et al. 2005, GRB Coordinates Network, 3667
- Krimm et al. (2006) Krimm, H., Barbier, L., Barthelmy, S., et al. 2006, GRB Coordinates Network, 5704
- Krimm et al. (2007) Krimm, H., Barbier, L., Barthelmy, S. D., et al. 2007, GRB Coordinates Network, 6732, 1
- Krimm et al. (2009) Krimm, H. A., Barthelmy, S. D., Baumgartner, W. H., et al. 2009, GRB Coordinates Network, 9551
- Kruckow et al. (2018) Kruckow, M. U., Tauris, T. M., Langer, N., Kramer, M., & Izzard, R. G. 2018, MNRAS, 481, 1908
- Krühler et al. (2015) Krühler, T., Malesani, D., Fynbo, J. P. U., et al. 2015, A&A, 581, A125
- Küpcü Yoldaş et al. (2008) Küpcü Yoldaş, A., Krühler, T., Greiner, J., et al. 2008, in American Institute of Physics Conference Series, Vol. 1000, American Institute of Physics Conference Series, ed. M. Galassi, D. Palmer, & E. Fenimore, 227–231
- Kuroda et al. (2010) Kuroda, D., Yanagisawa, K., Shimizu, Y., et al. 2010, GRB Coordinates Network, Circular Service, No. 11487, #1 (2010), 11487
- Landsman & Krimm (2010) Landsman, W. & Krimm, H. A. 2010, GRB Coordinates Network, Circular Service, No. 11490, #1 (2010), 11490
- Lattimer & Schramm (1974) Lattimer, J. M. & Schramm, D. N. 1974, apjl, 192, L145
- Leibler & Berger (2010) Leibler, C. N. & Berger, E. 2010, ApJ, 725, 1202
- Levan et al. (2009) Levan, A. J., Curran, P., Wiersema, K., & Groot, P. 2009, GRB Coordinates Network, 9547
- Levan & Tanvir (2013) Levan, A. J. & Tanvir, N. R. 2013, GRB Coordinates Network, 14667
- Li & Paczynski (1998) Li, L.-X. & Paczynski, B. 1998, Astrophys.J., 507, L59
- Lyman et al. (2017) Lyman, J. D., Levan, A. J., Tanvir, N. R., et al. 2017, MNRAS, 467, 1795
- Mahajan et al. (2019) Mahajan, S., Ashby, M. L. N., Willner, S. P., et al. 2019, MNRAS, 482, 560
- Malesani et al. (2007) Malesani, D., Covino, S., D’Avanzo, P., et al. 2007, A&A, 473, 77
- Malesani et al. (2006a) Malesani, D., Stella, L., Covino, S., et al. 2006a, GRB Coordinates Network, 5705, 1
- Malesani et al. (2006b) Malesani, D., Stella, L., D’Avanzo, P., et al. 2006b, GRB Coordinates Network, 5718, 1
- Mannucci et al. (2009) Mannucci, F., Cresci, G., Maiolino, R., et al. 2009, MNRAS, 398, 1915
- Mapelli et al. (2018) Mapelli, M., Giacobbo, N., Toffano, M., et al. 2018, MNRAS, 481, 5324
- Margalit & Piran (2015) Margalit, B. & Piran, T. 2015, MNRAS, 452, 3419
- Markwardt et al. (2006) Markwardt, C., Barbier, L., Barthelmy, S. D., et al. 2006, GRB Coordinates Network, 5882
- Markwardt et al. (2010a) Markwardt, C. B., Barthelmy, S. D., Baumgartner, W. H., et al. 2010a, GRB Coordinates Network, Circular Service, No. 11111, #1 (2010), 11111
- Markwardt et al. (2010b) Markwardt, C. B., Barthelmy, S. D., Baumgartner, W. H., et al. 2010b, GRB Coordinates Network, Circular Service, No. 11486, #1 (2010), 11486
- Metzger & Bower (2014) Metzger, B. D. & Bower, G. C. 2014, MNRAS, 437, 1821
- Michałowski et al. (2010) Michałowski, M., Hjorth, J., & Watson, D. 2010, A&A, 514, A67
- Michałowski et al. (2012) Michałowski, M. J., Kamble, A., Hjorth, J., et al. 2012, ApJ, 755, 85
- Murphy et al. (2011) Murphy, E. J., Condon, J. J., Schinnerer, E., et al. 2011, ApJ, 737, 67
- Nakar & Piran (2011) Nakar, E. & Piran, T. 2011, Nature, 478, 82
- Nicuesa Guelbenzu et al. (2012) Nicuesa Guelbenzu, A., Klose, S., Greiner, J., et al. 2012, A&A, 548, A101
- Nicuesa Guelbenzu et al. (2014) Nicuesa Guelbenzu, A., Klose, S., Michałowski, M. J., et al. 2014, ApJ, 789, 45
- Nicuesa Guelbenzu et al. (2015) Nicuesa Guelbenzu, A., Klose, S., Palazzi, E., et al. 2015, A&A, 583, A88
- Norris et al. (2010) Norris, J., Ukwatta, T. N., Barthelmy, S. D., et al. 2010, GRB Coordinates Network, Circular Service, No. 11113, #1 (2010), 11113
- Nugent & Bloom (2010) Nugent, P. E. & Bloom, J. S. 2010, GRB Coordinates Network, Circular Service, No. 11491, #1 (2010), 11491
- Nysewander et al. (2009) Nysewander, M., Fruchter, A. S., & Pe’er, A. 2009, ApJ, 701, 824
- Oates et al. (2010) Oates, S. R., Barthelmy, S. D., Beardmore, A. P., et al. 2010, GRB Coordinates Network, 11102, 1
- Pagani & Krimm (2010) Pagani, C. & Krimm, H. A. 2010, GRB Coordinates Network, Circular Service, No. 11488, #1 (2010), 11488
- Palmer et al. (2006) Palmer, D., Barbier, L., Barthelmy, S. D., et al. 2006, GRB Coordinates Network, 5905
- Parsons et al. (2007) Parsons, A., Barbier, L., Barthelmy, S. D., et al. 2007, GRB Coordinates Network, 6656
- Pérez-Ramírez et al. (2013) Pérez-Ramírez, D., Norris, J. P., Gorosabel, J., et al. 2013, in EAS Publications Series, Vol. 61, EAS Publications Series, ed. A. J. Castro-Tirado, J. Gorosabel, & I. H. Park, 345–349
- Perley et al. (2008) Perley, D. A., Bloom, J. S., Modjaz, M., et al. 2008, GRB Coordinates Network, 7889, 1
- Perley et al. (2017) Perley, D. A., Hjorth, J., Tanvir, N. R., & Perley, R. A. 2017, MNRAS, 465, 970
- Perley et al. (2012) Perley, D. A., Modjaz, M., Morgan, A. N., et al. 2012, ApJ, 758, 122
- Perley & Perley (2013) Perley, D. A. & Perley, R. A. 2013, ApJ, 778, 172
- Perley et al. (2015) Perley, D. A., Perley, R. A., Hjorth, J., et al. 2015, ApJ, 801, 102
- Peters et al. (2019) Peters, C., van der Horst, A. J., Chomiuk, L., et al. 2019, ApJ, 872, 28
- Planck Collaboration et al. (2016) Planck Collaboration, Ade, P. A. R., Aghanim, N., et al. 2016, A&A, 594, A13
- Prochaska et al. (2006) Prochaska, J. X., Bloom, J. S., Chen, H.-W., et al. 2006, ApJ, 642, 989
- Radice et al. (2018) Radice, D., Perego, A., Hotokezaka, K., et al. 2018, Astrophys. J., 869, 130
- Resmi & Zhang (2016) Resmi, L. & Zhang, B. 2016, ApJ, 825, 48
- Rossi et al. (2019) Rossi, A., Stratta, G., Maiorano, E., et al. 2019, e-prints, arXiv:1901.05792
- Sakamoto et al. (2010) Sakamoto, T., Barthelmy, S. D., Baumgartner, W. H., et al. 2010, GRB Coordinates Network, Circular Service, No. 10379, #1 (2010), 10379
- Sato et al. (2006) Sato, G., Barbier, L., Barthelmy, S., et al. 2006, GRB Coordinates Network, 5064
- Sato et al. (2007) Sato, G., Barbier, L., Barthelmy, S. D., et al. 2007, GRB Coordinates Network, 6681
- Sault et al. (1995) Sault, R. J., Teuben, P. J., & Wright, M. C. H. 1995, in Astronomical Society of the Pacific Conference Series, Vol. 77, Astronomical Data Analysis Software and Systems IV, ed. R. A. Shaw, H. E. Payne, & J. J. E. Hayes, 433
- Savaglio et al. (2009) Savaglio, S., Glazebrook, K., & Le Borgne, D. 2009, ApJ, 691, 182
- Schlegel et al. (1998) Schlegel, D. J., Finkbeiner, D. P., & Davis, M. 1998, ApJ, 500, 525
- Silva et al. (1998) Silva, L., Granato, G. L., Bressan, A., & Danese, L. 1998, ApJ, 509, 103
- Smartt et al. (2017) Smartt, S. J., Chen, T.-W., Jerkstrand, A., et al. 2017, Nature, 551, 75
- Sokolov et al. (2001) Sokolov, V. V., Fatkhullin, T. A., Castro-Tirado, A. J., et al. 2001, A&A, 372, 438
- Stanway et al. (2010) Stanway, E. R., Davies, L. J. M., & Levan, A. J. 2010, MNRAS, 409, L74
- Stanway et al. (2014) Stanway, E. R., Levan, A. J., & Davies, L. J. M. 2014, MNRAS, 444, 2133
- Stratta et al. (2007) Stratta, G., D’Avanzo, P., Piranomonte, S., et al. 2007, A&A, 474, 827
- Symbalisty & Schramm (1982) Symbalisty, E. & Schramm, D. N. 1982, Astrophys. J. Letters, 22, 143
- Tabatabaei et al. (2017) Tabatabaei, F. S., Schinnerer, E., Krause, M., et al. 2017, ApJ, 836, 185
- Tanvir et al. (2013) Tanvir, N. R., Levan, A. J., Fruchter, A. S., et al. 2013, Nature, 500, 547
- Tanvir et al. (2015) Tanvir, N. R., Levan, A. J., Fruchter, A. S., et al. 2015, GRB Coordinates Network, 18100
- Tanvir et al. (2010) Tanvir, N. R., Vergani, S., Hjorth, J., et al. 2010, GRB Coordinates Network, 11123, 1
- Tauris et al. (2017) Tauris, T. M., Kramer, M., Freire, P. C. C., et al. 2017, ApJ, 846, 170
- Tisanić et al. (2019) Tisanić, K., Smolčić, V., Delhaize, J., et al. 2019, A&A, 621, A139
- Tueller et al. (2008) Tueller, J., Barthelmy, S. D., Cummings, J., et al. 2008, GRB Coordinates Network, 7205
- Tunnicliffe & Levan (2012) Tunnicliffe, R. L. & Levan, A. 2012, in IAU Symposium, Vol. 279, Death of Massive Stars: Supernovae and Gamma-Ray Bursts, ed. P. Roming, N. Kawai, & E. Pian, 415–416
- Uehara et al. (2008) Uehara, T., Ohno, M., Takahashi, T., et al. 2008, GRB Coordinates Network, 7223
- Urata et al. (2006a) Urata, Y., Tashiro, M., Abe, K., et al. 2006a, GRB Coordinates Network, 5717
- Urata et al. (2006b) Urata, Y., Tashiro, M., Abe, K., et al. 2006b, GRB Coordinates Network, 5917
- van der Horst et al. (2008) van der Horst, A. J., Kamble, A., Resmi, L., et al. 2008, A&A, 480, 35
- von Kienlin (2010) von Kienlin, A. 2010, GRB Coordinates Network, Circular Service, No. 10381, #1 (2010), 10381
- Voss & Tauris (2003) Voss, R. & Tauris, T. M. 2003, MNRAS, 342, 1169
- Wainwright et al. (2007) Wainwright, C., Berger, E., & Penprase, B. E. 2007, ApJ, 657, 367
- Wanderman & Piran (2015) Wanderman, D. & Piran, T. 2015, MNRAS, 448, 3026
- Wilson et al. (2011) Wilson, W. E., Ferris, R. H., Axtens, P., et al. 2011, MNRAS, 416, 832
- Woosley & Bloom (2006) Woosley, S. E. & Bloom, J. S. 2006, ARA&A, 44, 507
- Wright et al. (2010) Wright, E. L., Eisenhardt, P. R. M., Mainzer, A. K., et al. 2010, AJ, 140, 1868
- Xie et al. (2016) Xie, C., Fang, T., Wang, J., Liu, T., & Jiang, X. 2016, ApJ, 824, L17
- Xu et al. (2010) Xu, D., Ilyin, I., & Fynbo, J. P. U. 2010, GRB Coordinates Network, Circular Service, No. 11492, #1 (2010), 11492
- Zauderer et al. (2011) Zauderer, A., Berger, E., & Fong, W. 2011, GRB Coordinates Network, Circular Service, No. 11620, #1 (2011), 11620
- Zhang et al. (2017) Zhang, S., Jin, Z.-P., Wang, Y.-Z., & Wei, D.-M. 2017, ApJ, 835, 73