The Megamaser Cosmology Project. XII.
VLBI Imaging of H2O Maser Emission in Three Active Galaxies
and the Effect of AGN Winds on Disk Dynamics
Abstract
We present VLBI images and kinematics of water maser emission in three active galaxies: NGC 5728, Mrk 1, and IRAS 084520011. IRAS 084520011, at a distance of 200 Mpc, is a triple-peaked H2O megamaser, consistent with a Keplerian rotating disk, indicating a black hole mass of (3.30.2)107 . NGC 5728 and Mrk 1 display double-peaked spectra and VLBI imaging reveal complicated gas kinematics that do not allow for a robust determination of black hole mass. We show evidence that the masers in NGC 5728 are in a wind while the Mrk 1 maser system has both disk and outflow components. We also find that disturbed morphology and kinematics are a ubiquitous feature of all double-peaked maser systems, implying that these maser sources may reside in environments where AGN winds are prominent at 1 pc scale and have significant impact on the masing gas. Such AGN tend to have black hole masses 8106 and Eddington ratios 0.1, while the triple-peaked megamasers show an opposite trend.
keywords:
galaxies:active – masers – black hole physics – ISM: jets and outflows – galaxies:nuclei1 Introduction
Luminous 22 GHz H2O megamaser emissions from circumnuclear environments in active galaxies (Lo 2005) present a unique tool to reveal the gas distribution and kinematics of active galactic nuclei (AGN) on subparsec scales. In so-called disk maser systems, such as NGC 4258 (e.g. Herrnstein et al. 1999), the gas resides in a subparsec scale thin disk viewed almost edge-on (i.e. disk inclination greater than 80∘) and follows nearly perfect Keplerian rotation. These disk properties not only allow a measurement of the mass of the supermassive black hole (BH) with an accuracy at the percent level, the geometrical/kinematic information of a disk maser can also be modeled to provide a precise determination of the Hubble constant (e.g. Reid et al. 2013; Kuo et al. 2013; Kuo et al. 2015; Gao et al. 2016).
In a typical survey of H2O megamasers111One can find all H2O megamaser galaxies discovered so far and their maser spectra on the following website : https://safe.nrao.edu/wiki/bin/view/Main/PublicWaterMaserList a disk maser candidate can usually be identified if the spectrum shows the characteristic “triple-peaked profile", i.e. the spectrum displays three distinct maser line complexes that correspond to the redshifted, systemic222The systemic masers refer to the maser spectral components having velocities close to the systemic velocity of the parent galaxy. In pristine triple-peaked maser systems, systemic masers typically have velocities within 100 km s-1 from (see Section 4.1)., and blueshifted components of disk masers (e.g. Kuo et al. 2011).
In addition to the triple-peaked sources, there are also maser galaxies which display only two distinct maser line complexes. In systems such as Mrk 1210 (Zhao et al. 2018) and Circinus (Greenhill et al. 2003), the single-dish spectra reveal two distinct chunks of maser lines which are blueshifted and redshifted with respect to the recession velocities () of the galaxies, but no prominent line complexes can be seen near . In these sources, there are occasionally weak maser lines arising between the redshifted and blueshifted complexes, and these lines often lie within 100 km s-1 from in the spectra. While one can thus define them as systemic masers, their distributions in the single-dish spectra do not allow them to be clearly distinguished from high velocity masers. It is not easy to tell whether these weak lines are simply maser features arising near the edges of the high velocity maser complexes or emission features from orbiting systemic maser clouds which reside near the line-of-sight of the central black hole as found in NGC 4258.
Because of the lack of a maser line complex, double-peaked maser galaxies such as Mrk 1210 would not be ideal systems for determining an accurate Hubble constant at a level of 10% (e.g. Reid et al. 2013; Kuo et al. 2013; Gao et al. 2016). However, these systems could still be used to measure BH mass () with an accuracy sufficient for constraining the relation (Ferrarese & Merritt 2000; Gebhardt et al. 2000; Gtekin et al. 2009, Greene et al. 2016, and references therein) if some of the masers arise from a rotating disk, such as the masers in the Circinus Galaxy (Greenhill et al. 2003).
In the past decade, the Megamaser Cosmology Project (MCP; Reid et al. 2009a; Braatz et al. 2010) mainly focused on the triple-peaked objects to measure and with the highest accuracy. As a result, the double-peaked megamasers have been less explored. Since there is only a small number of case studies (Greenhill et al. 1997, 2003; Kondratko, Greenhill, & Moran 2005) for these systems, the physical natures of the double-peaked megamasers are less well understood.
In this paper, we provide detailed imaging of two double-peaked objects (NGC 5728 and Mrk 1) based on Very Long Baseline Interferometry (VLBI), and we study whether or not their maser features are associated with rotating gas disks. Also, we provide the VLBI image and kinematics of a triple-peaked maser galaxy, IRAS 084520011, which has a distance of 21315 Mpc333This is the 3K CMB distance adopted from the NASA/IPAC Extragalactic Database (NED) in its classic form, which uses 73 km s-1 Mpc-1 for evaluating the Hubble distance.. Studying a distant maser system like this is valuable, because such galaxies are in the Hubble flow such that peculiar motions which contaminate determinations become negligible. Furthermore, such sources allow us to check whether the H2O megamaser technique can be applied to galaxies beyond 200 Mpc for and determination with present sensitivity and angular resolution. Note that there are currently no direct BH mass measurements for the three maser galaxies studied here. In addition, no stellar bulge velocity dispersions () are available from the literature for these sources that can enable us to infer their with the relation. The maser distributions and kinematics presented in this paper will allow us to provide the first constraints on the BH masses for these three maser galaxies.
In section 2, we present our sample of galaxies, VLBI observations and data reduction. In Section 3, we show the VLBI images and position-velocity diagrams of the three megamaser galaxies, followed by a discussion of the nature of two double-peaked systems. We also measure the BH mass for the distant triple-peaked megamaser. In section 4, we will investigate the physical causes that lead to different spectral characteristics. A summary of our results is presented in section 5.
2 THE SAMPLE, OBSERVATION, AND DATA REDUCTION
2.1 The Maser Galaxy Sample
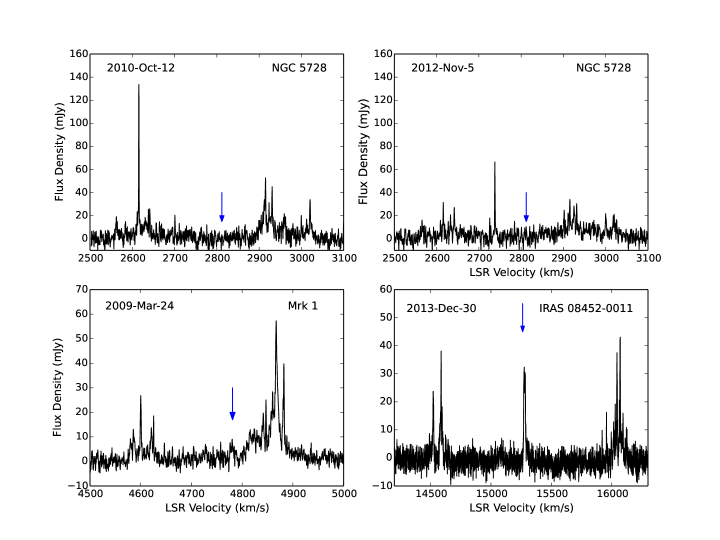
The maser galaxies we study in this paper include NGC 5278, Mrk 1, and IRAS 084520011. The H2O masers in Mrk 1 and NGC 5728 were first discovered in maser surveys conducted by Braatz et al. (1994) and Braatz et al. (2004), respectively, whereas water maser emission in IRAS 084520011 was discovered in a survey as part of the MCP in 2013. Table 1 lists the coordinates, recession velocities, spectral and morphological types for these galaxies. Their maser spectra measured with the 100-m Green Bank Telescope (GBT)444The GBT is a facility of the Green Bank Observatory (GBO), which is operated by the Associated Universities, Inc. under a cooperative agreement between the National Science Foundation (NSF) and the Associated Universities, Inc. are shown in Figure 1.
The left two panels of Figure 1 show the representative spectra of NGC 5728 and Mrk 1. Both spectra display two distinct line complexes that are blueshifted and redshifted with respect to the recession velocities of the galaxies as indicated with blue arrows. These are candidates for BH mass measurements, because such systems could be triple-peaked disk maser systems with weak systemic masers (e.g NGC 6323; see Kuo et al. 2011).
The top-right panel of Figure 1 shows the maser spectrum of NGC 5728 taken 10 days before our VLBI observation; there is a prominent feature at velocity 2738 km s-1 (60 mJy) which could be a systemic maser. This line arises sporadically from time to time over our 10 year monitoring of this source. The bottom-right panel shows the spectrum of IRAS 084520011, which clearly shows the triple-peaked profile of a Keplerian disk maser. This galaxy has a larger recession velocity than the majority of triple-peaked H2O masers discovered so far (see Table 1 in Kuo et al. 2018).
| R.A. | Decl. | RA | DEC | Vsys | Distance | Spectral | Hubble | |
| Name | (J2000) | (J2000) | (mas) | (mas) | (km s-1) | (Mpc) | Type | Type |
| NGC 5728 | 14:42:23.8723773a | 17:15:11.015642a | 0.06 | 0.05 | 2812 | 41.52.9 | Sy 1.9 | Sb |
| Mrk 1 | 01:16:07.2093243b | 33:05:21.633601b | 0.12 | 0.22 | 4781 | 61.52.3 | Sy 2 | S? |
| IRAS 084520011 | 08:47:47.6931960c | 00:22:51.281955c | 0.01 | 0.01 | 15262 | 213.314.9 | Sy 2 | Sa |
| Notes. Col(1): Galaxy name; Col(2) & Col(3) : The absolute positions of the maser emissions determined from our phase-referencing VLBI observations; Col(4) & Col(5) : The position uncertainties of the phase calibrators used to measure the absolute positions of the maser emissions; Col(6) : The LSR velocity of the galaxy from from NASA/IPAC Extragalactic Database (NED); Col(7): The Hubble distance with respect to the CMB frame. Note that the values shown here are adopted from the NED in its classic form, which adopts 73 km s-1 Mpc-1 for evaluating the Hubble distance; Col(8): The activity type; Col(9) : The morphological classification provided by NED. | ||||||||
| a The position of the maser spot at V 2738.0 kms-1, where Vop is the “optical” velocity of the maser spot relative to the Local Standard of Rest (LSR). | ||||||||
| b The position of the maser spot at V 4866.0 km s-1 from the phase-referencing observations BK163D (see Table 2). | ||||||||
| c The position of the maser spot at V 16043.8 km s-1. | ||||||||
| Experiment | Synthesized Beam | Sensitivity | Observing | Phase | ||||
| Code | Date | Galaxy | Antennasa | (mas x mas,deg)b | (mJy) | Modec | Calibrator | (Degrees)d |
| BB313AD | 2012 Nov 15 | NGC 5728 | VLBA, GB | 2.690.38, 12.8 | 1.7 | Phase-ref. | J14451629 | 1.1 |
| BK163D | 2010 Aug 8 | Mrk 1 | VLBA | 0.960.40,16.9 | 5.3 | Phase-ref. | J0112+3522 | 2.4 |
| BB261E | 2009 Mar 29 | Mrk 1 | VLBA, GB, EB | 1.090.38,14.5 | 1.0 | Self-cal. | — | — |
| BB348B0 | 2014 Oct 5 | IRAS 084520011 | VLBA, GB | 1.470.69, 7.5 | 3.8 | Phase-ref. | J0839+0104 | 2.5 |
| BB348B2 | 2015 Jan 20 | IRAS 084520011 | VLBA, GB | 1.200.52, 4.6 | 3.4 | Phase-ref. | J0839+0104 | 2.5 |
| a VLBA: Very Long Baseline Array; GB: The Green Bank Telescope of NRAO; EB: The Effelsberg 100-m telescope | ||||||||
| b Major and minor axis of the synthesized beam and position angle. | ||||||||
| c “Self-cal.” means that the observation was conducted in the “self-calibration” mode and “Phase-ref.” means that we used the “phase-referencing” mode of observation (see section 2.2). | ||||||||
| d The angular separation between the phase calibrator and the target source. | ||||||||
2.2 Observations
The megamaser galaxies in our sample were observed between 2009 and 2015 with the Very Long Baseline Array (VLBA)555The VLBA is a facility of the National Radio Astronomy Ob- servatory, which is operated by the Associated Universities, Inc. under a cooperative agreement with the National Science Foundation (NSF)., augmented by the GBT and in one case by the Effelsberg 100-m telescope666The Effelsberg 100-m telescope is a facility of the Max-Planck-Institut fr Radioastronomie. Table 2 lists basic information regarding the observations.
We observed the megamasers either in a phase-referencing or self-calibration mode. With phase-referencing we perform rapid switching of the telescope pointing between the target source and a nearby ( 2.5∘) phase calibrator (every 50 seconds) to correct phase variations caused by the atmosphere. The phase calibrators used in our phase-referencing observations and their angular separations from the target sources are listed in Table 2. The absolute positions of the three maser sources derived from our phase referencing observations are shown in Table 1.
In a self-calibration observation, we use the brightest maser line(s) to calibrate the atmospheric phase. This removes the need to rapidly switch sources, improving calibration and increasing on-source time. For all observations, we placed “geodetic" blocks at the beginning and end of the observations to solve for atmosphere and clock delay residuals for each antenna (Reid et al. 2009b). We also observed a nearby delay calibrator about every 50 minutes to calibrate the single-band delay caused by the electronic phase offsets among and across intermediate frequency (IF) bands. In addition, a strong continuum source was observed in each track to calibrate the bandpass shape.
We observed four IF pairs for NGC 5728 in dual circular polarization with IF bands of 16 MHz and channel spacings of 62.5 kHz. Two IF bands were used to cover the blueshifted and redshifted maser line complexes, respectively, and one IF band for the 60 mJy maser feature at 2738 km s-1. The IF band which does not cover any maser emission was used to detect the radio continuum from the nucleus of NGC 5728. For Mrk 1, we observed four IF pairs in the phase-referencing observation and two IF pairs in the self-calibration observation. Two IF bands were used to cover the blueshifted and redshifted masers, respectively. In the case of IRAS 084520011, we observed two IF pairs in dual polarization with a new (Mark 5C) recording system, which allowed us to cover the entire maser spectrum with two 128 MHz bands. Using the “zoom-band” mode of the DiFX correlator (Deller et al. 2007), we achieved spectral channels of 24 kHz for the maser data by re-correlating five 24 MHz sections in this manner.
2.3 Calibration
We calibrated the data using the NRAO Astronomical Image Processing System (AIPS). Since the geodetic dataset and the maser dataset were taken with different frequency setups, we reduced the geodetic dataset first, then transferred solutions of atmosphere and clock delay residuals to the maser dataset.
For the geodetic dataset, we first calibrated the ionospheric delays using total electron content measurements (Walker & Chatterjee 2000) and the Earth Orientation Parameters (EOPs) in the VLBA correlators with the EOP estimates from the US Naval Observatory (http://gemini.gsfc.nasa.gov/solve save/usno finals.erp). We performed fringe fitting with the AIPS task “FRING" to determine the phases, single-band delays, and fringe rates of IF bands of each antenna for every geodetic source, followed by determining the multi-band delay of each antenna from these solutions. Finally, we measured the residual tropospheric delay and clock errors for all antennas using the multi-band delays. We then applied these corrections to the maser dataset.
For the maser data, after the initial data flagging, we corrected for ionospheric delay and the EOPs in the same way as for the geodetic dataset. We then corrected the sampler bias in the 2-bit correlator. The amplitude calibration was done with the information in the gain table and the system temperature table. We corrected the interferometer delays and phases caused by the effects of diurnal feed rotation (parallactic angle), and applied the tropospheric delay and clock corrections obtained from the geodetic data afterwards. The next step was to perform fringe fitting on one scan of the delay calibrators to calibrate the electronic phase offsets among and across IF bands (i.e. the single-band delay calibration). When no good single-band delay solutions can not be obtained for all IF bands of an antenna using a particular scan, we perform fringe-fitting again on another scan to obtain proper solutions for this antenna. The frequency axes of the maser interferometer spectra were then shifted to compensate for the changes in source Doppler shifts over the observing tracks.
The final step in calibration was to solve for the atmospheric phase variation by using either phase-referencing or self-calibration. In phase-referencing mode, we ran the AIPS task CALIB on the phase calibrator to determine the phase correction as a function of time for each individual IF band. In self-calibration mode, which was adopted only for Mrk 1, we averaged multiple redshifted maser lines in the narrow velocity range of 48624871 km s-1 to perform phase calibration. The solution interval adopted in the self-calibration was 100 seconds. After the above calibrations, we discarded the phase solutions and the maser data in the time intervals within which the solutions appeared to be randomly scattered in time. The phase solutions were then interpolated and applied to all the maser data. Note that we use CALIB instead of FRING to derive the phase solutions is simply because the multiband delays in the maser dataset have been removed after we applied the tropospheric delay and clock corrections obtained from the geodetic data, and the solution interval we adopted in running CALIB is short enough to fully catch the residual atmospheric phase variation without the need of the rate information. As a result, the global fringe-fitting is not necessary for the maser dataset, and we simply derive the phase solutions with CALIB.
For IRAS 084520011, the calibrated visibility data from the two phase-referencing tracks were combined in u-v space with the AIPS task DBCON before making images for this source. Note that although the two observing tracks were conducted 3 months apart, we find no evidence that time variability of maser emission introduces noticeable errors in imaging with the combined data. Our preliminary imaging before data combination suggests that maser positions measured from the two observing tracks are consistent with each other. Given the position consistency, we further combine the visibility data for imaging to increase the sensitivity of the maser detection and enhance the accuracy of the maser position measurement.
For Mrk 1, the only target with both phase-referencing and self-calibration tracks, we only use the self-calibration track to generate the maser image presented in Section 3. Here, the role of the phase-referencing observation for Mrk 1 is to obtain the absolute position of the target source, which was then used as the phase-reference center when we calibrated the self-calibration track. The sensitivity of the phase-referencing track of Mrk 1 is four times lower than the self-calibration track, and we made 5 detections of maser lines in two narrow velocity ranges of 48634867 km s-1 and 49144916 km s-1 in the phase-referencing observation. The strongest maser line was detected at 10 at 4866 km s-1 and we adopt the position of this line as the phase-reference center for Mrk 1.
After the calibration procedure described above, we Fourier transformed the gridded (u,v) data to make images of the masers in all spectral channels of the IF bands that showed maser lines, and we deconvolved the images using CLEAN with the natural weighting scheme. We fitted the detected maser spots with elliptical Gaussians to obtain the positions and flux densities of individual maser components. The measured velocity, position, and peak intensity of each individual maser spot detected in NGC 5728, Mrk 1, and IRAS 084520011 are shown in Appendix B (Tables 7, 8, and 9 for NGC 5728, Mrk 1, and IRAS 084520011, respectively).
3 Results
3.1 VLBI Images and PositionVelocity Diagrams
Figures 2, 3, and 4 show the VLBI images and the position-velocity (PV) diagrams of the H2O masers in NGC 5728, Mrk 1, and IRAS 084520011, respectively. The VLBI maps and PV diagrams are color-coded to indicate redshifted (red color), blueshifted (blue color), and systemic masers (green color). We impose a 5 flux density cuffoff with respect to the flux uncertainty of each individual channel for maser spots in NGC 5728, Mrk 1, and IRAS 084520011, respectively. For NGC 5728 and Mrk 1, the position uncertainties of the maser spots are either comparable to or smaller than the symbol size.
Due to the lack of systemic maser components in the double-peaked maser systems, the maser maps of NGC 5728 and Mrk 1 are dominated by the redshifted and blueshifted masers. The absence of the systemic masers makes it difficult to locate precisely the dynamical centers (presumably the positions of the BHs) of these two maser systems. For the purpose of understanding the nature and dynamical properties of these two maser systems, we first tentatively assume that the dynamical centers are located at the average position of all maser spots and for each individual maser spot we calculate the “impact parameter", which is defined as projected radial offset of the maser spot along the assumed disk planes relative to the dynamical centers in the VLBI maps. After gaining deeper insights into the nature of these maser systems, we develop methods to determine the dynamical centers more precisely by only using the high velocity masers. We present these methods in Sections 3.3 and 3.4 for NGC 5728 and Mrk 1, respectively.
In the case of the triple-peaked source IRAS 084520011, we locate the dynamical center by performing a three dimensional disk modeling (e.g. Reid et al. 2013; Gao et al. 2016) of the maser system. The PV diagram is then plotted relative to the dynamical center found in the best-fit disk model.
| Galaxy | Center | I1σ | Project Code | |
| (GHz) | (MHz) | (mJy beam-1) | ||
| NGC 5728 | 21.986565 | 12.5 | 0.19 | BB313AD |
| Mrk 1 | 21.902685 | 5.0 | 0.13 | BB261E |
| IRAS 084520011 | 21.193950 | 22.5 | 0.14 | BB348B0, BB348B2 |
| Note. Col(1): Name of the galaxy; Col(2): The central frequency of spectral range covered by line-free channels used to search for continuum emission; Col(3): The total spectral width of the selected maser line-free channels; Col(4): The detection limit of the continuum emission; Col(5): The data used for continuum detection. | ||||
3.2 Search For Continuum Emission
We searched for continuum emission from the vicinities of the supermassive BHs in our megamaser galaxies by averaging the line-free spectral channels in our data and imaging with natural weighting to maximize the detection sensitivity. We detected no continuum emission in all megamaser galaxies presented in this paper. The central frequencies and the total spectral widths of the selected maser line-free channels used for channel averaging as well as the continuum upper limits are listed in Table 3.
3.3 The Nature of the Maser System in NGC 5728
3.3.1 Are the masers in a wind ?
NGC 5728 is an active galaxy that hosts a Seyfert 2 nucleus. It is known for its spectacular biconical ionization cone seen in the optical emission line images (Wilson et al. 1993), which has an extent of 1.8 kpc. Such an ionization cone (Durr & Mould 2018, 2019) is thought to be caused by AGN winds driven by radiation pressure or winds from the accretion disk, with the axis of the bi-conical cone structure co-aligned with the rotation axis of the accretion disk. The evidence for the ionization cone tracing a bipolar outflow can be seen in the kinematics of the gas in the bicone (Durr & Mould 2019), which show clear signatures of acceleration in the velocity maps and position-velocity diagrams.
Wilson et al. (1993) reported that the apex of the ionization cone, which reflects the location of the obscured active nucleus, is at the same location as the radio nucleus777The coordinate of the nucleus position reported in Schommer et al. (1988) is (J2000) 14:42:23.8840.015, (J2000) 17:15:10.810.20 measured by Schommer et al. (1988). This position agrees with that of the masers (see Table 1) measured by our VLBI observation, consistent with the picture that the H2O maser disk is at the center of the AGN and is surrounded by an obscuring torus (Masini et al. 2016).
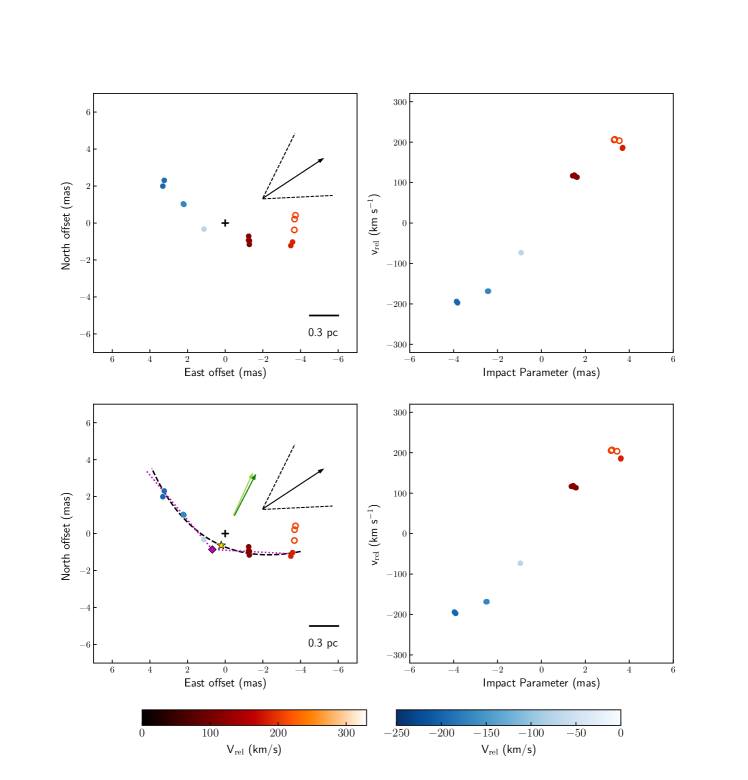
The top-left panel of Figure 2 shows the H2O maser distribution in NGC 5728. The black arrow in the plot represents the projected axis of the northwestern ionization cone reported in Wilson et al. (1993) whereas the two dashed lines indicate the opening angle (60∘; Wilson et al. 1993) of the ionization cone. As one can see in this plot, except for the three maser spots shown by open red circles, the maser distribution follows a curved distribution which resembles a nearly edge-on warped maser disk. The three open circles may represent outflowing maser spots lifting off from the disk. If our disk interpretation is correct, the inner and outer radii of the disk are 0.38 pc and 0.82 pc, respectively, and the position angle of the disk (P.A.)888The position angle (P.A.) increasing counterclockwise is calculated from the slope of the straight line fit to the blueshifted and redshifted components of the disk. P.A. 0∘ when the redshifted side of the disk is oriented northwards. is 244 degrees. The size of the disk would be consistent with the typical size of maser disks shown in Gao et al. (2017).
While the maser distribution in NGC 5728 is consistent with masers being in a disk, the “rotation curve" is not similar to that of other maser disks (e.g. Greenhill et al. 1997, 2003, Reid et al. 2009a; Kuo et al. 2011; Gao et al. 2017, Zhao et al. 2018). In the top-right panel of Figure 2, we show the maser velocity as a function of the impact parameter, which is defined as projected (cylindrical) distance of a maser spot relative to the rotation axis. Here, the rotation axis is defined as the axis perpendicular to the assumed disk plane indicated by the line best-fit to the positions of the blueshifted and redshifted masers without including the maser spots represented by the open circles. From this plot, it can be seen that instead of falling with increasing magnitude of the impact parameter as seen for Keplerian rotation, the velocities of the blueshifted and redshifted masers increase with their projected radii. If the gravity of the central supermassive BH dominates the dynamics of the maser spots and the maser spots reside in a thin disk, then the rising rotation curve could be explained by line-of-sight projections of maser spots confined to a narrow annulus, just like the systemic masers in NGC 4258 (Herrnstein et al. 1999). However, long velocity-coherent path lengths, necessary for strong maser amplification are not favored for such a configuration.
We note that a thin annulus in a Keplerian system is not the only way to produce a rotation curve that rises linearly with radius. An alternative model that can give rise to the solid-body like rotation seen in NGC 5728 is that the masers could originate in a wide-angle magnetocentrifual wind (e.g. Blandford & Payne 1982; Proga 2000; Ouyed & Pudritz 1997; Ustyugova et al. 1999; Krasnopolsky, Li, & Blandford 1999) which is launched from a disk. In the example of the young stellar object (YSO) Orion Source-I (e.g. Matthews et al. 2010; Goddi et al. 2011; Greenhill et al. 2013), which shows evidence for the presence of a magnetocentrifugal disk wind, the outflowing gas traced by Si18O line emission also shows a linearly rising velocity as a function of impact parameter (see Figure 2 in Hirota et al. 2017). This suggests that the wind is corotating with the gas ring in the circumstellar disk (Hirota et al. 2014).
Wind rotation is expected in a magnetocentrifugal disk wind (e.g. Proga 2000; Ouyed & Pudritz 1997; Ustyugova et al. 1999; Krasnopolsky, Li, & Blandford 1999) because the magnetic field lines threading the outflowing gas are anchored to a rotating disk. This leads to a well-known feature of this type of wind the conservation of the specific angular velocity of the gas (Proga 2000). That is, if a maser clump is outflowing from a foot point in the mid-plane of a Keplerian disk at radius is and Keplerian velocity is , the rotational velocity will be (/) when it reaches a radius of (Kashi et al. 2013). In such a situation, a linearly rising rotation curve can arise when the outflowing gas follows roughly the same magnetic streamlines. Alternatively, such a rotation curve can also appear if the outflow is launched from a thin annulus in a Keplerian disk as in the case of the Si18O outflow in Orion Source I (Hirota et al. 2017).
In addition to providing an explanation for a rising rotation curve, a magnetocentrifugal wind can explain other data. The maser distribution on the sky displays a curved shape with both ends pointing toward the same direction. This is inconsistent with a symmetrical warping as is common in disk masers. The NGC 5728 configuration is reminiscent of the masers in Circinus (Greenhill et al. 2003), where only one side of the outflow is observed and the other side is thought to be blocked by the warped disk. Moreover, the masers in NGC 5728 roughly form a cone as in Circinus (see the bottom-left panel of Figure 2), with the symmetric axis of the cone (see the green arrow) aligning with the axis of the northwestern ionization cone within 30∘. It is likely that the wide-angle (opening angle 130∘) wind traced by maser emission at 1 pc scale resides at the base of the kpc-scale ionization cone (opening angle 60∘), with the wind flowing in a similar direction as the gas in the ionization cone (see the green arrow in the plot).
We note that such a magnetically driven wind with a wide opening angle of 130 ∘ is theoretically possible in the context of the disk wind models proposed by Blandford & Payne (1982) and Königl & Kartje (1994). The half-opening angle of the streamlines along which the masers follow (i.e. 65∘) satisfies the necessary condition ( 30∘)999 indicates the angle between the poloidal component of the magnetic field along which gas flows and the polar axis of the wind. for magnetocentrifugal wind generation as found by Blandford & Payne (1982). The A2 model studied in Knigl & Kartje (1994) allows a centrifugally driven hydromagnetic wind to have a full opening angle of 124∘ if the AGN bolometric luminosity is 1045 erg s-1. For NGC 5728, inferred from [OIII] luminosity is (6.0)1044 erg s-1, suggesting that this maser galaxy would have sufficiently high AGN luminosity to engender a wide-angle wind. As indicated by Blandford & Payne (1982), a magnetically driven wind will get collimated by the toroidal component of the magnetic field as the wind reaches larger distances from the disk. As a result, one could speculate that the opening angle of the maser wind in NGC 5728 may reduce substantially at larger scales and the wind may gradually merge with the gas in the kpc-scale ionization cone.
3.3.2 Estimating the black hole mass
To estimate the BH mass () of this maser system that has non-Keplerian kinematics, we note that the rotational velocities of the masers will be (/) if the masers follow a magnetocentrifugal wind and corotate with the disk as we suggested for NGC 5728. Before using the rotational velocities of the masers to evaluate the BH mass, a more precise determination of the dynamical center is important for minimizing the systematic uncertainty of the BH mass estimate. To do so, we note that in Circinus, the masers in the wind, although asymmetric, roughly form a cone with the apex consistent with the dynamical center. In addition, for the well-known YSO Orion Source I, the boundaries of the rotating winds represented by the SiO (Matthews et al. 2010) and Si18O emissions (Hirota et al. 2017) also form a smooth, roughly axisymmetric curve with the apex coinciding with the dynamical center. This suggests that fitting a cone or a smooth/axisymmetric curve (e.g. a quadratic function) to the high velocity masers in NGC 5728 could allow one to better locate the dynamical center in this maser system.
In the bottem-left panel of Figure 2, we show the quadratic function (the thick dashed line) and cone (the dotted line) that are best fit to the maser spots represented by the solid symbols. The apices of the curve and cone are shown by the yellow star and magenta diamond, respectively. Adopting the position of the yellow star as the dynamical center, we measure the impact parameters relative to the new center along a plane perpendicular to the symmetric axis of the best-fit curve. The new PV diagram is plotted in the bottom-right panel of Figure 2. Note that the PV diagram would only have a small change (i.e. the impact parameter increases by 0.34 mas for both blue and red dots) if we adopt the apex of the cone as the dynamical center.
Measuring the BH mass for the wind maser system in NGC 5728 requires knowledge of and , which represent the radius and orbital velocity of the launching point of an outflowing maser clump in the disk. We note that the innermost blueshifted maser spot is likely to lie close to the disk plane, and its enclosed mass ( 2.4105 ) could be used to estimate . However, we also note that the impact parameter ( 1.0 mas) of this tentative systemic maser feature is smaller than the dust sublimation radius ( 1.6 mas or 0.3 pc)101010The sublimation radius is estimated with Equation (1) in Netzer (2015) for silicate grains and the bolometric AGN luminosity of NGC 5728 shown in Table 5. . Given the expectation that H2O masers cannot occur within , this suggests that this maser spot may not reside close to the mid-line of the disk, and we thus avoid using this maser spot to estimate . For other maser spots in the system, the values of and cannot be inferred precisely based on the maser map and the PV diagram since the streamlines along which the outflowing masers follow cannot be well-constrained.
Nevertheless, one can still place a conservative upper bound for the BH mass by using the outermost (blueshifted) maser spot. Since the gas is flowing out in a wind that conserves angular velocity, one can expect that and , where and represent the radius and the rotational velocity of the outflowing maser spot at the observed position. This suggests that /G /G. If the orbital plane of the gas is not exactly edge-on, the above equation needs to be revised as /G (sin )-2(/G), where and represent the inclination angle of the rotating plane and the orbital velocity seen along the line of sight, respectively. Adopting the dynamical center marked by the yellow star and assuming that rotating plane of the masing gas is within 20∘ from being edge-on (i.e. 70∘ 110∘)111111All pristine Keplerian maser disks have inclination angles 80∘ 100∘ (e.g. Herrnstein et al. 1999; Kuo et al. 2011; Gao et al. 2017; Zhao et al. 2018), and this is consistent with the picture that a maser disk prefers to be nearly edge-on (i.e. 90∘) because such an orientation provides the longest path lengths for maser amplification. Given this fact, it would be reasonable to assume that the angular offset () of the orbital plane from the edge-on orientation is within 10∘ for NGC 5728 as well. Nevertheless, for the purpose of placing a more conservative upper limit for the BH mass in NGC 5728, we choose 20∘ as the upper bound for the inclination offset. This limit is five times greater than the mean angular offset ( 4.0∘) of the 12 well-modeled maser disks studied in the above-mentioned references., one can place an upper limit of the BH mass to be 8.2106 . If we adopt the apex of the cone as the dynamical center, the upper bound of the BH mass becomes 7.5106 . Here, we adopt the greater of these two values as the upper limit of the BH mass and conclude that 8.2106 for NGC 5728.
3.4 The Nature of the Maser System in Mrk 1 : Outflow or Perturbed Disk ?
Mrk 1 is a Seyfert 2 galaxy at a distance of 62 Mpc. Analysis of an X-ray spectrum from XMM-Newton observations (Guainazzi, Matt, & Perola 2005) suggests that Mrk 1 hosts a Compton-thick nucleus where the majority of disk maser systems tend to reside (Greenhill et al. 2008; Zhang et al. 2010; Masini et al. 2016). However, our VLBI observation shows that the maser distribution in Mrk 1 is clearly inconsistent with masers residing in a thin disk viewed nearly edge-on.
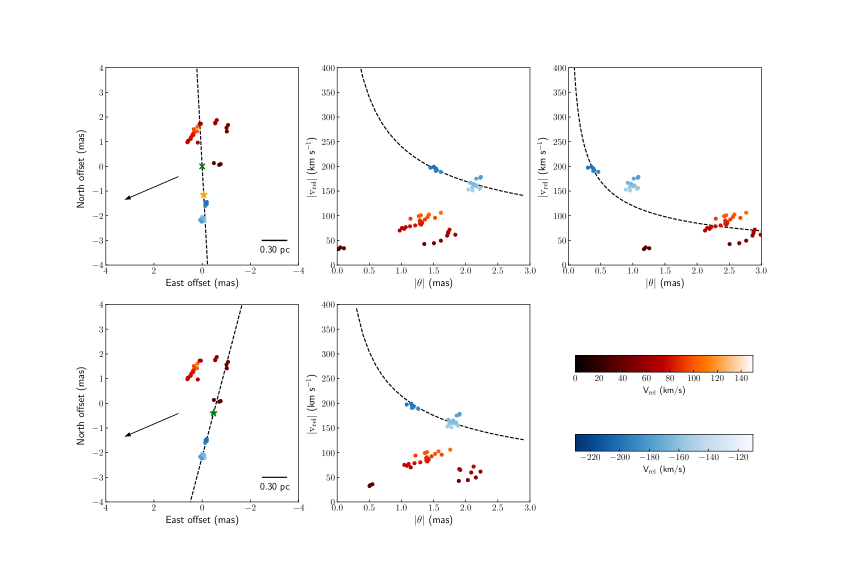
As one can see in the top-left panel of Figure 3, while the blueshifted masers cluster at two spatially displaced clumps, the majority of the redshifted maser spots appear to be distributed along a curve reminiscent of a bow shock. This could give a hint that the masers may be part of a bipolar molecular outflow propagating along the north-south direction, with the redshifted masers tracing the front of the bow shock that occurs when the outflow is impinging onto the ambient gas. However, we find that this interpretation is inconsistent with the finding of Kamali et al. (2019), who discovered a radio jet propagating in a direction with P.A. of (indicated by the black arrow in the left panel of Figure 3) over a length of 30 pc. The jet orientation is apparently far from being co-aligned with the direction of the suggested gas outflow121212The relative position between the masers and the jet can be seen in Figure 1 in Kamali et al. (2019). This argues against the interpretation of an outflow propagating in the north-south direction.
Moreover, based on the line-of-sight velocities of the redshifted masers, the speed of the putative outflow is expected to be 70 km s-1. Assuming a sound speed of 2.3 km s-1, corresponding to a temperature of 800 K (Herrnstein et al. 2005), the Mach number of the masing medium would be greater than 30. This suggests that the bow shock front would have a U shape (Furuya et al. 2000), inconsistent with the relatively blunt parabolic structure shown by the redshifted masers. Therefore, one can also rule out the scenario that the redshifted masers trace a bow shock front caused by an impinging outflow.
Instead of interpreting the masers as being part of an outflow, one could interpret the maser distribution as a perturbed disk. In the top-left panel of Figure 3, we draw a dashed line which goes through the (unweighted) average positions of the redshifted and blueshifted masers, respectively. If we define this line at P.A. = 3∘ as the plane of a thick disk (the eight redshifted maser spots with negative eastern offsets could be outflowing gas components lifting from the disk), then we will have a rotation axis of the disk which is offset from the jet propagation direction by only , well within the offset distributions reported by Greene et al. (2013) and Kamali et al. (2019). Adopting this interpretation, we assume that the dynamical center of the disk is located at the unweighted average position of all maser spots (green cross in the top-left panel of Figure 3). The corresponding PV diagram is shown in the top-center panel of Figure 3. Here, we adopt the recession velocity ( 4781 km s-1) of Mrk 1 from NED (see Table 1) and fold the velocities as well as the impact parameters of the maser spots by plotting their magnitudes. We do so in order to better reveal the differences of the velocity distributions between the redshifted and blueshifted masers.
The PV diagram shows that the velocities of the blueshifted maser spots are consistent with Keplerian rotation (the dashed line in the diagram) for a central BH mass of 4106 . On the other hand, the PV diagram also reveals that the kinematics of the redshifted masers are far more complicated than those of the blueshifted masers and inconsistent with Keplerian rotation. Except for the three maser spots near the dynamical center, the velocity distribution of these maser spots can be separated into two groups, each with speeds increasing with impact parameter. In addition, the speeds of the redshifted maser spots are systematically lower than those of the blueshifted masers. We find no simple model that can explain this kind of kinematic distribution.
Nevertheless, we note that the peculiar velocity offsets between the blueshifted and the redshifted masers can be reduced significantly if one shifts the dynamical center toward the blueshifted masers. We try a range of shifts between 0 and 1.4 mas along the assumed disk plane, and find it unlikely to locate a dynamical center that allows both blueshifted and redshifted masers to be consistent with a Keplerian rotation curve. One can at best find an offset (e.g. 1.15 mas; see the yellow star in the top-left panel) that allows a Keplerian rotation curve131313This rotation curve is calculated with with a BH mass of 1.0106 to fit the redshifted masers and one of the two blueshifted maser clumps (see the top-right panel). This suggests that the redshifted masers may not really reside in a perturbed disk as we suggested, and a different scenario needs to be considered.
Since the morphology/kinematics of the redshifted masers are highly disturbed while the structure/kinematics of the blueshifted masers are well-ordered, it is plausible to speculate that the blueshifted masers are in a disk and the majority of the redshifted masers (e.g. the redshifted masers residing on the left of the dashed line) are in a wind. Given this interpretation for Mrk 1, we re-define the disk plane as the line passing through the unweighted average positions of the two blueshifted maser clumps (the dashed line in the bottom-left panel). Since this plane goes through some redshifted maser spots, it is likely that these masers also lie close the disk plane. If true, their velocities, which are substantially closer the systemic velocity of the galaxy than the blueshifted masers, would suggest that either their positions are offset from the mid-line of the disk, or these masers reside on the equatorial plane of a larger scale torus (i.e. they lie further away from the BH) that surrounds the maser disk (e.g. Sawada-Satoh et al. 2000; Kondratko et al. 2005).
To estimate the BH mass of this maser system, we fit a Keplerian rotation curve to the blueshifted masers and allow the position of the dynamical center to be a free fitting parameter. When fitting the rotation curve, we add an error floor of 4.2 km s-1 to the velocity data to account for the intrinsic velocity scatter and allow the reduced of the fit to be 1.0. The best-fit dynamical center, which has an uncertainty of 0.2 mas along the assumed disk plane, is marked by the green star in the bottom-left panel of Figure 3. Our fit gives a BH mass of (3.20.5)106 for the Mrk 1 maser system. Here, the BH mass error reflects the formal uncertainty of the least fitting. This error would only change slightly from 0.5106 to 0.51106 if we also consider the effect of disk inclination angle () in the BH mass estimation and assume that 70∘ 110∘ (see Section 3.3.2).
Note that in the rotation curve fitting described above, we assume that the effect of non-gravitational motion is negligible and the maser velocities are assumed to be entirely gravitationally driven. This assumption will be justified in Section 4 and Appendix A, which provide quantitative estimates of the systematic uncertainty of the BH mass caused by ignoring the effect of wind disturbances for the double-peaked maser systems discussed in this paper.

3.5 BH Mass Measurement with IRAS 084520011
IRAS 084520011 is a Seyfert 2 galaxy at a distance of 21315 Mpc (the classic NED; see Table 1). It is one of the three farthest disk maser candidates141414The other two disk maser candidates with 200 Mpc are Mrk 34 and 2MASX J010945100332329 (or J01090332 in the MCP maser catalog) have LSR recession velocities of 1514590 km s-1 and 1636330 km s-1, respectively (the values are adopted from NED). which lie beyond 200 Mpc. Before our present work, the most distant disk maser that has been imaged with VLBI is NGC 6264 (Kuo et al. 2011). The modeling of the maser disk in that galaxy gives a distance of 14419 Mpc (Kuo et al. 2013).
In the left panel of Figure 4, we show the spatial distribution of the maser spots in IRAS 084520011, which is consistent with the general expectation for a maser disk (e.g. Kuo et al. 2011; Gao et al. 2017). Rather than being intrinsically thick, the apparent thickness of the disk is caused by the relatively large position uncertainties of the maser spots, which appear to be significant in IRAS 084520011 simply because the maser disk at the distance of 213 Mpc only has a radius of 0.5 mas and is smaller in angular size than other nearby maser disks that have been imaged (e.g. Kuo et al. 2011; Gao et al. 2017; Zhao et al. 2018). The position uncertainties shown in Figure 4 are actually comparable with the position errors of the masers in NGC 5728, which are negligible compared to the size of the maser disk shown in Figure 2.
To obtain the BH mass and disk properties of this system, we adopt a Bayesian approach to model the maser disk in three dimensions (see Reid et al. 2013; Humphreys et al. 2013 ; Gao et al. 2016) with a fitting code described in Reid et al. (2013). In this approach, the disk modeling code adjusts model parameters and minimizes the residuals of the position (), velocity, and acceleration for each maser spot. Global model parameters involved in the modeling include the Hubble constant (), black hole mass (), recession velocity of the galaxy (), and other parameters that describe the orientation and warping of the disk. We summarize these parameters and the priors adopted in the disk modeling in Table 4.
| Parameter | Priors | Posterioris | Units |
|---|---|---|---|
| 73 | — | km s-1 Mpc-1 | |
| — | 15282.14.1 | km s-1 | |
| 311 | — | km s-1 | |
| — | 3.30.2 | 107 | |
| x0 | — | 0.3410.008 | mas |
| y0 | — | 0.1150.019 | mas |
| — | 85.20.3 | deg | |
| 0.0 | — | deg mas-1 | |
| — | 207.32.6 | deg | |
| 0.0 | — | deg mas-1 | |
| 0.0 | — | deg mas-2 | |
| Note. Parameters are as follows: Hubble constant (), optically defined of the central black hole (), peculiar velocity with respect to Hubble flow in cosmic microwave background frame (), black hole mass (), eastward (x0) and northward (y0) position of the black hole with respect to the phase-reference center (Table 1), disk inclination () and inclination warping (change of inclination with radius: ), disk position angle () and position angle warping (change of position position angle with radius: and ). Flat priors were used, except where listed. Parameter values given in this table were produced from binned histograms for each parameter and finding the center of the central 68% of the probability distribution. We assign the difference between the center and edge of the central 68% distribution to be the parameter uncertainty. | |||
When modeling the disk, we assume that the high-velocity maser components reside at the mid-line of the disk and have zero centripetal accelerations along the line of sight. In addition, we adopt a Hubble constant of 73 km s-1 so that the corresponding galaxy distance is consistent with the value shown in Table 1. Furthermore, we adopt a flat disk model and added conservative estimates of systematic uncertainty (“error floors") to the data. For the and data, we adopt an error floor of 0.015 and 0.030 mas, respectively. For maser velocity, we adopt an error floor of 1.8 km s-1, which is a typical linewidth of a single maser line. These error floors were estimated in a way to make the fitting stable151515For IRAS 084520011, the fitting becomes unstable when the adopted error floor for x or y is smaller than 0.015 mas. and allow the reduced of the fit to be close to one when these values were added in quadrature with the formal uncertainties in the modeling. Finally, we add 311 km s-1 to the observed velocities of all maser spots to reference the maser velocities from the LSR frame to the CMB frame.
Our best fit shows that the position angle P.A. and the inclination of the maser disk are P.A. 207.32.6∘ and 85.20.3∘, respectively. The reduced achieved in our disk modeling is 1.100. Our fit gives a BH mass of (3.30.2)107 for IRAS 084520011, and the dynamical center position obtained from the fit ( 0.3410.008 mas; 0.1150.019 mas) is shown by the yellow star in the left panel of Figure 4. In the right panel of Figure 4, we plot the the PV diagram for IRAS 084520011, where the dashed line indicates the Keplerian rotation curve calculated based on the best-fit BH mass. We summarize the best-fit parameters in Table 4.
Our analysis shown here demonstrates that one is able to apply the H2O megamaser technique to galaxies beyond 200 Mpc for BH mass measurement with an accuracy of better than %, well sufficient for constraining the relation. Based on our current analysis of IRAS 084520011, which has high-velocity maser flux densities of mJy (see Figure 1), we infer that BH measurements are feasible up to distances of 400 Mpc (z 0.1) with 40 hours observing using the VLBA, augmented with the GBT. At such a distance, if the BH mass in a disk maser system is 107 , the angular size of the maser disk161616Based on the disk properties of triple-peaked maser systems reported in Kuo et al. (2011) and Gao et al. (2017), it can be easily shown that all Keplerian disk maser systems have a characteristic size of 105 , where refers to the Schwarzchild radius of the BH. This suggests that the intrinsic sizes of maser disks would be similar as long as the BHs have roughly the same masses. For such disks, if the distance increases by a factor of 2, the angular extent of the disk would shrink by a factor of 2. would shrink by a factor of 2 relative to IRAS 084520011, but the maser disk can still be well-resolved if the flux densities of maser lines also increase by a similar factor.
Beyond 400 Mpc (z 0.1), the applicability of the megamaser technique for BH mass measurements would be substantially hampered by sensitivity. With simple estimation, one can show that such measurement would require the total maser luminosity of a disk maser system to be greater than 10000 . However, the number of galaxies with such extreme maser luminosities is negligible in the local Universe (see Table 1 in Kuo et al. 2018).
Regarding the Hubble constant determination, our result for IRAS 084520011 suggests that applying the maser technique to galaxies with distances beyond 200 Mpc would be difficult in the near future if one aims to determine an to better than 10% accuracy with a single maser galaxy. Our crude estimate based on our modeling of the maser disk in NGC 6323 (Kuo et al. 2015) shows that one would need at least a few hundred hours of observing time to achieve sufficient maser position accuracy to allow a 10% measurement with IRAS 084520011. Nevertheless, the inclusion of the next generation Very Large Array (ngVLA; McKinnon et al. 2016) in future VLBI observations is promising to bring about an order of magnitude improvement in sensitivity which will enable a 1% measurement by efficiently measuring 10% (7%) distances to 100 (50) maser galaxies with the H2O megamaser technique (Braatz et al. 2019). With the substantially enhanced sensitivity provided by the ngVLA, it would become possible to make a 10% measurement efficiently for galaxies beyond 200 Mpc, including IRAS 084520011. In addition, it will also facilitate the extension of the application of the megamaser technique to galaxies beyond 400 Mpc for BH mass measurements because the necessity of extremely high maser luminosity (i.e. 10000 ) will be significantly relaxed.
4 Discussion
4.1 The Association between Perturbed Disk and AGN Winds
In the previous sections, we see that the masers in the double-peaked H2O megamaser systems NGC 5728 and Mrk 1 have substantially different maser distributions and kinematics in comparison with those of thin, edge-on Keplerian maser disks such as NGC 4258. While the spatial sizes of these two double-peaked maser systems are similar to the typical sizes of triple-peaked maser disks (Gao et al. 2017), their spatial distributions do not directly reveal that the H2O masers reside in thin, unperturbed, gas disks. In addition, their kinematics are unusual and do not trace Keplerian rotation curves that would allow reliable fitting of BH masses.
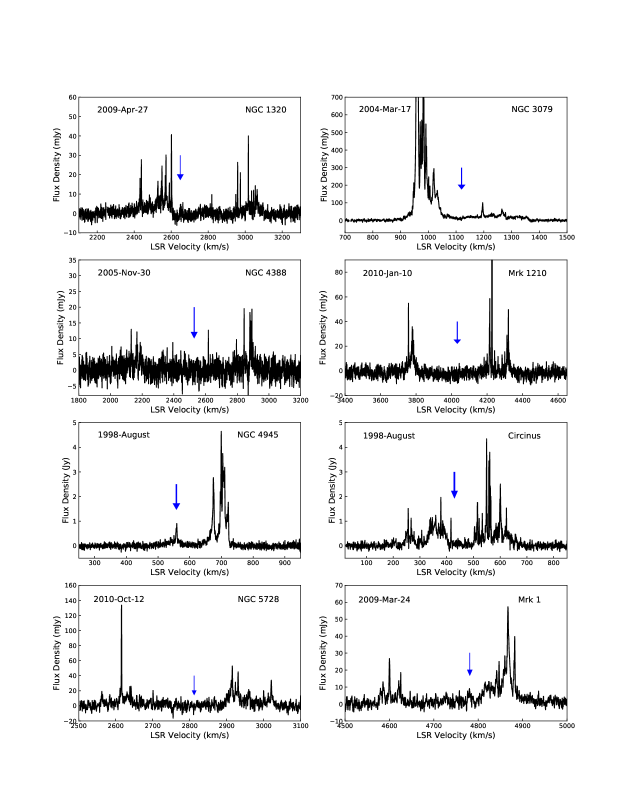
These differences argue against the double-peaked megamasers in NGC 5728 and Mrk 1 being simply triple-peaked disk masers in which the systemic maser lines are significantly weaker than the high-velocity masers. To investigate whether this is a general property of double-peaked H2O megamasers, we collect from the literature all megamaser systems whose spectra are dominated by two distinct line complexes and have the VLBI maser maps and kinematic measurements that allow for estimates of the enclosed mass. The references from which we obtain the maser maps and BH/enclosed mass estimates are shown in Table 5. The spectra of these double-peaked megamasers are shown in Figure 5.
From Figure 5, it can be seen that all of the double-peaked megamasers except for NGC 4945 have two maser line complexes that are redshifted and blueshifted with respect to the recession velocities () of the galaxies. For all of these systems, there are occasionally weak or narrow (i.e. linewidth 5 km s-1) maser lines arising in between the two maser complexes in some epochs and these lines often lie within 100 km s-1 from of these sources. While these maser features could be the systemic maser lines as found in triple-peaked maser systems, they are also likely to be maser lines arising at the outskirts of the redshifted/blueshifted complexes. Based on their locations in the single-dish spectra alone, these tentative systemic maser lines cannot be easily and clearly distinguished from high velocity maser features. For NGC 4945, the blueshifted maser complex is missing and there is a line complex whose peak velocity well agrees with of the galaxy. Thus, this is likely to be the systemic maser complex as seen in the spectra of the triple-peaked systems.
From the VLBI maps of the double-peaked systems, we note that their maser distributions and kinematics are similar to those of NGC 5728 and Mrk 1, with some, or all, of the maser features tracing a roughly linear distribution on the sky that suggests a disk. However, the degree of scatter seen in the maser distributions often allows for alternative interpretations, such as the presence of outflows. Moreover, no PV diagram can be described by a “clean”, smoothly varying rotation curve. Even if the maser velocity falls as a function of radius, the intrinsic scatter of maser (e.g. Mrk 1210; see Zhao et al. 2018) seen in the rotation curve is often substantially greater than the measurement uncertainties (i.e. 12 km s-1).
From the above comparison, we see evidence that the H2O masers in the double-peaked systems tend to reside in dynamically perturbed gas disks. It is likely that non-gravitational forces such as AGN winds have a stronger impact on the masing gas in the double-peaked megamasers than in the triple-peaked maser systems, leading to different maser distributions and kinematics.
Indeed, when we look at the multi-wavelength imaging of the double-peaked systems, we can always see evidence for AGN winds or jets in comparison with the triple-peaked systems. For example, Circinus shows a prominent wind traced by H2O maser emission at 1 pc scale (Greenhill et al. 2003). For NGC 1320 (Mrk 607), gas kinematics at 300 pc scale show counter rotation with respect to stars in the galactic disk, suggesting that the gas is tracing an equatorial outflow (Freitas et al. 2018). NGC 4945 shows kpc-scale nuclear outflow cones suggesting the presence of a starburst-driven wind (Heckman 2003). NGC 3079 has a bipolar super-wind that inflates a kpc-scale superbubble (Duric & Seaquist 1988; Veilleux et al. 1994; Cecil et al. 2002) and show evidence for a wide-angle AGN-driven outflow on parsec-scales (Kondratko et al. 2005). Prominent jets which have physical extents ranging from a few to 30 parcsec can be seen in the double-peaked maser systems Mrk 1 and Mrk 1210 (Kamali et al. 2019). In NGC 5728, one can even see a kpc-scale collimated radio jet propagating in the direction that aligns with the ionization cone (Durr & Mould 2018) that traces a bipolar outflow. Finally, in NGC 4388, the [OIII] image shows an ionization cone at 100400 pc scale (Greene et al. 2014), and the radio emission morphology suggests a collimated AGN-driven outflow (Stoklasov et al. 2009; Stone et al. 1988; Falcke et al. 1998).
On the other hand, among the 14 triple-peaked maser systems listed in Table 5, only 4 galaxies (NGC 4258, NGC 1068, NGC 3393, and IC 2560) show clear evidence for jets : NGC 4258 and NGC 1068 show both parsec and kpc scale jets (Herrnstein et al. 1999; Gallimore et al. 2001, 2004); NGC 3393 has a kpc scale double-sided jet (Schmitt et al. 2001); for IC 2560, a jet-like continuum is found at parsec scale (Yamauchi et al. 2012). For the rest of the triple-peaked sources, evidence for an outflow or jet is not obvious. While there are no observations that could determine whether jets/outflows exist in NGC 1194, NGC 5495, NGC 5765b, and UGC 6093, Kamali et al. (2019) conducted radio jet imaging toward some of these maser systems and found that radio emission at the milliarcsecond scale is either absent (e.g. UGC 3789, NGC 6323, NGC 6264) or shows a structure that does not necessarily reflect the presence of a jet (e.g. NGC 2273, NGC 2960).
This suggests that the two types of megamasers may arise from dynamically different environments, with the double-peaked megamasers possibly residing in AGN where winds/outflows are prominent on a 1 pc scale (i.e. the typical size of maser disks) and have greater impact on the dynamics of the masing gas. It is likely that wind disturbances substantially reduce the coherence (amplification) path lengths of maser emissions, making strong maser emission harder to occur. As a result, the three maser complexes in a pristine triple-peaked maser disk may not be always present when a wind-perturbed maser source is detected. Depending on the level of the wind disturbance, one or more maser line complexes of a disk maser system could be missing. In the well-studied maser source Circinus, the missing component is the systemic maser complex whereas in the case of NGC 4945, the blueshifted maser features are not clearly present in the spectrum (see Figure 5).
| Disk | log | log | log | log | log | log | Ref.a | Ref.b | Ref.b | ||
| Name | Type | () | (erg s-1) | (erg s-1) | (erg s-1) | (erg s-1) | (erg s-1) | () | () | () | |
| NGC 1068 | III | 6.90 | 43.34 | 42.8 | 44.79 | 45.58 | 45.00 | 0.62 | 11 | 13 | 23 |
| NGC 1194 | III | 7.81 | 42.78 | 39.9c | 44.23 | 43.44 | 45.90 | 0.02 | 1 | 13 | 17 |
| NGC 2273 | III | 6.88 | 42.30 | 40.5 | 43.75 | 43.28 | 44.96 | 0.06 | 1 | 14 | 17 |
| NGC 2960 | III | 7.06 | 42.30 | 40.5 | 43.75 | 43.28 | 45.15 | 0.04 | 1 | 13 | 17 |
| NGC 3393 | III | 7.49 | 42.73 | 41.3 | 44.18 | 44.08 | 45.58 | 0.04 | 2 | 15 | 17 |
| NGC 4258 | III | 7.60 | 40.63 | 39.1 | 41.63 | 41.88 | 45.69 | 0.00009 | 3 | 15 | 23 |
| NGC 5495 | III | 7.02 | — | 39.8 | — | 42.58 | 45.11 | 0.003 | 4 | — | 4 |
| NGC 5765b | III | 7.66 | — | 41.6 | — | 44.38 | 45.76 | 0.04 | 5 | — | 16 |
| NGC 6323 | III | 6.97 | — | 40.4c | — | 43.94 | 45.06 | 0.08 | 1 | — | 17 |
| NGC 6264 | III | 7.46 | 42.60 | 41.3c | 44.05 | 44.84 | 45.55 | 0.03 | 1 | 18 | 17 |
| UGC 3789 | III | 7.01 | 42.30 | 41.3 | 43.75 | 44.08 | 45.10 | 0.04 | 1 | 18 | 17 |
| J04372456 | III | 6.46 | — | 39.0c | — | 42.54 | 44.55 | 0.01 | 4 | — | 4 |
| IC 2560 | III | 6.54 | 42.98 | 41.0 | 44.43 | 43.78 | 44.64 | 0.62 | 12 | 13 | 17 |
| UGC 6093 | III | 7.42 | — | 40.6 | — | 43.38 | 45.51 | 0.007 | 6 | — | 16 |
| NGC 1320 | II | 6.74 | 42.70 | 41.0 | 44.15 | 43.78 | 44.83 | 0.21 | 4 | 19 | 22 |
| NGC 3079 | II | 6.30 | 42.15 | 40.4 | 43.60 | 43.18 | 44.39 | 0.16 | 7 | 20 | 22 |
| NGC 4388 | II | 6.92 | 43.18 | 41.9 | 44.63 | 44.70 | 45.01 | 0.42 | 1 | 15 | 24 |
| NGC 4945 | II | 6.15 | 41.43 | — | 42.88 | — | 44.23 | 0.04 | 8 | 15 | — |
| NGC 5728 | II | 6.91 | 42.94 | 42.0 | 44.39 | 44.78 | 45.01 | 0.24 | 9 | 15 | 22 |
| Mrk 1 | II | 6.51 | 42.50 | 41.4c | 43.95 | 44.97 | 44.60 | 0.22 | 9 | 21 | 24 |
| Mrk 1210 | II | 7.15 | 43.20 | 42.4 | 44.65 | 45.18 | 45.24 | 0.25 | 6 | 15 | 22 |
| Circinus | II | 6.23 | 42.32 | 40.9 | 43.76 | 43.68 | 44.32 | 0.28 | 10 | 15 | 22 |
| Note. Col(1): Name of the maser galaxy; Col(2): The maser disk type. Type II & III refer to the double-peaked and triple-peaked megamasers, respectively; Col(3): The BH mass in units of solar mass; Col(4); The absorption-corrected intrinsic 2-10 keV X-ray luminosity; Col(5): The [OIII] luminosity (erg s-1). Except for NGC 1194, NGC 6323, NGC 6264, J04372456, and Mrk 1, the measurements include internal reddening corrections; Col(6): The bolometric luminosity of the AGN estimated from . For those galaxies with X-ray measurements except for NGC 4258, given their nature of being either highly obscured (i.e. the obscuring column density 1023.5 cm-2) or Compton-thick ( 1024 cm-2), we obtained by applying a bolometric correction factor of 28 (Brightman et al. 2017) to . For NGC 4258, which hosts a Compton-thin nucleus, we adopt a of 10 (Lusso et al. 2012) for the bolometric correction; Col(7): The bolometric luminosity of the AGN estimated from (erg s-1). The adopted bolometric correction factors are 600 (Heckman & Best 2014) and 3500 (Heckman et al. 2004) for with and without internal reddening corrections, respectively; Col(8): The Eddington Luminosity (erg s-1) calculated using the BH mass shown in column (3); Col(9): The Eddington ratio , with primarily derived from . When X-ray flux measurements are not available, we adopt estimated from [OIII] luminosity to evaluate ; Col(10): Reference for VLBI imaging and the maser-based BH mass measurement; Col(11): Reference for the measurement of ; Col(12): Reference for the measurement of . | |||||||||||
| a References for the BH mass measurement : 1. Kuo et al. (2011); 2. Kondratko et al. (2008); 3. Humphyreys et al. (2013); 4. Gao et al. (2017); 5. Gao et al. (2016); 6. Zhao et al. (2018); 7. Kondratko, Greenhill, & Moran (2005); 8. Greenhill et al. (1997); 9. this paper; 10. Greenhill et al. (2003). | |||||||||||
| b References for and : 13. Masini et al. (2016); 14. Awaki et al. (2009); 15. Ricci et al. (2017); 16. MPA-JHU emission line analysis for the SDSS data (); 17. Greene et al. (2010); 18. Castangia et al. (2013); 19. Brightman & Nadra (2011); 20. Panessa et al. (2006); 21. Singh et al. (2011); 22. Shu et al. (2007); 23. Ho et al. (1997); 24. Zhu et al. (2011) | |||||||||||
| c For these sources, flux measurements of either or are not available for calculating the Balmer decrement, no internal reddening correction is applied to observed | |||||||||||
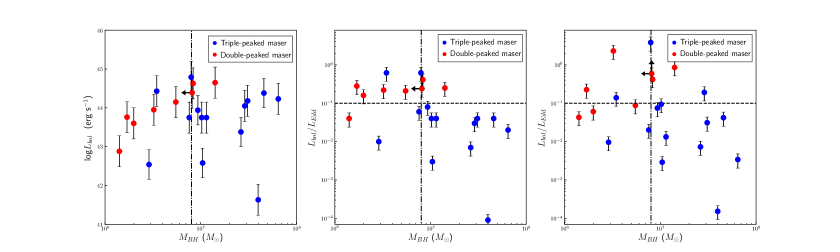
4.2 The Diagram
To evaluate the relative impacts of AGN winds on the double-peaked and triple-peaked H2O megamaser disks, it is helpful to compare the AGN bolometric luminosity () or the Eddington ratio () between these two types of maser systems. In recent studies of AGN feedback, it is found that properties of AGN winds are well-correlated with either the AGN power or accretion efficiency. Greene (2006), Woo et al. (2016) and Kang et al. (2017) show that the fraction of AGN that reveal clear signatures of ionized gas outflows (i.e. the non-gravitational components of the [OIII] linewidths) increase rapidly as and go up. In addition, Fiore et al. (2017) demonstrate that the mass outflow rate, wind kinetic power and the maximum wind velocity of both ionized and molecular gas show strong positive correlations with the AGN power. Furthermore, Cicone et al. (2014) and Combes et al. (2014) indicate that the outflow momentum of a molecular wind also increases with the AGN luminosity. Finally, from the theoretical point of view, Giustini & Proga (2019) show that in AGN with is 0.10.25, the radiation pressure becomes large enough to allow for the production of strong, persistent disk winds whereas for AGN with 0.1, only a relatively weak or “failed” disk wind could occur. Therefore, if the double-peaked megamasers are systems more disturbed by AGN winds, one might expect to see a correlation in these maser systems with or . We now investigate this possibility.
In the left panel of Figure 6, we plot as a function of for the twenty-two H2O megamaser systems listed in Table 5, with the triple-peaked and double-peaked megamasers color-coded in blue and red, respectively. The AGN bolometric luminosities of these maser systems are mainly derived using the absorption-corrected intrinsic 2-10 keV X-ray luminosities of the AGN. For those galaxies which have X-ray measurements available (except for NGC 4258), given their nature of being either highly obscured (i.e. the obscuring column density is 1023.5 cm-2) or Compton-thick ( 1024 cm-2), we obtained by applying a bolometric correction factor of 28 (Brightman et al. 2017) to . For NGC 4258, which hosts a Compton-thin nucleus, we adopt a of 10 (Lusso et al. 2012) for the bolometric correction. When reliable X-ray luminosities are not available for a particular source, we use the [OIII] luminosity () to infer . When estimating from , we adopt bolometric correction factors of 600 (Heckman & Best 2014) and 3500 (Heckman et al. 2004) for with and without internal reddening corrections, respectively.
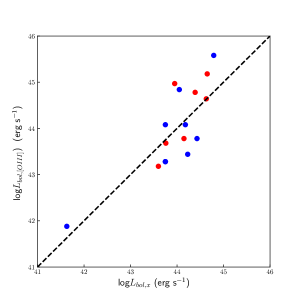
To assess the uncertainty of obtained from X-ray measurements (), we compare with the bolometric luminosities estimated from [OIII] luminosities (), which are available for all but one galaxy (NGC 4945) listed in Table 5. This comparison is shown in Figure 7. It can be seen from this figure that inferrred from and are consistent. The mean and standard deviation of are 0.05 and 0.54 dex, respectively. Assuming the uncertainty of the bolometric correction (0.38 dex; Heckman et al. 2004) dominates the error budget for , the standard deviation of suggests that the mean uncertainty of is 0.42 dex, comparable to the uncertainty of .
In the left panel of the Figure 6, one can see that there is no strong correlation between AGN luminosities and the two types of maser systems. On the other hand, the diagram reveals that triple-peaked maser disks tend to have greater BH masses than double-peaked maser systems. Relative to a reference BH mass of 8106 , which is chosen to clearly separate the distributions of the two types of megamasers, 71% (75%) of triple-peaked (double-peaked) megamasers have BH masses greater (smaller) than the reference value. The systematically lower BH masses of the double-peaked megamasers could suggest that the BH mass plays a role in determining the type of maser system. Alternatively, the lower BH masses could also result from stronger winds in these systems which perturb the maser kinematics and lead to underestimations () of the BH masses. However, we found this latter interpretation untenable. Our conservative estimates of for double-peaked systems show that the ratios between and range from 134% (see Appendix A), suggesting that the effect of AGN wind perturbation is not strong enough to account for the systematic BH mass difference between the two types of maser systems.
Although the double-peaked maser systems do not show a different distribution with respect to triple-peaked megamasers, we see evidence that these two types of maser systems have systematically different . In the middle panel of Figure 6, it can be seen that the double-peaked megamasers tend to have Eddington ratios171717The Eddington ratios discussed here are evaluated with primarily inferred from the AGN X-ray luminosities. When reliable X-ray luminosity is not available for a particular source, we evaluate based on inferred from the [OIII] luminosity. greater than the theoretical threshold above which disk winds become strong and persistent (i.e. 0.1; Giustini & Proga 2019) whereas the triple-peaked maser systems show an opposite trend. To test whether this statistical tendency is robust against the methods of estimating , we re-evaluate by inferring purely based on [OIII] luminosities, and we show the resulting diagram in the right panel of Figure 6. One can see that double-peaked megamasers on average still have higher Eddington ratios than triple-peaked disk masers when are inferred from a different tracer of , and remain 0.1 for the majority of the double-peaked systems, consistent with the result with inferred from X-ray luminosities.
If AGN winds indeed become more prominent in higher systems as suggested by Woo et al. (2016), Kang et al. (2017), and Giustini & Proga (2019), this could explain the differences. In this interpretation, the double-peaked maser systems are gas disks residing in AGN with 0.1 in which disk winds driven by radiation pressure become strong and persistent (Giustini & Proga 2019). It is in these AGN that a gas disk is more likely to get disturbed by a wind, and masers also have a greater chance to appear in an outflow. On the other hand, the Keplerian triple-peaked maser disks prefer lower Eddington ratio AGNs (i.e. 0.1), in which winds/outflows are weaker and allow the dynamics to be dominated by the central BH.
An alternative way to explain the observed trends seen in the diagram is that the triple-peaked maser disks reside in optically thick, geometrically thin disks whereas masers in the double-peaked systems tend to reside in geometrically thick slim accretion disks (Czerny 2020). Here, the slim accretion disk models describe an optically thick, geometrically not very thin accretion flow around a black hole in high Eddington ratio AGN where the radiation pressure is enhanced and drives/supports the thickness of the accretion disk.
As discussed in Koratkar & Blaes (1999), geometrically thin disk models are not consistent with accretion rates above 0.20.3, where a thick/slim disk geometry and advection/convection must be involved (e.g. Sadowski et al. 2011). This is perhaps one of the reasons why nearly all of the geometrically thin, Keplerian triple-peaked maser disks listed in Table 5 have 0.2. Indeed, when we observe the maser distributions in all of the double-peaked maser systems, in no cases the thickness of the disk can be ignored in comparison with the disk radius, supporting the view that these masers may reside in geometrically thick disks which occur in high Eddington ratio AGN. Nonetheless, we note that the high thick disk scenario alone may not be able to fully explain the maser kinematics of the double-peaked maser systems. This is because the gas motions affected by convection/advection will mainly occur in the radial and vertical direction of the disk and may not significantly affect the gas velocity along the line-of-sight for the gas residing close to the mid-line of the disk (i.e. the high-velocity masers). Thus, this scenario could not easily account for the significant deviations from Keplerian rotation seen in the PV diagrams of all double-peaked maser systems. Non-gravitational forces such as winds and outflows would be still needed to explain these deviations.
Finally, one should be aware that our main interpretation for double-peaked maser systems may not be universal and there could be exceptions. If a classic, low triple-peaked maser system such as NGC 4258 (Herrnstein et al. 1999) has a high velocity complex that is much weaker than the other two complexes (possibly due to significant disk warping), the system would appear to be double-peaked if the sensitivity is not sufficient. In this case, the absence of a maser line complex would be due to a warp and not due to an AGN wind. Therefore, one can expect that there would be exceptions in the diagram especially if there are the double-peaked maser systems that have 1 (i.e. less prominent winds). For such exceptions, single-dish spectra alone may not be sufficient to characterize the nature of these maser systems. One would need VLBI images to help determining whether these are wind-perturbed systems or triple-peaked warped maser disks which display only two maser complexes due to insufficient sensitivity.
5 Conclusions
In this work, we classify H2O megamaser galaxies into triple-peaked and double-peaked maser systems. Among the three maser galaxies we study in this paper, IRAS 084520011 belongs to the triple-peaked megamaser whereas NGC 5728 and Mrk 1 belong to the less explored double-peaked systems. Our main conclusions are summarized as follows:
-
1.
The maser distribution and kinematics in NGC 5728 may result from masing gas tracing a rotating magnetocentrifugal wind. For Mrk 1, the blueshifted masers reside in a disk while the majority of the redshifted masers may follow a wind. The BH mass in NGC 5728 is shown to be smaller than 8.2106 . The rotation curve fitting for the blueshifted masers in Mrk 1 gives a BH mass of (3.20.5)106 .
-
2.
The maser distribution and kinematics in IRAS 084520011 are consistent with a gas disk with Keplerian rotation. Modeling of the disk in three dimensions gives a BH mass of (3.30.2)107 . This measurement demonstrates that the H2O megamaser technique can be applied to galaxies beyond 200 Mpc for BH mass measurements.
-
3.
Disturbed maser distributions and kinematics are a ubiquitous feature of all double-peaked maser systems, in which signatures of AGN outflows or winds appear to be more prominent than in triple-peaked megamasers, suggesting that the disturbed maser distribution and kinematics are associated with AGN winds which occur on a 1 pc scale.
-
4.
The double-peaked and triple-peaked maser systems show distinctly different distributions in the diagram. The triple-peaked masers tend to have 0.1 while the double-peaked sources show an opposite trend. This supports the picture that double-peaked systems tend to reside in an environment where the circumnuclear gas has a higher chance to get disturbed dynamically because of a more prominent wind. On the other hand, in a triple-peaked maser system, the AGN wind becomes less prominent, allowing the disk to be dominated by the gravity of the BH and enabling the gas to follow Keplerian rotation.
Acknowledgements
The National Radio Astronomy Observatory is a facility of the National Science Foundation operated under cooperative agreement by Associated Universities, Inc. This publication is supported by the Ministry of Science and Technology, R.O.C. under the project 108-2112-M-110-002. This research has made use of NASA’s Astrophysics Data System Bibliographic Services, and the NASA/IPAC Extragalactic Database (NED) which is operated by the Jet Propulsion Laboratory, California Institute of Technology, under contract with the National Aeronautics and Space Administration.
Appendix A Estimates of the systematic uncertainties in the BH mass measurements caused by wind disturbances
To assess the magnitude of BH mass underestimation for a maser disk perturbed by a wind, we assume that the disturbance from the wind injects kinetic energy into the maser system and drives/ enhances turbulence in the maser disk. When the gas pressure caused from turbulence is not negligible, the orbital velocity of a maser spot in the disk can be expressed as
| (1) |
where is the radial distance of the maser spot from the dynamical center, is the local volume density, and is the gas pressure at radius (Haworth et al. 2018). In a turbulent disk, includes both thermal and turbulent components. So, , where is the isothermal sound speed and is the squared turbulent velocity dispersion (Montesinos Armijo & de Freitas Pacheco 2011). Assuming that the turbulent pressure dominates over the thermal pressure in a wind-perturbed maser disk, .
| Name | (pc) | (km s-1) | (%) | (%) |
| NGC 1320 | 0.07 | 40 | 1 | 7.0 |
| NGC 3079 | 0.40 | 60 | 34 | 6.8 |
| NGC 4388 | 0.24 | 10 | 0.1 | 7.2 |
| NGC 4945 | 0.16 | 60 | 24 | 7.3 |
| Mrk 1 | 0.11 | 30 | 2 | 7.0 |
| Mrk 1210 | 0.26 | 30 | 1 | 7.0 |
| Circinus | 0.11 | 30 | 3 | 7.3 |
| Note. Col(1): Name of the maser galaxy; Col(2): The inner radius of the maser disk (); Col(3): The conservative estimate of the turbulent velocity dispersion () inferred from the position-velocity diagram of the maser system; Col(4): The ratio between BH mass underestimation () caused by wind disturbance and the BH mass estimate () of the maser system reported in Table 5. is evaluated with and shown in column (2) & (3); The ratio between and , where refers to the BH mass error caused by uncertainty of galaxy distance reported in NED. | ||||
Based on the standard theory of accretion disks, /[], where and are disk surface density and scale height at radius , respectively (Neufeld & Maloney 1995). For a turbulence dominated disk, the disk height is characterized by / (Vollmer & Davies 2013), where is turbulence velocity dispersion and is the angular velocity of the disk. For the double-peaked maser systems listed in Table 5 except for NGC 3079, can be approximated by Keplerian angular velocity . For NGC 3079 (Kondratko et al. 2005), which has a nearly flat rotation curve, 1/. Assuming that maser disk surface density follows (Hur et al. 2011), one can infer that , where 2 for NGC 3079 and 5/2 for the rest of double-peaked disk masers. In addition, one can easily verify that
| (2) |
if we assume that is constant across the masing region of the disk. With this, Equation (1) can be re-written as
| (3) |
One can infer from the above equation that
| (4) |
where is the enclosed mass measured from the observed orbital velocity of a maser spot and /G gives the mass underestimation caused by wind disturbance if one uses to estimate .
In the 3rd column of Table 6, we list our conservative estimates of turbulent velocity dispersions for double-peaked megamasers in Table 5. We estimate from the velocity scatter seen in the rotation curves of these double-peaked systems. NGC 5728 is not included here because this system is determined to be in a wind and shows a rising rotation curve. In the 4th column of the table, we show the ratio between and the BH mass estimate shown in Table 5, with evaluated using the inner radius of the maser disk. One can see from this table that except for NGC 3079 and NGC 4945, is smaller than the BH mass error caused by uncertainty of the galaxy distance. Given the magnitude of shown in Table 6, one can infer that the effect of wind disturbance would not be large enough to account for the systematic difference of between the double-peaked and triple-peaked maser systems.
Appendix B Maser positions and velocities for NGC 5728, Mrk1, and IRAS 084520011
| Vop | RA | RA | Decl. | DEC | Fν | |
|---|---|---|---|---|---|---|
| (km s-1) | (mas) | (mas) | (mas) | (mas) | (mJy/B) | (mJy/B) |
| 209.01 | 1.241 | 0.031 | 1.404 | 0.127 | 17.0 | 1.9 |
| 207.29 | 1.291 | 0.031 | 1.612 | 0.123 | 15.9 | 1.7 |
| 205.57 | 1.231 | 0.053 | 0.821 | 0.203 | 10.4 | 1.8 |
| 188.38 | 1.134 | 0.034 | 0.166 | 0.122 | 18.5 | 2.0 |
| 186.66 | 1.042 | 0.057 | 0.026 | 0.172 | 13.1 | 1.8 |
| 119.58 | 1.202 | 0.033 | 0.262 | 0.137 | 13.6 | 1.8 |
| 117.86 | 1.196 | 0.053 | 0.481 | 0.216 | 10.3 | 1.7 |
| 116.14 | 1.158 | 0.051 | 0.234 | 0.162 | 10.8 | 1.8 |
| 114.42 | 1.162 | 0.042 | 0.036 | 0.159 | 11.9 | 1.8 |
| -74.01 | 3.573 | 0.013 | 0.866 | 0.049 | 57.0 | 2.4 |
| -170.18 | 4.669 | 0.028 | 2.232 | 0.127 | 17.3 | 2.0 |
| -170.00 | 4.638 | 0.028 | 2.201 | 0.109 | 17.3 | 1.9 |
| -195.74 | 5.682 | 0.032 | 3.502 | 0.115 | 16.7 | 1.9 |
| -199.18 | 5.757 | 0.046 | 3.190 | 0.210 | 11.4 | 1.8 |
| Note. Col.(1): Maser velocity relative to the systemic velocity of the galaxy ( 2812 km s-1). The velocity shown here is referenced to the LSR using the optical definition; Col.(2)Col.(5): East-west and north-south position offset and uncertainty measured relative to the phase-reference center (RA 14:42:23.87213; DEC 17:15:11.0165). The position uncertainty reflects measurement errors only ; Col.(6)Col.(7): Fitted peak intensity and its uncertainty in mJy beam-1. | ||||||
| Vop | RA | RA | Decl. | DEC | Fν | |
|---|---|---|---|---|---|---|
| (km s-1) | (mas) | (mas) | (mas) | (mas) | (mJy/B) | (mJy/B) |
| 107.25 | 0.157 | 0.032 | 0.351 | 0.067 | 5.4 | 0.8 |
| 103.77 | 0.144 | 0.023 | 0.166 | 0.046 | 7.6 | 0.8 |
| 102.03 | 0.037 | 0.009 | 0.030 | 0.021 | 17.7 | 0.8 |
| 100.29 | 0.044 | 0.007 | 0.004 | 0.016 | 23.0 | 0.8 |
| 98.54 | 0.039 | 0.017 | 0.139 | 0.037 | 10.4 | 0.8 |
| 96.80 | 0.012 | 0.048 | 0.253 | 0.101 | 4.3 | 0.8 |
| 95.06 | 0.110 | 0.035 | 0.138 | 0.070 | 5.2 | 0.7 |
| 93.32 | 0.004 | 0.035 | 0.094 | 0.064 | 5.0 | 0.8 |
| 91.58 | 0.006 | 0.016 | 0.016 | 0.033 | 10.7 | 0.8 |
| 89.83 | 0.032 | 0.006 | 0.014 | 0.015 | 23.4 | 0.8 |
| 88.09 | 0.020 | 0.005 | 0.045 | 0.011 | 31.0 | 0.8 |
| 86.35 | 0.012 | 0.004 | 0.049 | 0.009 | 41.3 | 0.8 |
| 84.61 | 0.027 | 0.005 | 0.015 | 0.012 | 29.9 | 0.8 |
| 82.87 | 0.030 | 0.012 | 0.033 | 0.026 | 13.9 | 0.8 |
| 81.12 | 0.098 | 0.012 | 0.063 | 0.024 | 15.1 | 0.8 |
| 79.38 | 0.137 | 0.010 | 0.147 | 0.021 | 17.6 | 0.8 |
| 77.64 | 0.225 | 0.016 | 0.216 | 0.031 | 11.6 | 0.8 |
| 75.90 | 0.254 | 0.015 | 0.278 | 0.035 | 11.1 | 0.8 |
| 74.16 | 0.231 | 0.022 | 0.242 | 0.056 | 7.0 | 0.8 |
| 72.42 | 0.906 | 0.055 | 0.527 | 0.080 | 4.3 | 0.7 |
| 70.67 | 0.175 | 0.035 | 0.290 | 0.069 | 5.5 | 0.8 |
| 67.19 | 0.254 | 0.040 | 0.470 | 0.088 | 4.7 | 0.8 |
| 65.45 | 0.302 | 0.016 | 0.473 | 0.037 | 10.1 | 0.8 |
| 61.96 | 0.964 | 0.050 | 0.622 | 0.081 | 4.0 | 0.8 |
| 60.22 | 0.897 | 0.016 | 0.491 | 0.037 | 9.5 | 0.8 |
| 49.77 | 1.430 | 0.040 | 0.422 | 0.094 | 4.2 | 0.8 |
| 44.55 | 1.367 | 0.032 | 0.311 | 0.085 | 4.2 | 0.8 |
| 42.80 | 1.380 | 0.031 | 0.161 | 0.097 | 4.8 | 0.8 |
| 35.84 | 1.124 | 0.037 | 1.162 | 0.078 | 4.5 | 0.7 |
| 34.09 | 0.844 | 0.038 | 1.121 | 0.083 | 4.0 | 0.7 |
| 32.35 | 1.063 | 0.043 | 1.192 | 0.124 | 3.6 | 0.7 |
| -154.08 | 0.347 | 0.031 | 3.364 | 0.085 | 5.0 | 0.8 |
| -155.82 | 0.350 | 0.008 | 3.298 | 0.018 | 19.8 | 0.8 |
| -157.56 | 0.343 | 0.022 | 3.473 | 0.048 | 7.0 | 0.7 |
| -159.30 | 0.462 | 0.014 | 3.481 | 0.037 | 10.2 | 0.8 |
| -161.04 | 0.445 | 0.021 | 3.355 | 0.047 | 8.0 | 0.8 |
| -162.78 | 0.432 | 0.026 | 3.414 | 0.066 | 5.9 | 0.8 |
| -164.52 | 0.335 | 0.039 | 3.434 | 0.085 | 3.9 | 0.8 |
| -166.26 | 0.383 | 0.025 | 3.383 | 0.069 | 5.3 | 0.8 |
| -168.00 | 0.317 | 0.037 | 3.381 | 0.097 | 4.4 | 0.8 |
| -169.73 | 0.399 | 0.046 | 3.325 | 0.112 | 4.0 | 0.7 |
| -178.43 | 0.271 | 0.037 | 3.425 | 0.089 | 4.1 | 0.7 |
| -180.17 | 0.331 | 0.008 | 3.484 | 0.019 | 20.1 | 0.8 |
| -181.91 | 0.345 | 0.012 | 3.494 | 0.028 | 12.9 | 0.8 |
| -192.34 | 0.480 | 0.044 | 2.862 | 0.074 | 4.5 | 0.7 |
| -194.08 | 0.547 | 0.019 | 2.780 | 0.043 | 7.8 | 0.8 |
| -195.82 | 0.516 | 0.013 | 2.798 | 0.031 | 10.7 | 0.8 |
| -197.55 | 0.542 | 0.018 | 2.782 | 0.039 | 9.1 | 0.8 |
| -199.29 | 0.531 | 0.013 | 2.784 | 0.033 | 10.6 | 0.8 |
| -201.03 | 0.549 | 0.020 | 2.696 | 0.037 | 8.5 | 0.8 |
| -202.77 | 0.497 | 0.023 | 2.754 | 0.058 | 5.2 | 0.7 |
| Note. Col.(1): Maser velocity relative to the systemic velocity of the galaxy ( 4781 km s-1). The velocity shown here is referenced to the LSR using the optical definition; Col.(2)Col.(5): East-west and north-south position offset and uncertainty measured relative to the phase-reference center (RA 01:16:07.2093243; DEC 33:05:21.633601). The position uncertainty reflects measurement errors only ; Col.(6)Col.(7): Fitted peak intensity and its uncertainty in mJy beam-1. | ||||||
| Vop | RA | RA | Decl. | DEC | Fν | |
|---|---|---|---|---|---|---|
| (km s-1) | (mas) | (mas) | (mas) | (mas) | (mJy/B) | (mJy/B) |
| 832.39 | 0.547 | 0.085 | 0.101 | 0.165 | 11.7 | 2.0 |
| 831.27 | 0.537 | 0.066 | 0.003 | 0.131 | 12.3 | 2.2 |
| 812.17 | 0.499 | 0.066 | 0.161 | 0.114 | 13.5 | 2.1 |
| 809.93 | 0.462 | 0.044 | 0.136 | 0.086 | 18.1 | 2.1 |
| 808.80 | 0.460 | 0.034 | 0.004 | 0.091 | 22.6 | 2.2 |
| 807.68 | 0.450 | 0.032 | 0.002 | 0.068 | 25.6 | 2.2 |
| 806.56 | 0.488 | 0.042 | 0.058 | 0.087 | 22.0 | 2.2 |
| 805.43 | 0.495 | 0.059 | 0.097 | 0.103 | 17.1 | 2.1 |
| 804.31 | 0.380 | 0.057 | 0.180 | 0.143 | 13.4 | 2.0 |
| 784.09 | 0.578 | 0.065 | 0.127 | 0.139 | 14.6 | 2.0 |
| 782.97 | 0.448 | 0.023 | 0.085 | 0.051 | 33.8 | 2.2 |
| 781.84 | 0.449 | 0.019 | 0.113 | 0.047 | 41.8 | 2.2 |
| 780.72 | 0.457 | 0.029 | 0.111 | 0.064 | 31.1 | 2.3 |
| 779.60 | 0.446 | 0.030 | 0.079 | 0.080 | 25.7 | 2.1 |
| 778.47 | 0.462 | 0.037 | 0.265 | 0.079 | 20.1 | 2.2 |
| 770.61 | 0.447 | 0.042 | 0.095 | 0.125 | 13.4 | 2.3 |
| 768.36 | 0.532 | 0.072 | 0.144 | 0.148 | 12.7 | 2.1 |
| 767.24 | 0.408 | 0.058 | 0.097 | 0.121 | 14.1 | 2.1 |
| 703.21 | 0.551 | 0.114 | 0.210 | 0.202 | 10.3 | 2.0 |
| 702.08 | 0.279 | 0.116 | 0.112 | 0.141 | 11.2 | 2.1 |
| 26.11 | 0.438 | 0.082 | 0.113 | 0.155 | 12.3 | 2.3 |
| 24.99 | 0.356 | 0.035 | 0.073 | 0.075 | 21.6 | 2.1 |
| 23.87 | 0.403 | 0.049 | 0.113 | 0.106 | 18.2 | 2.0 |
| 22.76 | 0.359 | 0.049 | 0.068 | 0.111 | 16.5 | 2.2 |
| 21.64 | 0.291 | 0.050 | 0.142 | 0.126 | 18.4 | 2.1 |
| 20.52 | 0.382 | 0.038 | 0.257 | 0.102 | 18.8 | 2.0 |
| 19.40 | 0.390 | 0.061 | 0.233 | 0.119 | 15.1 | 2.2 |
| 18.29 | 0.315 | 0.039 | 0.075 | 0.091 | 18.9 | 2.2 |
| 17.17 | 0.338 | 0.056 | 0.069 | 0.122 | 17.3 | 2.1 |
| 16.05 | 0.352 | 0.056 | 0.085 | 0.107 | 15.6 | 2.2 |
| 14.93 | 0.387 | 0.063 | 0.107 | 0.134 | 14.5 | 2.3 |
| 13.81 | 0.393 | 0.045 | 0.029 | 0.095 | 20.0 | 2.3 |
| 12.70 | 0.372 | 0.026 | 0.133 | 0.059 | 34.7 | 2.3 |
| 11.58 | 0.363 | 0.032 | 0.032 | 0.072 | 27.0 | 2.1 |
| 10.46 | 0.328 | 0.039 | 0.024 | 0.091 | 20.8 | 2.1 |
| 9.34 | 0.385 | 0.054 | 0.027 | 0.125 | 14.2 | 2.2 |
| -633.37 | 0.142 | 0.044 | 0.414 | 0.135 | 13.1 | 2.0 |
| -634.48 | 0.083 | 0.057 | 0.202 | 0.168 | 11.8 | 2.1 |
| -656.74 | 0.281 | 0.065 | 0.307 | 0.117 | 11.9 | 2.0 |
| -666.76 | 0.142 | 0.087 | 0.208 | 0.184 | 10.3 | 2.1 |
| -670.10 | 0.186 | 0.046 | 0.452 | 0.106 | 15.6 | 2.2 |
| -671.21 | 0.173 | 0.049 | 0.324 | 0.126 | 14.8 | 2.1 |
| -673.43 | 0.186 | 0.055 | 0.309 | 0.122 | 15.2 | 2.2 |
| -674.55 | 0.231 | 0.049 | 0.339 | 0.104 | 16.8 | 2.0 |
| -739.10 | 0.213 | 0.055 | 0.167 | 0.111 | 15.5 | 2.1 |
| -740.21 | 0.330 | 0.062 | 0.492 | 0.141 | 11.5 | 2.1 |
| Note. Col.(1): Maser velocity relative to the systemic velocity of the galaxy ( 15262 km s-1). The velocity shown here is referenced to the LSR using the optical definition; Col.(2)Col.(5): East-west and north-south position offset and uncertainty measured relative to the phase-reference center (RA 08:47:47.70278; DEC 00:22:51.01505). The position uncertainty reflects measurement errors only ; Col.(6)Col.(7): Fitted peak intensity and its uncertainty in mJy beam-1. | ||||||
Data Availability : The data underlying this article are available in the article and in its online supplementary material.
References
- Awaki et al. (2009) Awaki H., Terashima Y., Higaki Y., Fukazawa Y. 2009, PASJ, 61, 317
- Blanford & Payne (1982) Blandford, R. D., Payne, D. G. 1982, MNRAS, 199, 883
- Braatz et al. (2003) Braatz, J. A., Wilson, A. S., Henkel, C., Gough, R., Sinclair, M. 2003, ApJS, 146, 249
- Braatz et al. (1994) Braatz, J. A., Wilson, A. S., Henkel, C. 1994, ApJ, 437, 99
- Braatz et al. (2004) Braatz, J. A., Henkel, C., Greenhill, L. J., Moran, J. M., Wilson, A. S. 2004, ApJ, 617, 29
- Braatz et al. (2010) Braatz, J. A., Reid, M. J., Humphreys, E. M. L., Henkel, C., Condon, J. J., & Lo, K. Y. 2010, ApJ, 718, 657
- Braatz et al. (2019) Braatz, J., Pesce, D., Condon, J., Reid, M. 2019, BAAS, 51, 446
- Brightman & Nandra (2011) Brightman, M., Nandra, K. 2011, MNRAS, 413, 1206
- Brightman et al. (2017) Brightman, M., Balokovi, M., Ballantyne, D. R. et al. 2017, ApJ, 844, 10
- Castangia et al. (2013) Castangia, P., Panessa, F., Henkel, C., Kadler, M., Tarchi, A. 2013, MNRAS, 436, 3388
- Cecil et al. (2002) Cecil, G., Bland-Hawthorn, J., Veilleux, S. 2002, ApJ, 576, 745
- Cicone et al. (2014) Cicone, C., Maiolino, R., Sturm, E. et al. 2014, A&A, 562, 21
- Combes et al. (2014) Combes, F. 2014, Proceedings IAU Symposium No. 209, Models of AGN feedback
- Czerny (2020) Czerny, B. 2020, Univ, 5, 131
- Deller et al. (2007) Deller, A. T., Tingay, S. J., Bailes, M., West, C. 2007, PASP, 119, 318
- Duric & Seaquist (1988) Duric, N., Seaquist, E. R. 1988, ApJ, 326, 574
- Durr´e & Mould (2018) Durr, M., Mould, J. 2018, ApJ, 867, 149
- Durr´e & Mould (2019) Durr, M., Mould, J. 2019, ApJ, 870, 37
- Falcke et al. (1998) Falcke, H., Wilson, A. S., & Simpson, C. 1998, ApJ, 502, 19
- Ferrarese & Merritt (2000) Ferrarese, L. & Merritt, D. 2000, ApJ, 539, 9
- Fiore et al. (2017) Fiore, F., Feruglio, C., Shankar, F. et al. 2017, A&A, 601, 143
- Freitas et al. (2018) Freitas, I. C., Riffel, R. A., Storchi-Bergmann, T., Elvis, M., Robinson, A., Crenshaw, D. M., Nagar, N. M., Lena, D., Schmitt, H. R., Kraemer, S. B. 2018, MNRAS, 476, 2760
- Furuya et al. (2000) Furuya, R. S., Kitamura, Y., Wootten, H. Al., Claussen, M. J., Saito, M., Marvel, K. B., Kawabe, R. 2000, ApJ, 542, 135
- Gallimore et al. (2001) Gallimore, J. F., Henkel, C., Baum, S. A., Glass, I. S., Claussen, M. J., Prieto, M. A., Von Kap-herr, A. 2001, ApJ, 556, 694
- Gallimore et al. (2004) Gallimore, J. F., Baum, S. A., O’Dea, C. P. 2004, ApJ, 613, 794
- Gao et al. (2016) Gao, F., Braatz, J. A., Reid, M. J., Lo, K. Y., Condon, J. J., Henkel, C.; Kuo, C. Y., Impellizzeri, C. M. V., Pesce, D. W, Zhao, W. 2016, ApJ, 817, 128
- Gao et al. (2017) Gao, F., Braatz, J. A., Reid, M. J., Condon, J. J., Greene, J. E., Henkel, C., Impellizzeri, C. M. V., Lo, K. Y., Kuo, C. Y., Pesce, D. W., Wagner, J., Zhao, W. 2017, ApJ, 834, 52
- Gebhardt et al. (2000) Gebhardt, K., Bender, R., Bower, G. et al. 2000, ApJ, 539, 13
- Giustini & Proga (2019) Giustini, M. & Proga, D. 2019, A&A, 630, 94
- Goddi et al. (2011) Goddi, C., Humphreys, E. M. L., Greenhill, L. J., Chandler, C. J., Matthews, L. D. 2011, ApJ, 728, 15
- Greene (2006) Greene, J. E. 2006, PhD Thesis: Proquest Dissertations And Theses 2006. Section 0084, Harvard University; Publication Number: AAT 3217740.
- Greene et al. (2010) Greene, J. E., Peng, C. Y., Kim, M., Kuo, C.-Y., Braatz, J. A., Impellizzeri, C. M. V., Condon, J. J., Lo, K. Y., Henkel, C., Reid, Mark J. 2010, ApJ, 721, 26
- Greene et al. (2013) Greene, J. E., Seth, A., den Brok, M., Braatz, J. A., Henkel, C., Sun, A.-L., Peng, C. Y., Kuo, C.-Y., Impellizzeri, C. M. V., Lo, K. Y. 2013, ApJ, 771, 121
- Greene et al. (2014) Greene, J. E., Seth, A., Lyubenova, M., Walsh, J., van de Ven, G., Lsker, R. 2014, ApJ, 788, 145
- Greene et al. (2016) Greene, J. E., Seth, A., Kim, M., Lsker, R., Goulding, A., Gao, F., Braatz, J. A., Henkel, C., Condon, J., Lo, K. Y., Zhao, W. 2016, ApJ, 826, 32
- Greenhill et al. (1997) Greenhill, L. J., Moran, J. M., Herrnstein, J. R. 1997, ApJ, 481, 23
- Greenhill et al. (2003a) Greenhill, L. J., Kondratko, P. T., Lovell, J. E. J., Kuiper, T. B. H., Moran, J. M., Jauncey, D. L., Baines, G. P. 2003, ApJ, 582, 11
- Greenhill et al. (2003b) Greenhill, L. J. et al. 2003, ApJ, 590, 162
- Greenhill et al. (2008) Greenhill, L. J., Tilak, A., Madejski, G. 2008, ApJ, 686, 13
- Greenhill et al. (2013) Greenhill, L. J., Goddi, C., Chandler, C. J., Matthews, L. D., Humphreys, E. M. L. 2013, ApJ, 770, 32
- Guainazzi, Matt, & Perola (2005) Guainazzi, M., Matt, G., Perola, G. C. 2005, A&A, 444, 119
- G¨ultekin et al. (2009) Gltekin, K., Richstone, D. O., Gebhardt, K. et al. 2009, ApJ, 698, 198
- Haworth et al. (2018) Haworth, T. J., Booth, R. A., Homan, W., Decin, L., Clarke, C. J., Mohanty, S. 2018, MNRAS, 473, 317
- Hetckman (2003) Heckman, T. M. 2003, RMxAC, 17, 47
- Heckman et al. (2004) Heckman, T. M., Kauffmann, G., Brinchmann, J., Charlot, S., Tremonti, C., & White, S. D. M. 2004, ApJ, 613, 109
- Heckman & Best (2014) Heckman, T. M., Best, P. N. 2014, ARA&A, 52, 589
- Herrnstein et al. (1999) Herrnstein, J. R., Moran, J. M., Greenhill, L. J., Diamond, P. J., Inoue, M., Nakai, N., Miyoshi, M., Henkel, C., Riess, A. 1999, Nature, 400, 539
- Herrnstein et al. (2005) Herrnstein, J. R., Moran, J. M., Greenhill, L. J., Trotter, A. S. 2005, ApJ, 629, 719
- Hirota et al. (2014) Hirota, T., Kim, M. K., Kurono, Y., Honma, M. 2014, ApJ, 782, 28
- Hirota et al. (2017) Hirota, T., Machida, M. N., Matsushita, Y., Motogi, K., Matsumoto, N., Kim, M. K., Burns, R. A., Honma, M. 2017, NatAs, 1, 146
- Ho et al. (1997) Ho, L. C., Filippenko, A. V., Sargent, W. L. W. 1997, ApJS, 112, 315
- Humphreys et al. (2013) Humphreys, E. M. L., Reid, M. J., Moran, J. M., Greenhill, L. J., Argon, A. L. 2013, ApJ, 775, 13
- Hur´e et al. (2011) Hur, J.-M., Hersant, F., Surville, C., Nakai, N., Jacq, T. 2011, A&A, 530, 145
- Kamali et al. (2019) Kamali, F., Henkel, C., Koyama, S. et al. 2019, A&A, 624, 42
- Kang et al. (2017) Kang, D., Woo, J.-H., Bae, H.-J. 2017, ApJ, 845, 131
- Kashi et al. (2013) Kashi, A., Proga, D., Nagamine, K., Greene, J., Barth, Aaron J. 2013, ApJ, 778, 50
- Kondratko et al. (2005) Kondratko, P. T., Greenhill, L. J., Moran, J. M. 2005, ApJ, 618, 618
- Kondratko et al. (2008) Kondratko, P. T., Greenhill, L. J., Moran, J. M. 2008, ApJ, 678, 87
- Königl & Kartje (1994) Königl, A. & Kartje, J. F. 1994, ApJ, 434, 446
- Koratkar & Blaes (1999) Koratkar, A., Blaes, O. 1999, PASP, 111, 1
- Kuo et al. (2011) Kuo, C. Y.; Braatz, J. A.; Condon, J. J.; Impellizzeri, C. M. V.; Lo, K. Y.; Zaw, I.; Schenker, M.; Henkel, C.; Reid, M. J.; Greene, J. E. 2011, ApJ, 727, 20
- Kuo et al. (2013) Kuo, C. Y., Braatz, J. A., Reid, M. J., Lo, K. Y., Condon, J. J., Impellizzeri, C. M. V., Henkel, C. 2013, ApJ, 767, 155
- Kuo et al. (2015) Kuo, C. Y., Braatz, J. A., Lo, K. Y., Reid, M. J., Suyu, S., Pesce, D., Condon, J. J. Henkel, C., Impellizzeri, C. M. V. 2015, ApJ, 800, 26
- Kuo et al. (2018) Kuo, C. Y., Constantin, A., Braatz, J. A., Chung, H. H., Witherspoon, C. A., Pesce, D., Impellizzeri, C. M. V., Gao, F., Hao, Lei, Woo, J.H., Zaw, Ingyin 2018, ApJ, 860, 169
- Krasnopolsky, Li, & Blandford (1999) Krasnopolsky, R., Li, Z.-Y., & Blandford, R. 1999, ApJ, 526, 631
- Liu et al. (2009) Liu, X., Zakamska, N. L., Greene, J. E., Strauss, M. A., Krolik, J. H., Heckman, T. M. 2009, ApJ, 702, 1098
- Lo (2005) Lo, K. Y. 2005 ARA&A 43 625
- Lusso et al. (2012) Lusso, E., Comastri, A., Simmons, B. D. et al. 2012, MNRAS, 425, 623
- Masini et al. (2016) Masini et al., 2016, A&A, 589, 59
- Matthews et al. (2010) Matthews, L. D., Greenhill, L. J., Goddi, C., Chandler, C. J., Humphreys, E. M. L., Kunz, M. W. 2010, ApJ, 708, 80
- McKinnon et al. (2016) McKinnon, M., Chandler, C., Hibbard, J., Kern, J., Perley, M. 2016, Proceedings of the SPIE, Volume 9910, id. 99100L 7 pp.
- Netzer (2015) Netzer, H. 2015, ARA&A, 53, 365
- Neufeld & Maloney (1995) Neufeld, D. A., Maloney, P. R. 1995, ApJ, 447, 17
- Montesinos Armijo & de Freitas Pacheco (2011) Montesinos Armijo, M., de Freitas Pacheco, J. A. 2011, ApJ, 736, 126
- Ouyed & Pudritz (1997) Ouyed, R., & Pudritz, R. E. 1997, ApJ, 484, 794
- Panessa et al. (2006) Panessa, F., Bassani, L., Cappi, M., Dadina, M., Barcons, X., Carrera, F. J., Ho, L. C., Iwasawa, K. 2006, A&A, 455, 173
- Proga (2000) Proga, D. 2000, ApJ, 538, 684
- Reid et al. (2009a) Reid, M. J., Braatz, J. A., Condon, J. J., Greenhill, L. J., Henkel, C., Lo, K. Y. 2009, ApJ, 695, 287
- Reid et al. (2009b) Reid, M. J., Menten, K. M., Brunthaler, A., Zheng, X. W., Moscadelli, L. & Xu, Y. 2009, ApJ, 693, 397
- Reid et al. (2013) Reid, M. J.; Braatz, J. A.; Condon, J. J.; Lo, K. Y.; Kuo, C. Y.; Impellizzeri, C. M. V.; Henkel, C. 2013, ApJ, 767, 154
- Ricci et al. (2017) Ricci, C., Trakhtenbrot, B., Koss, M. J. et al. 2017, ApJS, 233, 17
- Sawada-Satoh et al. (2000) Sawada-Satoh, S., Inoue, M., Shibata, K. M., Kameno, S., Migenes, V., Nakai, N., Diamond, P. J. 2000, PASJ, 52, 421
- Schmitt et al. (2001) Schmitt, H. R., Ulvestad, J. S., Antonucci, R. R. J., Kinney, A. L. 2001, ApJS, 132, 199
- Schommer et al. (1988) Schommer, R. A., Caldwell, N., Wilson, A. S., Baldwin, J. A., Phillips, M. M., Williams, T. B., Turtle, A. J. 1988, ApJ, 324, 154
- Shu et al. (2007) Shu, X. W., Wang, J. X., Jiang, P., Fan, L. L., Wang, T. G. 2007, ApJ, 657, 167
- Singh et al. (2011) Singh, V., Shastri, P., Risaliti, G. 2011, A&A, 533, 128
- Stoklasov´a et al (2009) Stoklasov, I., Ferruit, P., Emsellem, E., Jungwiert, B., Pcontal, E., Snchez, S. F. 2009, A&A, 500, 1287
- Stone et al. (1988) Stone, Jr., J. L., Wilson, A. S., & Ward, M. J. 1988, ApJ, 330, 105
- Ustyugova et al. (1999) Ustyugova, G. V., Koldoba, A. V., Romanova, M. M., Chechetkin, V. M., & Lovelace, R. V. E. 1999, ApJ, 516, 221
- Veilleux et al. (1994) Veilleux, S., Cecil, G., Bland-Hawthorn, J., Tully, R. B., Filippenko, A. V., Sargent, W. L. W. 1994, ApJ, 433, 48
- Vollmer & Davies (2013) Vollmer, B., Davies, R. I. 2013, A&A, 556, 31
- Walker & Chatterjee (2000) Walker, C. & Chatterjee, S., 2000, VLBA Scientific Memo 23, http://www.vlba.nrao.edu/memos/sci/
- Wilson et al. (1993) Wilson, A. S., Braatz, J. A., Heckman, T. M., Krolik, J. H., Miley, G. K. 1993, ApJ, 419, 61
- Yamauchi et al. (2012) Yamauchi, A., Nakai, N., Ishihara, Y., Diamond, P., Sato, N. 2012, PASJ, 64, 103
- Zhao et al. (2018) Zhao, W., Braatz, J. A., Condon, J. J., Lo, K. Y., Reid, M. J., Henkel, C., Pesce, D. W., Greene, J. E., Gao, F., Kuo, C. Y., Impellizzeri, C. M. V. 2018, ApJ, 854, 124
- Zhang et al. (2010) Zhang, J. S., Henkel, C., Guo, Q., Wang, H. G., Fan, J. H. 2010, ApJ, 708, 1528
- Woo et al. (2016) Woo, J.-H., Bae, H.-J., Son, D., Karouzos, M. 2016, ApJ, 817, 108
- Zhu et al. (2011) Zhu, G., Zaw, I., Blanton, M. R., Greenhill, L. J. 2011, ApJ, 742, 73