Observational Properties of Field UDGs: Colours and Number Densities
Abstract
While much of the focus around Ultra-Diffuse Galaxies (UDGs) has been given to those in galaxy groups and clusters, relatively little is known about them in less-dense environments. These isolated UDGs provide fundamental insights into UDG formation because environmentally driven evolution and survivability play less of a role in determining their physical and observable properties. We have recently conducted a statistical analysis of UDGs in the field using a new catalogue of sources detected in the deep Kilo-Degree Survey (KiDS) and Hyper Suprime-Cam Subaru Strategic Program (HSC-SSP) optical imaging surveys. Using an empirical model to assess our contamination from interloping sources, we show that a scenario in which cluster-like quiescent UDGs occupy a large fraction of the field UDG population is unlikely, with most being significantly bluer and some showing signs of localised star formation. We estimate an upper-limit on the total field abundance of UDGs of 83cMpc-3 within our selection range. The mass formation efficiency of UDGs implied by this upper-limit is similar to what is measured in groups and clusters, meaning that secular formation channels may significantly contribute to the overall UDG population.
keywords:
galaxies: dwarf, galaxies: abundances, galaxies: formation, galaxies: evolution1 Introduction
There are several theoretically-plausible formation channels that can explain the existence of ultra-diffuse galaxies (UDGs). These can be secular in nature, arising from high angular momentum of the parent halo and stellar feedback processes (e.g. Amorisco & Loeb, 2016; Di Cintio et al., 2017), or instead driven by environmental effects such as ram pressure stripping and tidal heating (e.g. Collins et al., 2013; Yozin & Bekki, 2015; Carleton et al., 2018; Jiang et al., 2018). It is not currently known how important secular formation channels are in UDG production and this has important implications for galaxy formation models.
One important measurement for understanding UDG formation observationally is whether UDGs are relatively more common in dense environments like galaxy clusters, which would imply that environmental processes play a positive role in UDG production, or whether there are relatively fewer, implying that they are more easily destroyed. van der Burg et al. (2017) found that UDGs are relatively more common in higher-mass environments, but the community has not reached a consensus (Mancera et al., 2018).
UDGs in clusters are typically on the red sequence (Koda et al., 2015; van der Burg et al., 2016; Singh et al., 2019) but may be systematically bluer towards the outskirts of galaxy groups (Román & Trujillo, 2017; Alabi et al., 2018; Zaritsky et al., 2019) and in lower density environments (Greco et al., 2018, 2018b), suggesting that interactions associated with a dense environment, possibly during cluster in-fall, can efficiently quench UDGs.
In this study, based on findings originally presented in Prole et al. (2019), we add to the discussion by showing that UDGs in the field111We note that our working definition of the field is a representative piece of the Universe in which galaxy groups and clusters are included, but massive haloes naturally make up a relatively small fraction by mass. are indeed systematically bluer than those in clusters, implying that quenching mechanisms are strongly linked with environmental density for these objects. We also provide the first-ever measurement of the total number density of the field UDG population and find that we cannot rule out a mass formation efficiency (i.e. the number of UDGs per unit total mass) similar to what it is in clusters, implying that secular formation channels may play a significant role in UDG production.
2 Data
For source detection and structural parameter estimation, we use a 180 deg2 subset of data from the Astrowise (McFarland et al., 2011) reduction of the Kilo-Degree Survey (KiDS; de Jong et al., 2013; Kuijken et al., 2019) that overlaps with the GAMA spectroscopic survey (Driver et al., 2011) equatorial fields. We use the -band images for source detection because they are the deepest and have the best image quality. This is the same data used by van der Burg et al. (2017) in their study of the UDG populations in galaxy groups and so we can make direct comparisons with their findings. Despite the GAMA overlap, redshift measurements are not available for most of our sources because they are generally much fainter than the limiting depth of GAMA at =19.8 mag.
While the KiDS -band is sufficient to reach a limiting surface brightness of 26.5 (we quote all surface brightnesses in magnitudes per square arc-second), we additionally used the first data release of the overlapping Hyper-Suprime-Cam Subaru Strategic Program (Aihara et al., 2018) to measure colours. The HSC-SSP data is around 0.5 mag deeper than KiDS in the -band, but has a reduced footprint (around a quarter) overlapping with the GAMA regions compared to the KiDS area we considered. This left us with 39 deg2 of unmasked data from which we measured the colours.
We did not use the HSC-SSP for detection because of its limited footprint and because of its relatively aggressive background subtraction. Furthermore, reliable stellar reflection halo & artefact masks were available to us for KiDS imaging, which allowed for a reduction in the amount of false positives in our detection pipeline, critical for this work. For this analysis, we restricted ourselves to the and bands but this can be expanded in future studies.
3 Source Identification
We used MTObjects (Teeninga et al., 2016) to construct a preliminary source catalogue from the KiDS -band data, using default parameters. We applied a selection based on segment statistics produced by MTObjects to select extended and LSB sources.
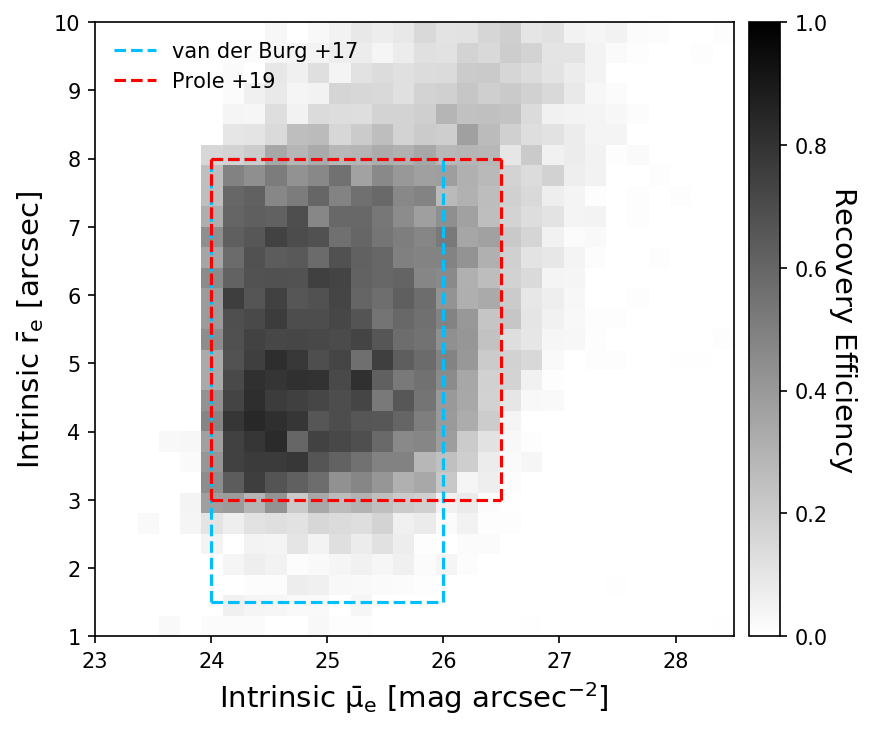
We then used GALFIT (Peng et al., 2002) with KiDS point spread functions to fit single component Sérsic profiles to each selected source, using MTObjects segments as masks and segment statistics for initial parameter guesses. We constructed our UDG candidate catalogue using the GALFIT Sérsic parameters, specifically: 24.026.5, 3.0′′8.0′′, 2.5, where , and are respectively the mean surface brightness within the effective radius, the circularised effective radius and Sérsic index. Completeness estimates were obtained by means of artificial galaxy injections, described in the following section.
4 Artificial Galaxy Injections
Artificial galaxy injections were used to assess the statistical completeness of our source identification pipeline as a function of Sérsic parameters and ; this is displayed in figure 1.
The artificial galaxies were made using GALFIT and injected into the real data to produce augmented versions of each KiDS frame. The whole detection & identification pipeline was run for each augmented frame, such that the recovered GALFIT parameters could also be used to quantify our measurement errors. Overall, we injected 735,000 sources.
We note that we have been able to probe magnitudes deeper than van der Burg et al. (2017) and this is likely due to our use of MTObjects over SExtractor, the latter of which is not designed to work in the LSB regime.
5 Empirical Model
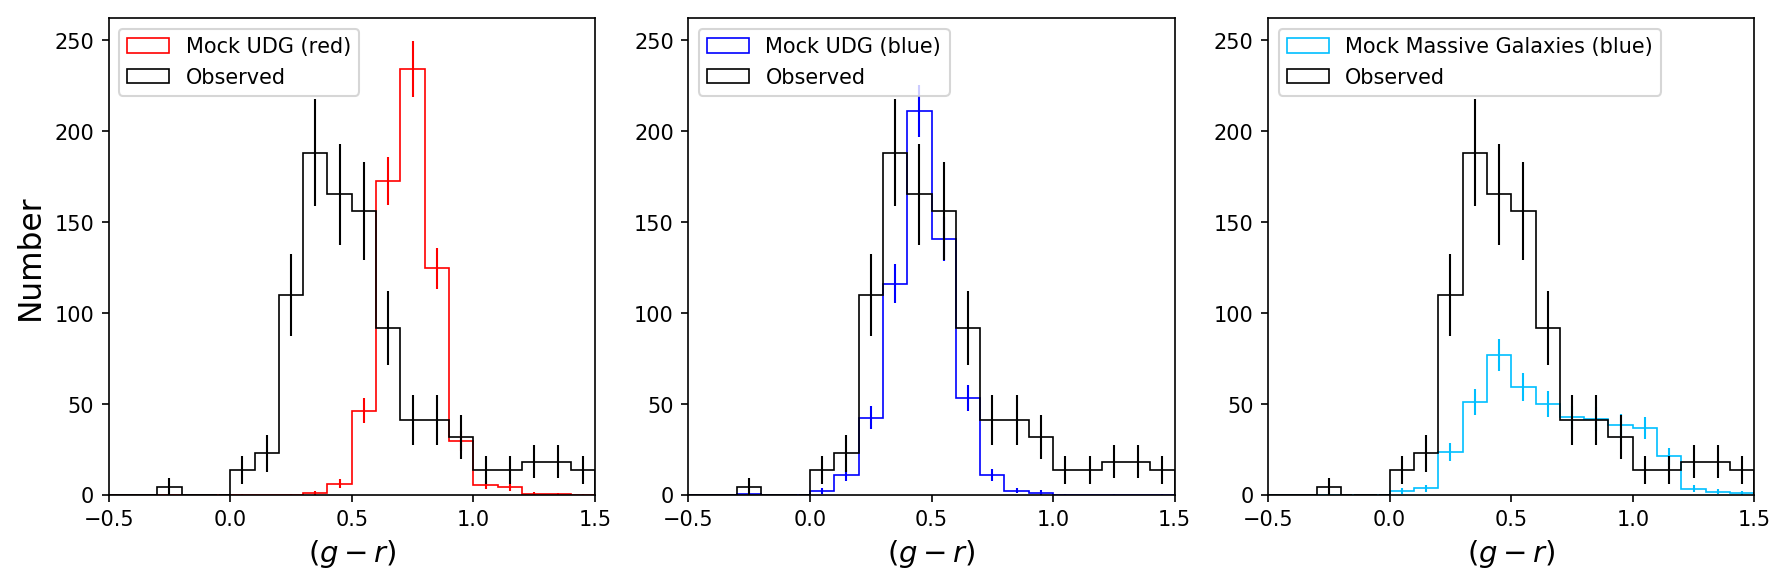
Since we do not know the distances to individual sources, we relied on an empirical model to statistically constrain the properties of the UDG candidates while accounting for interloping sources. Briefly, we modelled the UDGs with a fixed power-law size distribution and uniform surface brightness distribution (cf. van der Burg et al., 2017). We additionally used an empirical colour model based on dwarf galaxies in clusters (cf. Venhola et al., 2018). We tested two colour models: a red/quiescent model, based on early-type dwarf galaxies, and a blue model, based on late-type dwarf galaxies.
We argue that the dominant contribution to the interlopers in our UDG candidate catalogue are distant massive late-type galaxies that are cosmologically dimmed and thus satisfy our selection criteria. This is based on the fact that small/low-mass galaxies are statistically unlikely to be detected (given our recovery efficiency as a function of physical parameters and redshift) and that massive early-type galaxies general have high Sérsic indices (Vulcani et al., 2014). We therefore chose to model the interloping population using canonical empirical relations such as the stellar mass function (Baldry et al., 2012; Muzzin et al., 2013), the stellar mass to size relation (van der Wel et al., 2014) and an empirical colour model based on GAMA observations (Taylor et al., 2011), each pertaining specifically to late-type galaxies; we refer to this as the interloper model.
We performed Monte Carlo sampling of this model (UDGs + interlopers) to generate mock observations, assuming that the galaxies trace the overall matter density of the Universe. We properly accounted for cosmological projection effects including -corrections to derive apparent parameters. Our recovery efficiency measurement was used to assign a recovery probability to each mock galaxy, which was used to randomly select mock sources to construct a final mock observed galaxy catalogue. Such an approach naturally accounts for measurement uncertainties in our GALFIT modelling.
The number of Monte Carlo realisations was tuned so that the number of UDGs equals the expected value given a certain mass formation efficiency (the amount of mass is derived from the matter density of the Universe and the cosmological volume element). To begin with, we adopted a mass formation efficiency equal to that observed for UDGs in galaxy clusters (c.f. van der Burg et al., 2017).
6 Results & Discussion
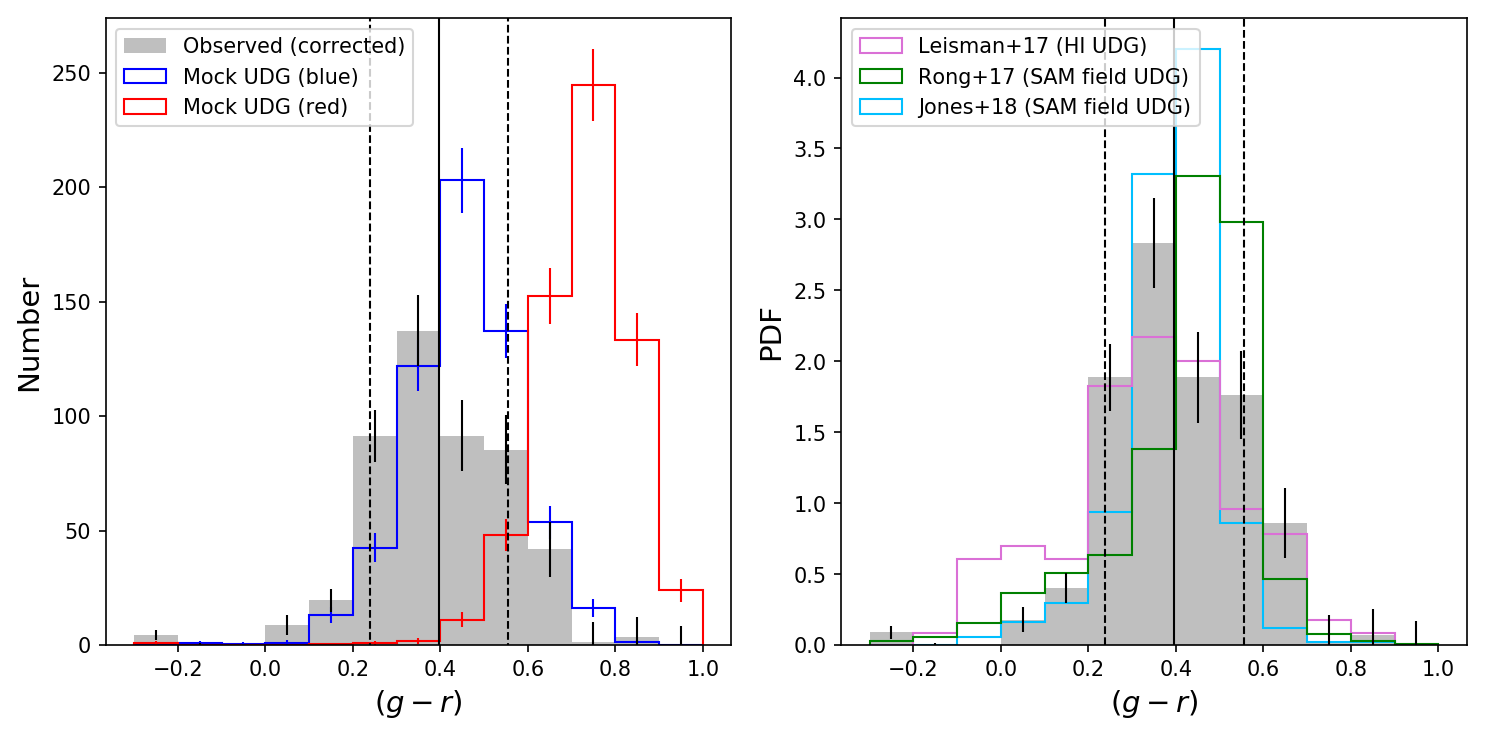
The result of sampling the red UDG model, the blue UDG model and the interloper model are shown consecutively in figure 2. By comparing the colour distributions predicted from our mock catalogues with the real observations, it became clear that a scenario in which a large number (relative to that which would be expected given the assumed mass formation efficiency) of cluster-like quiescent UDGs existing in the field is unlikely (figure 3, first panel, where the corrected-observed histogram is obtained by statistically subtracting the interloper model from the observations).
By comparing the absolute number count of our corrected-observed catalogue to that of our mock blue UDG catalogue, we find that we over-predict the number of UDGs by about 20%. This implies that UDGs in the field form with an average mass formation efficiency 0.80.2 times the cluster value. However, this remains an upper limit because we have only considered one population, namely massive late-type galaxies, in our interloper model. As discussed in Jones et al. (2018), it is likely that our estimated number density of UDGs constitutes a negligible (of order one-percent) change to the galaxy stellar mass function in the dwarf galaxy regime.
We also compared our observations with the sample of UDGs detected in HI by Leisman et al. (2017). We found a reasonable qualitative agreement with the colour distribution of UDGs from their sample, indicating that the HI-rich UDGs have similar properties to the overall field UDG population. Jones et al. (2018) reported a number density of HI-rich UDGs of 1.50.6cMpc-3, approximately one-fifth of our upper-limit measurement of the overall UDG field population.
Finally, we compared our results to the semi-analytic models (SAMs) of Rong et al. (2017) and Jones et al. (2018), finding a qualitative agreement in colour. However, we found that the SAM used by Jones et al. (2018) over-predicts the number of field UDGs compared to our observations by a factor of 2.
To summarise, this study suggests that UDGs in the field are systematically bluer than those in denser environments and likely harbour younger stellar populations, with some showing clear signs of active star formation. This is observational evidence that environmental effects play an important role in quenching star formation in such galaxies. The upper-limit mass formation efficiency we have estimated is not sufficient to rule out the idea that secular formation channels are responsible for producing a high fraction of UDGs.
References
- (1)
- Aihara et al. (2018) Aihara H. et al. 2018, Publications of the Astronomical Society of Japan, 70, S8
- Alabi et al. (2018) Alabi A. et al. 2018, MNRAS, 479, 3308-3318
- Amorisco & Loeb (2016) Amorisco N. C., Loeb A. 2016, MNRAS, 459, L51-L55
- Baldry et al. (2012) Baldry I. K. et al. 2012, MNRAS, 421, 621-634
- Carleton et al. (2018) Carleton T., Errani R., Cooper M., Kaplinghat M., Peñarrubia J. 2018, arXiv eprints, arXiv:1805.06896
- Collins et al. (2013) Collins M. L. M. et al. 2013, The Astrophysical Journal, 768, 172
- Di Cintio et al. (2017) Di Cintio A., Brook C. B., Dutton A. A., Macciò A. V., Obreja A., Dekel A. 2017, MNRAS, 466, L1-L6
- Driver et al. (2011) Driver S. P. et al. 2011, MNRAS, 413, 971-995
- Greco et al. (2018) Greco J. P. et al. 2018, The Astrophysical Journal, 857, 104
- Greco et al. (2018b) Greco J. P., Goulding A. D., Greene J. E., Strauss M. A., Huang S., Kim Ji H., Komiyama Y. 2018, The Astrophysical Journal, 866, 112
- Jiang et al. (2018) Jiang F., Dekel A., Freundlich J., Romanowsky A. J., Dutton A., Maccio A., Di Cintio A. 2018, arXiv eprints, arXiv:1811.10607
- Jones et al. (2018) Jones M. G. et al. 2018, Astronomy and Astrophysics, 614, A21
- Koda et al. (2015) Koda J., Yagi M., Yamanoi H., Komiyama Y. 2015, The Astrophysical Journal Letters, 807, L2
- Kuijken et al. (2019) Kuijken K. et al. 2019, Astronomy and Astrophysics, 625, A2
- Leisman et al. (2017) Leisman L. et al. 2017, The Astrophysical Journal, 842, 133
- McFarland et al. (2011) McFarland J. P., Verdoes-Kleijn G., Sikkema G., Helmich E. M., Boxhoorn D. R., Valentijn E. A. 2011, arXiv eprints, arXiv:1110.2509
- Muzzin et al. (2013) Muzzin A. et al. 2013, The Astrophysical Journal, 777, 18
- Peng et al. (2002) Peng C. Y., Ho L. C., Impey C. D., Rix H.-W. 2002, The Astronomical Journal, 124, 266-293
- Mancera et al. (2018) Mancera P. P. E., Peletier R. F., Aguerri J. A. L., Venhola A., Trager S., Choque C. N. 2018, MNRAS, 481, 4381-4388
- Prole et al. (2019) Prole D. J., van der Burg R. F. J., Hilker M., Davies J. I. 2019, MNRAS, 488, 2143-2157
- Román & Trujillo (2017) Román J., Trujillo I. 2017, MNRAS, 468, 4039-4047
- Rong et al. (2017) Rong Y. et al. 2017, MNRAS, 470, 4231-4240
- Singh et al. (2019) Singh P. R., Zaritsky D., Donnerstein R., Spekkens K. 2019, The Astronomical Journal, 157, 212
- Taylor et al. (2011) Taylor E. N. et al. 2011, MNRAS, 418, 1587-1620
- Teeninga et al. (2016) Teeninga P., Moschini U., Trager S. C., Wilkinson M. H. 2016International Symposium on Mathematical Morphology and Its Applications to Signal and Image Processing 157–168
- Venhola et al. (2018) Venhola A. et al. 2018, Astronomy and Astrophysics, 620, A165
- Vulcani et al. (2014) Vulcani B. et al. 2014, MNRAS, 441, 1340-1362
- Yozin & Bekki (2015) Yozin C., Bekki K. 2015, MNRAS, 452, 937-943
- Zaritsky et al. (2019) Zaritsky D. et al. 2019, The Astrophysical Journal Supplement Series, 240, 1
- de Jong et al. (2013) de Jong J. T. A., Verdoes K. G. A., Kuijken K. H., Valentijn E. A. 2013, Experimental Astronomy, 35, 25-44
- van der Burg et al. (2016) van der Burg R. F. J., Muzzin A., Hoekstra H. 2016, Astronomy and Astrophysics, 590, A20
- van der Burg et al. (2017) van der Burg R. F. J. et al. 2017, Astronomy and Astrophysics, 607, A79
- van der Wel et al. (2014) van der Wel A. et al. 2014, The Astrophysical Journal, 788, 28
A. Di CintioDo your models follow the main UDG relations ? \discussD. ProleYes, our empirical model relies on scaling relations found for UDGs and dwarf galaxies in clusters. Testing these assumptions will be a key objective of future work, for example, constraining the intrinsic size distribution of UDGs in the field.
R. TaylorWhat is the field number density of these UDGs as compared with the ones in clusters, and UDGs vs the normal population ? \discussD. ProleWe find a roughly equivalent mass formation efficiency with those in clusters, although this is an upper limit. Since most of the mass in the Universe is not in clusters, it may be that most UDGs in the Universe are isolated. Looking at the stellar mass function for dwarf galaxies and comparing with our estimated number density, field UDGs probably comprise of order 1% of the dwarf galaxy population.
P.A. DucCould the problem of not having proper distances for UDGs bias the estimate of their number densities ? \discussD. ProleOur empirical model only accounts for massive late-type galaxy interlopers, so it is possible that other types of galaxies like small and nearby dwarf galaxies and perhaps intermediate-mass early-types also make it into our sample. That is why our quoted number density is an upper-limit estimate only. However, our modelling suggests that other types of interloping galaxy are in the minority compared to massive late-types.