Origin of Ising magnetism in Ca3Co2O6 unveiled by orbital imaging
Abstract
The one-dimensional cobaltate Ca3Co2O6 is an intriguing material having an unconventional magnetic structure, displaying quantum tunneling phenomena in its magnetization. Using a newly developed experimental method, -core-level non-resonant inelastic x-ray scattering (-NIXS), we were able to image the atomic Co orbital that is responsible for the Ising magnetism in this system. We show that we can directly observe that it is the complex orbital occupied by the sixth electron at the high-spin Co () sites that generates this behavior. This is extremely rare in the research field of transition metal compounds, and is only made possible by the delicately balanced prismatic trigonal coordination. The ability to directly relate the orbital occupation with the local crystal structure is essential to model the magnetic properties of this system.
Introduction
Since its crystal structure was fully determined in 19961, Ca3Co2O6 has garnered a large degree of attention due to its special atomic arrangements and peculiar magnetic properties. The discovery of stair-step jumps in the magnetization at regular intervals with an increasing applied field strength 2; 3; 4; 5 is indicative of the presence of quantum tunneling phenomena 6. This has triggered a flurry of theoretical and experimental research activities on Ca3Co2O6 7; 8; 9; 10; 11; 12; 13; 6 and its close derivatives 14; 15; 16; 17.
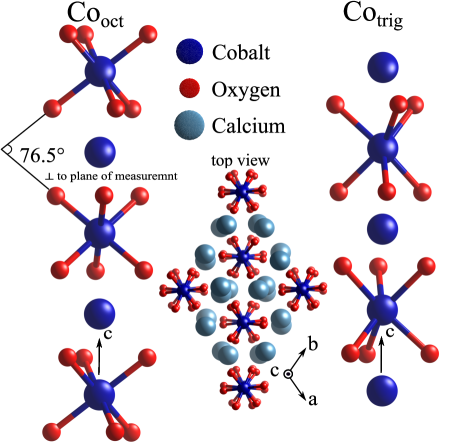
One-dimensional chains are formed in Ca3Co2O6 along the -axis with alternating CoO6 octahedra and trigonal prisms. In the -plane, the chains form a triangular type lattice1 (see Fig. 1). The intra-chain Co–Co coupling is ferromagnetic, while the inter-chain coupling is antiferromagnetic 2. The unusual magnetic properties, along with its Ising-like character4; 18; 6, are linked to the geometrically frustrated crystal lattice.
However, the origin or character of the presumed Ising magnetism is the subject of much discussion. To resolve this, one actually has to also simultaneously address the issue of the charge states of each of the two Co sites, as well as their spin-states 7; 19; 20; 21; 22; 8; 23. All of the previous studies relied on calculations of one type or another, with varying and conflicting outcomes, depending on what theoretical approach was used.
Herein, we make use of core level non-resonant inelastic scattering (NIXS) to determine the orbital occupation of the cobalt ions. As has recently been shown, the angular dependence of the NIXS integrated intensity of the transition can directly map out the shape of the local orbital hole density of an ion in its ground state, without the need to do any calculational modelling of the spectral line shapes24. Applying this novel technique to our system, we are able to identify the Co orbital that is at the core of the Ising behavior. Moreover, from the experimentally determined orbital occupations we are able to unequivocally establish both the charge and spin state of each of the two types of Co ions in the crystal.
Results
Our experimental setup is illustrated in Ref. 24 and a general description of the inelastic x-ray scattering method is given in Ref. 25. Incoming x-rays ( 10keV) were scattered by the Ca3Co2O6 single crystal with momentum transfer and energy transfer , where and denote the momentum and energy of the incoming and scattered photons, respectively (see Methods). We recorded the scattered beam as a function of the sample angle , here defined as the angle between the fixed momentum transfer vector and the -axis of the crystal.
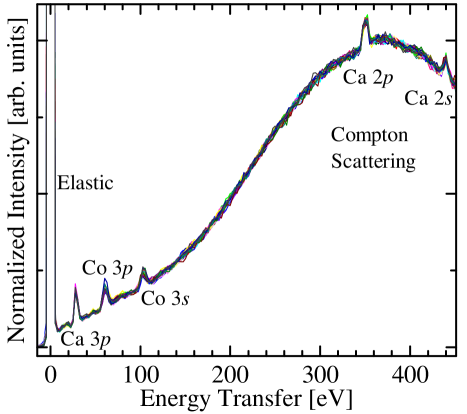
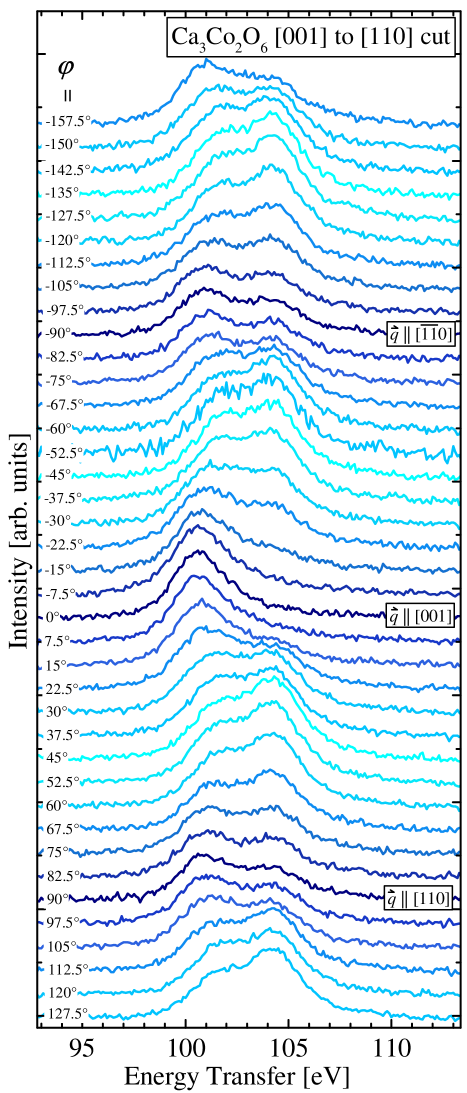
A collection of NIXS spectra measured at various sample angles is displayed in Fig. 2, all of which have been normalized to have the same maximum intensity at 370 eV. The spectra show the edges ( ) of calcium at 30 eV and cobalt at 60 eV and, most importantly, the dipole-forbidden ( ) excitations of cobalt at around 100 eV, all overlaid on a broad Compton scattering profile—caused by the inelastic scattering of photons off the electron density of the material. A close-up of the cobalt edge and its angular dependence on is displayed in Fig. 3. Each spectrum was measured at a different sample angle in the crystallographic [001] to [110] plane, with a 7.5∘ increment between successive spectra. We have labeled , , and for measurements in which the momentum transfer vector was parallel to a high symmetry direction of the crystal. Note that the Compton profile in the narrow region has been subtracted using a linear background (see Methods).
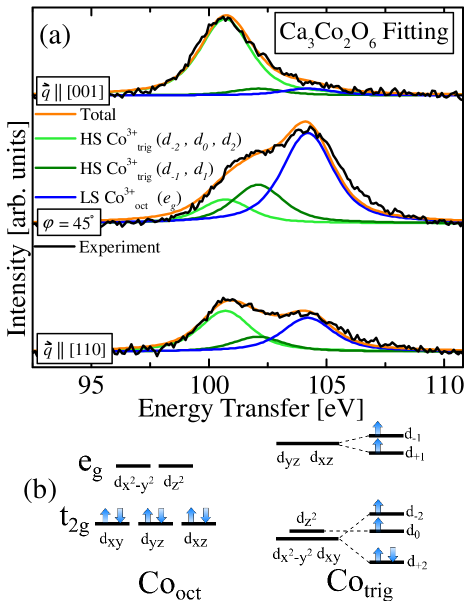
The spectra in Fig. 3 taken at different sample angles in the [001] to [110] plane are composed of several peaks. We show a selection of these spectra in Fig. 4(a) to demonstrate that we can discern three peaks, one at 100.7 eV, one at 104.2 eV, and one in-between at 102.1 eV. Once given our final results, one will see that there is good a posteriori justification for the presence of these three peaks, and the electron configurations in Fig. 4(b).
To quantitatively analyze the spectra of Fig. 3, we decomposed each spectrum into a linear combination of these three peaks, for which we are interested in their individual intensities. As illustrated in Fig. 4(a), we carried out a fitting procedure in which the peaks were fit with Voigt functions to model the 1.4 eV FWHM Gaussian experimental energy resolution, and the lifetime broadening, for which a 1.8 eV FWHM Lorentzian provides the optimal fit. When implementing the fitting procedure across the array of spectra of Fig. 3, the Gaussian and Lorentzian widths of the Voigt functions were fixed, as well as the peaks’ central energy positions throughout; only the intensities were free to vary to obtain the best fit to the experimental spectra.
To properly appreciate the intensity variations in the spectra one must map them to a polar plot. This is shown in Fig. 5, which displays the results from the angular scans in the [001] to [110] plane. The integrated intensity of the fitted peaks are plotted as a function of the measurement angle . The blue dots in Fig. 5(a) show the angular dependence of the intensity of the 104.2 eV peak, while the green dots in Fig. 5(b) show that of the summed intensities of the 100.7 eV and 102.1 eV peaks.
To interpret the four-lobe shape of the 104.2 eV polar plot (Fig. 5(a)), we start with the ansatz that the Co ion is 3+ and low-spin (LS), i.e. with a configuration. This implies that all four holes of this ion will be in the shell, as depicted in Fig. 4(b). To explain the asymmetries in the four-lobe shape, it is necessary to consider some of the more subtle details of the crystal structure. There are three details regarding the local coordination of Co sites that concern us: (1) along the Co–Co chains there are alternating Co sites that are rotated 45 degrees about the -axis from one another; (2) the axes along which the lobes lay for the two sites are oriented 13.5 degrees off right angles from one another. Both of these are apparent in Fig. 1. Lastly, (3) it is also necessary to consider the effect of the crystal field, which deviates slightly from that of nominal symmetry because the bond angles of the octahedral sites are 3 degrees off from the nominal 90 degrees.
What follows, is that due to (1), the experimental cut is a sum of a slice through the large lobes of one site, plus the large lobes of the other site. These two octahedral sites, along with the plane of the cut taken in the experiment are illustrated by the two lower 3D blue-yellow shapes in Fig. 5, which show identical planes, with only the sites rotated 45 degrees from one another as in the real crystal. In regards to (2), this means that the sum of the two sites is not done at right angles to one another, but at 76.5 degrees. This is evident in the polar plot of Fig. 5(a), which shows the contributions from both sites as solid blue lines of different shades. Finally, (3) has the more subtle effect of slightly altering the relative lobe intensities. Taking into account all these details of the crystal structure, the theoretically expected curve was calculated, and is shown as a black solid line in Fig. 5(a)—which is a sum of the two blue curves. The near perfect agreement between the experimental data points and the calculated curve establishes that the ansatz is correct, i.e. that the Co ions are 3+ and LS, which suggests that the magnetism must originate from the trigonal site.
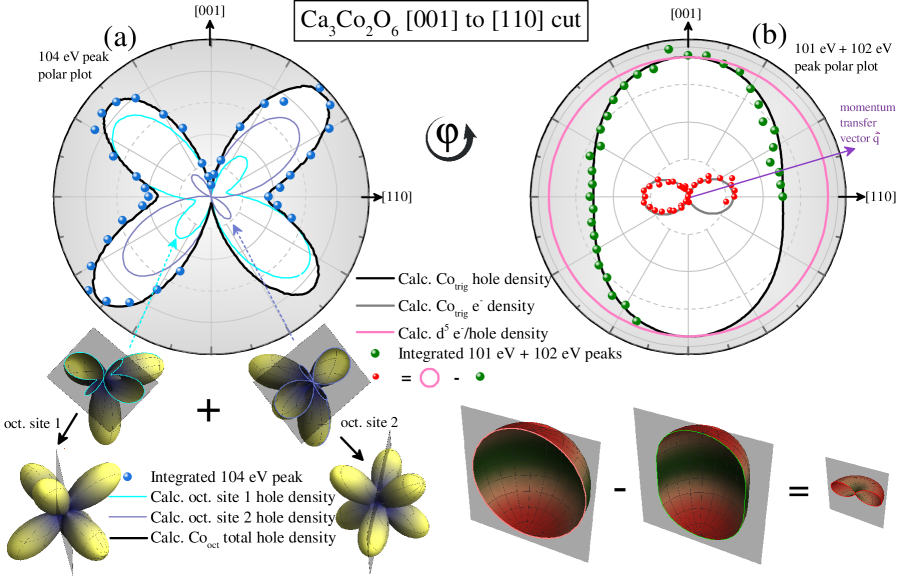
We now focus our attention on the remaining intensity not yet accounted for, that is, the 100.7 eV and 102.1 eV peaks of Fig. 4, which must result from excitations at the Co site. Given that the Co is 3+, charge balance requires that the Co ions must also be 3+. The total integral of the 100.7 eV and 102.1 eV peaks leads to the conclusion that the hole density of the Co ion has an oval shape, as shown by the green dots in Figure 5(b). To understand the meaning of this shape, consider first a high-spin (HS) ion. Its hole density will be spherical since it is a half-filled shell system, where each of the five -orbitals contains one electron. To represent this situation in the [001] to [110] plane of our experiment, we have added a pink circle to Figure 5(b). The difference between the circle (reference ) and the oval (measured ) then reflects the orbital that is occupied by the extra electron that the ion has in comparison to the situation. This experimentally deduced shape is plotted with red dots in Figure 5(b), and physically represents the orbital shape occupied by the sixth electron.
Only now are we in a position to recognize that this is a cut through the [001] to [110] plane of the donut-like orbital, where the notation refers to the complex spherical harmonics . The expected shape of the cross-sectional cut through the orbital is shown as a grey solid line, which agrees very well with our experimental data points. To assist in visualizing the experimental cut through the total electron/hole density, we have plotted the 3D theoretical shapes (green-red shapes) of the corresponding cuts taken in the experiment (Fig. 5). This allows one to compare the cut in the 3D electron/hole density to the 2D data obtained in the experiment, where the highlighted outlines of the cross-sectional cuts of the 3D shapes in Fig. 5 are the expected experimental curves.
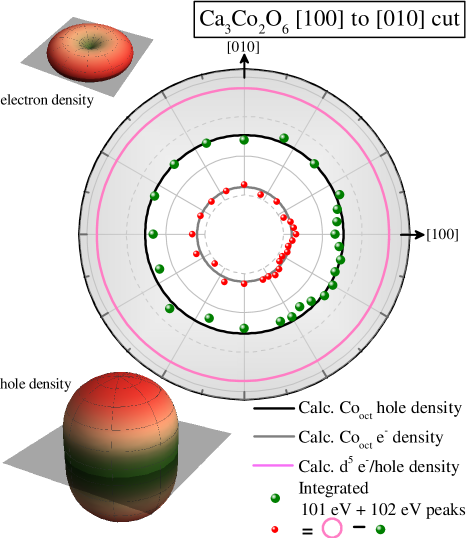
To corroborate this description, and to verify that it is indeed the orbital that is occupied by the sixth electron, we have also obtained experimental spectra in the [100] to [010] plane (perpendicular to the Co–Co chains). Shown in Fig. 6, we can see that the expected cross-sectional cut through the orbital is a horizontal cut through the donut-like shape, which is circular. Our experimental data points (green dots) obtained from integrating and summing 100.7 eV eV peaks of this separate data set are adequately in agreement with the calculated hole density (black). As was previously described, the electron density was obtained by subtracting the hole density from a reference spherical hole density (pink). Again, the experimental red dots agree well with the calculated grey circular shape in Fig. 6. Note that Figs. 5(b) and 6 are different projections of the same hole density shape, as such, the radial scales have be plotted to be identical, and can be quantitatively compared.
We would like to note that by using the HS sphere as reference, one may infer that we have effectively assumed that the configuration of the Co is in the HS state. However, such an assumption is justifiable since the total effective magnetic moment ( /f.u. 6), and also the saturation magnetic moment ( /f.u. 6) are larger than what an intermediate-spin or let alone a low-spin configuration could produce, taking into account that we just have firmly established that the other Co site, namely Co, is non-magnetic LS . But it can also be simply validated on the grounds that any ansatz different than a HS configuration does not lead to a solution that reproduces the experimentally observed shape of the hole density.
Our finding that the orbital is occupied by the minority electron of the HS Co naturally explains the Ising character of the material, since this orbital carries a large orbital moment of 2 , and consequently generates a huge magneto-crystalline anisotropy, thereby determining the easy magnetization axis, and freezing it in the -direction, i.e. along the Co–Co chain. Evidently, it is the orbital that is stabilized as the lowest energy orbital by the crystal field that arises due to the trigonal prismatic coordination.
A closer look reveals that this is in fact not trivial. Past crystal field analyses based on band structure calculations show that the , , and orbitals are close in energy, but are well separated from the , and orbitals, as shown in Fig. 4(b)7; 19; 20; 21; 22; 8. Therefore, it could have been for example the orbital that is occupied by the sixth electron, since its energy is very close to the orbital. The fact that small changes in energies leads to vastly different conclusions, perhaps at least partially explains why different types of past theoretical approaches have led to different explanations for the magnetism in Ca3Co2O67; 19; 20; 21; 22; 8. Our finding that it is the orbital is also special since it is extremely rare in the field of transition metal compounds that such an orbital is stabilized. It is therefore important that we now have an experiment by which we can image directly the occupied orbital without the need for calculations.
We are now able to retrospectively justify the identification and use of the three peaks in our experimental spectra required for producing the polar plots. First, we conclusively showed that the Co sites are in a 3+ LS state, where the six-fold degenerate shell is completely filled, and the four-fold degenerate shell is completely empty (Fig. 4). Thus, the only possible excitation from the core shell to the valence shell is to these empty orbitals. This is the reason why the excitations seen in the spectra that correspond to the Co site were fit with only one peak. For the Co site, we demonstrated that it is HS with the sixth and minority electron occupying the orbital. Therefore, the to excited electron can reach either one of the minority orbitals in the subgroup, or the subgroup. Our best results were found via the fitting procedure when the splitting (in the presence of the core hole) between these two subgroups was 1.4 eV. The energy separation between the peaks of the Co and Co ions reflects the chemical shift between these two sites, again, in the presence of the core hole. Thus the existence of these peaks is retrospectively substantiated as they confirm the original hypothesis.
Conclusion
Utilizing the substantial intensity of the dipole forbidden transitions available with s-NIXS, we are able to, in a straightforward fashion, observe the electron orbitals that are active in Ca3Co2O6. Knowledge of these orbitals is necessary for theoretical models to more reliably calculate the various inter-site exchange interactions, and in turn to quantitatively model the magnetic structure, including the intriguing magnetization tunneling phenomena. This should also help in explaining the large and positive Seebeck coefficient reported for Ca3Co2O6 single crystals 26 as minority holes should dominate the electronic transport properties according to the schematic orbital diagram. Hence, the ability to experimentally observe the relevant electron orbitals without deviation to theoretical modeling is a powerful diagnosis tool for the design of novel materials. This is especially true in situations where one would like to make use of the delicate balance of competing interactions to stabilize a particular orbital state for a desired or optimized physical property. In particular, considering the large list of compounds crystallizing in structures derived from the 2H-perovskites 27, the present study should help in selecting the best candidates for quantum tunneling of the magnetization. Future investigations of this nature should open new avenues for the design of novel materials with unusual or optimized properties.
Data availability:
The data that support the findings of this study are available from the corresponding authors upon request.
References
- (1) Fjellvag, H., Gulbrandsen, E., Aasland, S., Olsen, A. & Hauback, B. C. Crystal structure and possible charge ordering in one-dimensional Ca3Co2O6. J. Solid State Chem. 124, 190 – 194 (1996). URL https://www.sciencedirect.com/science/article/pii/S0022459696902248.
- (2) Aasland, S., Fjellvag, H. & Hauback, B. Magnetic properties of the one-dimensional Ca3Co2O6. Solid State Commun. 101, 187 – 192 (1997). URL http://www.sciencedirect.com/science/article/pii/S0038109896005315.
- (3) Kageyama, H. et al. Magnetic anisotropy of Ca3Co2O6 with ferromagnetic Ising chains. J. Phys. Soc. Jpn 66, 3996–4000 (1997). URL https://journals.jps.jp/doi/10.1143/JPSJ.66.3996.
- (4) Maignan, A., Michel, C., Masset, A., Martin, C. & Raveau, B. Single crystal study of the one dimensional Ca Co O compound: five stable configurations for the ising triangular lattice. Eur. Phys. J. B 15, 657–663 (2000). URL https://link.springer.com/article/10.1007%2FPL00011051.
- (5) Hardy, V. et al. Temperature and time dependence of the field-driven magnetization steps in Ca3Co2O6 single crystals. Phys. Rev. B 70, 064424 (2004). URL https://link.aps.org/doi/10.1103/PhysRevB.70.064424.
- (6) Maignan, A. et al. Quantum tunneling of the magnetization in the Ising chain compound Ca3C02O6. J. Mat. Chem. 14, 1231–1234 (2004). URL https://pubs.rsc.org/en/Content/ArticleLanding/2004/JM/B316717H.
- (7) Vidya, R., Ravindran, P., Fjellvag, H., Kjekshus, A. & Eriksson, O. Tailor-made electronic and magnetic properties in one-dimensional pure and y-substituted Ca3Co2O6. Phys. Rev. Lett. 91, 186404 (2003). URL https://link.aps.org/doi/10.1103/PhysRevLett.91.186404.
- (8) Wu, H., Haverkort, M. W., Hu, Z., Khomskii, D. I. & Tjeng, L. H. Nature of magnetism in Ca3Co2O6. Phys. Rev. Lett. 95, 186401 (2005). URL https://link.aps.org/doi/10.1103/PhysRevLett.95.186401.
- (9) Kudasov, Y. B. Steplike magnetization in a spin-chain system: Ca3Co2O6. Phys. Rev. Lett. 96, 027212 (2006). URL https://link.aps.org/doi/10.1103/PhysRevLett.96.027212.
- (10) Agrestini, S., Mazzoli, C., Bombardi, A. & Lees, M. R. Incommensurate magnetic ground state revealed by resonant x-ray scattering in the frustrated spin system Ca3Co2O6. Phys. Rev. B 77, 140403 (2008). URL https://link.aps.org/doi/10.1103/PhysRevB.77.140403.
- (11) Agrestini, S. et al. Slow magnetic order-order transition in the spin chain antiferromagnet Ca3Co2O6. Phys. Rev. Lett. 106, 197204 (2011). URL https://link.aps.org/doi/10.1103/PhysRevLett.106.197204.
- (12) Kamiya, Y. & Batista, C. D. Formation of magnetic microphases in Ca3Co2O6. Phys. Rev. Lett. 109, 067204 (2012). URL https://link.aps.org/doi/10.1103/PhysRevLett.109.067204.
- (13) Kozlenko, D. P. et al. Pressure-induced modifications of the magnetic order in the spin-chain compound Ca3Ca2O6. Phys. Rev. B 98, 134435 (2018). URL https://link.aps.org/doi/10.1103/PhysRevB.98.134435.
- (14) Niitaka, S., Yoshimura, K., Kosuge, K., Nishi, M. & Kakurai, K. Partially disordered antiferromagnetic phase in Ca3CoRhO6. Phys. Rev. Lett. 87, 177202 (2001). URL https://link.aps.org/doi/10.1103/PhysRevLett.87.177202.
- (15) Sugiyama, J. et al. Evidence of two dimensionality in quasi-one-dimensional cobalt oxides. Phys. Rev. Lett. 96, 197206 (2006). URL https://link.aps.org/doi/10.1103/PhysRevLett.96.197206.
- (16) Choi, Y. J. et al. Ferroelectricity in an Ising chain magnet. Phys. Rev. Lett. 100, 047601 (2008). URL https://link.aps.org/doi/10.1103/PhysRevLett.100.047601.
- (17) Wu, H. et al. Ising magnetism and ferroelectricity in Ca3CoMnO6. Phys. Rev. Lett. 102, 026404 (2009). URL https://link.aps.org/doi/10.1103/PhysRevLett.102.026404.
- (18) Hardy, V., Lambert, S., Lees, M. R. & McK. Paul, D. Specific heat and magnetization study on single crystals of the frustrated quasi-one-dimensional oxide Ca3Co2O6. Phys. Rev. B 68, 014424 (2003). URL https://link.aps.org/doi/10.1103/PhysRevB.68.014424.
- (19) Whangbo, M.-H., Dai, D., Koo, H.-J. & Jobic, S. Investigations of the oxidation states and spin distributions in Ca3Co2O6 and Ca3CoRhO6 by spin-polarized electronic band structure calculations. Solid State Commun. 125, 413–417 (2003). URL http://www.sciencedirect.com/science/article/pii/S0038109802008724.
- (20) Eyert, V., Laschinger, C., Kopp, T. & Fresard, R. Extended moment formation and magnetic ordering in the trigonal chain compound Ca3Co2O6. Chem. Phys. Lett. 385, 249–254 (2004). URL http://www.sciencedirect.com/science/article/pii/S0009261403022383.
- (21) Sampathkumaran, E., Hiroi, Z., Rayaprol, S. & Uwatoko, Y. Heat-capacity anomalies in the presence of high magnetic fields in the spin-chain compound, Ca3Co2O6. J. Magn. Magn. Mater. 284, L7–L11 (2004). URL http://www.sciencedirect.com/science/article/pii/S0304885304007413.
- (22) Takubo, K. et al. Electronic structure of Ca3Co2O6 (X=Co, Rh, Ir) studied by x-ray photoemission spectroscopy. Phys. Rev. B 71, 073406 (2005). URL https://link.aps.org/doi/10.1103/PhysRevB.71.073406.
- (23) Burnus, T. et al. Valence, spin, and orbital state of Co ions in one-dimensional Ca3Co2O6: An x-ray absorption and magnetic circular dichroism study. Phys. Rev. B 74, 245111 (2006). URL https://link.aps.org/doi/10.1103/PhysRevB.74.245111.
- (24) Yavaş, H. et al. Direct imaging of orbitals in quantum materials. Nat. Phys. 15, 559–562 (2019). URL https://www.nature.com/articles/s41567-019-0471-2.
- (25) Sahle, C. J. et al. Planning, performing and analyzing X-ray Raman scattering experiments. J. Synchrotron Rad. 22, 400–409 (2015). URL https://doi.org/10.1107/S1600577514027581.
- (26) Mikami, M., Funahashi, R., Yoshimura, M., Mori, Y. & Sasaki, T. High-temperature thermoelectric properties of single-crystal Ca3Co2O6. J. Appl. Phys. 94, 6579–6582 (2003). URL https://doi.org/10.1063/1.1622115.
- (27) zur Loye, H.-C., Zhao, Q., Bugaris, D. E. & Chance, W. M. 2H-perovskite related oxides: Synthesis, structures, and predictions. CrystEngComm 14, 23–39 (2012). URL http://dx.doi.org/10.1039/C1CE05788J.
Acknowledgments
B. L. acknowledges support from the Max Planck - University of British Columbia Center for Quantum Materials, and M. S., A. A., and A. S. from the German funding agency DFG under Grant No SE1441-4-1. Parts of this research were carried out at PETRA III at DESY, a member of the Helmholtz Association (HGF). We thank C. Becker, K. Höfer, and T. Mende from MPI-CPfS, and F.-U. Dill, S. Mayer, and H. C. Wille, from PETRA III at DESY for their skillful technical support.
Competing Interests
The authors declare that they have no competing financial interests.
Author Contributions
L.H.T., A.M., and M.W.H. initiated the project, B.L., M.S., A.A. and H.G. performed the experiment,
B.L. and L.H.T. analyzed the data, L.Z., A.C.K., and A.M. synthesized the samples, B.L., A.S., A.M., and L.H.T. wrote the
manuscript with input from all authors.
Materials and Methods
Experiment: Non-resonant inelastic x-ray scattering (NIXS) measurements were performed at the High-Resolution Dynamics Beamline P01 of the PETRA-III synchrotron in Hamburg, Germany. Figures in Refs. 24 and Ref. 25 illustrate the experimental setup. They show the incoming beam
(), sample, scattered beam (), and the corresponding momentum transfer vector (). The energy of the x-ray photon beam incident on the sample was tuned with a Si(111) double-reflection crystal monochromator. The photons scattered from the sample were collected and energy-analyzed by an array of twelve spherically bent Si(660) crystal analyzers. The analyzers are arranged in a 34 configuration. The energy filtering of the analyzers () was fixed at 9.69 keV; the energy loss NIXS spectra were measured by scanning the energy of the monochromator (). Each analyzer signal was individually recorded by a position sensitive custom made LAMBDA detector. The energy calibration and resolution was ensured by pixel-wise aligning the zero energy loss feature at each measurement angle from the twelve analyzers and summing the total signal; the resolution throughout the experiment was measured to be 1.4 eV (FWHM).
The positioning of the analyzer array determines the momentum transfer vector and the corresponding scattering triangle, which is defined by the incident and scattered photon momentum vectors, i and f, respectively. The large scattering angle (2 155∘) and use of hard x-rays chosen for this study results in a large momentum transfer. For this experiment the magnitude of our momentum transfer vector was calculated to be (9.6 0.1) Å-1 when averaged over all analyzers. and 2 were kept constant by fixing the energy and the position of the analyzer array. Since the energy transfer range of interest (90 to 115 eV) is small with respect to the incident energy (9.8 keV), variation of during energy scanning is insignificant. This guarantees that the scattering triangle was maintained throughout the course of the experiment and that constant.
Sample:
The single crystal Ca3Co2O6 sample was grown using the starting materials CaCO3 and Co3O4, which had a molar ratio of 4:; these were then mixed with K2CO3 in a weight ratio of 1:7. The well mixed powders were then put in an aluminum crucible and heated in air to 920∘C for 9 hours, and then left to dwell at this temperature for 24 hours. Lastly, they were slowly cooled to 850∘C at a rate of 1 K/hr, then to 800∘C at a rate of 3 K/hr, and finally back to room temperature in 8 more hours. Under these conditions needle shaped crystals of several millimeters length were obtained, where the crystallographic -axis lies along the length of the needle shaped sample. The orientation of the crystallographic directions was ensured to within using a Laue diffractometer.
Data Treatment:
It is essential to the experiment that the normalization of the spectra is handled with care. A key observation is that the line shape of the Compton profile does not change with angle, as can been from Fig. 2. This is fully consistent with the fact that the scattering geometry is kept constant while rotating the sample. On the other hand, what does vary is the experimental intensity of the Compton scattering, as this is dependent on the paths the x-rays take when entering and when scattered out of the sample. That is, the incidence angle of the x-rays relative to the sample surface varies as the sample is rotated, and therefore also the interaction depth of the x-rays and the sample. However, because the theoretical Compton scattering intensity is only proportional to the total electron density in the sample—and not the scattering geometry relative to the sample surface—we should expect that this remains constant through the experiment. Therefore, the spectra in Fig. 2 were normalized such that the Compton peak at 370 eV energy transfer was of equal intensity; and the detailed spectra (Fig. 3) in the region of the Co edge were likewise individually normalized using the scaling factor obtained from the Comptom profile taken at the same sample angle .