Obscuration properties of mid-IR selected AGN
Abstract
The goal of this work is to study the obscuration properties of mid-infrared (mid-IR) selected AGN. For that purpose, we use WISE sources in the Stripe 82-XMM area to identify mid-IR AGN candidates, applying the Assef et al. criteria. Stripe 82 has optical photometry 2 times deeper than any single-epoch SDSS region. XMM-Newton observations cover 26 deg2. Applying the aforementioned criteria, 1946 IR AGN are selected. have SDSS detection, while 1/3 of them is detected in X-rays, at a flux limit of . Our final sample consists of 507 IR AGN with X-ray detection and optical spectra. Applying a colour criterion, we find that the fraction of optically red AGN drops from 43% for those sources with SDSS detection to for sources that also have X-ray detection. X-ray spectral fitting reveals 40 () X-ray absorbed AGN (). Among the X-ray unabsorbed AGN, there are 70 red systems. To further investigate the absorption of these sources, we construct Spectral Energy Distributions (SEDs) for the total IR AGN sample. SED fitting reveals that of the optically red sources have such colours because the galaxy emission is a primary component in the optical part of the SED, even though the AGN emission is not absorbed at these wavelengths. SED fitting also confirms that of the X-ray unabsorbed, IR AGN are optically obscured.
keywords:
Galaxies: active, Galaxies: evolution, Galaxies: nuclei, X-rays: galaxies1 Introduction
Mid-infrared (mid-IR) surveys have been proven extremely capable of detecting Active Galactic Nuclei (AGN), since they are affected less by extinction. The material that obscures AGN even at X-ray energies, is heated by the AGN and re-emits the nuclear radiation at infrared (IR) wavelengths. Thus, mid-IR surveys trace obscured sources missed even by hard X-ray surveys (e.g., Georgantopoulos et al., 2008; Fiore et al., 2009). Spitzer was the first IR mission used to demonstrate the efficiency of selecting AGN from a mid-IR dataset, by applying colour-selection techniques (e.g., Stern et al., 2005; Donley et al., 2012). These techniques have now been adapted and used for the Wise-field Infrared Survey Explorer (WISE; Wright et al., 2010).
WISE completed an all-sky coverage in four mid-IR bands 3.4, 4.6, 12 and 12 m (W1, W2, W3 and W4 bands, respectively). Several colour regions have been defined that efficiently identify AGN, in particular at high luminosities. For example, Mateos et al. (2012) suggested a selection method using three WISE colours. Stern et al. (2012) used the W1 and W2 bands and applied a simple criterion to reliably, select AGN with in the COSMOS field. Assef et al. (2013) extended the aforementioned criterion and provided a selection of AGN for fainter WISE sources.
Previous studies have shown that a fraction of these IR selected AGN are missed by X-rays. This is attributed to their heavy obscuration in the X-ray band. Del Moro et al. (2016) studied a sample of 33 mid-IR selected quasars with intrinsic luminosity erg s-1 at redshift . Despite their high IR luminosity, of the sources, i.e. nine quasars, are undetected in X-rays. Among the X-ray detected IR sources, 16 out of 24 () are heavily obscured (N cm-2). Mateos et al. (2017) used 199 X-ray selected AGN from the Bright Ultra-hard XMM-Newton Survey (BUXS) and found a substantial population of X-ray undetected sources with high-covering factor tori. They claim that the majority of luminous AGN live in highly obscured environments that remain undetected in X-rays at the depths of keV wide-area surveys. Mendez et al. (2013) found that the percentage of IR AGN that are also detected in X-rays, varies significantly (47% to 90%) depending on the depth of the X-ray and IR surveys (see their Fig. 8). Increasing the depth of the IR data reduces the fraction of X-ray detected sources, while increasing the depth of the X-ray data increases the fraction of X-ray detections.
Secrest et al. (2015) applied the Mateos et al. (2012) colour selection criteria on the WISE sample and created a sample of 1.4 million AGN candidates. Mountrichas et al. (2017) used this catalogue to explore the X-ray properties of mid-IR selected AGN. In this work they study only the most luminous of these sources (). Specifically, they cross-correlated the Secrest et al. (2015) catalogue with the subsample of the 3XMM X-ray dataset with available X-ray spectra (Corral et al., 2015) and optical spectroscopy from SDSS/BOSS (Alam et al., 2015). Due to the requirement for optical (SDSS) identifications, their sample is biased towards type-1 sources. Their analysis revealed seven obscured AGN in X-rays. However, none of them was absorbed based on their optical continuum.
LaMassa et al. (2019) studied the demographics of AGN in Stripe82X (LaMassa et al., 2013a, b). They compiled a catalogue of 4847 AGN, based on their X-ray luminosities or WISE colours. Stripe 82X has dedicated SDSS observations, therefore their sample does not suffer from the optical spectroscopic limitations of the Mountrichas et al. (2017) dataset. Their analysis showed that 61% of X-ray AGN are not selected as mid-IR AGN, while 22% of X-ray sources have no WISE detection. Moreover, 58% of WISE AGN are not detected in X-rays. However, based on the WW2 colour difference, sources undetected in X-rays do not appear to be redder than those detected in X-rays. Previous studies have shown, that although X-ray selection is able to identify even very inactive AGN, the X-ray emission is easily absorbed by gas. Especially, at the softer, KeV energies probed by the Chandra and XMM satellites. On the other hand, mid-IR selection is less susceptible to absorption, but only identifies high luminosity AGN, i.e., those systems that the AGN outshines the stellar emission from the galaxy (e.g., Barmby et al., 2006; Georgantopoulos et al., 2008; Eckart et al., 2010).
In this work, we use WISE sources in the Stripe 82X survey (LaMassa et al., 2015, 2019) and apply the colour criteria of Stern et al. (2012), modified by Assef et al. (2013) to select mid-IR AGN candidates. First, we derive the obscuration properties using the optical/mid-IR colours and Spectral Energy Distributions (SED). Second, we use only those sources with X-ray detection. Our goal is to study the X-ray properties of these mid-IR selected AGN, by fitting their X-ray spectra. We also compare the X-ray with the optical colour of these sources.
2 Data
2.1 Sample selection
Stripe 82 covers an area of 300 deg2 on the celestial equator and has been repeatedly scanned by the SDSS. In addition the field has been partially covered by observations at other wavelengths, e.g., UKIDSS (Lawrence et al., 2007) and Herschel (Viero et al., 2014). The Stripe 82X survey (LaMassa et al., 2013a, b, 2015) covers 31 deg2 on the sky and was designed to take advantage of the wealth of multi-wavelength information provided by Stripe 82. Its goal is to reveal high luminosity AGN at high redshifts.
Stripe 82X has both Chandra and XMM-Newton observations. In this work we study the X-ray spectral properties of IR selected AGN and compare them with their optical colours and SEDs. For that purpose we require 3XMM observations (Stripe 82-XMM). About half of the Stripe 82-XMM survey (15.6 deg2) is contiguous and reaches an keV flux limit of at half survey area. The median exposure time is ks, while the coadded depth in theoverlapping regions reaches ks (LaMassa et al., 2019). The remaining 10.6 deg2, comprise of 4.6 deg2 of proprietary XMM-Newton data, with exposure time of ks (12 ks in regions with greatest overlap) and 6 deg2 of archival data (LaMassa et al., 2013).
We use WISE sources in the Stripe 82-XMM area to select mid-IR AGN. We apply the criteria presented in Stern et al. (2012) combined with the modified selection criterion described in Assef et al. (2013), for fainter WISE sources. Specifically, the selection criteria we apply are:
For
| (1) |
and for
| (2) |
where W1, W2 are the WISE photometric bands, at 3.4 and 4.6m, W1snr is the S/N ratio of the W1 band and , to select AGN at a 90% reliability. We find 1946 IR AGN that lie within the 3XMM footprint. 1507 of these sources have optical (SDSS DR13; Albareti et al., 2017) counterpart and 824 have available optical spectrum. We cross-match these sources with the 499, 266 X-ray sources of the 3XMM-DR7 catalogue (Rosen et al., 2016). For the cross-match we use TOPCAT, version 4.6, using a radius of 3 arcsec. 0.2% spurious sources are expected among common sources between the two datasets (Mountrichas et al., 2017). The number of sources in each subsample is presented in Table LABEL:table_data. 1250 (1946-696), i.e., , of the IR selected AGN are undetected in X-rays. This percentage is in agreement with the found in LaMassa et al. (2019).
2.2 Sample properties
The scope of the paper is to study the X-ray absorption of IR selected AGN and compare it with optical/mid-IR criteria. Therefore, both X-ray and optical identification are needed for the sources. However, this requirement imposes selection biases in the AGN sample. In the following, we study the impact of these biases on our X-ray sample.
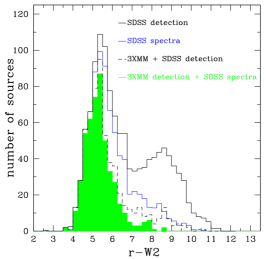
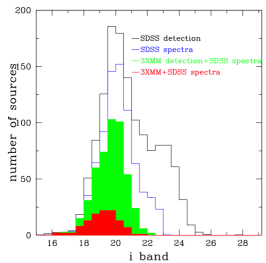
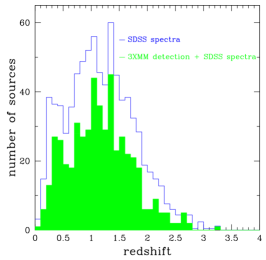
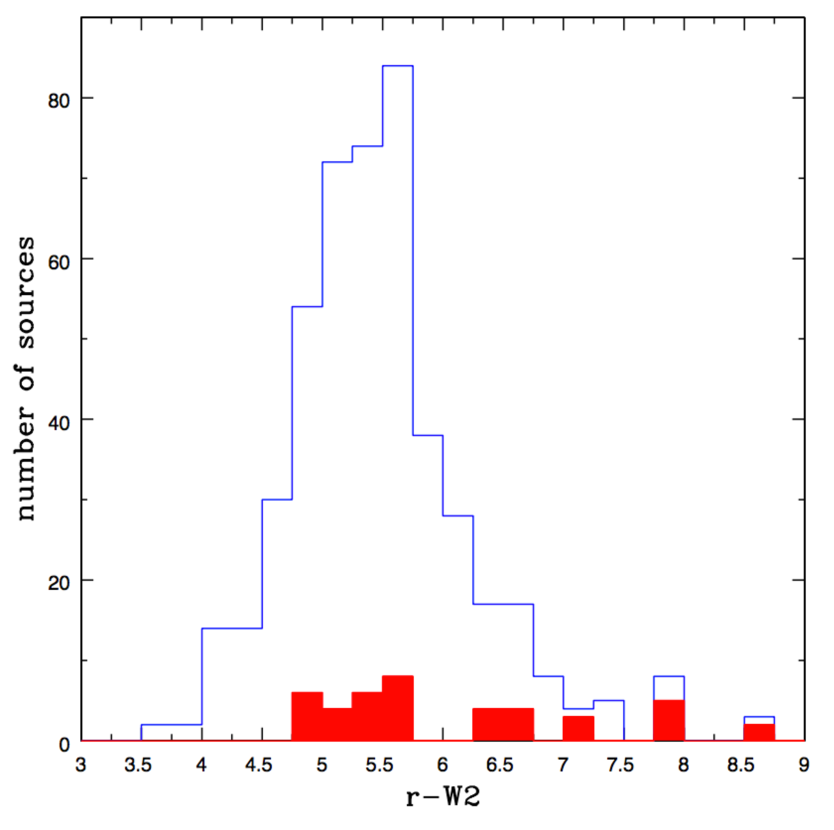
Previous studies have found a correlation between the optical colour and the X-ray obscuration (e.g., Civano et al., 2012). Yan et al. (2013) showed that type-2 AGN candidates at z, can be identified by applying the following colour criteria: WISE combined with (Vega). In Fig. 1 (left panel) we plot the distributions of the AGN samples. Sources with only SDSS detection, show a peak in their distribution at . However, a second peak is present at larger values (). When an SDSS spectrum requirement is applied, this second peak is not detected. However, we notice a wide tail at high r-W2 values. Our X-ray detected sources completely miss this optically, possibly obscured AGN population. These distributions are quantified in Table LABEL:table_yan, that presents the fraction of optically red sources in the various subsamples. Based on the distributions, we notice that cut seems more natural, since it separates two peaks. Given the prevalence of the cut in the literature, we keep the latter cut in our analysis. However, in Table LABEL:table_yan we also present the fraction of optically red sources, using the cut. Regardless of the exact value of the optical/mid-IR cut applied, the measurements confirm our aforementioned findings, i.e., IR selected AGN that are undetected by X-rays are probably preferentially redder than those detected in X-rays (but see Fig. 16 in LaMassa et al., 2019). Middle and right panels of Fig. 1, present the i-band and redshift distributions of the AGN samples. We notice that X-ray detected sources are brighter than i.
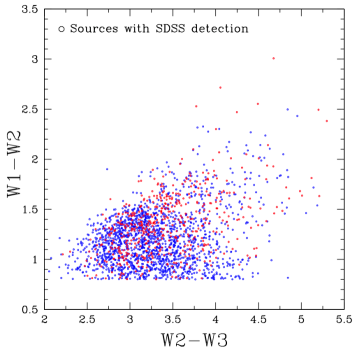
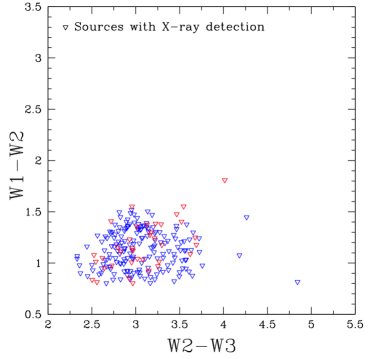
Mateos et al. (2012) used MIR WISE colours to select luminous AGN candidates. Using these AGN, they defined a highly complete, mid-IR colour wedge that their sources occupy. X-ray detected AGN reside in the lower part of this wedge (see their Figures 2 and 6). In Fig. 2 we plot W1-W2 versus W2-W3 colours, for those of our sources with . In agreement with Mateos et al. (2012), our X-ray detected AGN occupy the lower part of the mid-IR colour diagram. However, optically red sources (, red points in Fig. 2 ) seem to be randomly distributed in the colour diagram.
| Mid-IR selected AGN | 1946 |
| 3XMM detection | 696 |
| SDSS detection | 1507 |
| SDSS spectra | 824 |
| 3XMM and SDSS detection | 646 |
| 3XMM detection + SDSS spectra | 507 |
| sample | red sources | red sources |
|---|---|---|
| SDSS detection (1507) | 43% | 30% |
| SDSS spectra (824) | 31% | 13% |
| 3XMM+SDSS detection (646) | 23% | 9% |
| 3XMM detection + SDSS spectra (507) | 20% | 6% |
| sample | no. of sources | ||
|---|---|---|---|
| All sources | 507 | ||
| counts | 152 | ||
| counts | 250 | ||
| counts | 257 | ||
| counts | 40 |
3 X-ray and optical absorption of IR AGN
In this Section, we study the X-ray absorption of the 507 IR selected AGN with X-ray detection and optical spectra. We then compare the X-ray with the optical absorption (e.g., Glikman et al., 2018), using optical/mid-IR colours and SED fitting.
To study the X-ray properties of the IR selected AGN, we use Xspec v12.8 (Arnaud, 1996). Photoelectric absorption is included in all the spectral models (wabs, in XSPEC notation), fixed at the Galactic value at the source coordinates given by Leiden/Argentine/Bonn (LAB) Survey of the Galactic HI (Kalberla et al., 2005). A single power-law model absorbed by neutral material surrounding the central source is applied on the X-ray spectra. For that purpose, we used the fitting and modelling software Sherpa (version 4.9.1; Freeman et al., 2001). We followed the Bayesian technique proposed in Buchner et al. (2014), using the analysis software BXA (Bayesian X-ray Analysis), that connects the nested sampling algorithm MultiNest (Feroz et al., 2009) with Sherpa. A nested sampling algorithm allows a full exploitation of the parameter space, avoiding solutions that correspond to local minima which is a common problem with standard minimization techniques (e.g. the Levenberg-Marquardt algorithm). In the BXA framework, a probability prior is assigned to each free parameter of the model. For the power law, photon index, , we used a gaussian prior with mean value 1.9 and standard deviation 0.15 (Nandra & Pounds, 1994). For the remaining parameters, we used flat, uninformative priors. Our spectral fits, follow the same procedure to build the XMMFITCAT-z (see Ruiz et al., in prep., http://xraygroup.astro.noa.gr/Webpage-prodex/).
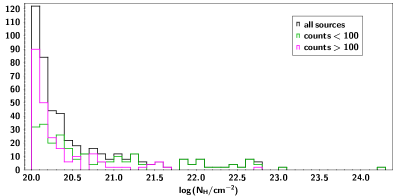
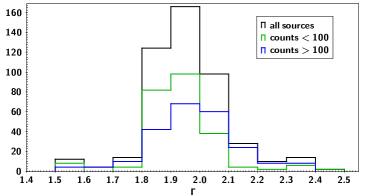
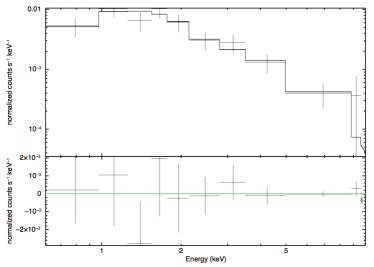
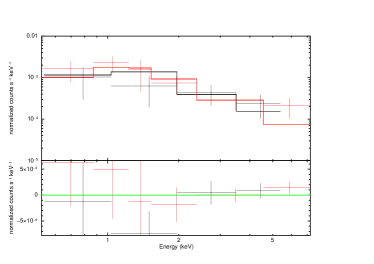
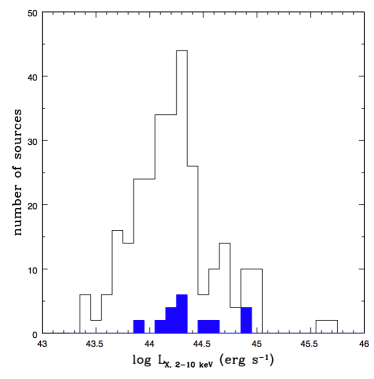
The mean NH and values of the sample are and . The quoted errors correspond to the mean values of the 1 uncertainties. We also split the sample into various subsamples, based on the number of source photons. The mean values of and are presented in Table LABEL:table_photons. Fig. 3 presents the distributions of NH (left panel) and (right panel) values. Our analysis reveals 40 sources () that have . This number increases to 65 () if we loosen our X-ray absorption criterion, i.e., . However, we note that our X-ray spectra extend to energies up to 10 keV. Modelling X-ray spectra at higher energies could possibly change the estimated values (Civano et al., 2015).
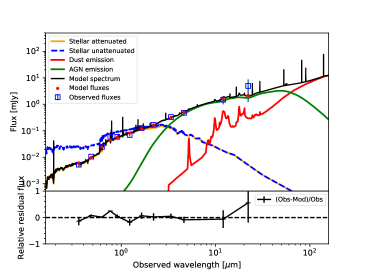
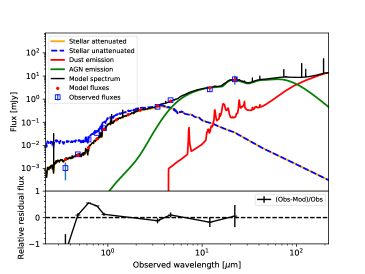
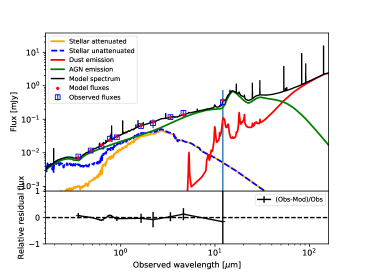
Optical/mid-IR colour criteria reveal that (45%) of the X-ray absorbed AGN are also optically red (). This percentage is higher compared to the fraction of red sources among the 507 sources (20%, see Table LABEL:table_yan). However, among the non X-ray absorbed sources (467), there are 70 (15%) optically red AGN (Fig. 4). Prompted by this, we construct SEDs for the sample of the 507 AGN and further examine their obscuration (for more details see Appendix). The SED fitting analysis reveals that 86% of the red objects are optically obscured, based on the estimated inclination angle of the torus. Thus, there is a very good agreement between the optical colours and the SEDs of the sources. All 18 IR AGN that are X-ray absorbed and optically red are also obscured based on their SEDs. An example of the X-ray spectrum and the SED of one of these sources is presented in Fig. 5. Among the 70 optically red AGN that are not X-ray absorbed, 58 (83%) are obscured, based on their SEDs (Fig. 6). The values and the X-ray spectral results of these sources are presented in Table 4. As can be seen in this Table, there are a few sources that present some X-ray obscuration, but do not meet our X-ray obscuration criterion, i.e., their value is . However, a large number of sources that have high number of counts (a few hundred up to a couple of thousand) present no indication of X-ray obscuration (). For, the remaining 12 sources (17%) the SEDs reveal the they are galaxy dominated systems, i.e., the galaxy emission is a primary component of the SED in the optical part of the spectrum, even though the AGN emission is not absorbed at these wavelengths (Fig. 7). The aforementioned numbers do not change if we lower our X-ray absorption criterion, i.e. . We conclude, the SED fitting analysis confirms that there is a fraction () of IR AGN that are red, obscured sources without presenting X-ray absorption.
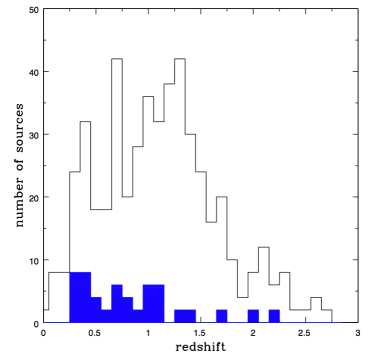
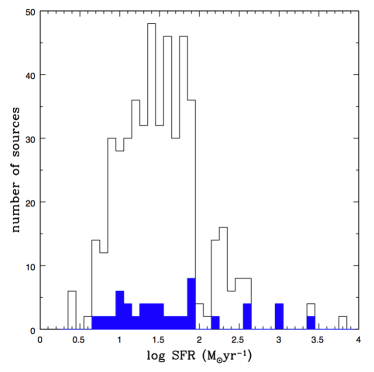
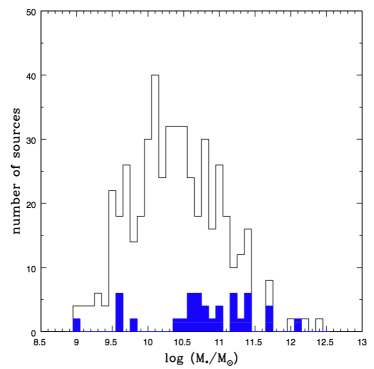
In Fig. 8 we plot the redshift, SFR, stellar mass (derived by SED fitting) and X-ray luminosity (derived by X-ray spectral fitting) distributions (blue shaded regions) of these 58 systems and compare them with the total population of X-ray unabsorbed, IR AGN. The plots indicate that these sources are X-ray luminous AGN that reside in massive systems ().
4 Summary
We use the sources of the Stripe 82-XMM area to select mid-IR AGN by applying the selection criteria presented in Stern et al. (2012) combined with those described in Assef et al. (2013) for fainter sources (LaMassa et al., 2019). The sample consists of 1946 AGN candidates, with reliability. For 1507 sources there are SDSS magnitudes available. Their optical/mid-IR colours (Yan et al., 2013), suggest that about 40% of the sample is obscured. We use SED fitting to further investigate the optical obscuration of these sources, using the inclination angle as a proxy of the optical obscuration. The SED analysis corroborates that these sources are obscured.
507 IR AGN are detected in X-rays and have also optical spectra available. We examine the biases the aforementioned requirements impose on our final AGN sample. Our findings reveal that there is a (significant) population of red sources that are excluded when we require optical spectra and X-ray detection. Specifically, the percentage of red sources with SDSS detection drops from 43% to 20% when X-ray detection and optical spectra are required (Table LABEL:table_yan). Therefore, the sample used in our X-ray analysis is biased against the redder sources. The X-ray spectral fitting analysis suggests that 8% of the sources have column densities . There are 70 (15% of the sample) optically red AGN, that are X-ray unasborbed. SEDs confirmed that 58/70 (83%) of them are obscured sources. The remaining are galaxy dominated systems, i.e., the galaxy emission is a primary component of the SED in the optical part of the spectrum, even though the AGN emission is not absorbed.Therefore, our analysis shows that: (i) The IR acted AGN sample contains a significant fraction of optically red sources (ii) when we consider IR selected AGN that are also X-ray detected, our results reveal that these sources are preferentially associated with unobscured systems.

| RA | DEC | z | r-W2 | Counts | log () | ||||||
|---|---|---|---|---|---|---|---|---|---|---|---|
| () | |||||||||||
| 22.75191 | 0.28993 | 1.215 | 7.55 | 78 | 21.33 | 0.27 | 0.18 | 1.83 | 0.20 | 0.27 | 44.6 |
| 14.17168 | -0.39824 | 0.732 | 7.22 | 42 | 21.69 | 0.24 | 0.18 | 1.88 | 0.22 | 0.26 | 43.7 |
| 19.09421 | 0.12796 | 1.123 | 6.61 | 68 | 21.05 | 0.97 | 0.50 | 1.91 | 0.21 | 0.21 | 44.0 |
| 15.91209 | 0.39683 | 1.018 | 6.59 | 57 | 21.83 | 1.69 | 0.28 | 1.86 | 0.24 | 0.23 | 44.2 |
| 18.58634 | -0.39547 | 2.020 | 6.54 | 71 | 20.28 | 0.19 | 1.82 | 1.92 | 0.24 | 0.17 | 44.9 |
| 24.64576 | 0.36487 | 0.799 | 6.39 | 21 | 20.65 | 0.59 | 0.85 | 1.91 | 0.25 | 0.23 | 44.2 |
| 27.06873 | 0.23135 | 2.060 | 6.38 | 55 | 21.27 | 1.04 | 0.26 | 1.99 | 0.30 | 0.16 | 44.8 |
| 18.53689 | 0.12753 | 0.748 | 6.36 | 36 | 21.25 | 1.14 | 0.37 | 1.83 | 0.20 | 0.29 | 44.1 |
| 23.47359 | -0.25258 | 0.448 | 6.32 | 87 | 21.37 | 0.32 | 0.24 | 1.93 | 0.22 | 0.25 | 43.5 |
| 19.70129 | -0.387586 | 1.498 | 6.26 | 42 | 21.61 | 0.92 | 0.49 | 1.80 | 0.21 | 0.27 | 44.0 |
| 15.25358 | -0.39835 | 1.147 | 6.25 | 47 | 21.72 | 0.82 | 0.19 | 1.87 | 0.21 | 0.24 | 43.8 |
| 14.15460 | -0.44718 | 0.474 | 6.24 | 252 | 20.12 | 0.10 | 0.64 | 2.02 | 0.18 | 0.15 | 44.3 |
| 20.25309 | -0.25531 | 0.864 | 6.23 | 622 | 20.09 | 0.06 | 0.54 | 1.94 | 0.08 | 0.15 | 43.9 |
| 25.77309 | 0.2756 | 1.048 | 6.20 | 252 | 20.18 | 0.13 | 1.07 | 1.85 | 0.12 | 0.19 | 44.6 |
| 27.64483 | -0.03117 | 1.739 | 6.14 | 224 | 20.28 | 0.23 | 0.88 | 2.04 | 0.12 | 0.21 | 44.5 |
| 23.88331 | 0.19228 | 1.152 | 6.11 | 68 | 20.43 | 0.36 | 1.12 | 1.98 | 0.23 | 0.23 | 44.3 |
| 25.23941 | 0.1812 | 0.523 | 6.08 | 1970 | 20.00 | 0.02 | 0.05 | 1.99 | 0.07 | 0.07 | 44.5 |
| 16.59543 | -0.35543 | 0.448 | 6.07 | 82 | 21.69 | 0.70 | 0.36 | 1.93 | 0.25 | 0.21 | 44.2 |
| 26.54346 | -0.16881 | 1.016 | 6.06 | 68 | 20.11 | 0.03 | 1.42 | 1.93 | 0.19 | 0.22 | 44.3 |
| 20.49188 | 1.13305 | 0.58 | 8.65 | 48 | 21.55 | 1.42 | 0.31 | 1.92 | 0.18 | 0.29 | 43.8 |
| 23.55290 | 0.06254 | 0.88 | 7.98 | 471 | 20.42 | 0.14 | 0.17 | 2.02 | 0.12 | 0.12 | 44.6 |
| 26.38281 | -0.04591 | 1.03 | 7.88 | 65 | 20.95 | 0.62 | 0.75 | 1.66 | 0.27 | 0.25 | 44.1 |
| 22.75191 | 0.28993 | 1.19 | 7.55 | 276 | 21.59 | 0.20 | 0.56 | 1.94 | 0.14 | 0.15 | 44.4 |
| 25.02285 | -0.55147 | 0.75 | 7.26 | 776 | 21.67 | 0.05 | 0.03 | 1.88 | 0.07 | 0.13 | 44.8 |
| 16.94573 | -0.34984 | 0.57 | 7.04 | 56 | 20.92 | 0.84 | 0.25 | 2.12 | 0.21 | 0.28 | 43.8 |
| 18.86014 | -0.08849 | 0.88 | 6.89 | 162 | 20.33 | 0.32 | 0.40 | 2.31 | 0.14 | 0.16 | 44.3 |
| 27.35273 | -0.4=966 | 0.59 | 6.85 | 59 | 20.75 | 0.67 | 0.46 | 2.04 | 0.19 | 0.24 | 43.6 |
| 17.77068 | -0.27414 | 0.37 | 6.73 | 1309 | 21.68 | 0.02 | 0.04 | 2.06 | 0.06 | 0.14 | 45.2 |
| 22.71088 | -0.18812 | 1.35 | 6.70 | 87 | 21.22 | 1.14 | 0.41 | 1.92 | 0.22 | 0.31 | 43.9 |
| 19.09421 | 0.12796 | 1.12 | 6.61 | 150 | 20.41 | 0.37 | 0.41 | 1.92 | 0.14 | 0.18 | 44.1 |
| 13.66238 | -1.18152 | 1.37 | 6.59 | 51 | 20.69 | 0.42 | 0.31 | 2.07 | 0.24 | 0.23 | 44.0 |
| 26.98311 | 0.22810 | 1.64 | 6.54 | 138 | 21.57 | 0.40 | 1.38 | 2.24 | 0.19 | 0.15 | 44.3 |
| 18.58251 | -0.39484 | 2.02 | 6.54 | 92 | 20.64 | 0.48 | 0.25 | 2.01 | 0.24 | 0.25 | 44.1 |
| 21.37418 | -1.24827 | 0.82 | 6.48 | 29 | 21.00 | 0.61 | 1.82 | 1.81 | 0.31 | 0.29 | 43.7 |
| 15.14123 | 0.12564 | 1.06 | 6.45 | 73 | 21.25 | 0.45 | 0.29 | 1.75 | 0.25 | 0.24 | 43.9 |
| 24.63729 | 0.36478 | 0.80 | 6.39 | 484 | 21.83 | 0.20 | 0.15 | 2.07 | 0.13 | 0.14 | 44.6 |
| 18.53689 | 0.12753 | 0.75 | 6.36 | 133 | 21.32 | 0.29 | 0.38 | 1.85 | 0.20 | 0.19 | 44.1 |
| 26.82609 | -0.13351 | 0.54 | 6.36 | 123 | 21.58 | 0.45 | 0.29 | 2.05 | 0.18 | 0.15 | 44.4 |
| 16.39569 | 0.10205 | 1.30 | 6.32 | 132 | 20.86 | 0.42 | 1.21 | 1.75 | 0.21 | 0.16 | 44.3 |
| 27.78665 | 0.58813 | 0.88 | 6.31 | 55 | 20.81 | 0.65 | 0.34 | 2.10 | 0.26 | 0.21 | 43.9 |
| 19.70257 | -0.38753 | 1.50 | 6.26 | 76 | 20.50 | 0.40 | 0.82 | 1.62 | 0.17 | 0.28 | 43.9 |
| 26.52557 | 0.32857 | 0.90 | 6.25 | 1083 | 21.69 | 0.04 | 0.02 | 2.15 | 0.05 | 0.12 | 44.6 |
| 14.15460 | -0.44718 | 0.47 | 6.24 | 111 | 20.24 | 0.24 | 0.82 | 1.94 | 0.24 | 0.21 | 44.2 |
| 16.35091 | 0.15034 | 0.42 | 6.24 | 69 | 20.69 | 0.62 | 0.45 | 1.85 | 0.28 | 0.29 | 44.0 |
| 20.25309 | -0.25531 | 0.86 | 6.23 | 100 | 21.24 | 0.47 | 0.28 | 1.92 | 0.19 | 0.25 | 44.2 |
| 18.81533 | 0.4096 | 1.94 | 6.19 | 73 | 21.42 | 0.96 | 0.61 | 1.97 | 0.21 | 0.18 | 43.9 |
| 16.23248 | 0.28018 | 0.72 | 6.13 | 531 | 21.69 | 0.05 | 0.8 | 2.35 | 0.09 | 0.14 | 44.6 |
| 22.89568 | 0.18808 | 0.90 | 6.12 | 92 | 21.52 | 0.43 | 0.21 | 2.01 | 0.26 | 0.25 | 44.1 |
| 18.30137 | 0.10406 | 0.97 | 6.11 | 127 | 21.50 | 0.31 | 0.39 | 1.75 | 0.17 | 0.19 | 44.1 |
| 16.47210 | -0.01478 | 1.05 | 6.09 | 185 | 21.00 | 0.52 | 0.74 | 1.89 | 0.19 | 0.14 | 44.2 |
| 26.88057 | -0.15136 | 2.24 | 6.09 | 127 | 21.82 | 0.32 | 0.24 | 1.92 | 0.16 | 0.18 | 44.0 |
| 28.26243 | 1.01048 | 1.31 | 6.08 | 57 | 20.91 | 0.52 | 1.91 | 1.95 | 0.27 | 0.21 | 43.8 |
| 16.59543 | -0.35543 | 0.45 | 6.07 | 112 | 20.39 | 0.32 | 0.25 | 2.08 | 0.21 | 0.20 | 44.0 |
| 19.61204 | -0.49189 | 1.16 | 6.07 | 71 | 21.52 | 1.21 | 0.58 | 1.72 | 0.22 | 0.29 | 43.9 |
| 27.80391 | 0.50809 | 0.70 | 6.04 | 204 | 20.20 | 0.25 | 1.21 | 1.92 | 0.15 | 0.15 | 44.4 |
| 26.88310 | -0.33868 | 0.55 | 6.04 | 50 | 21.05 | 0.49 | 0.73 | 2.14 | 0.25 | 0.27 | 43.8 |
| 27.27786 | -0.37372 | 1.07 | 6.01 | 225 | 21.30 | 0.18 | 0.27 | 1.83 | 0.16 | 0.14 | 44.5 |
| 28.77457 | 0.59739 | 1.07 | 6.00 | 168 | 21.69 | 0.34 | 0.51 | 1.99 | 0.14 | 0.18 | 44.3 |
5 Acknowledgments
The authors are grateful to the anonymous referee for helpful comments. GM and AR acknowledge support of this work by the PROTEAS II project (MIS 5002515), which is implemented under the ”Reinforcement of the Research and Innovation Infrastructure” action, funded by the ”Competitiveness, Entrepreneurship and Innovation” operational programme (NSRF 2014-2020) and co-financed by Greece and the European Union (European Regional Development Fund).
This research has made use of data obtained from the 3XMM XMM-Newton serendipitous source catalogue compiled by the 10 institutes of the XMM-Newton Survey Science Centre selected by ESA.
This work is based on observations made with XMM-Newton, an ESA science mission with instruments and contributions directly funded by ESA Member States and NASA.
Funding for the Sloan Digital Sky Survey IV has been provided by the Alfred P. Sloan Foundation, the U.S. Department of Energy Office of Science, and the Participating Institutions. SDSS-IV acknowledges support and resources from the Center for High-Performance Computing at the University of Utah. The SDSS web site is www.sdss.org.
SDSS-IV is managed by the Astrophysical Research Consortium for the Participating Institutions of the SDSS Collaboration including the Brazilian Participation Group, the Carnegie Institution for Science, Carnegie Mellon University, the Chilean Participation Group, the French Participation Group, Harvard-Smithsonian Center for Astrophysics, Instituto de Astrofísica de Canarias, The Johns Hopkins University, Kavli Institute for the Physics and Mathematics of the Universe (IPMU) / University of Tokyo, Lawrence Berkeley National Laboratory, Leibniz Institut für Astrophysik Potsdam (AIP), Max-Planck-Institut für Astronomie (MPIA Heidelberg), Max-Planck-Institut für Astrophysik (MPA Garching), Max-Planck-Institut für Extraterrestrische Physik (MPE), National Astronomical Observatories of China, New Mexico State University, New York University, University of Notre Dame, Observatário Nacional / MCTI, The Ohio State University, Pennsylvania State University, Shanghai Astronomical Observatory, United Kingdom Participation Group, Universidad Nacional Autónoma de México, University of Arizona, University of Colorado Boulder, University of Oxford, University of Portsmouth, University of Utah, University of Virginia, University of Washington, University of Wisconsin, Vanderbilt University, and Yale University.
References
- Alam et al. (2015) Alam S., et al., 2015, APJS, 219, 12
- Albareti et al. (2015) Albareti F. D., Comparat J., Gutiérrez C. M., Prada F., Pâris I., Schlegel D., López-Corredoira M., Schneider D. P., Manchado A., García-Hernández D. A., Petitjean P., Ge J., 2015, MNRAS, 452, 4153
- Albareti et al. (2017) Albareti F. D., et al., 2017, ApJS, 233, 25
- Arnaud (1996) Arnaud K. A., 1996, ASPC, 101, 17
- Assef et al. (2013) Assef R. J., et al., 2013, ApJ, 772, 26
- Barmby et al. (2006) Barmby P., Alonso-Herrero A., Donley J. L., Egami E., Fazio G. G., Georgakakis A., Huang J.-S., Laird E. S., Miyazaki S., Nandra K., Park S. Q., Pérez-González P. G., Rieke G. H., Rigby J. R., Willner S. P., 2006, ApJ, 642, 126
- Bruzual & Charlot (2003) Bruzual G., Charlot S., 2003, MNRAS, 344, 1000
- Buchner et al. (2014) Buchner J., et al., 2014, A&A, 564, 125
- Calzetti et al. (2000) Calzetti D., Armus L., Bohlin R. C., Kinney A. L., Koornneef J., Storchi-Bergmann T., 2000, ApJ, 533, 682
- Ciesla et al. (2015) Ciesla L., et al., 2015, A&A, 576, 19
- Civano et al. (2012) Civano F., Elvis M., Brusa M., Comastri A., Salvato M., Zamorani G., Aldcroft T., Bongiorno A., Capak P., Cappelluti N., Cisternas M., Fiore F., Fruscione A., Hao H., Kartaltepe J., Koekemoer A., Gilli R., Impey C. D., Lanzuisi G., Lusso E., Mainieri V., Miyaji T., Lilly S., Masters D., Puccetti S., Schawinski K., Scoville N. Z., Silverman J., Trump J., Urry M., Vignali C., Wright N. J., 2012, ApJS, 201, 30
- Civano et al. (2015) Civano F., Hickox R. C., Puccetti S., Comastri A., Mullaney J. R., Zappacosta L., LaMassa S. M., Aird J., Alexander D. M., Ballantyne D. R., Bauer F. E., Brandt W. N., Boggs S. E., Christensen F. E., Craig W. W., Del-Moro A., Elvis M., Forster K., Gandhi P., Grefenstette B. W., Hailey C. J., Harrison F. A., Lansbury G. B., Luo B., Madsen K., Saez C., Stern D., Treister E., Urry M. C., Wik D. R., Zhang W., 2015, The Astrophysical Journal, 808, 185
- Corral et al. (2015) Corral A., Georgantopoulos I., Watson M. G., Rosen S. R., Page K. L., Webb N. A., 2015, A&A, 576, A61
- Dale et al. (2014) Dale D. A., Helou G., Magdis G. E., Armus L., Díaz-Santos T., Shi Y., 2014, ApJ, 784, 83
- Dalton et al. (2006) Dalton G. B., Caldwell M., Ward A. K., Whalley M. S., Woodhouse G., Edeson R. L., Clark P., Beard S. M., Gallie A. M., Todd S. P., Strachan J. M. D., Bezawada N. N., Sutherland W. J., Emerson J. P., 2006, SPIE, 6269
- Del Moro et al. (2016) Del Moro A., et al., 2016, MNRAS, 456, 2105
- Donley et al. (2012) Donley J. L., Koekemoer A. M., Brusa M., Capak P., Cardamone C. N., Civano F., Ilbert O., Impey C. D., Kartaltepe J. S., Miyaji T., Salvato M., Sanders D. B., Trump J. R., Zamorani G., 2012, ApJ, 748, 142
- Eckart et al. (2010) Eckart M. E., McGreer I. D., Stern D., Harrison F. A., Helfand D. J., 2010, The Astrophysical Journal, 708, 584
- Emerson et al. (2006) Emerson J., McPherson A., Sutherland W., 2006, Msngr, 126, 41
- Feroz et al. (2009) Feroz F., Hobson M. P., Bridges M., 2009, MNRAS, 398, 1601
- Fiore et al. (2009) Fiore F., Puccetti S., Brusa M., Salvato M., Zamorani G., Aldcroft T., Aussel H., Brunner H., Capak P., Cappelluti N., Civano F., Comastri A., Elvis M., Feruglio C., Finoguenov A., Fruscione A., Gilli R., Hasinger G., Koekemoer A., Kartaltepe J., Ilbert O., Impey C., Le Floc’h E., Lilly S., Mainieri V., Martinez-Sansigre A., McCracken H. J., Menci N., Merloni A., Miyaji T., Sanders D. B., Sargent M., Schinnerer E., Scoville N., Silverman J., Smolcic V., Steffen A., Santini P., Taniguchi Y., Thompson D., Trump J. R., Vignali C., Urry M., Yan L., 2009, ApJ, 693, 447
- Freeman et al. (2001) Freeman P. E., Doe S., Siemiginowska A., 2001, ASPC, 238, 483
- Fritz et al. (2006) Fritz J., Franceschini A., Hatziminaoglou E., 2006, MNRAS, 166, 767
- Georgantopoulos et al. (2008) Georgantopoulos I., Georgakakis A., Rowan-Robinson M., Rovilos E., 2008, A&A, 484, 671
- Glikman et al. (2018) Glikman E., et al., 2018, ApJ, 861, 37
- Kalberla et al. (2005) Kalberla P. M. W., Burton W. B., Hartmann D., Arnal E. M., Bajaja E., Morras R., Pöppel W. G. L., 2005, A&A, 440, 775
- LaMassa et al. (2015) LaMassa S. M., Cales S., Moran E. C., Myers A. D., Richards G. T., Eracleous M., Heckman T. M., Gallo L., Urry C. M., 2015, ApJ, 800, 144
- LaMassa et al. (2019) LaMassa S. M., Georgakakis A., Vivek M., Salvato M., Ananna T. T., Urry C. M., MacLeod C., Ross N., 2019, ApJ, 876, 50
- LaMassa et al. (2013) LaMassa S. M., Urry C. M., Cappelluti N., Civano F., Ranalli P., Glikman E., Treister E., Richards G., Ballantyne D., Stern D., Comastri A., Cardamone C., Schawinski K., Böhringer H., Chon G., Murray S. S., Green P., Nandra K., 2013, Monthly Notices of the Royal Astronomical Society, 436, 3581
- LaMassa et al. (2013a) LaMassa S. M., et al., 2013a, MNRAS, 432, 135
- LaMassa et al. (2013b) —, 2013b, MNRAS, 436, 3581
- Lawrence et al. (2007) Lawrence A., et al., 2007, MNRAS, 379, 1599
- Mateos et al. (2012) Mateos S., Alonso-Herrero A., Carrera F. J., Blain A., Watson M. G., Barcons X., Braito V., Severgnini P., Donley J. L., Stern D., 2012, MNRAS, 426, 3271
- Mateos et al. (2017) Mateos S., et al., 2017, ApJL, 841, 18
- Mendez et al. (2013) Mendez A. J., et al., 2013, ApJ, 770, 40
- Mountrichas et al. (2017) Mountrichas G., et al., 2017, MNRAS, 468, 3042
- Nandra & Pounds (1994) Nandra K., Pounds K. A., 1994, MNRAS, 268, 405
- Noll et al. (2009) Noll S., et al., 2009, A&A, 507, 1793
- Rosen et al. (2016) Rosen S. R., Webb N. A., Watson M. G., Ballet J., Barret D., Braito V., Carrera F. J., Ceballos M. T., Coriat M., Della Ceca R., Denkinson G., Esquej P., Farrell S. A., Freyberg M., Grisé F., Guillout P., Heil L., Koliopanos F., Law-Green D., Lamer G., Lin D., Martino R., Michel L., Motch C., Nebot Gomez-Moran A., Page C. G., Page K., Page M., Pakull M. W., Pye J., Read A., Rodriguez P., Sakano M., Saxton R., Schwope A., Scott A. E., Sturm R., Traulsen I., Yershov V., Zolotukhin I., 2016, A&A, 590, A1
- Secrest et al. (2015) Secrest N. J., Dudik R. P., Dorland B. N., Zacharias N., Makarov V., Fey A., Frouard J., Finch C., 2015, ApJS, 221, 12
- Stern et al. (2012) Stern D., Assef R. J., Benford D. J., Blain A., Cutri R., Dey A., Eisenhardt P., Griffith R. L., Jarrett T. H., Lake S., Masci F., Petty S., Stanford S. A., Tsai C.-W., Wright E. L., Yan L., Harrison F., Madsen K., 2012, ApJ, 753, 30
- Stern et al. (2005) Stern D., Eisenhardt P., Gorjian V., Kochanek C. S., Caldwell N., Eisenstein D., Brodwin M., Brown M. J. I., Cool R., Dey A., Green P., Jannuzi B. T., Murray S. S., Pahre M. A., Willner S. P., 2005, ApJ, 631, 163
- Viero et al. (2014) Viero M. P., et al., 2014, ApJS, 210, 9
- Wright et al. (2010) Wright E. L., Eisenhardt P. R. M., Mainzer A. K., Ressler M. E., Cutri R. M., Jarrett T., Kirkpatrick J. D., Padgett D., McMillan R. S., Skrutskie M., Stanford S. A., Cohen M., Walker R. G., Mather J. C., Leisawitz D., Gautier III T. N., McLean I., Benford D., Lonsdale C. J., Blain A., Mendez B., Irace W. R., Duval V., Liu F., Royer D., Heinrichsen I., Howard J., Shannon M., Kendall M., Walsh A. L., Larsen M., Cardon J. G., Schick S., Schwalm M., Abid M., Fabinsky B., Naes L., Tsai C.-W., 2010, AJ, 140, 1868
- Yan et al. (2013) Yan L., et al., 2013, AJ, 145, 55
Appendix A SED fitting
We construct SEDs for the 507 IR AGN in our sample, with X-ray detection. For that purpose, we use multiwavelength broadband photometric data from optical (SDSS-DR13; Albareti et al., 2015), near-IR (VISTA-VIKING; Emerson et al., 2006; Dalton et al., 2006) and mid-IR (WISE; Wright et al., 2010). The SEDs are fitted using the CIGALE code version 0.12 (Code Investigating GALaxy Emission; Noll et al., 2009).
In the fitting process we use the Fritz et al. (2006) library of templates to model the AGN emission. The star-formation histories are convolved assuming the double-exponentially-decreasing (2-dec) model (Ciesla et al., 2015). The Bruzual & Charlot (2003) template is utilized to model the stellar population systhesis, assuming the Salpeter Initial Mass Function (IMF) and the Calzetti et al. (2000) dust extinction law. Dale et al. (2014) templates are adopted for the absorbed dust that is reemitted in the IR. Table LABEL:table_cigale presents the models and the values for the free parameters used by CIGALE for the SED fitting of our X-ray AGN. We consider a source as type 2 when the inclination angle of the torus, , is or .
| Parameter | Model/values |
|---|---|
| Stellar population synthesis model | |
| Initial Mass Function | Salpeter |
| Metallicity | 0.02 (Solar) |
| Single Stellar Population Library | Bruzual & Charlot (2003) |
| double-exponentially-decreasing (2-dec) model | |
| 100, 1000, 5000, 10000 | |
| age | 500, 2000, 5000, 10000, 12000 |
| burst age | 100, 200, 400 |
| Dust extinction | |
| Dust attenuation law | Calzetti et al. (2000) |
| Reddening E(B-V) | 0.3 |
| E(B-V) reduction factor between old and young stellar population | 0.44 |
| Fritz et al. (2006) model for AGN emission | |
| Ratio between outer and inner dust torus radii | 60 |
| 9.7 equatorial optical depth | 0.1, 0.3, 1.0, 2.0, 6.0, 10.0 |
| -1.00, -0.5, 0.00 | |
| 0.0, 2.0, 6.0 | |
| 100 | |
| 0.001, 50.10, 89.99 | |
| AGN fraction | 0.1, 0.2, 0.3, 0.5, 0.6, 0.8 |