User’s Centrality Analysis for Home Location Estimation
Abstract.
User attributes, such as home location, are useful for many applications. Many researchers have been tackling how to estimate users’ home locations using relationships among users. It is known that the home locations of certain users, such as celebrities, are hard to estimate using relationships. However, because estimating the home locations of all celebrities is not actually hard, it is important to clarify the characteristics of users whose home locations are hard to estimate. We analyze whether centralities, which represent users’ characteristics, and the tendency to have the same home locations as friends are related. The results indicate that PageRank and HITS scores are related to whether users have the same home location as friends, and that users with higher HITS scores have the same home location as their friends less often. This result indicates that there are two types of users whose home locations are difficult to estimate: hub users who follow many celebrities and authority users who are celebrities.
1. Introduction
Social media is widely used to interact with friends, get information, and post news. Thus, social media data represent preferences and social trends, and these data are used for various applications. User attributes relating to the real world, such as the home locations of users, are necessary in many applications, such as trend detection for marketing (Benhardus and Kalita, 2013), news recommendations for user experience (Jonnalagedda and Gauch, 2013; Phelan et al., 2009), quantitative observations of how disease is spreading in the real world (Signorini et al., 2011), and real-world event detection (Sakaki et al., 2010). Although users’ real attributes are important, they are not provided in many cases. Among real attributes, home location is widely used to ground user information in computational social science studies.
A user’s home location is often obtained from geo-tagged tweets posted by the user. However, it has been reported that only 3.1% of users post geo-tagged tweets on Twitter (Sloan and Morgan, 2015). Among Japanese-language users, only 0.8% post geo-tagged tweets. It is necessary to estimate unknown users’ home locations from the known home locations of other users.
A social graph representing relationships between users is used to estimate a user’s home location (Jurgens et al., 2015). The assumption is that the geographic distances between connected users on the social graph are close. However, Rahimi et al. (Rahimi et al., 2015) showed that the home locations of some users, such as celebrities mentioned by many users, are hard to estimate. Ebrahimi et al. (Ebrahimi et al., 2018) showed that not all celebrities’ home locations are hard to estimate—only those of global celebrities, who are mentioned geographically widely. We consider that users who are close on the social graph but not geographically close share certain features. Many centrality measures evaluate or compare the importance of the nodes on a graph. It is considered that centrality scores, such as degree centrality, PageRank (Page et al., 1999), and HITS scores (Kleinberg, 1999), are related to the tendency for neighbors to have similar attributes as their neighbors on the graph.
In this paper, we analyze whether various centrality scores and the tendency to have the same home location as friends are related. We found that users who have the same home location as many friends have different PageRank and HITS scores. This result indicates that there are two types of users whose home locations are difficult to estimate: hub users who follow many celebrities and authority users who are celebrities.
2. Data
In this section, we describe the dataset for analysis. The dataset consists of home location data and social graph data.
2.1. Home Location
We assume that users mainly post tweets around their home location; thus, we define the home location of a user as the city from which the user posts tweets most frequently. We collected geo-tagged tweets posted within the rectangle covering Japan111The area within latitude 20 to 50 degrees north and longitude 110 to 160 degrees east. in 2014 using Twitter Streaming API with location parameters. We then identified the city (the Japanese municipality) containing the coordinates of the collected geo-tagged tweets using the boundary data provided by the Statistics Bureau of Japan’s Ministry of Internal Affairs and Communications.222https://www.e-stat.go.jp/en (viewed 2019-07-19)
We assigned the users’ home location as the location from which they most frequently posted, and for the sake of accuracy, we included only users who posted geo-tagged tweets more than five times in the same area. Consequently, we obtained the home locations of 471,761 users (contains 1,873 unique cities).
2.2. Social Graph
To construct a social graph, we use the following relationships of users who were assigned a home location. We collected their followees and followers in July 2015. We construct a social graph by creating a directed edge from user X to user Y when user X is following user Y. We removed the edges to and from the users who are not assigned a home location. The constructed social graph is a simple directed graph. As a result, the social graph contained 471,761 nodes and 8,295,355 edges. All nodes in this graph have known home locations. The average number of incoming and outgoing edges was 17.58. The average number of mutual followers was 13.2, and 42,316 users had no incoming and no outgoing edges.
3. Analysis Method
We analyze relationships between the centralities of users and the tendency to have the same home locations as their friends. In this section, we describe how to calculate the centrality scores and how to measure the tendency. We then calculate the degree of bias, to clarify the difference in the distributions of centrality scores by the tendency.
3.1. Centrality Measure
We use the in-/out-degree centrality, PageRank (Page et al., 1999), and the authority and hub of the HITS algorithm (Kleinberg, 1999) for analysis. The in-degree centrality has a larger score when the user has more followers, and the out-degree centrality has a larger score when the user has more followees. The degree is used as a measure of celebrity in previous studies (Rahimi et al., 2015; Ebrahimi et al., 2018). Similar to in-degree centrality, the PageRank score increases as a user is followed by users with higher scores. We expect that not only users who have many followers but also users who are being followed by such users will have higher scores. The HITS algorithm assumes that a hub user follows many authority users, and that an authority user is being followed by many hub users; then, the scores are calculated. The hub score tends to be high if the user is following many users, and the authority score tends to be high if the user is being followed by many users. PageRank has been used to identify the influential users (Kwak et al., 2010). We consider that HITS is as effective as PageRank. We calculate the centralities on the social graph constructed in section 2.2 using NetworkX.333https://networkx.github.io/ (viewed 2019-04-15)
3.2. User Groups Based on Neighborhood Friends
We use the location estimation method proposed by Davis Jr. et al. (Davis Jr. et al., 2011) as an indicator of the proximity between users’ home locations and those of their friends. The method estimates the user’s location as the most frequent location among the home locations of their friends. Using the estimation results, we categorize users into the following three groups, which represent the strength of their tendency to have the same home location as their friends: (a) users whose home location is estimated correctly, (b) users whose home location is estimated incorrectly, and (c) users whose home location cannot be estimated. It can be assumed that these users are, respectively, (a) users labeled as easy, who have the same home location as the majority of their friends, (b) users labeled as hard, who do not have the same home location as the majority of their friends, and (c) users labeled as unknown, whose data offer no clues concerning their home location, and whose proximity to their friends cannot be measured.
In this paper, we define friends as users who are mutual followers. We use the estimation result by leave-one-out cross-validation.
3.3. Calculation of Distribution
The distribution of the centrality score for user set is calculated as follows. We define the total number of users as , and the number of users within an interval is . Then, the percentage that the user exists in interval is . We call a score distribution. The intervals are chosen to satisfy .
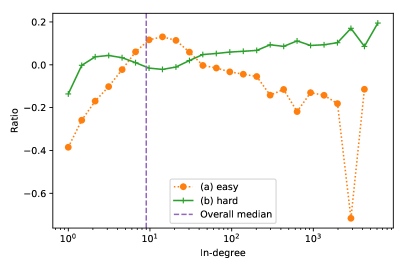
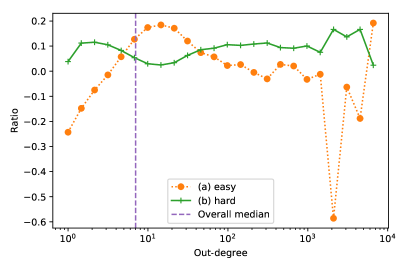
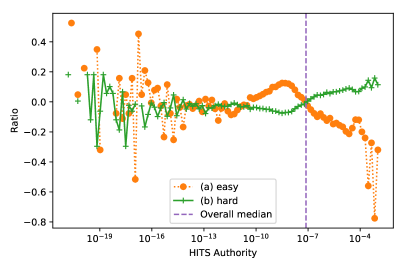
We calculate the score distributions of all users and of each group. Then, to clarify the degree of bias of the user group divided by the tendency, we calculate the difference in the distributions between each user group and all users with the following method. Assuming that the percentage of all users in interval is , and that the percentage of users to be compared in interval is , the degree of bias of the distribution of all users is calculated as . It becomes negative when the percentage of users in the distribution of all users is higher, and positive when the percentage is lower. The degree of bias becomes large if the difference between the compared distributions is large.
4. Results and Discussion
description

description
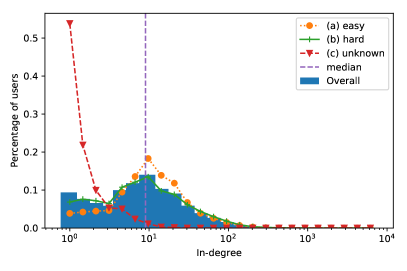
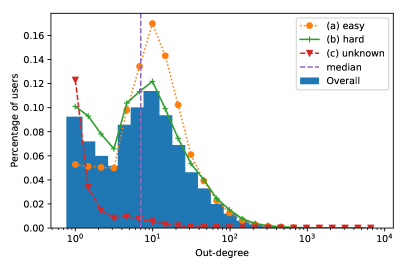
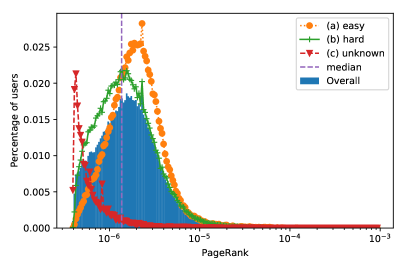
We categorized all users (471,761 users) who were assigned home locations into three groups, as follows: (a) 121,275 users had the same home location as the majority of their friends, (b) 267,809 users had a different home location from the majority of their friends, and (c) 82,677 users had no friends with a home location. We calculated the score distributions of all users (Overall) and the three groups for each centrality. We then calculated the degree of bias of (a) and (b) for each centrality.444We excluded (c) users because their tendencies cannot be measured. Figs. 1(d) and 2(f) show the distribution of the in- and out-degree centrality, PageRank, and the authority and hub of the HITS scores.
As the results of the in- and out-degree centralities illustrated in Fig. 1(d) show the peak positions of the distributions of (a) and (b) are not very different. In terms of the ratio to the overall distribution, the figure shows that the ratio of (a) increases when the value is around 20. Subsequently, as the centrality score becomes larger, the ratio of (a) decreases. If users with many followees or followers are considered celebrities, it is difficult to estimate the home locations of the celebrities correctly. Davis Jr. et al. (Davis Jr. et al., 2011) reported that the precision is highest when estimated using only users with a number of mutual followers between 20 and 200. However, we cannot compare the results, because the methods of counting the number of mutual followers are different.
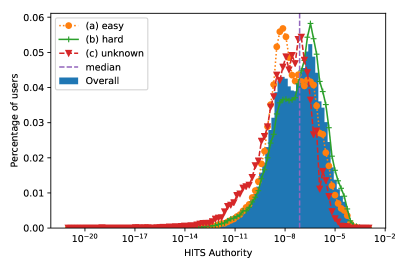
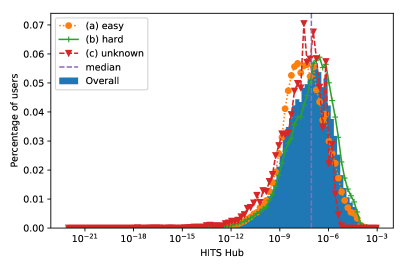
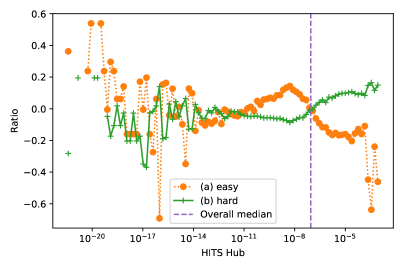
Fig. 2(f) illustrates the results for PageRank and HITS. As the figure shows, the users in (a) tend to have higher PageRank scores than the users in (b). The authority and hub HITS scores seem to exhibit a difference in the peak position of distribution between (a) and (b). In both, the peak position of (a) is located on the right side (indicating a large value), and the peak position of (b) on the left side (indicating a small value), with a median value as the center. Because the HITS scores have a smaller distribution overlap between (a) and (b) than do PageRank scores, whether Twitter users have same home locations as their friends can be better understood by looking at the HITS scores. This result suggests that the social graph of Twitter has two types of users: hub users who follow many celebrities and authority users who are celebrities. In the results for the authority and hub HITS scores, there are few users in (a) with high scores. These results indicate that users who have either high authority or high hub HITS scores have low proximity with the home locations of friends, not only users who have both high authority and high hub HITS scores.
5. Conclusion
We analyzed the relationships between the tendency in home locations between users and their friends, and their centrality scores, using in-/out-degree centralities, PageRank, and the HITS algorithm. The results show that users who have the same home location as a small number of friends have a high PageRank score. Because users who have high HITS scores have the same home location as only a small number of friends, there are two types of users whose home locations are difficult to estimate: hub users who follow many celebrities and authority users who are celebrities. We found that users who have either high authority or high hub HITS scores have low proximity to their friends’ home locations, not only users who have both high authority and high hub HITS scores.
References
- (1)
- Benhardus and Kalita (2013) James Benhardus and Jugal Kalita. 2013. Streaming Trend Detection in Twitter. International Journal of Web Based Communities 9, 1 (2013), 122–139.
- Davis Jr. et al. (2011) Clodoveu A. Davis Jr., Gisele L. Pappa, Diogo Rennó Rocha de Oliveira, and Filipe de L. Arcanjo. 2011. Inferring the Location of Twitter Messages Based on User Relationships. Transactions in GIS 15, 6 (2011), 735–751.
- Ebrahimi et al. (2018) Mohammad Ebrahimi, Elaheh ShafieiBavani, Raymond Wong, and Fang Chen. 2018. Twitter User Geolocation by Filtering of Highly Mentioned Users. Journal of the Association for Information Science and Technology 69, 7 (2018), 879–889.
- Jonnalagedda and Gauch (2013) Nirmal Jonnalagedda and Susan Gauch. 2013. Personalized News Recommendation Using Twitter. In Proceedings of the 2013 IEEE/WIC/ACM International Joint Conferences on Web Intelligence and Intelligent Agent Technologies. 21–25.
- Jurgens et al. (2015) David Jurgens, Tyler Finethy, James Mccorriston, Yi Tian Xu, and Derek Ruths. 2015. Geolocation Prediction in Twitter Using Social Networks: A Critical Analysis and Review of Current Practice. In Proceedings of the 9th International AAAI Conference on Web and Social Media. 188–197.
- Kleinberg (1999) Jon M. Kleinberg. 1999. Authoritative sources in a hyperlinked environment. J. ACM 46, 5 (1999), 604–632.
- Kwak et al. (2010) Haewoon Kwak, Changhyun Lee, Hosung Park, and Sue Moon. 2010. What is Twitter, a Social Network or a News Media?. In Proceedings of the 19th International Conference on World Wide Web. 591–600.
- Page et al. (1999) Lawrence Page, Sergey Brin, Rajeev Motwani, and Terry Winograd. 1999. The PageRank Citation Ranking: Bringing Order to the Web. Technical Report. Stanford InfoLab.
- Phelan et al. (2009) Owen Phelan, Kevin McCarthy, and Barry Smyth. 2009. Using Twitter to Recommend Real-Time Topical News. In Proceedings of the 3rd ACM Conference on Recommender Systems. 385–388.
- Rahimi et al. (2015) Afshin Rahimi, Trevor Cohn, and Timothy Baldwin. 2015. Twitter User Geolocation Using a Unified Text and Network Prediction Model. In Proceedings of the 53rd Annual Meeting of the Association for Computational Linguistics and the 7th International Joint Conference on Natural Language Processing. 630–636.
- Sakaki et al. (2010) Takeshi Sakaki, Makoto Okazaki, and Yutaka Matsuo. 2010. Earthquake Shakes Twitter Users: Real-time Event Detection by Social Sensors. In Proceedings of the 19th International Conference on World Wide Web. 851–860.
- Signorini et al. (2011) Alessio Signorini, Alberto Maria Segre, and Philip M. Polgreen. 2011. The Use of Twitter to Track Levels of Disease Activity and Public Concern in the U.S. during the Influenza A H1N1 Pandemic. PLoS ONE 6, 5 (2011), e19467.
- Sloan and Morgan (2015) Luke Sloan and Jeffrey Morgan. 2015. Who Tweets with Their Location? Understanding the Relationship between Demographic Characteristics and the Use of Geoservices and Geotagging on Twitter. PLOS ONE 10, 11 (2015), e0142209.