The Interaction Between the Supernova Remnant W41 and the Filamentary Infrared Dark Cloud G23.33-0.30
Abstract
G23.33-0.30 is a 600 infrared dark molecular filament that exhibits large NH3 velocity dispersions () and bright, narrow NH3(3,3) line emission. We have probed G23.33-0.30 at the pc scale and confirmed that the narrow NH3(3,3) line is emitted by four rare NH3(3,3) masers, which are excited by a large-scale shock impacting the filament. G23.33-0.30 also displays a velocity gradient along its length, a velocity discontinuity across its width, shock-tracing SiO(5-4) emission extended throughout the filament, broad turbulent line widths in NH3(1,1) through (6,6), CS(5-4), and SiO(5-4), as well as an increased NH3 rotational temperature () and velocity dispersion () associated with the shocked, blueshifted component. The correlations among , , and implies that the shock is accelerating, heating, and adding turbulent energy to the filament gas. Given G23.33-0.30’s location within the giant molecular cloud G23.0-0.4, we speculate that the shock and NH3(3,3) masers originated from the supernova remnant W41, which exhibits additional evidence of an interaction with G23.0-0.4. We have also detected the 1.3 mm dust continuum emission from at least three embedded molecular cores associated with G23.33-0.30. Although the cores have moderate gas masses ( M⊙), their large virial parameters () suggest that they will not collapse to form stars. The turbulent line widths of the cores may indicate negative feedback due to the SNR shock.
1 Introduction
High-mass stars (), though rare, have a profound impact on the evolution of the interstellar medium (ISM). Throughout their short lifetimes ( yr), high-mass stars will release fast, radiation-driven stellar winds that carve out H ii regions into the surrounding molecular clouds (MCs). High-mass stars end their lives by releasing ergs of energy nearly instantaneously in the form of supernovae (SNe). Shocks from expanding H ii regions and supernova remnants (SNRs) accelerate, heat, and add turbulence to their surrounding gas. While these feedback mechanisms are thought to play a significant role in regulating the star formation process, the exact role these shocks play is not yet well understood. The results from hydrodynamic simulations of SNR-MC interactions differ depending on specific parameters, but they show that such interactions could potentially aid or inhibit star formation. Some models suggest that shocks act to disperse dense gas structures (Pittard & Parkin, 2016). On the other hand, since post-shock gas is compressed, other models suggest that this shock-induced compression can trigger collapse to form even denser compact structures (Orlando et al., 2005). Because the influence of SNe on the star formation process has implications for galaxy evolution, it is important to gain a better understanding of SNR-MC interactions. The sites of these interactions can be associated with broad molecular line widths (Reach et al., 2005) and shock-excited maser emission in the 1720 MHz OH transition (Wardle & Yusef-Zadeh, 2002) and the NH3(3,3) inversion transition (McEwen et al., 2016). Dense molecular gas structures that exhibit evidence of broad molecular line widths, 1720 MHz OH maser emission, or NH3 (3,3) maser emission, but lack an obvious stellar source, are prime targets to investigate potential SNR-MC interactions.
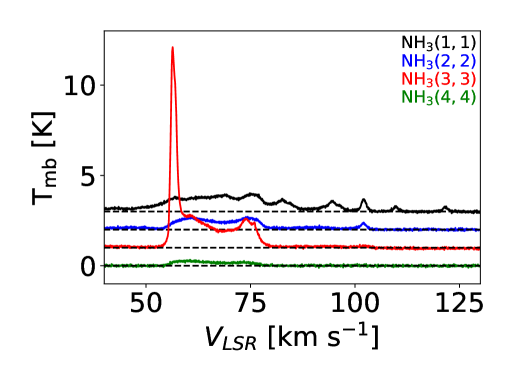
G23.33-0.30 is a dense molecular filament with extremely broad molecular line widths. Due to the lack of any evidence at infrared wavelengths for embedded star formation, these broad line widths are puzzling. The Southern Galactic Plane Survey (HOPS; Walsh et al., 2011) detected extremely broad NH3 line widths and a bright, narrow feature in the NH3(3,3) line profile toward G23.33-0.30. Figure 1 displays Radio Ammonia Mid-Plane Survey (RAMPS; Hogge et al., 2018) NH3(1,1) through (4,4) spectra toward G23.33-0.30 at higher angular resolution () than that of HOPS (). The spectra show the uncommonly broad line emission associated with G23.33-0.30, as well as emission from an unrelated background MC with a local standard of rest (LSR) velocity of km s-1 that exhibits more typical NH3 line profiles. G23.33-0.30’s molecular line emission has a large velocity dispersion (), much larger than that of a typical dense MC (; Sanhueza et al., 2012). Moreover, the NH3(3,3) spectrum displays a bright, narrow line component superposed on a fainter, broad component. Unlike the broad component, the bright, narrow line emission in the ortho () NH3(3,3) spectrum has no corresponding component in the para () transitions. Because masers emit at such small spatial scales (e.g., Elitzur, 1992), the single-dish observations lack the angular resolution necessary to definitively determine whether the brightness temperature of this narrow feature is large enough to confirm maser emission. Nevertheless, the narrow line width of this component and its appearance solely in the NH3(3,3) spectrum suggests that it is from an NH3(3,3) maser. Compared to other masing transitions, NH3(3,3) masers are exceedingly rare. Indeed, to our knowledge only 15 sources with NH3(3,3) masers have been discovered outside of the Galactic Center (Table 1). Although our understanding of NH3(3,3) maser excitation is incomplete, studies have found that they can be excited by shocks resulting from SNR-MC interactions (McEwen et al., 2016) or energetic outflows from high-mass protostars (Mangum & Wootten, 1994; Kraemer & Jackson, 1995; Zhang & Ho, 1995). While the majority of NH3(3,3) masers have fluxes of Jy, Walsh et al. (2011) measured a flux of 9.7 Jy for G23.33-0.30’s maser candidate, potentially making it the brightest yet detected. The unusually broad line widths may indicate that G23.33-0.30 is experiencing a particularly extreme impact from either a SNR or a high-mass protostellar outflow.
| Source | Flux (Jy) | Reference |
|---|---|---|
| DR21(OH) | 0.260 | Mangum & Wootten (1994) |
| W51 | 0.230 | Zhang & Ho (1995) |
| NGC 6334 V | 0.114 | Kraemer & Jackson (1995) |
| NGC 6334 I | 0.482 | Kraemer & Jackson (1995) |
| IRAS 20126+4104 | 0.079 | Zhang et al. (1999) |
| G5.89-0.39 | 0.031 | Hunter et al. (2008) |
| G20.08-0.14N | 0.191 | Galván-Madrid et al. (2009) |
| G23.33-0.30 | 9.7 | Walsh et al. (2011) |
| G30.7206-00.0826 | 5 | Urquhart et al. (2011) |
| G35.03+0.35 | 0.065 | Brogan et al. (2011) |
| G28.34+0.06 | 0.03 | Wang et al. (2012) |
| W51C | 1.4 | McEwen et al. (2016) |
| W44 | 0.07 | McEwen et al. (2016) |
| G5.7-0.0 | 0.35 | McEwen et al. (2016) |
| G1.4-0.1 | 0.58 | McEwen et al. (2016) |
G23.33-0.30’s broad NH3 line emission is associated with a filamentary infrared dark cloud (IRDC) that resides within the giant molecular cloud (GMC) G23.0-0.4, a large ( pc), massive (), and dense () filamentary GMC (Su et al., 2015) that hosts multiple generations of high-mass star formation (Messineo et al., 2014). In particular, there are several nearby SNRs projected against G23.0-0.4, two of which, G22.7-0.2 (Su et al., 2014) and W41 (Frail et al., 2013; Su et al., 2015), may be interacting with the GMC. Furthermore, W41 exhibits 20 cm continuum emission, two 1720 MHz OH maser candidates, and extended TeV emission coincident with or adjacent to G23.33-0.30. G23.33-0.30’s large peak H2 column density of cm-2 (Peretto et al., 2016) is similar to that of other high-mass IRDCs, which are thought to be the formation sites of high-mass stars and stellar clusters (Rathborne et al., 2006). The Co-Ordinated Radio ’N’ Infrared Survey for High-mass star formation’s (CORNISH; Hoare et al., 2012) non-detection of an H ii region likely indicates that any high-mass stars forming within G23.33-0.30 are in an embedded pre-stellar or protostellar phase. Considering GMC G23.0-0.4’s potential involvement in a SNR-MC interaction, as well as G23.33-0.30’s potential capacity for high-mass star formation, both stellar outflows or a SNR-MC interaction remain viable explanations for the excitation of the potential NH3(3,3) maser emission.
To confirm the suspected NH3(3,3) maser emission, determine its excitation conditions, and investigate the nature of the broad NH3 line widths, we have performed followup observations of G23.33-0.30 that probe the filament at the pc scale. In this paper we present Karl G. Jansky Very Large Array (VLA) observations of the NH3(1,1) through (6,6) inversion lines, Atacama Compact Array (ACA) observations of SiO(5-4), CS(5-4), and 1.3 mm continuum, and Submillimeter Array111The Submillimeter Array is a joint project between the Smithsonian Astrophysical Observatory and the Academia Sinica Institute of Astronomy and Astrophysics, and is funded by the Smithsonian Institution and the Academia Sinica. (SMA) observations of 13CO(2-1), C18O(2-1), and 1.3 mm continuum. In Section 2 we describe these observations and the reduction of the data, in Section 3 we present the results, in Section 4 we analyze the data, in Section 5 we discuss the analysis, and in Section 6 we provide our conclusions.
2 Observations and Data Reduction
We have observed G23.33-0.30 using the VLA, operated by the National Radio Astronomy Observatory222The National Radio Astronomy Observatory (NRAO) is a facility of the National Science Foundation operated under cooperative agreement by Associated Universities, Inc., the ACA, and the SMA. Table 2 provides a summary of the continuum and spectral line data analyzed in this work and Sections 2.1, 2.2, and 2.3 describe the calibration and reduction of these data. We also display archival data from several surveys, which are summarized in Table 3.
| Telescope | Date | Transition | ||||||
|---|---|---|---|---|---|---|---|---|
| (GHz) | (arcmin) | (arcsec) | (km s-1) | (km s-1) | (mJy beam-1) | |||
| SMA | 2016 Jun 20 | 13CO(2-1) | 220.39868 | 0.8 | 345 | 0.17 | 82.5 | |
| C18O(2-1) | 219.56035 | 0.8 | 173 | 0.17 | 92.0 | |||
| 1.3 mm cont. | 0.8 | 10435 | 1.1 | |||||
| VLA-A | 2016 Oct 7 | NH3(3,3) | 23.87013 | 1.9 | 50 | 0.39 | 8.1 | |
| VLA-D | 2017 Apr 14 | NH3(1,1) | 23.69450 | 1.9 | 51 | 0.40 | 1.6 | |
| NH3(2,2) | 23.72263 | 1.9 | 51 | 0.39 | 1.3 | |||
| NH3(3,3) | 23.87013 | 1.9 | 50 | 0.39 | 0.6 | |||
| NH3(4,4) | 24.13942 | 1.9 | 50 | 0.39 | 1.4 | |||
| NH3(5,5) | 24.53299 | 1.8 | 49 | 0.38 | 1.1 | |||
| NH3(6,6) | 25.05603 | 1.8 | 48 | 0.37 | 1.6 | |||
| ACA | 2017 Jul 10-13 | SiO(5-4) | 217.10498 | 0.8 | 689 | 0.34 | 20.2 | |
| 1.3 mm cont. | 0.8 | 5451 | 3.7 | |||||
| 2017 Jul 8 | CS(5-4) | 244.93556 | 0.7 | 261 | 0.29 | 22.9 | ||
| 1.3 mm cont. | 0.7 | 4984 | 4.3 |
Note. — is the rest frequency of the spectral line, is the full width at half maximum (FWHM) size of the primary beam, is the FWHM size of the synthesized beam, is the spectral bandwidth, and is the spectral resolution.
| Survey | Telescope | Wavelength/Energy | Spatial Resolution | Reference |
|---|---|---|---|---|
| GLIMPSE | Spitzer | 3.6 m | 1, 2 | |
| GLIMPSE | Spitzer | 8 m | 1, 2 | |
| MIPSGAL | Spitzer | 24 m | 6′′ | 3 |
| MAGPIS | VLA | 20 cm | 4 | |
| VGPS | VLA | 21 cm | 5 | |
| GRS | FCRAO 14 m | 13CO(1-0) - 2.7 mm | 46′′ | 6 |
| H.E.S.S. Survey of Inner Galaxy | H.E.S.S. | TeV | 7 |
2.1 VLA Observations
We observed G23.33-0.30 using the VLA in the D array configuration for a seven hour track. We performed the bandpass and flux calibration of the data using observations of J1331+305 (3C286) and we performed the phase calibration using periodic observations of J1851+0035. The calibration and imaging of the data were performed using CASA333https://casa.nrao.edu/ 5.1.1-5 and we imaged the data using CASA’s clean algorithm with Briggs weighting and the robustness parameter set to 0.5.
G23.33-0.30 was also recently observed by Killerby-Smith (2018) using the VLA in the A array configuration, which only detected NH3(3,3) emission. The A array observation used the same calibrators as the D array, but the bandpass/flux calibrator was partially resolved by the A array’s long baselines. Consequently, the fluxes measured from the A array data are lower limits. The spectral band for the A array observations was shifted to lower compared to the D array, so the D array observations were able to detect emission up to km s-1, while the A array observations could only detect emission up to km s-1. The A array data were also reduced using CASA 5.1.1-5 and were imaged using CASA’s clean algorithm with natural weighting.
2.2 ACA Observations
We observed G23.33-0.30 with the ACA using three pointings and five 50 min execution blocks in two spectral setups. The first spectral setup was used to observe SiO(5-4) and executed four times and the second spectral setup was used to observe CS(5-4) and was executed once. For both spectral setups we performed the bandpass calibration using observations of J1924-2914 and the phase calibration using periodic observations of J1743-0350. For the first spectral setup we performed the flux calibration using observations of J1733-1304 and for the second spectral setup we used observations of J1751+0939. The ACA data were calibrated by the ALMA data reduction pipeline and imaged using CASA 4.7.2. We carried out imaging using CASA’s tclean algorithm with Briggs weighting and the robustness parameter set to 0.5.
2.3 SMA Observations
We observed G23.33-0.30 using the SMA for an eight hour track in the compact configuration. We performed the bandpass calibration using observations of 3C454.3, the flux calibration using observations of Neptune, and the phase calibration using periodic observations of 1743-038. We calibrated the data using MIR444https://www.cfa.harvard.edu/rtdc/SMAdata/process/mir/, an IDL-based data reduction software package, and converted the calibrated data to MIRIAD555https://www.atnf.csiro.au/computing/software/miriad/ format for imaging using the mir2miriad procedure. We imaged the data with MIRIAD 4.3.8 using MIRIAD’s clean algorithm with Briggs weighting and the robustness parameter set to 1.
3 Results
Figure 2 shows the 8 m Galactic Legacy Infrared Midplane Survey Extraordinaire (GLIMPSE; Benjamin et al., 2003; Churchwell et al., 2009) image of G23.33-0.30 with the VLA NH3(2,2) integrated intensity overlaid as contours. Clearly, the thermal NH3(2,2) emission traces the IRDC filament, while a gap in the 8 m extinction () corresponds to a gap in the NH3(2,2) emission. The spatial resolution of the D array has resolved the bright, narrow NH3(3,3) line at km s-1 detected by HOPS and RAMPS into two point-like sources, while also revealing another potential maser at km s-1, away from the other two sources. The VLA A array observations of G23.33-0.30 (Killerby-Smith , 2018) resolved one of the maser candidates detected by the D array into two sources. The positions of the four maser candidates are shown with symbol markers in Figure 2, which also displays the NH3(2,2) and NH3(3,3) spectra toward each source. The spectra show that the suspected NH3(3,3) maser emission is much narrower and brighter than the thermal NH3(2,2) and (3,3) emission. Three of the maser candidates have velocities near the peak of the narrowest NH3(2,2) component at 56 km s-1, while the faintest is found near a component peaking at 77 km s-1.
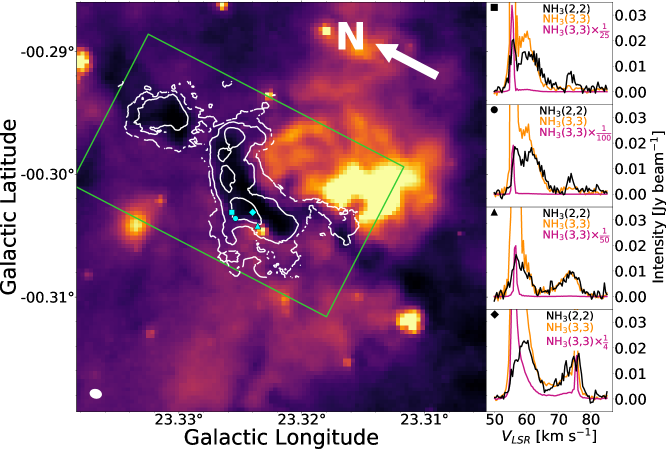
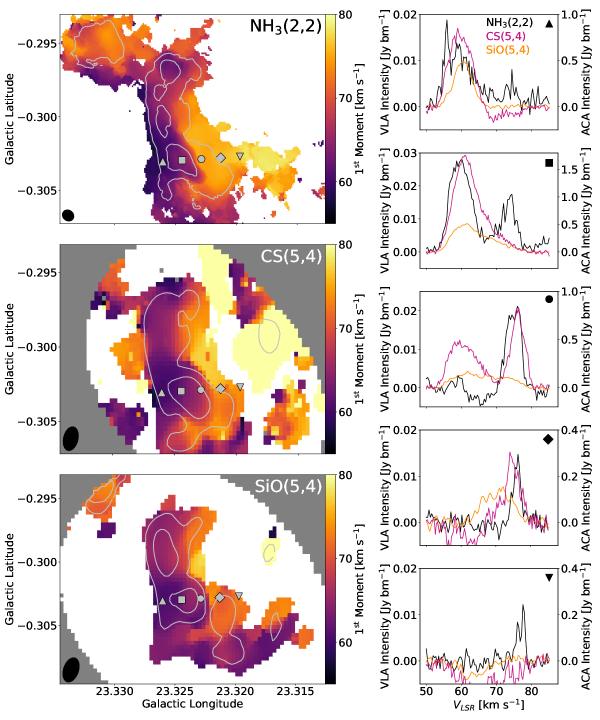
Figure 3 illustrates the unusual kinematics in G23.33-0.30. The left panels show the NH3(2,2), CS(5-4), and SiO(5-4) 1st moment maps of the filament, with their respective integrated intensity contours overlaid, while the right panels show spectra taken across the width of the filament. The NH3(2,2) and CS(5-4) data reveal a velocity discontinuity between a broad line component peaking at km s-1 that is associated with the left edge of the filament and a narrower component at km s-1 that is associated with the right side. The NH3(2,2) data exhibit an additional narrow velocity component at km s-1, peaking near the velocities of three of the maser candidates. The SiO(5-4) emission is extremely broad and peaks primarily at km s-1. With the ACA’s large spectral bandwidth, we are also able to detect emission near km s-1. We do not show this emission in any figures, since it is associated with two background sources unrelated to G23.33-0.30.
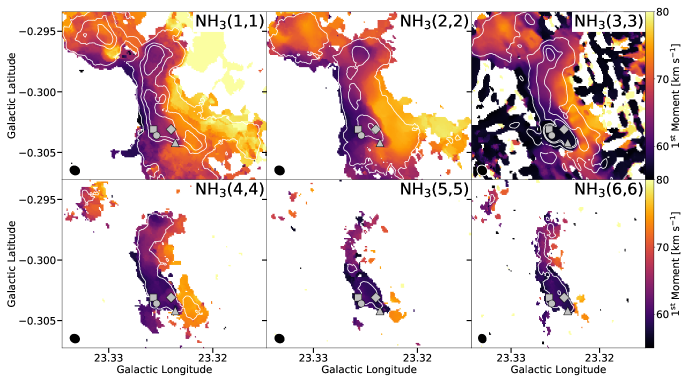
G23.33-0.30 exhibits bright emission from all of the observed NH3 inversion transitions. Figure 4 displays the NH3(1,1) through (6,6) moment maps with integrated intensity contours overlaid. The linear features in the NH3(3,3) map are a result of cleaning artifacts, not real emission. The emission from the higher energy transitions (NH3(4,4) through (6,6)) is strongest at lower and displays similarly broad line widths as the 60 km s-1 NH3(2,2) velocity component. The highest energy transition, NH3(6,6), features particularly bright emission compared to NH3(5,5), and even displays amplitude ratios of NH3(6,6)/(4,4)1 near the peak of the NH3(6,6) emission. In contrast to the NH3(1,1) and (2,2) data, the NH3(4,4) through (6,6) emission peaks only at km s-1, but exhibits a velocity discontinuity between components peaking at and 75 km s-1.
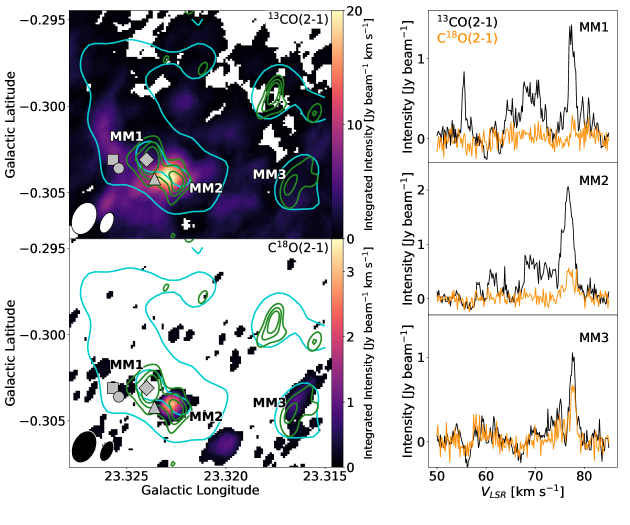
Figure 5 shows the SMA 13CO(2-1), C18O(2-1), 1.3 mm continuum, and ACA 1.3 mm continuum data. Due to the ACA’s good coverage at shorter baselines, the continuum emission detected by the ACA traces the larger scale filament, while the SMA continuum observations are primarily sensitive to the compact continuum cores. Three of the continuum cores, MM1, MM2, and MM3, lie along the filament. Because the bright mm core west of the filament is coincident with emission near km s-1, it is not associated with G23.33-0.30. The SMA 13CO(2-1) and C18O(2-1) emission peaks at km s-1 between MM1 and MM2. The 13CO(2-1) and C18O(2-1) spectra peak at km s-1 toward each of the cores associated with G23.33-0.30. There is also 13CO(2-1) emission at lower appearing mainly on the eastern edge of the filament in the range km s-1.
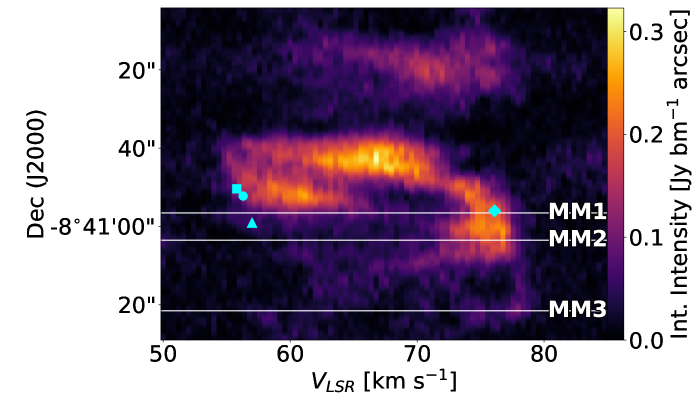
Figure 6 displays the NH3(2,2) intensity integrated along lines of constant Right Ascension. Because the filament points roughly north to south, the figure shows the variation of the gas kinematics along G23.33-0.30’s length. We have also overplotted the positions and velocities of the NH3(3,3) maser candidates and the positions of the continuum sources MM1, MM2, and MM3. While the vast majority of the emission is at km s-1 and displays broad line widths, a small portion of the filament between MM2 and MM3 exhibits narrow line emission peaking at km s-1. This narrow line emission corresponds to the southernmost section of the filament detected in NH3(2,2), but not SiO(5-4). The gas north of this narrow line emission is at lower and composed of two components: a narrow component at km s-1 that is spatially and spectrally coincident with three of the NH3(3,3) maser candidates (Fig. 2), and a turbulent component peaking at km s-1. The section of the filament associated with the NH3(3,3) maser candidate at km s-1 is less turbulent and less blueshifted than the northern part of the filament. Figure 6 also reveals slight deficits in emission in the range km s-1 at the positions of MM1 and MM2, while the NH3 emission toward MM3 reveals a velocity discontinuity between components peaking at km s-1 and km s-1.
4 Analysis
4.1 NH3(3,3) Maser Emission
We determined the position and flux of each NH3(3,3) maser candidate by first fitting spectra to determine line amplitudes and then fitting these amplitude maps to estimate the positions. We used the Python Markov Chain Monte Carlo (MCMC) fitting package emcee (Foreman-Mackey et al., 2013) to fit both the narrow line emission in the data cube and the resulting maps of the line amplitudes. We fit the narrow line emission with a Gaussian model and fit the amplitude maps with a model of the synthesized beam, since we expect maser emission to be unresolved. Table 4 presents the A array fit results for the sources peaking at km s-1 and the D array fit results for the source peaking at 76 km s-1, as well as the symbol markers corresponding to each source shown in Figures 2, 4, 5, and 6. We display the best-fit values for each source’s Galactic coordinate position (), flux (), LSR velocity (), velocity dispersion (), and line brightness temperature ().
| Maser 1 | Maser 2 | Maser 3 | Maser 4 | |
|---|---|---|---|---|
| Symbol | ||||
| Array | A | A | A | D |
| (deg) | 23.3257130.000001 | 23.3253930.000001 | 23.3235640.000001 | 23.3239660.000002 |
| (deg) | -0.303063 | -0.3035660.000001 | -0.3041370.000001 | -0.3030850.000002 |
| (Jy) | ||||
| (km s-1) | ||||
| (km s-1) | ||||
| (K) |
Maser emission occurs in gas with a population inversion, with more molecules in the upper state of a transition than expected in local thermodynamic equilibrium (LTE). Population inversions in the NH3(3,3) transition are a result of collisions with H2 molecules (Walmsley & Ungerechts, 1983). The brightness temperature of a spectral line is given by , where is the transition’s excitation temperature, is the background temperature, and is the optical depth at frequency . If the molecular transition is in LTE with gas at temperature and the background radiation is dominated by the Cosmic Microwave Background (CMB), then . On the other hand, a nonthermal population inversion produces negative values of and , resulting in . Given the low temperatures expected in G23.33-0.30 (), the three masers detected by the A array all exhibit , confirming their nonthermal nature. Because the source at km s-1 was outside of the velocity range of the A array data, the D array data provide our only measurement of its brightness temperature. This source is much fainter than the NH3(3,3) masers at km s-1, exhibiting a D array brightness temperature of only 17 K, which is comparable to the temperatures typically measured in molecular clouds. Although the D array brightness temperature cannot prove this source’s nonthermal origin, it is approximately twice as bright as the peak thermal emission and exhibits a narrow line width, similar to those of the confirmed masers. Moreover, the NH3(3,3) maser candidate has no corresponding velocity feature in any of the other NH3 spectra. Consequently, we assume that the emission is nonthermal and will refer to this source as an NH3(3,3) maser. Thus, G23.33-0.30 hosts four NH3(3,3) masers: three associated with gas corresponding to the narrow NH3(2,2) velocity component near 57 km s-1, and a fourth associated with the asymmetric line emission peaking at 77 km s-1.
4.2 Thermal NH3 Emission
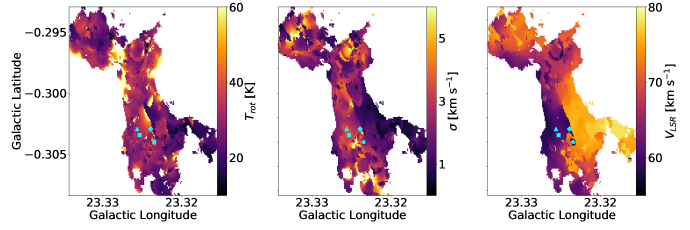
In addition to accelerating gas, shocks can heat and add turbulence to the entrained gas component. Using the NH3 modeling methods described by Hogge et al. (2018), we employed a PySpecKit (Ginsburg & Mirocha, 2011) LTE NH3 model to investigate whether the gas properties in G23.33-0.30 indicate a shock. We first derived NH3 rotational temperatures (), velocity dispersions (), and LSR velocities () from the NH3(1,1) and (2,2) data cubes. In order to exclude emission that would be too faint to provide accurate derived quantities, we only fit pixels that had NH3(2,2) integrated intensities greater than 10 mJy beam-1 km s-1. Figure 7 displays maps of the best-fit parameter values for the velocity component with the larger NH3(1,1) through (2,2) integrated intensity. The maps are overlaid with the positions of the NH3(3,3) masers, which we expect to reside at the locations of shock fronts. Although the presence of broad, overlapping, and asymmetric line shapes did not allow for accurate fit results over the full map, it is clear that the gas at higher is generally colder and has a lower velocity dispersion than that at lower . The southernmost section of the filament, which has the largest measured , was detected in NH3(2,2) but not SiO(5-4). It also corresponds to the region that is coldest and has the lowest velocity dispersion, likely indicating that the gas in this portion of the filament is unshocked and that km s-1 is the filament’s pre-shock LSR velocity. While our analysis of the NH3(1,1) and (2,2) data implied only moderate heating of the turbulent component ( K), the relatively bright emission from the higher energy transitions NH3(4-4) through (6,6) indicates the presence of a hotter component to which the NH3(1,1) and (2,2) amplitudes are insensitive. Consequently, we also performed fits using all of the observed para-NH3 lines: NH3(1,1), (2,2), (4,4), and (5,5). However, the best-fit models of the para-NH3 lines often featured NH3(1,1) amplitudes that were smaller than those observed in the data and NH3(2,2) amplitudes larger than observed in the data. The fact that a single-temperature NH3 model could not reproduce the para-NH3 amplitudes suggests that there exists at least two temperature components. Thus, we performed fits using only NH3(4,4) and (5,5) to better determine the temperature of the hotter component. The rotational temperatures based only on the NH3(4,4) and (5,5) emission are K, much higher than those derived from NH3(1,1) and (2,2). Thus, the shock has deposited significant thermal ( K vs. K) as well as turbulent ( km s-1 vs. km s-1) energy into the filament.
4.3 Virial Analysis
We detected the 1.3 mm dust continuum emission from three compact sources associated with the filament, MM1, MM2, and MM3 (Fig. 5), which represent molecular cores embedded within G23.33-0.30. We used an MCMC routine to fit the positions and sizes of the cores. The compact continuum emission from these cores is superposed on more extended emission. Consequently, we modeled the SMA continuum emission as the superposition of two elliptical Gaussians convolved with the SMA synthesized beam and estimated their positions () and sizes (). This analysis implies that MM1 and MM2 are at most barely resolved by the SMA synthesized beam, so their best-fit sizes are upper limits. Table 5 displays the fit results.
The collapse of a molecular core depends on its turbulent energy content. Due to the added support against gravity, gas that is highly turbulent will have more difficulty collapsing to form stars than will gas with lower levels of turbulence. Thus, the line of sight velocity dispersion, along with the core masses, can inform whether the detected cores can collapse to form stars. In order to evaluate the fate of G23.33-0.30 and its associated molecule cores, we performed a virial analysis using the SMA continuum data and 13CO(2-1) spectra. Neglecting magnetic fields and external pressure, the gravitational stability of a molecular core is dictated by the core mass () and the virial mass () in the form of the virial parameter , where indicates the potential for collapse. We determined using the following equation from Hildebrand (1983)
| (1) |
where is the gas-to-dust mass ratio, is the source flux integrated within the FWHM boundary of the best-fit elliptical Gaussian, is the distance to the source, is the dust opacity, and is the Planck function at the dust temperature . We assumed and , which is the opacity expected for dust with thin ice mantles at a number density of cm-3 (Ossenkopf & Henning, 1994). Because the values of and are uncertain, we assume a uncertainty on our assumed values. We adopted kpc, the parallax distance to the high-mass star-forming region G23.01-0.41 that also resides within GMC 23.0-0.4 (Brunthaler et al., 2009). To estimate the dust temperature, we analyzed Herschel sub-mm data (Molinari et al., 2010) using a single temperature graybody model and the methods and assumptions described by Guzmán et al. (2015). We calculated dust temperatures in the range of K and adopted K, though the error may be larger because the dust temperature was derived from data at a larger angular scale (). We measured within the FWHM boundary of the best-fit models. Next we determined using an equation given by MacLaren et al. (1988),
| (2) |
where specifies the density distribution (), is the radius of the core, is the line-of-sight velocity dispersion, and G is the gravitational constant. We assumed that , the average value for the radial density profile index found by Zhang et al. (2009) in IRDC cores. We estimated from the geometric mean of the best-fit core radii and measured from the SMA 13CO(2-1) spectra toward the best-fit locations of the cores. We also detected C18O(2-1) toward MM2 and MM3 and measured (C18O) (13CO). Because the continuum data provide no kinematic information, the association between the continuum emission from a molecular core and a particular velocity component is sometimes ambiguous. Although we detected no obvious compact molecular line emission associated solely with the continuum cores, the SMA 13CO emission peaking at km s-1 suggests that the cores are associated with the pre-shock velocity component. Consequently, we have measured from the bright velocity component at km s-1. We display the results of our virial analysis in Table 5. Although we have only determined upper limits on the virial parameter for MM1 and MM2 due to the unresolved core radii, the upper limit radii are similar to the expected size of pre-stellar molecular cores (Ward-Thompson et al., 1999), so the true virial parameters are unlikely to be much smaller than our upper limit estimates. Our analysis indicates that all of the cores embedded within G23.33-0.30 have , implying that they are not currently unstable to collapse.
| MM1 | MM2 | MM3 | |
|---|---|---|---|
| (deg) | 23.323840.00002 | 23.322540.00003 | 23.316800.00003 |
| (deg) | -0.303140.00001 | -0.304590.00002 | -0.304650.00002 |
| (arcsec) | |||
| (arcsec) | |||
| (pc) | |||
| (mJy) | 19.10.2 | 13.90.2 | 13.00.3 |
| (M⊙) | |||
| (13CO) (km s-1) | |||
| (C18O) (km s-1) | |||
| (M⊙) | |||
We also investigated the stability of the larger-scale filament by comparing G23.33-0.30’s mass to the mass expected for a collapsing filament. We estimated G23.33-0.30’s mass using Herschel sub-mm data and the methods and assumptions described in Guzmán et al. (2015). We calculated a gas mass of M⊙ for the pc portion of G23.33-0.30 visible in Figure 2, which corresponds to a linear mass density of pc-1. For a typical dense molecular clump (pc size scale), the minimum mass required to form an 8 star is M⊙ (Sanhueza et al., 2017), assuming a star formation efficiency of 30% and a Kroupa (2001) initial mass function. Although this places G23.33-0.30 in the category of potentially high-mass star-forming filaments, the filament’s highly blueshifted and turbulent gas make this less certain. The critical linear mass density above which a molecular filament is unstable to collapse is given by pc-1 (Jackson et al., 2010), where is the FWHM line width. Although the velocity dispersion varies throughout G23.33-0.30, a typical value is km s-1, which corresponds to km s-1. This value provides a critical linear mass density of pc-1, much larger than our estimate of G23.33-0.30’s linear mass density. Thus, like G23.33-0.30’s embedded cores, the filament is not massive enough to collapse given the turbulent gas.
5 Discussion
5.1 Evidence of a Large-Scale Shock
Although NH3(3,3) maser emission typically indicates shocked gas, the positions and velocities of the masers alone cannot distinguish between the protostellar outflow and SNR-MC interaction scenarios. On the other hand, the sharp velocity discontinuity across the width of the filament, which corresponds to an increase in temperature and velocity dispersion, implies a large-scale shock and greatly favors a SNR-MC interaction scenario. Moreover, the SiO(5-4) emission, which traces shocked gas (Caselli et al., 1997), is extended throughout the filament (Fig. 3). While shocks from protostellar outflow could be consistent with the NH3(3,3) maser emission, the resulting SiO emission would be confined to narrow outflow jets emanating from the continuum cores. Since protostellar outflows cannot account for such extended SiO emission, it is more likely that a large-scale shock from a SNR is responsible.
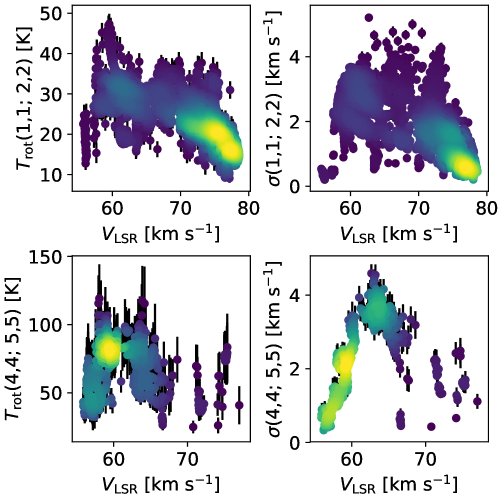
Figure 8 shows plots of (1,1; 2,2) and (1,1; 2,2) vs. and (4,4; 5,5) and (4,4; 5,5) vs. . The NH3(4,4) and (5,5) emission is clearly more sensitive to the hot gas component than the NH3(1,1) and (2,2) emission. The plots of (1,1; 2,2) and (1,1; 2,2) vs. show that the gas at the pre-shock velocity ( km s-1) is generally colder and has a lower velocity dispersion than the turbulent component at lower , but the correlations among the parameters is not particularly tight. On the other hand, (4,4; 5,5) and (4,4; 5,5), which are sensitive to the shocked component, exhibit a more coherent relationship with . The emission at km s-1 displays positive correlations among (4,4; 5,5), (4,4; 5,5), and , while the emission at km s-1 displays negative correlations among these parameters. We speculate that these trends are a signature of the impact that triggered the NH3(3,3) maser emission.
In G23.33-0.30’s reference frame ( km s-1), the gas component associated with the NH3(3,3) masers at km s-1 approaches the filament with a relative velocity of at least km s-1. The impacting gas component forms a shock and excites maser emission as it interacts with the filament. The impulse of the shock accelerates the filament gas, blueshifting it to lower , as well as increasing its temperature and velocity dispersion. This shock acceleration of the filament gas accounts for the negative correlations among (4,4; 5,5), (4,4; 5,5), and for km s-1. Simultaneously, the impacting gas component is decelerated by the interaction with the filament due to G23.33-0.30’s inertia. In the reference frame of the component at km s-1, it encounters the dense filament approaching quickly and is impacted, redshifting it to higher , as well as increasing its temperature and velocity dispersion. This deceleration of the impacting component due to G23.33-0.30’s inertia accounts for the positive correlations among (4,4; 5,5), (4,4; 5,5), and for km s-1. Consequently, the hot, highly turbulent component at km s-1 likely represents the turbulent wake of the shock (Pittard & Parkin, 2016).
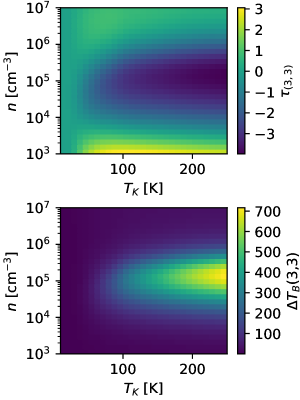
Assuming the maser at km s-1 represents genuine nonthermal emission, it likely signals another shock front within the filament. This source is associated with gas at higher and is much fainter than the other NH3(3,3) masers. Figure 6 suggests that the maser, MM1, and MM2 are all associated with a section of the filament that exhibits values of , , and that are intermediate between the turbulent component and the pre-shock component. Given that this portion of the filament is situated between a highly shocked region and an unshocked region of the filament, we speculate that it is at an earlier stage of shock interaction than the hot, turbulent component. The moderate temperature of this intermediately shocked component may in part explain the faintness of the maser at km s-1. Figure 9 shows a non-LTE RADEX (van der Tak et al., 2007) plot of the expected NH3(3,3) optical depth () and brightness temperature ((3,3)) as a function of the gas kinetic temperature () and number density () for the derived beam-averaged column density ( cm-2) and velocity dispersion ( km s-1) of the intermediately shocked component. Large brightness temperatures and negative optical depths, which indicate strong masing, are only achieved for larger temperatures. At low temperatures, the RADEX model predicts that the gas should be either weakly masing or non-masing. Given the low rotational temperature of the intermediately shocked component ((1,1; 2,2) K), the lower (3,3) of the maser is expected. If the shock continues to heat this section of the filament, it is possible that the maser’s brightness temperature will increase.
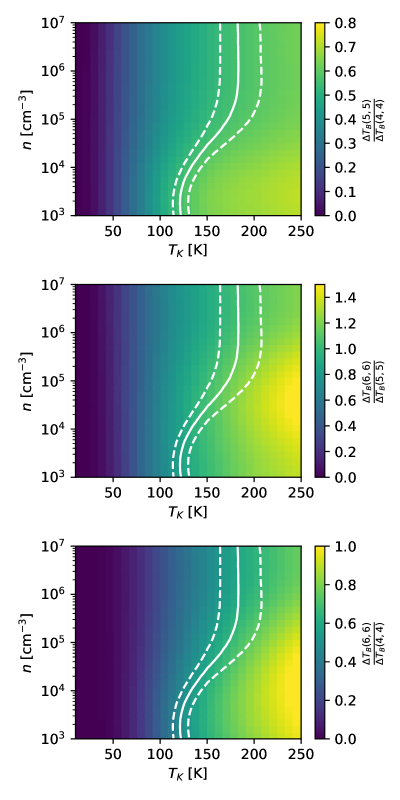
The large rotational temperatures of the hot, turbulent component demonstrate that the shock has heated the gas in the filament, but the NH3(4,4) and (6,6) data also provide evidence of dust heating. NH3 modeling by Faure et al. (2013) suggests that ortho-NH3 () forms preferentially over para-NH3 () on the surfaces of cold ( K) dust grains. In addition, the ortho-NH3 ground state is at a lower energy than the para-NH3 ground state, resulting in a larger amount of energy needed to desorb para-NH3 than ortho-NH3 (Umemoto et al., 1999). Consequently, shocks that heat the icy mantles of cold dust grains release ortho-enhanced NH3 into the gas phase and result in an ortho-to-para abundance ratio (OPR) larger than the statistical equilibrium value of OPR . Enhanced OPRs have previously been observed by Umemoto et al. (1999) in the L1157 outflow and by de Wilt et al. (2017) toward SNR-MC interactions. To confirm the presence of ortho-enhanced gas associated with G23.33-0.30, we fit the NH3(4,4) through (6,6) spectra toward the peak of the NH3(6,6) emission. We calculated brightness temperature ratios of , , and . Figure 10 shows the NH3(4,4) through (6,6) brightness temperature ratios predicted by RADEX for a range of temperatures and densities, assuming the column density ( cm-2) and velocity dispersion ( km s-1) measured from the NH3(4,4) and (5,5) spectra and OPR. The temperatures and densities corresponding to our measured value of are indicated by the white lines overlaid on each plot. If the turbulent gas component had OPR=1, the lines would intersect our measured values of and . However, our measured values for and are larger than any of the values on either plot, suggesting that OPR for the turbulent gas component. Although masing in the NH3(6,6) transition offers another possible explanation for the large ortho-to-para brightness ratios, the large velocity dispersion of the NH3(6,6) line ( km s-1) make this unlikely. Thus, G23.33-0.30 is associated with ortho-enhanced gas, implying that the shock has heated the filament’s cold dust and sublimated NH3 from their icy mantles.
5.2 W41’s SNR-MC Interaction with GMC G23.0-0.4
Although molecular clouds can experience shocks due to protostellar jets or H ii regions, supernova shocks deliver a stronger impulse over a much shorter time span. Supernovae release roughly ergs of energy nearly instantaneously, sending powerful shock waves over tens of parsecs. Despite the fact that only of the total energy is converted into kinetic energy in the shock (Walch & Naab, 2015), the energy in a supernova shock can be sufficient to disrupt and disperse molecular clouds and cores. Using a simple energy transfer analysis, the mass displaced by a SNR shock is approximately given by , where is the molecular cloud’s solid angle at its distance from the supernova, is the kinetic efficiency of the SNR shock, is the total energy of the supernova, and is the change in velocity of the shocked gas. Assuming that ergs, , km s-1, and is the solid angle of a spherical cloud with a radius of 0.5 pc radius at 5, 10, or 20 pc away from the supernova, the gas mass displaced by the shock is 130, 35, or 9 M⊙, respectively.
Given the uncertainty in the shock properties, the mass in the shocked portion of G23.33-0.30 is comparable to the mass able to be displaced by a SNR shock, implying that a SNR is a plausible source for the shock that is accelerating the molecular filament gas. Considering the suggestions of a SNR-MC interaction between SNR W41 and GMC G23.0-0.4 (Frail et al., 2013), W41 is an attractive progenitor for the large-scale shock impacting G23.33-0.30. A SNR shock would likely supply enough energy to explain G23.33-0.30’s highly blueshifted emission, broad turbulent line widths, and increased temperature and velocity dispersion. Thus, we speculate that the turbulent, blueshifted gas observed in G23.33-0.30 is the result of a large scale shock originating from the nearby SNR W41.
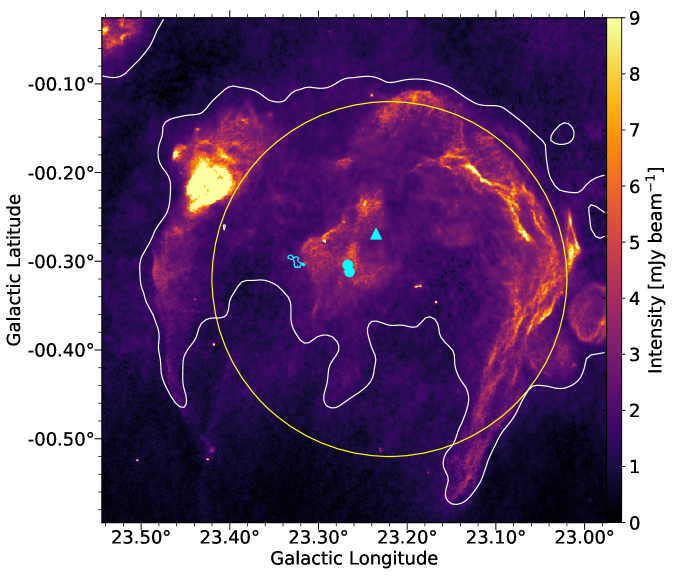
Figure 11 shows the Multi-Array Galactic Plane Imaging Survey (MAGPIS; Helfand et al., 2006) 20 cm continuum emission from W41 in color and the VLA Galactic Plane Survey (VGPS; Stil et al., 2006) 21 cm data as contours. W41 is an asymmetric shell-type supernova (Green, 1991; Kassim, 1992) suspected of interacting with the nearby GMC G23.0-0.4 at km s-1 (Su et al., 2015). Frail et al. (2013) detected two 1720 MHz OH maser candidates, known to trace SNR-MC interactions (Wardle & Yusef-Zadeh, 2002), coincident with W41’s central continuum peak. W41 is also coincident with HESS J1834-087 (Aharonian et al., 2006; Albert et al., 2006), a source of TeV emission thought to be triggered by W41’s interaction with a GMC (Tian et al., 2007). Deep follow-up observations with H.E.S.S. revealed that the TeV emission is composed of a point-like source and an extended component (H. E. S. S. Collaboration et al., 2015). Although the pulsar candidate CXOU J183434.9-08444 (Misanovic et al., 2011) may account for the point-like component of the TeV emission, H. E. S. S. Collaboration et al. (2015) argued that the extended TeV emission is best explained by the SNR-MC interaction.
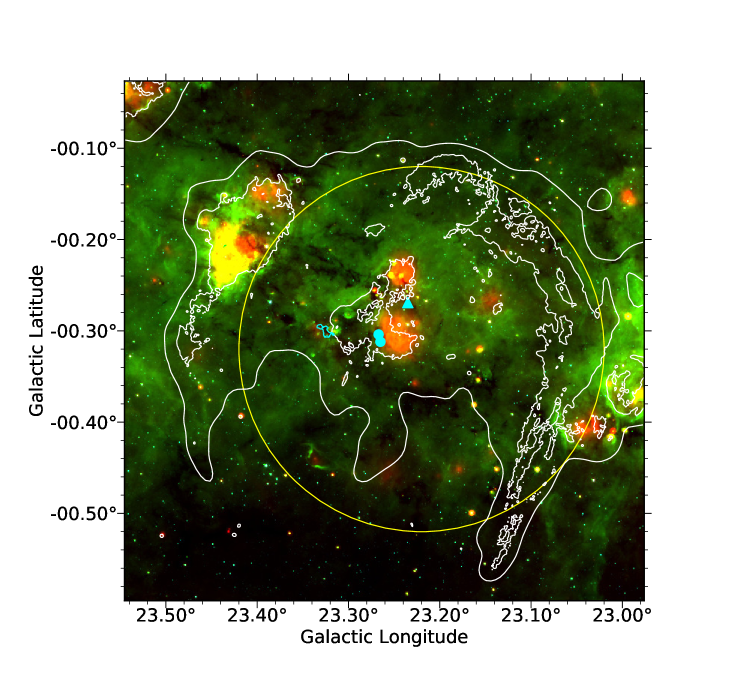
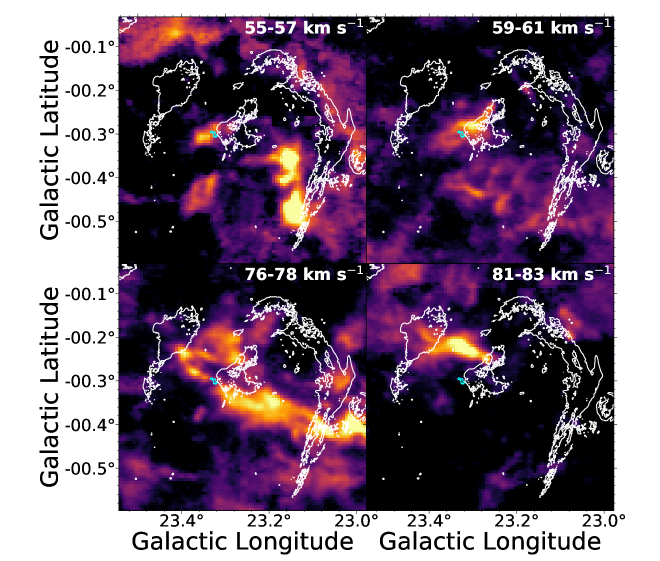
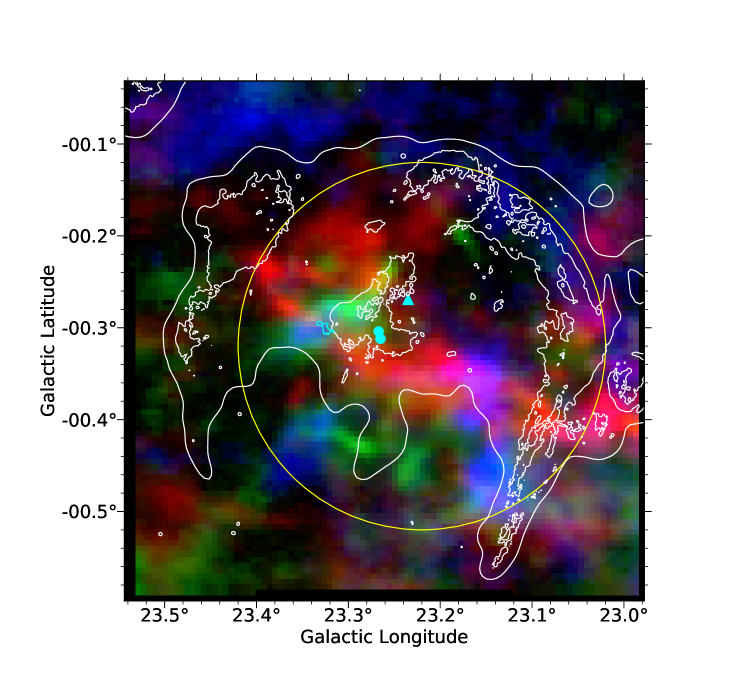
The MIR emission toward the W41 region from GLIMPSE and the MIPS Galactic Plane Survey (MIPSGAL; Carey et al., 2009) is shown in Figure 12, displaying a rich and complicated star-forming complex. These data reveal filamentary IRDCs and several sources of bright MIR emission, but provide no kinematic information about the molecular gas near W41. In order to better understand the kinematics of the molecular gas in the W41 region, we analyzed the Galactic Ring Survey (GRS; Jackson et al., 2006) 13CO(1-0) data. The VLA NH3 data revealed three prominent velocity components: a narrow component at km s-1 that appears to be associated with three of the NH3(3,3) masers, a broad, turbulent component at km s-1, and a relatively asymmetric line peaked at km s-1, which is associated with the NH3(3,3) maser at km s-1. We inspected the 13CO data for emission associated with these velocity components and created maps of the integrated intensity in 2 km s-1 windows centered on these velocities. We also found another distinct 13CO(1-0) velocity component peaking at km s-1, which is spatially and spectrally adjacent to the other emission. Figure 13 shows the GRS 13CO(1-0) data integrated in the velocity ranges indicated in each panel, with the MAGPIS continuum overlaid for comparison. The lower velocity emission centered at 56 and 60 km s-1 displays emission near the positions of W41’s central 20 cm continuum peak and G23.33-0.30. On the other hand, the emission at 77 km s-1 clearly traces GMC G23.0-0.4, but exhibits a conspicuous deficit in emission where W41’s central continuum emission peaks. Finally, the 82 km s-1 component traces a MC, seen as a collection of IRDC filaments in Figure 12, that could represent a nearby background cloud or some other component of the GMC. Tian et al. (2007) also noted the association between the lower velocity emission, W41’s continuum, and HESS J1834-087, but they assumed that the emission represented a separate GMC with which W41 was interacting. If this were true, the emission from GMC G23.0-0.4 would likely be uncorrelated with the central 20 cm continuum peak, rather than anti-correlated. Moreover, Figure 14 shows that the lower velocity emission at 56 and 60 km s-1 and the GMC emission at 77 km s-1 also appear to be anti-correlated. In light of the agreement between the velocities of the 1720 MHz OH maser candidates and the GMC, as well as the apparent anti-correlation between the lower velocity emission and the GMC emission, we argue that these lower velocity components are associated with GMC G23.0-0.4 and the SNR-MC interaction.
Frail et al. (2013) also detected an OH absorption feature at 76 km s-1, which places W41 within or behind G23.0-0.4. In addition, Leahy & Tian (2008) measured a maximum H i absorption velocity of km s-1 toward W41, indicating that W41’s progenitor may have formed within G23.0-0.4. The Reid et al. (2014) near kinematic distance for km s-1 toward G23.33-0.30 is kpc and the maser parallax distance to the nearby HMSFR G23.01-0.41 is kpc (Brunthaler et al., 2009). Considering that the GRS 13CO(1-0) data strongly imply that G23.01-0.41 and G23.33-0.30 both reside within GMC G23.0-0.4, we adopt the maser parallax distance for W41. W41’s angular size of implies that the SNR has a physical diameter of pc. This size is in agreement with estimates from the Sedov relation (Sedov, 1959), assuming a reasonable average density ( cm-3) and SNR age ( yr) (Tian et al., 2007).
Given that these data are consistent with an interaction between SNR W41 and GMC G23.0-0.4, we further speculate that the 13CO(1-0) emission with km s-1 (not shown) in the vicinity of the W41’s central 20 cm continuum peak represents gas from G23.0-0.4 that has been shock-accelerated to its current velocity. The km -1 component seems to correspond to the component associated with the NH3(3,3) masers in G23.33-0.30. This velocity component, which presumably represents gas moving with the largest velocity relative to G23.33-0.30, appears to be streaming past and interacting with the filament. The existence of unshocked gas within G23.33-0.30, as well as 13CO(1-0) emission at the pre-shock velocity adjacent to the filament, implies that the interaction between SNR W41 and G23.33-0.30 is ongoing. This agrees with our interpretation of the interferometric data, which exhibits emission at km s-1 (pre-shock gas), km s-1 (turbulent shock wake), and km s-1 (gas entrained in shock front). A caveat to this interpretation is that W41 lies near the plane of the Galaxy, so the line of sight towards the SNR is crowded with molecular clouds at various velocities, which could confuse our interpretation. In addition, feedback from previous generations of high-mass stars can accelerate gas and create molecular gas structures that are physically close, but have different . Thus, it is possible that the molecular gas with km s-1 is not currently associated with the GMC, but is in fact a remnant of the larger GMC structure that is being impacted by the SNR shock from W41. On the other hand, it is difficult to imagine such a scenario producing the striking anti-correlation between the GMC velocity component and the km s-1 velocity component. Although more observations are needed to determine the true relationship between these velocity components, a SNR-MC interaction seems to best explain the large turbulent line widths, heating, NH3(3,3) masers, and blueshifted emission observed in G23.33-0.30.
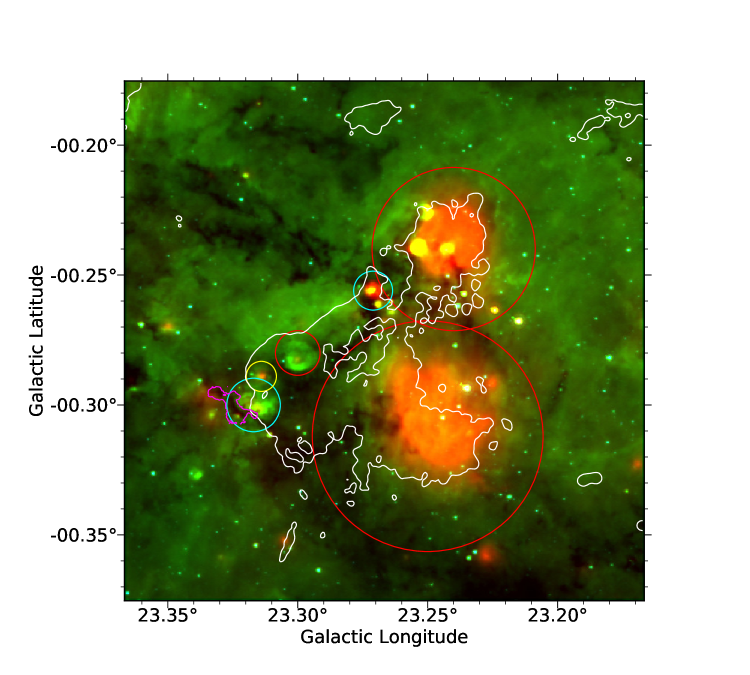
An alternative explanation for G23.33-0.30’s large turbulent line widths is energy added by nearby H ii regions. Figure 15 shows a zoomed view of the MIR emission toward W41’s central continuum peak. The overlaid circles show the positions and sizes of several nearby H ii regions and candidate H ii regions from the WISE Catalog of Galactic H ii regions (Anderson et al., 2014). While it is clear that these H ii regions cannot account for all of the 20 cm continuum emission toward W41’s center, it is likely that they contribute a portion of the emission. The red circles indicate H ii regions that have known velocities from radio recombination lines (RRLs): G023.250-00.240 ( km s-1), G023.265-00.301a ( km s-1), and G023.295-00.280 ( km s-1). Although these velocities may indicate an association with the GMC or the 60 km s-1 13CO(1-0) component, it is unlikely that these sources could account for the significant energy input implied by G23.33-0.30’s large turbulent line widths given their angular separation from G23.33-0.30. The source with the smallest angular separation from G23.33-0.30, the candidate H ii region G023.317-0.300, lacks a reliable velocity from a RRL detection, but its position behind G23.33-0.30 makes it an attractive alternative source for G23.33-0.30’s turbulence. On the other hand, our interferometric data exhibit broad SiO(5-4) and CS(5-4) line emission peaking at km s-1 near the center of the candidate H ii region, potentially signifying its association with the background source HMSFR G23.44-0.18, which has a maser parallax distance of kpc. In addition, the velocity dispersion of G23.33-0.30’s turbulent velocity component is km s-1, while the velocity dispersions measured towards H ii regions in the RAMPS dataset (Hogge et al., 2018) are at most km s-1. Thus, an H ii region would need to input an unusually large amount of energy into G23.33-0.30 to reproduce the measured velocity dispersion. Furthermore, NH3(3,3) masers have previously only been associated with SNR-MC interactions (McEwen et al., 2016) or energetic outflows from high-mass protostars (Mangum & Wootten, 1994; Kraemer & Jackson, 1995; Zhang & Ho, 1995), so NH3(3,3) maser emission resulting from an interaction with an H ii region would also be unusual. Consequently, G23.33-0.30’s high levels of turbulence are most likely the result of a SNR-MC interaction.
5.3 W41’s Potential Impact Geometry
Figure 13 shows that the diameter of W41’s shell is much larger than the radial extent of the GMC. If W41’s interaction is ongoing and it exploded within G23.0-0.4, then W41’s plane of sky diameter must be larger than its size along the line of sight. Dense molecular gas can slow or even stall the expansion of a SNR shock into a MC (Tatematsu et al., 1987). Given that MCs can exhibit asymmetric density profiles, core-collapse supernovae shell structures evolving in these environments can also display asymmetries (Lopez et al., 2009). While this is plausible, we might expect W41’s expansion out of a dense, massive GMC to sweep up more molecular gas in its shell, whereas this signature is absent in the GRS data. An alternative explanation is that W41’s progenitor formed within a MC pc away from G23.0-0.4. The 82 km s-1 MC shown in Figure 13 could potentially be this cloud. The Reid et al. (2014) near kinematic distance for km s-1 is kpc, consistent with our adopted distance to G23.33-0.30. Although Leahy & Tian (2008) measured a maximum H i absorption velocity of km s-1 toward W41, this may not preclude W41 from also being associated with a background MC. If W41 expanded out of this background MC, the shock may have blueshifted much of the foreground molecular gas that was previously associated with the background MC, confusing the interpretation. Hence, the uncertainty in the origin point of W41’s expansion leaves the impact geometry ambiguous.
We have searched for redshifted gas corresponding to the back side of the expanding supernova shell within G23.0-0.4 to help differentiate between these two scenarios. We detected CS emission peaking at and 103 km s-1 and SiO emission peaking at km s-1 near G23.33-0.30, but it is unclear whether this emission is associated with G23.0-0.4 or the interaction. Thus, we examined the GRS 13CO data for signatures of a redshifted component potentially associated with the higher gas. Although we found emission spanning km s-1 toward the left half of W41, we are cautious to associate this emission with the back side of the W41 shell due to the presence of two background sources. One of these background sources is HMSFR G23.44-0.18, which has a maser parallax distance of kpc and km s-1, placing it in the Norma arm near the end of the long bar (Brunthaler et al., 2009; Reid et al., 2014). The second background source is the H ii region G23.42-0.21, which seems to contribute much of the continuum emission near W41’s left edge (Fig. 12). G23.42-0.21 has a recombination line velocity of 103 km s-1 and a maximum H i absorption velocity of 106 km s-1; hence, Leahy & Tian (2008) argued that the absorption velocity was significantly higher than the recombination velocity and that G23.42-0.21 must be assigned to the far distance of kpc.
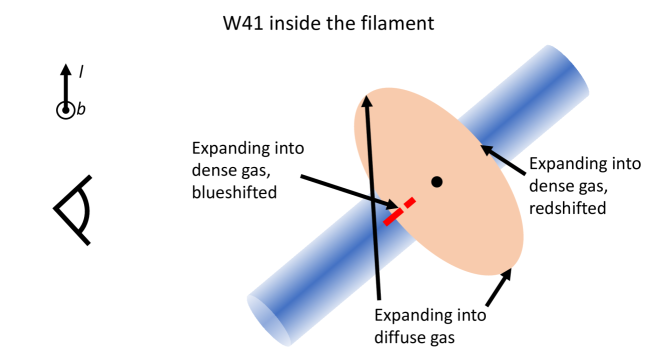
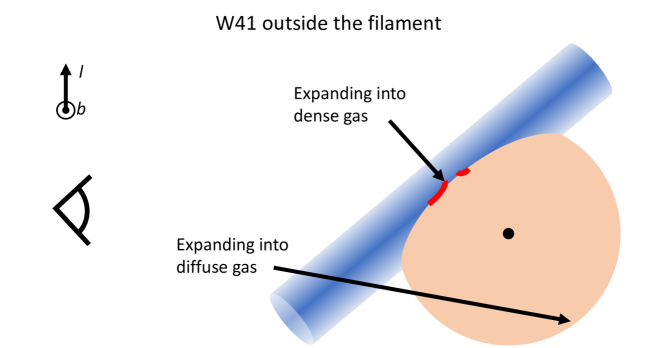
Considering that there are multiple background sources that confuse the interpretation of any potential redshifted gas, the gas kinematics in G23.33-0.30 may offer additional insight into the interaction geometry. Given that G23.33-0.30 exhibits blueshifted emission as a result of its interaction with W41, W41’s progenitor must be behind G23.33-0.30. The details of this interaction also depend on the positions of G23.33-0.30 and W41’s progenitor relative to G23.0-0.4. Considering G23.33-0.30’s large column density, its apparent position along the spine of the G23.0-0.4, and the necessarily high-mass nature of W41’s progenitor, it is plausible that both G23.33-0.30 and W41’s progenitor formed near the dense central regions of their natal MCs. If this assumption is valid, then at least two viable scenarios that could explain the geometry: either W41’s progenitor formed within the GMC and the shock front is perpendicular to the long axis of the filament, or W41’s progenitor formed within a background MC and its shock front is roughly parallel with the long axis of the filament. These two scenarios are illustrated in Figures 16 and 17. Unfortunately, neither of these explanations account for the fact that the eastern edge of the filament is more blueshifted than the western edge. If G23.33-0.30 is closer to the edge of the GMC than assumed, the shock could sweep past the bottom edge of the filament more quickly due to the decreased density on the outskirts of the GMC. Another alternative is that projection affects are confusing our interpretation of the filament’s velocity structure. Regardless of the uncertain impact geometry, W41’s association with G23.33-0.30’s blueshifted gas component and large velocity dispersions is well founded.
5.4 Possible Negative Feedback from SNR W41
Although shocks from supernovae may drive much of the turbulence in the ISM (Padoan et al., 2016), the influence of these shocks on the star formation process is an open question. Simulations of shock-cloud interactions that include dense substructures demonstrate that the more diffuse molecular gas is efficiently stripped from MCs, while such an impact forms a bow shock around a sufficiently dense molecular core (Patnaude & Fesen, 2005). It is possible that the emission deficits in Figure 6 at lower represent a wake formed behind the cores, which would suggest that some dense gas associated with the cores will remain relatively unperturbed by the passage of the shock. On the other hand, the virial parameters derived from the 13CO emission suggest that the cores are too turbulent to collapse. Furthermore, given that the molecular cores are associated with the intermediately shocked component, they may not yet have experienced as significant an impulse from the shock as compared to the northern section of G23.33-0.30. Indeed, MM3, the core furthest from the turbulent component, has the largest brightness ratio. This indicates that MM3 has the highest CO(2-1) optical depth, implying that it is also the densest of the cores. If W41’s shock passes through the filament and continues to interact with the molecular cores, their velocity dispersions may increase, potentially resulting in the dispersal of the cores. Although we cannot determine whether W41’s shock is responsible for the turbulent velocity dispersions of the cores, our data are consistent with negative feedback from the SNR.
6 Conclusion
G23.33-0.30 is a massive IRDC filament that exhibits broad molecular line widths and narrow NH3(3,3) line emission. We have imaged the filament using the VLA (NH3(1,1) through (6,6)), the SMA (13CO, C18O, 1.3 mm continuum), and the ACA (SiO(5-4), CS(5-4), 1.3 mm continuum) and we have drawn the following conclusions from our data:
-
1.
We have confirmed the nonthermal nature of three NH3(3,3) masers that peak near km s-1 and discovered a fourth NH3(3,3) maser at km s-1.
-
2.
The ACA observations revealed broad SiO(5-4) emission throughout the filament, indicating the presence of a highly turbulent and extended shocked gas component. Because protostellar outflows cannot reproduce the observed SiO emission, high-mass protostellar outflows do not produce G23.33-0.30’s NH3(3,3) maser emission. The widespread nature of the SiO emission indicates a shock acting on larger scales.
-
3.
The NH3 emission displays a velocity gradient along the length of the filament, with a significant portion of the filament apparently blueshifted by km s-1 with respect to the rest of the filament. G23.33-0.30 also exhibits a velocity discontinuity across the width of the filament, which separates the shocked, turbulent component from the pre-shock component.
-
4.
Our LTE NH3 model fitting to the NH3(1,1), (2,2), (4,4), and (5,5) data has provided maps of the NH3 rotational temperature (), velocity dispersion (), and LSR velocity (), which show that the shocked component is hotter, more turbulent, and blueshifted compared to the pre-shock component. The correlation among , , and implies that the shock is simultaneously accelerating, heating, and injecting turbulent energy into the shocked filament gas. In addition, the increased ortho-NH3 abundance inferred from the large and brightness temperature ratios imply dust heating.
-
5.
G23.33-0.30 resides within the GMC G23.0-0.4, which previous authors have speculated is undergoing a SNR-MC interaction with W41. Our interferometric data and the GRS 13CO data provide additional evidence of this interaction, which suggests that W41’s shock is the common cause for the observed gas kinematics on large and small scales.
-
6.
Although W41’s impact geometry remains ambiguous, its interaction with G23.33-0.30 and its plane-of-sky diameter imply that it is at a distance of pc from G23.33-0.30.
-
7.
The SMA 1.3 mm continuum data revealed dust cores embedded within G23.33-0.30. Although G23.33-0.30 appears to have sufficient mass ( M⊙) to form a high-mass star, the observed gas kinematics suggest that the filament is presently being displaced, and potentially dispersed, by the SNR shock. Likewise, our virial analysis () suggests that the cores are also unlikely to collapse. Thus, our data are consistent with negative feedback from the SNR.
Acknowledgments
We thank the anonymous referee for useful comments which improved the paper. This research was supported by the National Science Foundation Grant AST-1616635. The National Radio Astronomy Observatory is a facility of the National Science Foundation operated under cooperative agreement by Associated Universities, Inc. This paper makes use of the following ALMA data: ADS/JAO.ALMA2016.1.01345.S. ALMA is a partnership of ESO (representing its member states), NSF (USA) and NINS (Japan), together with NRC (Canada), MOST and ASIAA (Taiwan), and KASI (Republic of Korea), in cooperation with the Republic of Chile. The Joint ALMA Observatory is operated by ESO, AUI/NRAO and NAOJ. The Submillimeter Array is a joint project between the Smithsonian Astrophysical Observatory and the Academia Sinica Institute of Astronomy and Astrophysics and is funded by the Smithsonian Institution and the Academia Sinica. This research has made use of NASA’s Astrophysics Data System.
References
- Aharonian et al. (2006) Aharonian, F., Akhperjanian, A. G., Bazer-Bachi, A. R., et al. 2006, ApJ, 636, 777
- Albert et al. (2006) Albert, J., Aliu, E., Anderhub, H., et al. 2006, ApJ, 638, L101
- Anderson et al. (2014) Anderson, L. D., Bania, T. M., Balser, D. S., et al. 2014, ApJS, 212, 1
- Benjamin et al. (2003) Benjamin, R. A.,Churchwell, E., Babler, B. L., et al. 2003, PASP, 115, 953
- Brogan et al. (2011) Brogan, C. L., Hunter, T. R., Cyganowski, C. J., et al. 2011, ApJ, 739, L16
- Brunthaler et al. (2009) Brunthaler, A., Reid, M. J., Menten, K. M., et al. 2009, ApJ, 693, 424
- Carey et al. (2009) Carey, S. J., Noriega-Crespo, A., Mizuno, D. R., et al. 2009, PASP, 121, 76
- Caselli et al. (1997) Caselli, P., Hartquist, T. W., & Havnes, O. 1997, A&A, 322, 296
- Churchwell et al. (2009) Churchwell, E.,Babler, B. L., Meade, M. R., et al. 2009, PASP, 121, 213
- de Wilt et al. (2017) de Wilt, P., Rowell, G., Walsh, A. J., et al. 2017, MNRAS, 468, 2093
- Elitzur (1992) Elitzur, M. 1992, ARA&A, 30, 75
- Faure et al. (2013) Faure, A., Hily-Blant, P., Le Gal, R., Rist, C., & Pineau des Forêts, G. 2013, ApJ, 770, L2
- Foreman-Mackey et al. (2013) Foreman-Mackey, D., Hogg, D. W., Lang, D., & Goodman, J. 2013, PASP, 125, 306
- Frail et al. (2013) Frail, D. A., Claussen, M. J., & Méhault, J. 2013, ApJ, 773, L19
- Galván-Madrid et al. (2009) Galván-Madrid, R., Keto, E., Zhang, Q., et al. 2009, ApJ, 706, 1036
- Ginsburg & Mirocha (2011) Ginsburg, A., & Mirocha, J. 2011, Astrophysics Source Code Library, ascl:1109.001
- Green (1991) Green, D. A. 1991, Publications of the Astronomical Society of the Pacific, 103, 209
- Guzmán et al. (2015) Guzmán, A. E., Sanhueza, P., Contreras, Y., et al. 2015, ApJ, 815, 130
- Helfand et al. (2006) Helfand, D. J., Becker, R. H., White, R. L., Fallon, A., & Tuttle, S. 2006, AJ, 131, 2525
- H. E. S. S. Collaboration et al. (2015) H. E. S. S. Collaboration, Abramowski, A., Aharonian, F., et al. 2015, A&A, 574, A27
- Hildebrand (1983) Hildebrand, R. H. 1983, QJRAS, 24, 267
- Hoare et al. (2012) Hoare, M. G., Purcell, C. R., Churchwell, E. B., et al. 2012, PASP, 124, 939
- Hogge et al. (2018) Hogge, T., Jackson, J., Stephens, I., et al. 2018, ApJS, 237, 27
- Hunter et al. (2008) Hunter, T. R., Brogan, C. L., Indebetouw, R., & Cyganowski, C. J. 2008, ApJ, 680, 1271
- Jackson et al. (2006) Jackson, J. M., et al. 2006, ApJS, 163, 145
- Jackson et al. (2010) Jackson, J. M., Finn, S. C., Chambers, E. T., et al. 2010, ApJ, 719, L185
- Kassim (1992) Kassim, N. E. 1992, AJ, 103, 943
- Killerby-Smith (2018) Killerby-Smith, N. 2018, Review of the Rare NH3(3,3) Astronomical Masers (Callaghan, NSW, AUS: University of Newcastle)
- Kraemer & Jackson (1995) Kraemer, K. E., & Jackson, J. M. 1995, ApJ, 439, L9
- Kroupa (2001) Kroupa, P. 2001, MNRAS, 322, 231
- Leahy & Tian (2008) Leahy, D. A., & Tian, W. W. 2008, AJ, 135, 167
- Lopez et al. (2009) Lopez, L. A., Ramirez-Ruiz, E., Badenes, C., et al. 2009, ApJ, 706, L106
- MacLaren et al. (1988) MacLaren, I., Richardson, K. M., & Wolfendale, A. W. 1988, ApJ, 333, 821
- Mangum & Wootten (1994) Mangum, J. G., & Wootten, A. 1994, ApJ, 428, L33
- McEwen et al. (2016) McEwen, B. C., Pihlström, Y. M., & Sjouwerman, L. O. 2016, ApJ, 826, 189
- Messineo et al. (2014) Messineo, M., Menten, K. M., Figer, D. F., et al. 2014, A&A, 569, A20
- Misanovic et al. (2011) Misanovic, Z., Kargaltsev, O., & Pavlov, G. G. 2011, ApJ, 735, 33
- Molinari et al. (2010) Molinari, S., Swinyard, B., Bally, J., et al. 2010, PASP, 122, 314
- Orlando et al. (2005) Orlando, S., Peres, G., Reale, F., et al. 2005, A&A, 444, 505
- Ossenkopf & Henning (1994) Ossenkopf, V., & Henning, T. 1994, A&A, 291, 943
- Padoan et al. (2016) Padoan, P., Pan, L., Haugbølle, T., & Nordlund, Å. 2016, ApJ, 822, 11
- Patnaude & Fesen (2005) Patnaude & Fesen 2005, ApJ, 633, 240
- Peretto et al. (2016) Peretto, N., Lenfestey, C., Fuller, G. A., et al. 2016, A&A, 590, A72
- Pittard & Parkin (2016) Pittard, J. M., & Parkin, E. R. 2016, MNRAS, 457, 4470
- Rathborne et al. (2006) Rathborne, J. M., Jackson, J. M., & Simon, R. 2006, ApJ, 641, 389
- Reach et al. (2005) Reach, W. T., Rho, J., & Jarrett, T. H. 2005, ApJ, 618, 297
- Reid et al. (2014) Reid, M. J., Menten, K. M., Brunthaler, A., et al. 2014, ApJ, 783, 130
- Sanhueza et al. (2012) Sanhueza, P., Jackson, J. M., Foster, J. B., et al. 2012, ApJ, 756, 60
- Sanhueza et al. (2017) Sanhueza, P., Jackson, J. M., Zhang, Q., et al. 2017, ApJ, 841, 97
- Sedov (1959) Sedov, L. 1959, Journal of Applied Mathematics and Mechanics, 23, 568
- Stil et al. (2006) Stil, J. M., Taylor, A. R., Dickey, J. M., et al. 2006, AJ, 132, 1158
- Su et al. (2014) Su, Y., Yang, J., Zhou, X., Zhou, P., & Chen, Y. 2014, ApJ, 796, 122
- Su et al. (2015) Su, Y., Zhang, S., Shao, X., & Yang, J. 2015, ApJ, 811, 134
- Tatematsu et al. (1987) Tatematsu, K., Fukui, Y., Nakano, M., et al. 1987, A&A, 184, 279
- Tian et al. (2007) Tian, W. W., Li, Z., Leahy, D. A., & Wang, Q. D. 2007, ApJ, 657, L25
- Umemoto et al. (1999) Umemoto, T., Mikami, H., Yamamoto, S., et al. 1999, ApJ, 525, L105
- Urquhart et al. (2011) Urquhart, J. S., Morgan, L. K., Figura, C. C., et al. 2011, MNRAS, 418, 1689
- van der Tak et al. (2007) van der Tak, F. F. S., Black, J. H., Schöier, F. L., et al. 2007, A&A, 468, 627
- Walch & Naab (2015) Walch, S., & Naab, T. 2015, MNRAS, 451, 2757
- Walmsley & Ungerechts (1983) Walmsley, C. M., & Ungerechts, H. 1983, A&A, 122, 164
- Walsh et al. (2011) Walsh, A. J., Breen, S. L., Britton, T., et al. 2011, MNRAS, 416, 1764
- Wang et al. (2012) Wang, K., Zhang, Q., Wu, Y., Li, H.-b., & Zhang, H. 2012, ApJ, 745, L30
- Wardle & Yusef-Zadeh (2002) Wardle, M., & Yusef-Zadeh, F. 2002, Science, 296, 2350
- Ward-Thompson et al. (1999) Ward-Thompson, D., Motte, F., & Andre, P. 1999, MNRAS, 305, 143
- Zhang & Ho (1995) Zhang, Q., & Ho, P. T. P. 1995, ApJ, 450, L63
- Zhang et al. (1999) Zhang, Q., Hunter, T. R., Sridharan, T. K., & Cesaroni, R. 1999, ApJ, 527, L117
- Zhang et al. (1999) Zhang, Q., Hunter, T. R., Sridharan, T. K., et al. 1999, ApJ, 527, L117
- Zhang et al. (2009) Zhang, Q., Wang, Y., Pillai, T., & Rathborne, J. 2009, ApJ, 696, 268