DEPA: Self-Supervised Audio Embedding for Depression Detection
Abstract.
Depression detection research has increased over the last few decades, one major bottleneck of which is the limited data availability and representation learning. Recently, self-supervised learning has seen success in pretraining text embeddings and has been applied broadly on related tasks with sparse data, while pretrained audio embeddings based on self-supervised learning are rarely investigated. This paper proposes DEPA, a self-supervised, pretrained depression audio embedding method for depression detection. An encoder-decoder network is used to extract DEPA on in-domain depressed datasets (DAIC and MDD) and out-domain (Switchboard, Alzheimer’s) datasets. With DEPA as the audio embedding extracted at response-level, a significant performance gain is achieved on downstream tasks, evaluated on both sparse datasets like DAIC and large major depression disorder dataset (MDD). This paper not only exhibits itself as a novel embedding extracting method capturing response-level representation for depression detection but more significantly, is an exploration of self-supervised learning in a specific task within audio processing.
1. Introduction
Depression, a disease of considerable attention, has been affecting more than 300 million people worldwide. An increasing amount of research has been conducted on automatic depression detection and severity prediction, in particular, from conversational speech, which has embedded crucial information about one’s mental state. Despite recent advances in deep learning, automatic depression detection from speech remains a challenging task.
Since depression is a complicated mental disorder consisting of various symptoms, utilizing traditional feature extraction methods for emotion recognition might lack precision in asserting each individual’s mental state. Previous exploration has covered commonly-used emotion-related features such as COVAREP (Degottex et al., 2014), general-purpose audio features including log-Mel spectrogram (LMS), and combination of Short-Time Fourier Transform (STFT) and Mel-Frequency Cepstral Coefficients (MFCC) (Rejaibi et al., 2019b), and speaker-related audio embedding like i-vector (Cummins et al., 2014). However, as these features are not tailored for application in assessing mental disorders, thus could be less efficient towards such a task with high specificity.
Another characteristic of depression is that usually only one single label (diagnosis results) is provided for a multi-turn interview. Specifically, during a session with a doctor, it would be impossible to give a specific label , representing the mental state (depressed or healthy) for each time step . Here can be chosen on any arbitrary level, such as phone-, word- or sentence-level. Those long sequences subsequently influence depression detection performance. Previous work has hinted that extracting embeddings on segment-level (e.g., sentence, response) might benefit performance (Rejaibi et al., 2019b), while modeling depression via a stationary, time-step independent representation is likely to fail (Al Hanai et al., 2018). Hence, a successful audio-embedding for depression detection needs to be extracted on sequence-level (e.g., spoken sentence/utterance), to capture rich, long-term spoken context as well as emotional development within an interview.
The last important problem is that models so far are heavily restricted by the limited amount of depression data. Hence even with the recent advances of deep learning, this data sparsity has caused difficulty in model performance enhancement and reproduction. One potential solution to the aforementioned data sparsity problem is to pretrain a model on large data and then leverage the model’s knowledge to a downstream task. However, pretraining on supervised tasks (e.g., speech recognition) is time-intensive and costly with manual labeling. Self-supervised training, which utilizes the original property of the data, can potentially remove the dependency on manual labels, thus being able to easily scale with data.
Contribution
This paper proposes DEPA, a self-supervised, pretrained depression audio embedding method for automatic depression detection (see Figure 1). To our knowledge, this is the first time a self-supervised neural network pretraining is performed on a depression detection task.
-
•
We achieved the highest classification performance and lowest regression errors on the benchmark depression detection dataset by modeling each patient’s response via the sequence of his/her uttered speech and realize the extraction of response-level representation with DEPA.
-
•
To highlight the necessity of using sentence-level representations for tasks like depression detection, we compared with previously-used audio features, including general-purpose features, emotion-related representations, and x-vector speaker embeddings. Results suggest a significant performance gain with the use of DEPA and the efficiency of sequence-level representations. We also design several experiments to further illustrate performance enhancement by using sentence-level representations.
-
•
DEPA pretrained on depression data (in-domain) and out-domain datasets are compared, including other mental disorders interviewing conversation datasets and general-purpose speech datasets. Results indicate that self-supervised pretraining on large datasets, especially on those share similar mental disorders with depression, is beneficial to the current data sparsity scenarios and largely outperforms raw features without pretraining.
-
•
We conduct a series of ablation studies to analyze possible factors which may influence the pretraining process, including the configuration of feature extraction, the hyperparameters in pretraining process, and the pretraining strategy.
2. Related Work
In this section, related work on depression detection and self-supervised learning will be discussed.
2.1. Depression detection
Various methods have been proposed for automatic depression detection. Representation learning and classifier selection are the two major research areas within depression detection. Deep learning methods have been employed to extract high-level feature representations (Al Hanai et al., 2018). In particular (Haque et al., 2018) utilized causal convolutional neural networks (C-CNN) to enable sequence-level feature extraction and achieved a high performance by combining visual, audio, and textual modalities. Results indicate that sequence-level representation outperforms frame-level ones with respect to depression detection. Notable work on pretraining audio features for depression detection includes (Salekin et al., 2018), which trained an audio word-book in unsupervised fashion using Gaussian mixture models to extract segment-level features and uses a BLSTM model with max-temporal pooling as a depression classifier. (Rejaibi et al., 2019b) investigated a knowledge transfer from emotion recognition to depression detection by firstly pretraining a recurrent neural network on a fully-labeled emotion recognition dataset. Their results suggest that emotion is a possible marker for automatic depression detection and that transfer learning enhances performance.
2.2. Self-supervised learning
Self-supervised learning is a technique where training data is autonomously labeled, yet the training procedure is supervised. A classic example of self-supervised learning is auto-encoders (Egas López et al., 2019), aiming to reconstruct a given input from a hidden representation. Learning representations with self-supervised training has lead to remarkable improvement in several fields, including textual, visual, audio, and multimodal processing. In natural language processing (NLP), self-supervised text embedding pretraining can be seen as a major breakthrough, with methods such as GloVe (Pennington et al., 2014), BERT (Devlin et al., 2018), and ELMo (Peters et al., 2018). Self-supervised pretraining from audio-visual signals, such as SoundNet (Aytar et al., 2016), have been found to outperform traditional spectrogram-based features in acoustic environment classification. In fact, much research has focused on self-supervised audio-visual segmentation and feature extraction (Rouditchenko et al., 2019; Zhao et al., 2018; Owens and Efros, 2018). Recently, many researches in Computer Vision field use contrastive learning as their self-supervised learning method. SimCLR (Chen et al., 2020), MoCo (He et al., 2020), and CoCLR (Han et al., 2020) all use contrastive learning with some variations to retain visual representations.
In particular, pretrained approaches such as EmoAudioNet (Rejaibi et al., 2019a) have been applied in depression detection, however, its pretraining process requires large 1000h (Librispeech), gender-labeled training data to be successful, which requires extensive manual labor. Our main inspiration for this work stems from Audio2Vec (Tagliasacchi et al., 2019), where a self-supervised approach was proposed, the objective of which is to extract general-purpose audio representations for mobile devices.
Relatively, little research has been conducted on self-supervised audio representation learning in depression detection, or such medical applications. The reasons could include: 1) Content-rich audio contains undesirable information, such as environmental sounds, interfering speech, and noise. 2) Features are typically low-level and extracted within a short time-scale (e.g., 40 ms), each containing little information about high-level concepts (e.g., a single phoneme contains little information about a sentence). 3) Due to the nature of depression detection, interviews are comparatively long (many minutes), which, combined with fine-scale features, means that a classifier needs to remember very long sequences while filtering out unimportant information.
3. DEPA: Self-Supervised Audio Embedding
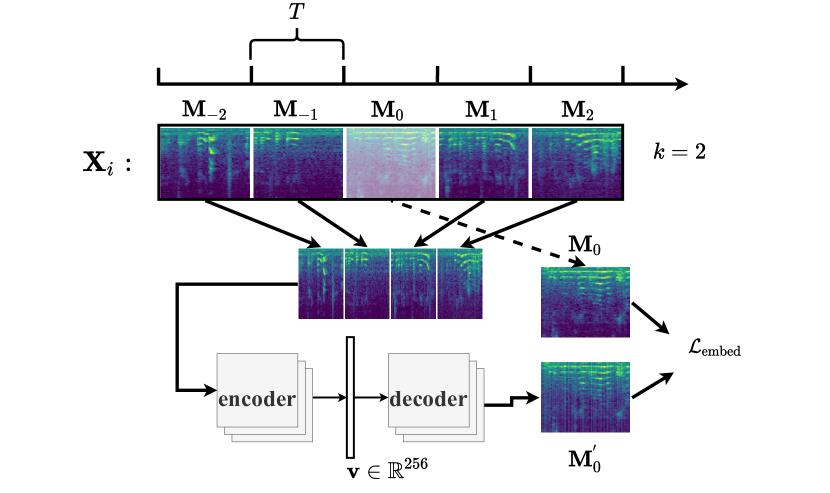
This paper proposes DEPA, an auditory feature extracted via a neural network to summarize spoken language. Our proposed method consists of a self-supervised convolutional encoder-decoder network, where the encoder is later used as DEPA embedding extractor from spectrograms. Given a spectrogram of a specific audio clip (e.g., a spoken sentence) , where is the number of frames and the data dimension (e.g., frequency bins). We proceed to slice into non-overlapping samples , where is the number of frames in one sub-spectrogram which will be explained below, is the hyperparameter which controls number of such sub-spectrograms in one sample, and is the gap parameter such that each sample being apart. The gap between two segments avoids that the self-supervised model exploits spectral leakage to shortcut and easily solve the task.
Each sample is sliced into sub-spectrograms . Each is therefore the concatenation of a center sub-spectrogram and its adjacent left-right context:
If is shorter than frames, we pad zeros to fill frames.
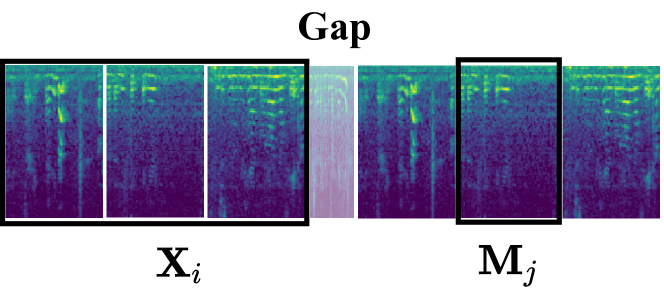
Our self-supervised learning uses a generative strategy. The training process treats the center spectrogram as the target, taking its surrounding spectrograms to re-generate the center spectrogram and computes the embedding loss (Equation 1). Figure 2 shows the slicing process, and the detailed pretraining process is depicted in Figure 1.
| (1) |
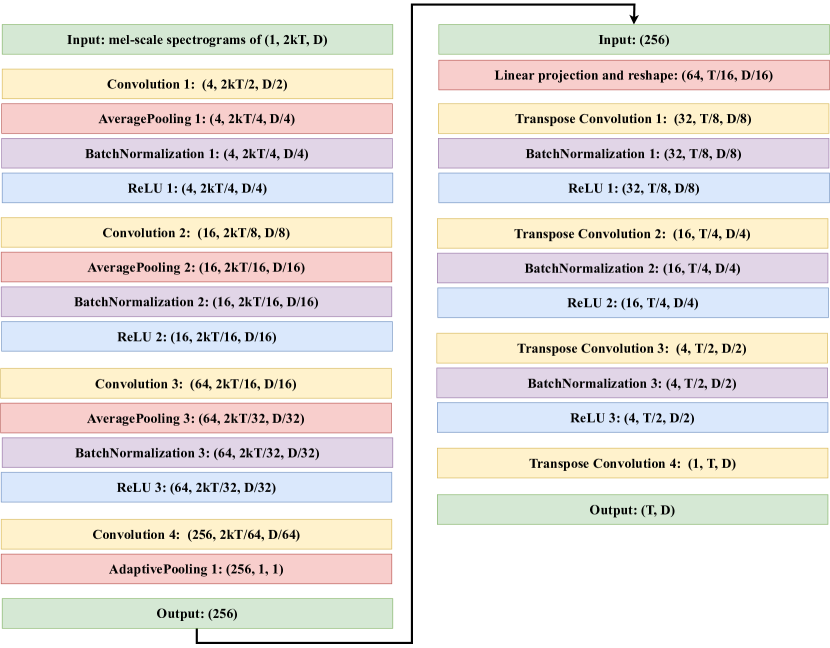
Encoder architecture
The encoder architecture contains three downsampling blocks, followed by an extra convolution layer as well as an adaptive pooling layer. Each block consists of a convolution, average pooling, batch-normalization, and rectified linear unit (ReLU) activation layer. The time-axis is subsampled to before being average pooled in time and frequency dimension.
Decoder architecture
The decoder upsamples the encoder output via four transposed convolutional upsampling blocks and predicts the center spectrogram . The encoder-decoder architecture is shown in Figure 3.
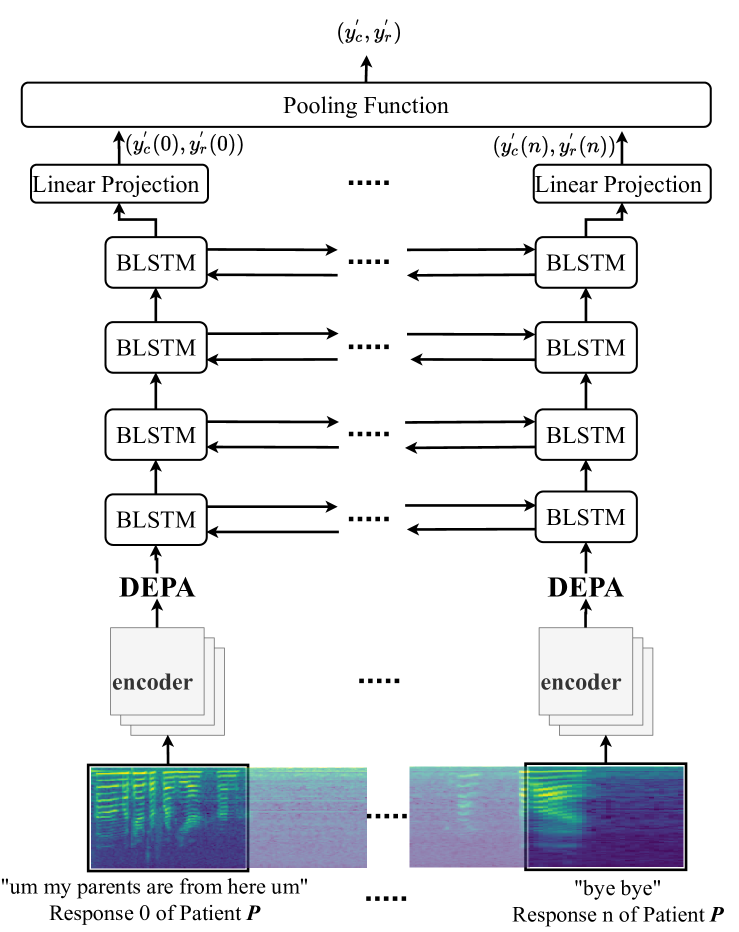
After pretraining the encoder-decoder network, DEPA is extracted via feeding a variable-length audio segment (here on patient response-level) into the encoder model and obtaining a single -dimensional embedding per segment. The sequence of DEPA embeddings is then further fed into a depression detection network, which can be seen in Figure 4.
4. Downstream Task: Depression Detection
In this section, we detail our approach to the downstream task of depression detection on two datasets: DAIC, a small dataset used as depression detection benchmark; MDD, a large dataset focused specifically on female patients with major depression detection (see section 5 for a detailed introduction).
Small Benchmark Data with Two Label Sets
Depression state and severity score is provided in the DAIC dataset, hence, we propose a multi-task scheme, combining depression state classification and depression score prediction. This approach models a patients’ depression sequentially, meaning that only the patients’ responses are utilized. Due to the recent success of LSTM networks in this field (Al Hanai et al., 2018), our depression prediction structure follows a bidirectional LSTM (BLSTM) approach with four layers of size .
The model outputs for response a two dimensional vector , representing the estimated binary patient state () as well as the PHQ-8 score (, a numerical metric to evaluate depression extent). Finally, first timestep pooling is applied to compile all responses of a patient to a single vector . The architecture is shown in Figure 4.
| (2) | ||||
| (3) | ||||
| (4) |
Two outputs are constructed, one directly predicts the binary outcome of a participant being depressed, the other outputs the estimated PHQ-8 score. We opt to use a combination of binary cross entropy (BCE, for binary classification, Equation 2) and Huber loss (for regression, Equation 3). are the ground truth binary and PHQ-8 score, respectively, while is the sigmoid function. In this way, our model considers the internal relationship between binary classification and PHQ-8 score regression, where a higher PHQ-8 score commonly indicates a probability of being classified as depressed.
Large Data with One Classification Label
MDD, a privately collected large depression dataset, is also applied in our downstream detection task. For this dataset, we merely predict the depression state, which is the only label provided. Therefore, the utilized method is similar to the one above with minor changes: the BLSTM only output one scaler: , and only a binary cross-entropy loss is used. Similarly, we model the patient’s response in a sequential manner.
5. Experimental Setup
Depression Data
A commonly used dataset within depression detection is the Distress Analysis Interview Corpus – Wizard of Oz (DAIC) (DeVault et al., 2014) dataset, which encompasses 50 hours of data collected from a total of 142 patients. Two labels are provided for each participant: a binary diagnosis of depressed/healthy and the patient’s eight-item Patient Health Questionnaire score (PHQ-8) metric. Thirty speakers within the training (28 %) and 12 within the development (34 %) set are classified to have depression. The DAIC dataset is fully transcribed, including corresponding on- and offsets within the audio. While this dataset contains training, development, and test subsets, our evaluation protocol is reported on the development subset, since test subset labels are only available to participants of the 2017 Audio/Visual Emotion Challenge (AVEC).
| Dataset | Train | Dev | Test | |
| DAIC | #(D/H) | 30/77 | 12/23 | - |
| # responses | 158 | 190 | - | |
| response (s) | 2.74 | 2.63 | - | |
| MDD | #(D/H) | 516/357 | 101/87 | 105/83 |
| # responses | 318 | 320 | 373 | |
| response (s) | 0.77 | 0.769 | 0.78 |
| Domain | Dataset | Duration (h) | Language |
| In | DAIC | 13 | English |
| MDD | 411 | Mandarin | |
| Out | SWB | 300 | English |
| AD | 400 | Mandarin |
In addition, a large conversational dataset (MDD) for major depression disorder detection under collection has now consisted of 1000 hours of speech conversation between interviewers and subjects, with a balanced proportion of healthy and depressed participants (722 depressed and 527 healthy). We split the dataset into a training set (), a development set (), and a test set (). Unlike the fully-transcribed DAIC dataset, no annotation is provided in MDD. We hence applied the X-vector-based speaker diarization tool provided by the Kaldi Toolkit (Povey et al., 2011) to extract all patient’s speaking segments from the audio. MDD is incorporated to highlight the benefit of summarizing long sequences using DEPA. Detailed statistics regarding the proportion of depressed/healthy subjects, the number of patient responses, and their average duration is displayed in Table 1.
| Classification | Regression | |||||||
| Method | Feature | Feature level | Pretrain Database | Pre | Rec | F1 | MAE | RMSE |
| (Williamson et al., 2016) | dMFCC-VT | Frame | ✗ | - | - | 0.57 | 5.32 | 6.38 |
| (Ma et al., 2016) | LMS | Frame | ✗ | 0.68 | 0.77 | 0.72 | - | - |
| (Al Hanai et al., 2018) | HCVP | Response | ✗ | 0.71 | 0.56 | 0.63 | 5.13 | 6.50 |
| (Stepanov et al., 2018) | LLD | Response | ✗ | - | - | - | 4.96 | 6.32 |
| (Valstar et al., 2016) | CVP | Frame | ✗ | 0.63 | 0.69 | 0.66 | 5.36 | 6.74 |
| (Rejaibi et al., 2019a) | STFT+MFCC | Frame | LibriSpeech | - | - | 0.66 | - | - |
| BLSTM (Ours) | HCVP | Response | ✗ | 0.73 | 0.66 | 0.69 | 4.95 | 6.45 |
| LMS | Frame | ✗ | 0.61 | 0.61 | 0.61 | 5.68 | 6.51 | |
| STFT | Frame | ✗ | 0.64 | 0.64 | 0.64 | 6.83 | 9.27 | |
| x-vector | Response | Voxceleb | 0.59 | 0.59 | 0.59 | 6.23 | 7.10 | |
| BLSTM (Ours) + DEPA | LMS | Response | DAIC | 0.71 | 0.65 | 0.68 | 5.47 | 6.33 |
| STFT | 0.91 | 0.89 | 0.90 | 5.48 | 6.31 | |||
| LMS | Response | MDD | 0.75 | 0.74 | 0.75 | 5.10 | 6.05 | |
| STFT | 0.94 | 0.94 | 0.94 | 5.59 | 6.46 | |||
| LMS | Response | SWB | 0.84 | 0.87 | 0.86 | 5.43 | 6.41 | |
| STFT | 0.91 | 0.90 | 0.91 | 5.15 | 6.02 | |||
| LMS | Response | AD | 0.67 | 0.67 | 0.67 | 5.37 | 6.50 | |
| STFT | 0.93 | 0.96 | 0.94 | 4.75 | 5.73 | |||
Pretraining Data
We aim to compare DEPA in regards to pretraining on related, e.g., in-domain (depression detection) and out-domain (e.g., speech recognition) datasets.
Regarding in-domain data, we utilized the aforementioned DAIC and MDD datasets (we take a subset of 411 hours) for in-domain pretraining in order to compare DEPA to traditional audio feature approaches. In order to ascertain DEPAs’ usability, we further used the mature Switchboard (SWB) (Godfrey et al., 1992) dataset, containing 300 hours of English telephone speech. Lastly, we utilized the Alzheimer’s disease (AD) dataset, collected by Shanghai Mental Clinic Center (Li et al., 2019), containing about 400 hours (questions and answers) of Mandarin interview recordings from elderly participants. The four datasets are described in Table 2.
Feature Selection
Regarding front-end features, our work investigates common LMS and log-power STFT features. Due to different sample rates across the datasets, we resample each dataset’s audio to 22050 Hz. All following features are extracted as default with a hop length () of and a Hann window length () of four times (e.g., ). 128 dimensional LMS and 512-dimensional STFT features were chosen as the default signal-processing front-end. In order to compare DEPA against non-self-supervised approaches, -dimensional higher-order (mean, median, variance, min, max, skewness, kurtosis) COVAREP (Degottex et al., 2014) (HCVP) features were extracted on response-level. HCVP can be seen as a traditional high-level representation, which is an ensemble of lower-level descriptors, such as MFCC, pitch, glottal flow, and other features.
Lastly, we also extracted 256-dimensional x-vectors using a Resnet34 structure (Snyder et al., 2018), for comparison purposes. X-vectors, which are a state-of-the-art method within speaker recognition, have been seen to outperform traditional i-vectors, reported as markers for depression and some other mental diseases (Cummins et al., 2014).
DEPA Pretraining Process
Our encoder-decoder training utilizes LMS and STFT front-end features, with hyper-parameters , extracting a dimensional DEPA embedding. Moreover, the model is trained for epochs using Adam optimization with a starting learning rate of , and a batch size of 512.
Depression Detection Training Process
As mentioned, for the DAIC dataset, we used a multi-task learning strategy to output both binary classification and PHQ-8 scores with a BLSTM network structure. Regarding the MDD dataset, the BLSTM only output classification prediction. Data standardization was applied by calculating a global mean and variance on the training set and using those on the development set. A dropout of was applied after each BLSTM layer to prevent overfitting. Adam optimization with a starting learning rate of and a batch size of 1 was used.
Metrics
Following previous work (Al Hanai et al., 2018), results are reported in terms of mean average error (MAE) and root mean square deviation (RMSE) for regression and macro-averaged (class-wise) precision, recall, and their harmonic mean (F1) score for classification.
6. Results
Results on the two different datasets are provided respectively: DAIC, a benchmark dataset for depression detection, is used to compare against previously methods and demonstrate how DEPA can help boost performance on sparse data scenarios; MDD, by contrast, provides insight on how DEPA compares with raw features, along with a different number of input responses.
6.1. DAIC Results
Our results using the proposed BLSTM approach with and without DEPA pretraining are compared to previous attempts in Table 3. The results are analyzed on multiple levels.
Feature Level Comparison
The results in Table 3 are in line with our initial assumption, that frame-level audio-features are indeed underperforming compared to response-level ones, especially for the BLSTM model. This is likely due to the models’ inherent incapability to remember very long sequences (>10000 frames) for an abstract task such as depression detection, which is also commonly seen within other audio processing tasks where long sequences are harder to predict. Regarding the classification results, it can be seen that traditional HCVP features outperform LMS, STFT, and x-vector approaches. Specifically, with respect to regression, HCVP achieves a score of 4.95, much lower than any other frame-level feature approach (LMS, STFT, dMFCC-VT, CVP). The sub-optimal performance of the x-vector system is likely due to the short response durations in this dataset, being on average 2 seconds long. The performance of x-vector systems generally decreases for utterances shorter than 3 seconds (Snyder et al., 2018). Furthermore, response-level features are likely to contain more context-related information, while frame-level features tend to isolate information between frames.
Feature Comparison
Even though a multitude of features are compared (MFCC, LMS, LLD, CVP, STFT), no clear trend can be established between feature and final performance. Regarding our BLSTM approach, STFT features consistently underperform against LMS and HCVP features in terms of MAE. This is likely due to the increased amount of parameters needed to be estimated by the BLSTM model (input layer increases from 128 to 512) in conjunction with the limited available training data. This can partially be improved by either reducing the feature size (e.g., utilize LMS, MFCC features) or the number of samples per speaker (e.g., use the response averaged HCVP features). By contrast, when experimented with DEPA features, extracting DEPA from STFT features constantly outperforms DEPA from LMS features.
Pretraining Datasets Comparison
DEPA pretraining on the same DAIC dataset can be seen to enhance performance for LMS (F1 0.61 0.68) and especially STFT features (F1 0.64 0.90). This, in turn, reinforces our initial assumption that response-level features are much more useful for depression detection. Pretraining on large datasets (MDD, SWB, and AD) outperformed DAIC in terms of binary classification as well as regression. Further, pretraining on AD resulted in the best performance in terms of all metrics. Larger datasets (DAIC <SWB <MDD = AD) for DEPA pretraining generally improve performance for STFT features.
6.2. MDD Results
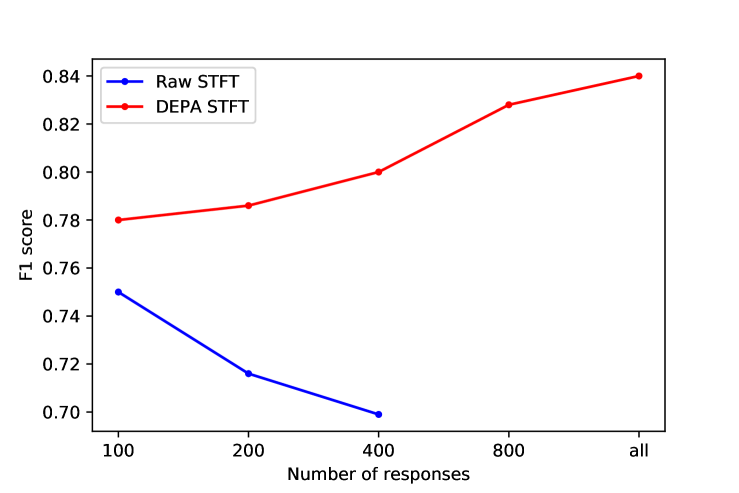
We further evaluated DEPA performance on large depression dataset MDD and reported the result on the test set, with the best setting observed from the DAIC experiments. We compared the difference of using raw STFT features and DEPA STFT pretrained on MDD, along with a different number of patient’s speech responses as the model input. As seen in Figure 5, DEPA largely outperforms raw features without DEPA pretraining, regardless of the input response numbers. We have not conducted experiments of raw STFT using more than 400 responses because the sequences are too long. More input responses increase the performance and the score soars to 0.84 when we input all responses with DEPA. On the contrary, when using raw features the performance is negatively correlated with the input responses. The average duration of one response is around (Table 1) and raw STFT is extracted with a hop length . Hence one response approximately corresponds to a raw STFT feature, which is 140 times longer than DEPA. This suggests DEPA’s superior capability of summarizing sequences, leading to a performance enhancement with increasing amount of input length.
The results demonstrate that, for medical tasks where a summarizing label is predicted based on a long, multi-turn conversation, a sentence-level representation is necessary while traditional frame-level feature extraction methods might fail.
6.3. Ablation
We first design an experiment to demonstrate the importance of response-level representations for depression detection. Then a series of ablation studies are conducted to analyze possible factors which may influence the pretraining model. Lastly, additional generative strategies are compared with the current center spectrogram generation strategy.
Segment length
In order to validate the importance of extracting response-level features, we compare the performance of DEPA extracted from different segment lengths (number of frames) in Table 4. In this experiment, each response is first split into sub-segments of length ms, whereas for each a single DEPA feature is extracted. Segments are extracted without overlap, and zero-padding is used for the last segment. Each segment length can be interpreted as being on a word (150 ms), short sentence (300 ms), and sentence (500 ms) level.
The results indicate an increase in segment length for DEPA extraction commensurates with an increase in binary classification performance. More significant amounts of frames increase the performance, whereas the performance peaks when DEPA is extracted at the response level (the default). Note that larger chunks represent a shorter amount of input features the BLSTM needs to process. This subsequently benefits the learning mechanism of the BLSTM. The larger the chunks are, the more information is summarized; hence fewer independent features are extracted. Interestingly, even though the binary classification performance is greatly enhanced, the MAE score is less influenced. This might indicate that DEPA is an excellent tool for summarizing interviewee sentences yet falls short in extracting meaningful depression-related information. However, note that an MAE of is in line with most results in previous works (see Table 3).
| Classification | Regression | ||||
| Duration | Pre | Rec | F1 | MAE | RMSE |
| 150 ms | 0.58 | 0.54 | 0.56 | 5.51 | 6.51 |
| 300 ms | 0.68 | 0.69 | 0.69 | 5.63 | 6.37 |
| 500 ms | 0.78 | 0.76 | 0.77 | 5.57 | 6.43 |
| response | 0.93 | 0.96 | 0.94 | 4.75 | 5.73 |
Feature frame-shift
Experiments comparing differences in frame-shift () for DEPA extraction in regards to different values of can be seen in Table 5. Note that for all experiments, the window size is set to four times the frame-shift.
| Classification | Regression | |||||
| Pre | Rec | F1 | MAE | RMSE | ||
| 3 | 5 ms | 0.84 | 0.87 | 0.86 | 4.99 | 6.24 |
| 10 ms | 0.62 | 0.62 | 0.62 | 5.49 | 6.47 | |
| 4 | 5 ms | 0.91 | 0.89 | 0.90 | 4.86 | 6.02 |
| 10 ms | 0.64 | 0.66 | 0.65 | 5.48 | 6.42 | |
| 5 | 5 ms | 0.93 | 0.96 | 0.94 | 4.75 | 5.73 |
| 10 ms | 0.72 | 0.68 | 0.70 | 5.43 | 6.59 | |
The results indicate that using a smaller enhances performance (compare ). A short hop-size is potentially beneficial to detect slight variations in speech, leading to better performance.
A similar improvement in binary classification performance can be observed when increasing the number of adjacent spectrograms fed into the network , culminating at .
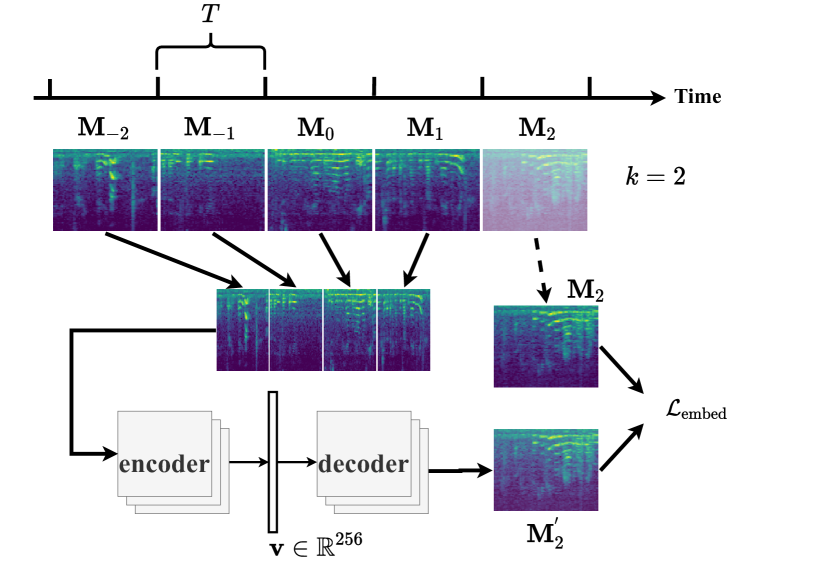
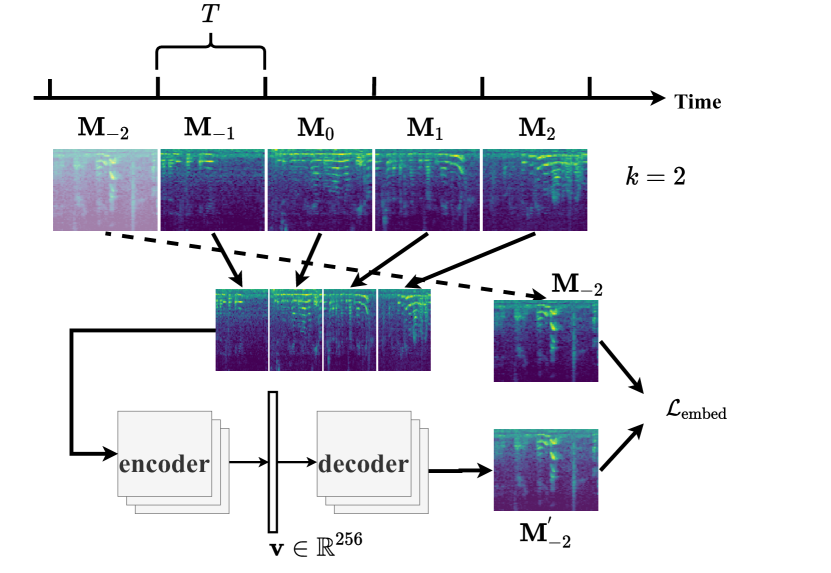
Generative Strategy
In addition to generating the center spectrogram given the context, we conduct experiments to compare the performance of two different generative strategies: forward and backward. In the forward strategy (Figure 6(a)), we predict the last spectrogram with all previous ones in the sample, while in the backward strategy (Figure 6(b)), the first spectrogram is treated as prediction target. Results in Table 6 indicate that generating the center spectrogram performs the best among three different patterns. It’s probably because that the center strategy combines both forward and backward ones and benefits from it. Furthermore, the backward strategy outperforms the forward one, probably because it’s harder to figure out the cause (backward) than the result (forward), and a harder pretraining process is beneficial to the downstream task depression detection.
| Classification | Regression | ||||
| pattern | Pre | Rec | F1 | MAE | RMSE |
| center | 0.93 | 0.96 | 0.94 | 4.75 | 5.73 |
| backward | 0.91 | 0.89 | 0.90 | 5.38 | 6.24 |
| forward | 0.89 | 0.85 | 0.87 | 5.47 | 6.47 |
7. Conclusion
This work proposes DEPA, an audio embedding pretraining method for automatic depression detection. An encoder-decoder model is trained in a self-supervised fashion to predict and reconstruct a center spectrogram given a spectrogram context. Then, DEPA is extracted from a trained encoder model and fed into a depression detection BLSTM network. DEPA exhibits an excellent performance compared to traditional LMS, STFT, HCVP, x-vector, and other commonly used features. DEPA pretrained on In-domain DAIC suggests a significantly better result on detection presence detection using STFT features (DAIC F1 0.90, MDD F1 0.94) compared to LMS features (DAIC F1 0.68, MDD F1 0.71) as well as other approaches without DEPA. Pretraining on large datasets, e.g. DEPA on AD reached F1 0.94 & MAE 4.75, further shows that additional out-domain data is beneficial to depression detection research. Results validated on MDD also illustrate performance enhancement with DEPA’s superior capability of summarizing sequences. DEPA can be a generalized method for similar tasks that need to summarize long sequences given a single output label, for e.g. most medical applications of audio classification including dementia, Parkinson’s disease.
8. Acknowledgements
This work has been supported by National Natural Science Foundation of China (No.61901265), Shanghai Pujiang Program (No.19PJ1406300), State Key Laboratory of Media Convergence Production Technology and Systems Project (No.SKLMCPTS2020003) and Shanghai Municipal Science and Technology Major Project (2021SHZDZX0102). We thank our collaboration with Bio-X Institute, Shanghai Jiao Tong University for the permission to use MDD dataset. Experiments have been carried out on the PI supercomputer at Shanghai Jiao Tong University. Experiments have been carried out on the PI supercomputer at Shanghai Jiao Tong University.
References
- (1)
- Al Hanai et al. (2018) Tuka Al Hanai, Mohammad Ghassemi, and James Glass. 2018. Detecting Depression with Audio/Text Sequence Modeling of Interviews. In Proc. Interspeech 2018. 1716–1720. https://doi.org/10.21437/Interspeech.2018-2522
- Aytar et al. (2016) Yusuf Aytar, Carl Vondrick, and Antonio Torralba. 2016. Soundnet: Learning sound representations from unlabeled video. In Advances in Neural Information Processing Systems.
- Chen et al. (2020) Ting Chen, Simon Kornblith, Mohammad Norouzi, and Geoffrey Hinton. 2020. A simple framework for contrastive learning of visual representations. In . International conference on machine learning. PMLR, 1597–1607.
- Cummins et al. (2014) Nicholas Cummins, Julien Epps, Vidhyasaharan Sethu, and Jarek Krajewski. 2014. Variability compensation in small data: Oversampled extraction of i-vectors for the classification of depressed speech. In 2014 IEEE International Conference on Acoustics, Speech and Signal Processing (ICASSP). IEEE, 970–974.
- Degottex et al. (2014) Gilles Degottex, John Kane, Thomas Drugman, Tuomo Raitio, and Stefan Scherer. 2014. COVAREP—A collaborative voice analysis repository for speech technologies. In 2014 ieee international conference on acoustics, speech and signal processing (icassp). IEEE, 960–964.
- DeVault et al. (2014) David DeVault, Ron Artstein, Grace Benn, Teresa Dey, Ed Fast, Alesia Gainer, Kallirroi Georgila, Jon Gratch, Arno Hartholt, Margaux Lhommet, Gale Lucas, Stacy Marsella, Fabrizio Morbini, Angela Nazarian, Stefan Scherer, Giota Stratou, Apar Suri, David Traum, Rachel Wood, Yuyu Xu, Albert Rizzo, and Louis-Philippe Morency. 2014. SimSensei Kiosk: A Virtual Human Interviewer for Healthcare Decision Support. In Proceedings of the 2014 International Conference on Autonomous Agents and Multi-agent Systems (Paris, France) (AAMAS ’14). International Foundation for Autonomous Agents and Multiagent Systems, Richland, SC, 1061–1068. http://dl.acm.org/citation.cfm?id=2615731.2617415
- Devlin et al. (2018) Jacob Devlin, Ming-Wei Chang, Kenton Lee, and Kristina Toutanova. 2018. Bert: Pre-training of deep bidirectional transformers for language understanding. arXiv preprint arXiv:1810.04805 (2018).
- Egas López et al. (2019) José Vicente Egas López, László Tóth, Ildikó Hoffmann, János Kálmán, Magdolna Pákáski, and Gábor Gosztolya. 2019. Assessing Alzheimer’s Disease from Speech Using the i-vector Approach. In Speech and Computer, Albert Ali Salah, Alexey Karpov, and Rodmonga Potapova (Eds.). Springer International Publishing, Cham, 289–298.
- Godfrey et al. (1992) John J Godfrey, Edward C Holliman, and Jane McDaniel. 1992. SWITCHBOARD: Telephone speech corpus for research and development. In [Proceedings] ICASSP-92: 1992 IEEE International Conference on Acoustics, Speech, and Signal Processing, Vol. 1. IEEE, 517–520.
- Han et al. (2020) Tengda Han, Weidi Xie, and Andrew Zisserman. 2020. Self-supervised co-training for video representation learning. arXiv preprint arXiv:2010.09709 (2020).
- Haque et al. (2018) Albert Haque, Michelle Guo, Adam S Miner, and Li Fei-Fei. 2018. Measuring Depression Symptom Severity from Spoken Language and 3D Facial Expressions. arXiv preprint arXiv:1811.08592 (2018).
- He et al. (2020) Kaiming He, Haoqi Fan, Yuxin Wu, Saining Xie, and Ross Girshick. 2020. Momentum contrast for unsupervised visual representation learning. In . Proceedings of the IEEE/CVF Conference on Computer Vision and Pattern Recognition. 9729–9738.
- Li et al. (2019) X Li, Q Qiu, Y Yang, L Sun, M Jiang, C Gu, M Cui, and X Lin. 2019. Building A Continuous Dementia Management Model In Communities Of Shanghai. 3 (2019).
- Ma et al. (2016) Xingchen Ma, Hongyu Yang, Qiang Chen, Di Huang, and Yunhong Wang. 2016. Depaudionet: An efficient deep model for audio based depression classification. In Proceedings of the 6th International Workshop on Audio/Visual Emotion Challenge. 35–42.
- Owens and Efros (2018) Andrew Owens and Alexei A Efros. 2018. Audio-visual scene analysis with self-supervised multisensory features. In Proceedings of the European Conference on Computer Vision (ECCV). 631–648.
- Pennington et al. (2014) Jeffrey Pennington, Richard Socher, and Christopher D Manning. 2014. GloVe: Global Vectors for Word Representation. In Empirical Methods in Natural Language Processing (EMNLP). 1532–1543. http://www.aclweb.org/anthology/D14-1162
- Peters et al. (2018) Matthew E. Peters, Mark Neumann, Mohit Iyyer, Matt Gardner, Christopher Clark, Kenton Lee, and Luke Zettlemoyer. 2018. Deep contextualized word representations. In Proc. of NAACL.
- Povey et al. (2011) Daniel Povey, Arnab Ghoshal, Gilles Boulianne, Lukas Burget, Ondrej Glembek, Nagendra Goel, Mirko Hannemann, Petr Motlicek, Yanmin Qian, Petr Schwarz, et al. 2011. The Kaldi speech recognition toolkit. In IEEE 2011 workshop on automatic speech recognition and understanding. IEEE Signal Processing Society.
- Rejaibi et al. (2019a) Emna Rejaibi, Daoud Kadoch, Kamil Bentounes, Romain Alfred, Mohamed Daoudi, Abdenour Hadid, and Alice Othmani. 2019a. Clinical Depression and Affect Recognition with EmoAudioNet. CoRR (2019).
- Rejaibi et al. (2019b) Emna Rejaibi, Ali Komaty, Fabrice Meriaudeau, Said Agrebi, and Alice Othmani. 2019b. MFCC-based Recurrent Neural Network for Automatic Clinical Depression Recognition and Assessment from Speech. arXiv preprint arXiv:1909.07208 (2019).
- Rouditchenko et al. (2019) Andrew Rouditchenko, Hang Zhao, Chuang Gan, Josh McDermott, and Antonio Torralba. 2019. Self-supervised audio-visual co-segmentation. In ICASSP 2019-2019 IEEE International Conference on Acoustics, Speech and Signal Processing (ICASSP). IEEE, 2357–2361.
- Salekin et al. (2018) Asif Salekin, Jeremy W Eberle, Jeffrey J Glenn, Bethany A Teachman, and John A Stankovic. 2018. A weakly supervised learning framework for detecting social anxiety and depression. Proceedings of the ACM on interactive, mobile, wearable and ubiquitous technologies 2, 2 (2018), 1–26.
- Snyder et al. (2018) David Snyder, Daniel Garcia-Romero, Gregory Sell, Daniel Povey, and Sanjeev Khudanpur. 2018. X-vectors: Robust dnn embeddings for speaker recognition. In 2018 IEEE International Conference on Acoustics, Speech and Signal Processing (ICASSP). IEEE, 5329–5333.
- Stepanov et al. (2018) Evgeny A Stepanov, Stephane Lathuiliere, Shammur Absar Chowdhury, Arindam Ghosh, Radu-Laurenţiu Vieriu, Nicu Sebe, and Giuseppe Riccardi. 2018. Depression severity estimation from multiple modalities. In 2018 IEEE 20th International Conference on e-Health Networking, Applications and Services (Healthcom). IEEE, 1–6.
- Tagliasacchi et al. (2019) Marco Tagliasacchi, Beat Gfeller, Félix de Chaumont Quitry, and Dominik Roblek. 2019. Self-supervised audio representation learning for mobile devices. arXiv preprint arXiv:1905.11796 (2019).
- Valstar et al. (2016) Michel Valstar, Jonathan Gratch, Björn Schuller, Fabien Ringeval, Denis Lalanne, Mercedes Torres Torres, Stefan Scherer, Giota Stratou, Roddy Cowie, and Maja Pantic. 2016. AVEC 2016: Depression, Mood, and Emotion Recognition Workshop and Challenge. In Proceedings of the 6th International Workshop on Audio/Visual Emotion Challenge (Amsterdam, The Netherlands) (AVEC ’16). Association for Computing Machinery, New York, NY, USA, 3–10. https://doi.org/10.1145/2988257.2988258
- Williamson et al. (2016) James R Williamson, Elizabeth Godoy, Miriam Cha, Adrianne Schwarzentruber, Pooya Khorrami, Youngjune Gwon, Hsiang-Tsung Kung, Charlie Dagli, and Thomas F Quatieri. 2016. Detecting depression using vocal, facial and semantic communication cues. In Proceedings of the 6th International Workshop on Audio/Visual Emotion Challenge. 11–18.
- Zhao et al. (2018) Hang Zhao, Chuang Gan, Andrew Rouditchenko, Carl Vondrick, Josh H. McDermott, and Antonio Torralba. 2018. The Sound of Pixels. CoRR abs/1804.03160 (2018). arXiv:1804.03160 http://arxiv.org/abs/1804.03160