How to Fuel an AGN: Mapping Circumnuclear Gas in NGC 6240 with ALMA
Abstract
Dynamical black hole mass measurements in some gas-rich galaxy mergers indicate that they are overmassive relative to their host galaxy properties. Overmassive black holes in these systems present a conflict with the standard progression of galaxy merger - quasar evolution; an alternative explanation is that a nuclear concentration of molecular gas driven inward by the merger is affecting these dynamical black hole mass estimates. We test for the presence of such gas near the two black holes in NGC 6240 using long-baseline ALMA Band 6 observations (beam size 006 003 or 30 pc15 pc). We find (4.2-9.8) M☉ and (1.2-7.7) M☉ of molecular gas within the resolution limit of the original black hole mass measurements for the north and south black holes, respectively. In the south nucleus, this measurement implies that 6-89% of the original black hole mass measurement actually comes from molecular gas, resolving the tension in the original black hole scaling relations. For the north, only 5% to 11% is coming from molecular gas, suggesting the north black hole is actually overmassive. Our analysis provides the first measurement of significant molecular gas masses contaminating dynamical black hole mass measurements. These high central molecular gas densities further present a challenge to theoretical black hole accretion prescriptions, which often assume accretion proceeds rapidly through the central 10 pc.
1 Introduction
Virtually every massive galaxy hosts a supermassive black hole at its center (e.g. Heckman & Best, 2014). Using stellar and gas kinematics from adaptive optics assisted near-infrared integral field spectroscopy, Medling et al. (2015) measured dynamical masses of eleven black holes in nearby gas-rich major galaxy mergers and found the sample to be significantly overmassive relative to three black hole scaling relations: the M - relation (Ferrarese & Merritt, 2000; Gebhardt et al., 2000; Tremaine et al., 2002), the M - L relation (Marconi & Hunt, 2003), and the M - M∗ relation (Kormendy & Richstone, 1995; Magorrian et al., 1998). Finding overmassive black holes in ongoing mergers is surprising because we expect the optical quasar phase to happen at the end of a galaxy merger (e.g. Sanders et al., 1988; Sanders & Mirabel, 1996; Hopkins et al., 2008); thus, we expect that these black holes could still grow significantly in the next few hundred million years. However, dynamical measurements only measure the total mass enclosed within the spatial resolution of the data; other mass from nuclear star clusters or gas must be subtracted to recover the true black hole mass. In this Letter, we will use our ALMA observations to quantify how much gas mass is contaminating the M measurements of Medling et al. (2015).
NGC 6240 (16h52m58.9s +02d24m03s, z = 0.0243, log(L/L; e.g. Kim et al., 2013) is a nearby gas-rich major merger hosting an active galactic nucleus (AGN) in both nuclei (“north” and “south”), separated by 735 pc (15; Komossa et al., 2003; Max et al., 2007). Each nucleus hosts a small stellar disk (effective radii 350140 pc and 501 pc for north and south disks, respectively; Medling et al., 2014). Dynamical mass measurements of the black holes using the kinematics of these stellar disks found them overmassive by up to an order of magnitude relative to those expected from black hole scaling relations, placing the north black hole at 8.8 M☉ and the south in the range (8.7-20) M☉ (Medling et al., 2011, 2015). However, these measurements could be high if significant molecular gas surrounds the black holes, which would inflate the dynamical mass measurement. Confirming these black hole masses is important for understanding how systems evolve along black hole scaling relations.
These long-baseline observations can resolve gas down to 15 pc scales, below the resolutions of the previous black hole mass measurements (FWHM 27 pc). Using NGC 6240 as a test case, we will assess for the first time whether dynamical black hole mass measurements might be biased by the nuclear fuel reservoirs of the AGN themselves.
Throughout this work we adopt km s-1 Mpc-1, = 0.28, and = 0.72 (Hinshaw et al., 2009). The physical scale is thus 490 pc arcsec-1, calculated using Ned Wright’s Cosmology Calculator111Available at http://www.astro.ucla.edu/~wright/CosmoCalc.html. (Wright, 2006).
2 Mapping CO(2-1) with ALMA
at High Spatial Resolution
We use long-baseline Band 6 imaging of CO(2-1) from ALMA, combining programs 2015.1.00370.S (PI: Treister) and 2015.1.00003.S (Saito et al., 2018). These observations from 2016 and 2017 span five different array configurations with baselines ranging from 15.1 to 14,969 m, for a total time on source of 44.5 minutes. We reduced the data according to the standard ALMA data pipeline process222https://almascience.nrao.edu/processing/science-pipeline with scaling according to measurements of ALMA’s water vapor radiometers (Maud et al., 2017) and additional self-calibration steps. The final spatial resolution of the dataset is 006 003 (30 pc 15 pc). Full details of the reduction can be found in Treister et al. (2019, submitted). As described in Treister et al. (2019, submitted), the longest baseline observations have poorer phase stability than the others; poor phase stability means that not all flux might be recovered. Removing these observations from the reduction reduces the resolution beyond what we need for the science goals described here, but we do so for comparison to estimate how much missing flux is affecting our high-resolution cube. Compared to two different reductions (natural and Briggs-weighted with robust=1) of the lower-resolution cube, our high-resolution flux densities in the smallest apertures change by 3-20%. Because the fraction of flux we lose from the longest baseline observations depends on the spatial distribution of the gas itself, we apply no correction and simply note that, if anything, we expect our flux measurements to be low and thus our masses conservative.
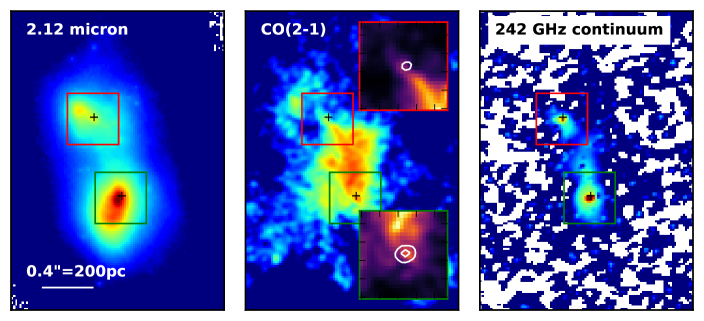
Figure 1 shows the CO(2-1) flux density map with 242 GHz restframe continuum contours overlaid in white identifying the locations of the two AGN. The continuum map shows two peaks aligned with the locations of the AGN (measured from X-ray and radio; Max et al., 2007) that are resolved into extended structures. The CO(2-1) emission, on the other hand, follows a clumpy ribbon between the nuclei and gives little clue to the locations of the nuclei. This ribbon is also detected in continuum, but it is much fainter than the nuclei. The complex structure of the CO data are analyzed in depth in Treister et al. (2019, submitted); here we focus only on the flux and mass within the black holes’ spheres of influence.
3 Results: How Much of an AGN’s Measured Mass is Molecular Gas?
3.1 Previous Insights into Central Gas Masses
Many hydrodynamic simulations of galaxies use subgrid prescriptions based on Bondi-Hoyle accretion (Bondi & Hoyle, 1944; Bondi, 1952; Springel et al., 2005), which relies on the assumption that gas accreting onto the black hole has no net angular momentum. On the contrary, high-resolution simulations (Mayer et al., 2007) and observations (e.g. Downes & Solomon, 1998; Bryant & Scoville, 1999; Sakamoto et al., 1999; Medling et al., 2014) both show that gas-rich systems form gaseous nuclear disks on scales of a few tens of parsecs, reaching scales at least down to the torus scale (a few parsecs; e.g. Gallimore et al., 2016; García-Burillo et al., 2016; Davis et al., 2017, 2018; Imanishi et al., 2018; Izumi et al., 2018; Alonso-Herrero et al., 2018, 2019; Combes et al., 2019). Gas accreting onto the black hole must therefore dissipate its angular momentum in the process. Viscosity in these parsec-scale gas disks is likely the dominant mechanism for removing angular momentum, and can delay accretion of most of the gas by a viscous timescale (Power et al., 2011; Wurster & Thacker, 2013), which in supermassive black hole systems can reach up to a Hubble time (King, 2008).
Three-dimensional radiation-hydrodynamic simulations of AGN-driven fountains estimate that the cold gas (40 K) within r16 pc totals about 50% of the black hole mass (Wada, 2012; Wada et al., 2016). Additionally, recent long-baseline ALMA observations of Arp 220’s west nucleus show that about half of the dynamical mass (7 out of 1.5 M☉) within 70 pc can be attributed to molecular gas (Scoville et al., 2017). Combes et al. (2019) present a recent suite of ALMA observations of Seyfert nuclei on 6-27 pc scales, finding that molecular mass can also account for the majority of their dynamical masses at these radii. However, we note that dynamical black hole mass measurements in several early-type galaxies using ALMA found negligible contributions from molecular gas in their nuclear regions (e.g. Barth et al., 2016; Davis et al., 2018; Boizelle et al., 2019)
3.2 Measuring the Central Gas Mass Profiles in NGC 6240
Because H2 lacks a permanent dipole moment, its pure rotational transitions are forbidden; asymmetric proxy molecules like CO are often used instead, but their use can be contentious. We therefore measure the mass in two independent ways: by using an conversion from the CO(2-1) emission and by converting the dust continuum to a gas mass by assuming a dust-to-gas ratio, described in the following paragraphs.
To measure the mass from the CO(2-1) emission, we use the conversion factor calibrated for NGC 6240 by Cicone et al. (2018) to translate L to total molecular mass, including both H2 and helium. They use spatially resolved measurements of [C I] – and CO(1-0) taken with ALMA to calculate directly in a spatially varying manner, and for systemic vs outflowing gas; they incorporate the CO(2-1) observations described here to provide a spatially resolved calculation of . We use the luminosities measured in their central box (2″ 2″, which contains both black holes), which produce M☉ (K km s-1 pc2)-1 and , resulting in a final M☉ (K km s-1 pc2)-1. We note these quantities refer to the total gas reservoir within the central box, including both outflow and non-outflow components, which are heavily blended in these central resolutions at the spatial resolution of the Cicone et al. (2018) data.
Continuum emission in the submillimeter regime probes the Rayleigh-Jeans tail of the far-infrared dust emission. We use the calibrated relation between continuum flux density and H2 mass of Scoville et al. (2016)333Using measurements of L from Klaas et al. (2001) and M from Cicone et al. (2018), we find that NGC 6240 globally has a calibration about 2 above that of Scoville et al. (2016). However, the majority of the ISM in NGC 6240, between the nuclei, is undergoing a strong shock that likely affects the global ratio strongly (e.g. Meijerink et al., 2013). We suspect that the nuclei are more typical and therefore better represented by the Scoville et al. (2016) calibration.. This calibration has updated their earlier relations (Scoville et al., 2015) to include helium mass in the H2 mass and a larger sample of test galaxies. However, because the global relation of Scoville et al. (2016) assumes a dust temperature of 25 K, we scale the relation linearly to a mass-weighted dust temperature of 100 K, following the assumption made in Arp 220’s nuclear regions on similar scales (Scoville et al., 2015). If the mean-weighted dust temperature is higher, the corresponding implied molecular gas mass will be lower by the same factor. In the subsequent calculations, we include the statistical errors from the Scoville et al. (2016) conversion, but do not include an extra term to account for errors in the dust temperature, beyond the aforementioned scaling.
Synchrotron emission from the AGN could also be contributing meaningfully to the continuum flux at such small spatial scales. We estimate and subtract the synchrotron emission by scaling the MERLIN 5 GHz central beam flux from Beswick et al. (2001) using a spectral index of based on peak emission obtained from the Very Large Array (VLA) at 8.4 GHz (Carral et al., 1990) and 15 GHz (Colbert et al., 1994). Note that VLBA observations at 2.4 GHz and 8.4 GHz (Gallimore & Beswick, 2004) predict an upper limit for the spectral index between these frequencies of -1.8 and -0.2 for the north and south nuclei, respectively, based on nondetections at 8.4 GHz. However, the angular resolution of our ALMA observations include the point sources detected with VLBA plus some extended emission detected by MERLIN and the VLA; a matched resolution observation of the continuum at lower frequencies is needed to more precisely measure the synchrotron contribution at 242 GHz (e.g. with long-baseline ALMA band 3 and ngVLA observations). Using these best-available observations, the contributions here to our 242 GHz continuum are Jy and Jy for the north and south nuclei, respectively. These fluxes are subtracted from our measured continuum fluxes before converting to gas mass.
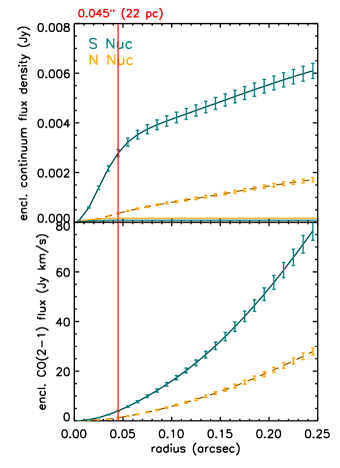
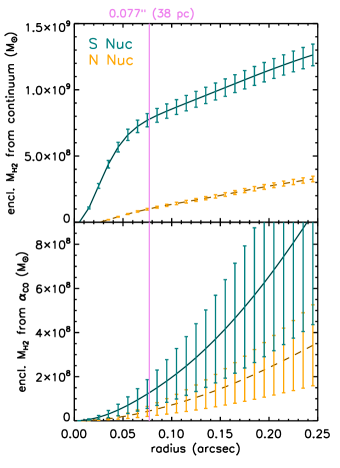
In Figure 2 we show the enclosed continuum and CO(2-1) flux profiles and the corresponding derived enclosed mass profiles. The south nucleus is considerably brighter in both CO(2-1) and continuum emission than the north nucleus. The continuum flux also shows a more definitive knee in the radial profile, suggesting that it traces a distinct nuclear mass of gas. The CO(2-1) emission might instead be contaminated by the gas bridge that connects the nuclei, where the bulk of the H2 mass resides (Treister et al. 2019, submitted). The difference in morphology between CO(2-1) and continuum demonstrates the major uncertainty in measuring H2 mass. That is, the assumptions that went into each of our mass calculations somewhere break down, and NGC 6240 might exhibit a spatially varying , dust temperature, and/or dust-to-gas ratio. However, these two mass estimates only differ by a factor of a few, so we propagate both estimates through our calculations and use them as an indication of our systematic error in the correction. We further note that we estimate the molecular gas mass present on these scales rather than the total gas mass; i.e. we are assuming that the molecular gas phase and the black hole account for all of our previously measured dynamical masses.
We further note an additional uncertainty: we are measuring circumnuclear flux in projection and assuming that it corresponds to all the circumnuclear mass; in truth, these fluxes are upper limits to the amount of flux emitted by gas in the nuclei themselves. The continuum emission is spatially concentrated on the nuclei and therefore is probably truly circumnuclear rather than a projection effect. However, the CO(2-1) emission map (Figure 1) is much more complex. As discussed in Treister et al. (2019, submitted), the kinematics of the CO in the nuclei do not appear to match the kinematics of the stellar nuclear disks from Medling et al. (2015), which would have strongly suggested a nuclear nature. Instead, we consider two possibilities: either the CO-emitting gas is still circumnuclear but has non-Keplerian kinematics (perhaps in the process of being stirred up / ejected by the AGN), or some/all of the CO-emitting gas is merely in projection and should not be included in our circumnuclear gas mass measurements. Therefore, one might consider the CO-implied mass measurement an upper limit. Because the continuum-implied mass profiles are higher in both nuclei, the caveats around CO should not change our conclusions.
3.3 Interpreting the Central Gas Masses
The original OSIRIS adaptive optics integral field spectroscopy used to measure the black hole masses by Medling et al. (2015) had a plate scale of 0035 pixel-1. The best resolution achievable by this plate scale is 0077 (38 pc), a Nyquist sampling of 2.2 pixels. We therefore set 38 pc as our aperture in Figure 2 to calculate the gas masses contaminating the original OSIRIS measurements (Table 1). We find M☉ of gas (from the continuum emission) and M☉ of gas (from the CO emission) for the north nucleus and M☉ of gas (from the continuum emission) and M☉ of gas (from the CO emission) for the south nucleus. This gas mass implies that 5%-11% (6%-89%) of the original dynamical mass measurement of the north (south) black hole is actually contamination by gas.
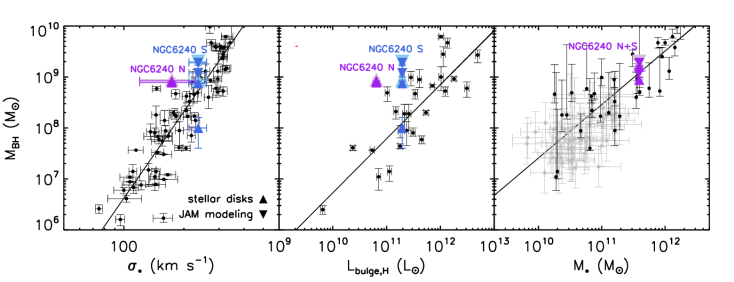
By correcting for the gas mass, the new black hole masses fall closer to traditional black hole scaling relations (Figure 3). The large correction to the south black hole’s mass (blue in Figure 3) draws its measurement comfortably into the scatter of scaling relations for quiescent elliptical galaxies. The correction to the north black hole’s mass is comparatively minor, and is insufficient to resolve its tension. However, we note that the sum of the north and south black holes’ corrected masses is still consistent with that expected from the stellar mass of the combined system – that is, if there were no new star formation or black hole growth during the rest of the merger, the final system would lie on the M - M∗ relation. The remaining tension in the north black hole’s mass in Figure 3a,b may therefore instead be due to the unsettled nature of the corresponding bulge while the merger is ongoing. More spatially resolved submillimeter observations of similar black holes are needed in order to determine which scenario is more typical.
| North Nucleus (Disk Model) | South Nucleus (Disk Model) | South Nucleus (JAM Model) | |
|---|---|---|---|
| Dynamical M (M☉)aaCentral dynamical masses were reported as black hole masses in Medling et al. (2015) using Keplerian disk models and/or Jeans Axisymmetric Mass models. | |||
| Continuum flux (Jy)bbEnclosed fluxes and gas masses are measured using an aperture of radius 0077 (38 pc), the resolution limit of the original dynamical mass measurements in Medling et al. (2015). In both cases, the molecular mass includes He. The continuum flux is converted to gas mass following the relation of Scoville et al. (2016), scaled to dust temperatures of 100 K in the nuclei, after subtracting the potential synchrotron contribution. The CO flux is converted to gas mass using M☉ (K km s-1 pc2)-1, calibrated for NGC 6240 by Cicone et al. (2018). | |||
| Synchrotron contribution (Jy)ccEstimated synchrotron contribution to continuum fluxes, based on 5 GHz emission from Beswick et al. (2001) scaled by , the spectral index measured from VLA 8.4 GHz (Carral et al., 1990) and 15 GHz (Colbert et al., 1994) observations. | |||
| M (M☉)bbEnclosed fluxes and gas masses are measured using an aperture of radius 0077 (38 pc), the resolution limit of the original dynamical mass measurements in Medling et al. (2015). In both cases, the molecular mass includes He. The continuum flux is converted to gas mass following the relation of Scoville et al. (2016), scaled to dust temperatures of 100 K in the nuclei, after subtracting the potential synchrotron contribution. The CO flux is converted to gas mass using M☉ (K km s-1 pc2)-1, calibrated for NGC 6240 by Cicone et al. (2018). | |||
| M (M☉)ddCorrected M is calculated by subtracting M from M. | |||
| M Correction | 11.1% | 88.5% | 38.5% |
| CO(2-1) flux (Jy km s-1)bbEnclosed fluxes and gas masses are measured using an aperture of radius 0077 (38 pc), the resolution limit of the original dynamical mass measurements in Medling et al. (2015). In both cases, the molecular mass includes He. The continuum flux is converted to gas mass following the relation of Scoville et al. (2016), scaled to dust temperatures of 100 K in the nuclei, after subtracting the potential synchrotron contribution. The CO flux is converted to gas mass using M☉ (K km s-1 pc2)-1, calibrated for NGC 6240 by Cicone et al. (2018). | |||
| M (M☉)bbEnclosed fluxes and gas masses are measured using an aperture of radius 0077 (38 pc), the resolution limit of the original dynamical mass measurements in Medling et al. (2015). In both cases, the molecular mass includes He. The continuum flux is converted to gas mass following the relation of Scoville et al. (2016), scaled to dust temperatures of 100 K in the nuclei, after subtracting the potential synchrotron contribution. The CO flux is converted to gas mass using M☉ (K km s-1 pc2)-1, calibrated for NGC 6240 by Cicone et al. (2018). | |||
| M (M☉)ddCorrected M is calculated by subtracting M from M. | |||
| M Correction | 4.8% | 14.0% | 6.1% |
3.4 Accretion Rates and Depletion Timescales
Puccetti et al. (2016) used Chandra and NuSTAR X-ray spectroscopy to model the accretion rates of the two black holes, and found intrinsic bolometric luminosities of 2.6 erg s-1 and 8 erg s-1 for the north and south nuclei, respectively. Using L c2 and assuming an energy efficiency of 10%, we convert to a mass accretion rate of 0.05 and 0.14 M☉ yr-1 for the north and south nuclei. Assuming no replenishment, if all of the measured gas mass is accreted onto the black holes at this rate, the depletion timescales are therefore roughly 2 Gyr for the north and 5 Gyr for the south. These timescales are significantly longer than a typical merger timescale, suggesting either that the accretion rate will increase or that some gas mass will be ejected (or both), unless considerable circumnuclear gas remains after the system is relaxed. Indeed, post-starburst or early-type galaxies can still have nuclear reservoirs, but because they are not as likely to host an AGN as ongoing gas-rich mergers, it is plausible to imagine their nuclear reservoirs have been substantially reduced.
Averaging between continuum and CO(2-1) measurements, the gas mass in the south nucleus is approximately five times higher than that in the north. The bolometric luminosities and therefore mass accretion rates differ by a factor of about three in the same sense. A larger sample of black holes will show how closely the central molecular gas mass tracks the mass accretion rate of the black hole.
3.5 Caveats to the Black Hole Mass Measurements
This Letter in general assumes that the dynamical mass measurements of (Medling et al., 2015) are correct and looks for additional contributions to the central point masses. However, here we consider briefly some caveats associated with the original dynamical mass measurements, which use both Keplerian disk models and Jeans Axisymmetric Mass models (JAM; Cappellari, 2008). The disk models assume entirely coplanar circular orbits; the JAM models include velocity anisotropy but are still axisymmetric. Although Medling et al. (2011, 2014, 2015) show evidence that the stellar dynamics within the sphere of influence of the black hole are relatively relaxed and disky, the systems are overall highly unvirialized and could contain complex orbits unaccounted for in the original modeling. However, we stress that if the young stars are in a relaxed disk, the most stable dynamical state for the gas is too.
The models of Medling et al. (2015) attempt to account for all (resolved) smoothly varying contributions to the mass profile. That is, rather than assuming a (fixed or varying) mass-to-light ratio from the stellar light, they match the kinematics to a simple power-law mass profile to fit both the scaling factor and the index. Although the stellar light from their imaging varies smoothly, our high-resolution CO(2-1) imaging shows that the CO is neither axisymmetric nor necessarily smoothly varying (although the continuum emission plausibly is). If the CO is a more accurate tracer of the molecular gas and represents a dynamically important component to the mass profile, the assumptions of Medling et al. (2015) might break down. However, we also note that the mass profiles measured by Medling et al. (2015) are dominated by the central point sources (the rest of the galaxy within the fitting region, 100pc, making up roughly 10% of the mass). Thus, errors in the details of the external gas or stellar distributions likely do not strongly affect the measured central point masses.
4 Conclusions
We use long-baseline ALMA CO(2-1) and continuum measurements of the two nuclei of NGC 6240 to map the molecular gas within 40 pc of each black hole. Our two independent molecular gas mass measurement techniques identify a substantial mass of gas below the spatial resolution limit of the original dynamical M measurements that could not be distinguished from the black holes. In the south nucleus, and in the sum of the two, these corrections are sufficient to reduce the implied black hole masses to within the scatter of black hole scaling relations.
Our data confirm that molecular gas can play a substantial role in fueling AGN on tens of parsec scales, and reveal that dynamical black hole mass measurements must resolve this small scale – or correct for the gas mass present – to measure accurate black hole masses. The two black holes in this work show different levels of correction, with gas masses making up 5%-11% of the original black hole mass measurement in the north and 6%-89% in the south black hole. Future long-baseline ALMA data of dynamically measured black hole masses will indicate which level of correction is more typical. The amount of gas near a quiescent black hole could be minimal compared to that around a gas-rich obscured AGN like NGC 6240; this variability must be characterized before statistical corrections can be made to other black hole mass measurements.
The measured gas masses differ by a factor of five between NGC 6240’s two nuclei, a larger difference than the ratio of their bolometric luminosities (approximately three). If the gas mass in the central few tens of parsecs is instrumental in fueling the AGN (on short timescales), it may correlate well with the mass accretion rate of the black hole – similar observations of a larger sample will test this prediction. A substantial mass of gas within a black hole sphere of influence is likely to form a viscous accretion disk, which has important implications for subgrid prescriptions of black hole accretion rates in hydrodynamical simulations and for the timescales associated with accretion and feedback: a Bondi-Hoyle type accretion prescription will substantially overestimate the accretion rates.
ADS/JAO.ALMA#2015.1.00003.S. ALMA is a partnership of ESO (representing its member states), NSF (USA) and NINS (Japan), together with NRC (Canada) and NSC and ASIAA (Taiwan) and KASI (Republic of Korea), in cooperation with the Republic of Chile. The Joint ALMA Observatory is operated by ESO, AUI/NRAO and NAOJ. The National Radio Astronomy Observatory is a facility of the National Science Foundation operated under cooperative agreement by Associated Universities, Inc. Some of the data presented herein were obtained at the W. M. Keck Observatory, which is operated as a scientific partnership among the California Institute of Technology, the University of California and the National Aeronautics and Space Administration. The Observatory was made possible by the generous financial support of the W. M. Keck Foundation. We enthusiastically thank the staff of the W. M. Keck Observatory and its AO team for their dedication and hard work. The analysis presented herein was initiated at the Aspen Center for Physics, which is supported by National Science Foundation grant PHY-1607611. AMM, GCP, LBM, ET, and NS also thank the Sexten Center for Astrophysics, where the bulk of this paper was written.
References
- Alonso-Herrero et al. (2018) Alonso-Herrero, A., Pereira-Santaella, M., García-Burillo, S., et al. 2018, ApJ, 859, 144, doi: 10.3847/1538-4357/aabe30
- Alonso-Herrero et al. (2019) Alonso-Herrero, A., García-Burillo, S., Pereira-Santaella, M., et al. 2019, A&A, 628, A65, doi: 10.1051/0004-6361/201935431
- Barth et al. (2016) Barth, A. J., Boizelle, B. D., Darling, J., et al. 2016, ApJ, 822, L28, doi: 10.3847/2041-8205/822/2/L28
- Beswick et al. (2001) Beswick, R. J., Pedlar, A., Mundell, C. G., & Gallimore, J. F. 2001, MNRAS, 325, 151, doi: 10.1046/j.1365-8711.2001.04445.x
- Boizelle et al. (2019) Boizelle, B. D., Barth, A. J., Walsh, J. L., et al. 2019, ApJ, 881, 10, doi: 10.3847/1538-4357/ab2a0a
- Bondi (1952) Bondi, H. 1952, MNRAS, 112, 195
- Bondi & Hoyle (1944) Bondi, H., & Hoyle, F. 1944, MNRAS, 104, 273
- Bryant & Scoville (1999) Bryant, P. M., & Scoville, N. Z. 1999, AJ, 117, 2632, doi: 10.1086/300879
- Cappellari (2008) Cappellari, M. 2008, MNRAS, 390, 71, doi: 10.1111/j.1365-2966.2008.13754.x
- Carral et al. (1990) Carral, P., Turner, J. L., & Ho, P. T. P. 1990, ApJ, 362, 434, doi: 10.1086/169280
- Cicone et al. (2018) Cicone, C., Severgnini, P., Papadopoulos, P. P., et al. 2018, ApJ, 863, 143, doi: 10.3847/1538-4357/aad32a
- Colbert et al. (1994) Colbert, E. J. M., Wilson, A. S., & Bland-Hawthorn, J. 1994, ApJ, 436, 89, doi: 10.1086/174883
- Combes et al. (2019) Combes, F., García-Burillo, S., Audibert, A., et al. 2019, A&A, 623, A79, doi: 10.1051/0004-6361/201834560
- Davis et al. (2017) Davis, T. A., Bureau, M., Onishi, K., et al. 2017, MNRAS, 468, 4675, doi: 10.1093/mnras/stw3217
- Davis et al. (2018) —. 2018, MNRAS, 473, 3818, doi: 10.1093/mnras/stx2600
- Downes & Solomon (1998) Downes, D., & Solomon, P. M. 1998, ApJ, 507, 615, doi: 10.1086/306339
- Ferrarese & Merritt (2000) Ferrarese, L., & Merritt, D. 2000, ApJ, 539, L9, doi: 10.1086/312838
- Gallimore & Beswick (2004) Gallimore, J. F., & Beswick, R. 2004, AJ, 127, 239, doi: 10.1086/379959
- Gallimore et al. (2016) Gallimore, J. F., Elitzur, M., Maiolino, R., et al. 2016, ApJ, 829, L7, doi: 10.3847/2041-8205/829/1/L7
- García-Burillo et al. (2016) García-Burillo, S., Combes, F., Ramos Almeida, C., et al. 2016, ApJ, 823, L12, doi: 10.3847/2041-8205/823/1/L12
- Gebhardt et al. (2000) Gebhardt, K., Bender, R., Bower, G., et al. 2000, ApJ, 539, L13, doi: 10.1086/312840
- Heckman & Best (2014) Heckman, T. M., & Best, P. N. 2014, ARA&A, 52, 589, doi: 10.1146/annurev-astro-081913-035722
- Hinshaw et al. (2009) Hinshaw, G., Weiland, J. L., Hill, R. S., et al. 2009, ApJS, 180, 225, doi: 10.1088/0067-0049/180/2/225
- Hopkins et al. (2008) Hopkins, P. F., Hernquist, L., Cox, T. J., & Kereš, D. 2008, ApJS, 175, 356, doi: 10.1086/524362
- Imanishi et al. (2018) Imanishi, M., Nakanishi, K., Izumi, T., & Wada, K. 2018, ApJ, 853, L25, doi: 10.3847/2041-8213/aaa8df
- Izumi et al. (2018) Izumi, T., Wada, K., Fukushige, R., Hamamura, S., & Kohno, K. 2018, ApJ, 867, 48, doi: 10.3847/1538-4357/aae20b
- Kim et al. (2013) Kim, D.-C., Evans, A. S., Vavilkin, T., et al. 2013, ApJ, 768, 102, doi: 10.1088/0004-637X/768/2/102
- King (2008) King, A. 2008, New A Rev., 52, 253, doi: 10.1016/j.newar.2008.06.006
- Klaas et al. (2001) Klaas, U., Haas, M., Müller, S. A. H., et al. 2001, A&A, 379, 823, doi: 10.1051/0004-6361:20011377
- Komossa et al. (2003) Komossa, S., Burwitz, V., Hasinger, G., et al. 2003, ApJ, 582, L15, doi: 10.1086/346145
- Kormendy & Richstone (1995) Kormendy, J., & Richstone, D. 1995, ARA&A, 33, 581, doi: 10.1146/annurev.aa.33.090195.003053
- Magorrian et al. (1998) Magorrian, J., Tremaine, S., Richstone, D., et al. 1998, AJ, 115, 2285, doi: 10.1086/300353
- Marconi & Hunt (2003) Marconi, A., & Hunt, L. K. 2003, ApJ, 589, L21, doi: 10.1086/375804
- Maud et al. (2017) Maud, L. T., Tilanus, R. P. J., van Kempen, T. A., et al. 2017, A&A, 605, A121, doi: 10.1051/0004-6361/201731197
- Max et al. (2007) Max, C. E., Canalizo, G., & de Vries, W. H. 2007, Science, 316, 1877, doi: 10.1126/science.1136205
- Max et al. (2005) Max, C. E., Canalizo, G., Macintosh, B. A., et al. 2005, ApJ, 621, 738, doi: 10.1086/427546
- Mayer et al. (2007) Mayer, L., Kazantzidis, S., Madau, P., et al. 2007, Science, 316, 1874, doi: 10.1126/science.1141858
- Medling et al. (2011) Medling, A. M., Ammons, S. M., Max, C. E., et al. 2011, ApJ, 743, 32, doi: 10.1088/0004-637X/743/1/32
- Medling et al. (2014) Medling, A. M., U, V., Guedes, J., et al. 2014, ApJ, 784, 70, doi: 10.1088/0004-637X/784/1/70
- Medling et al. (2015) Medling, A. M., U, V., Max, C. E., et al. 2015, ApJ, 803, 61, doi: 10.1088/0004-637X/803/2/61
- Meijerink et al. (2013) Meijerink, R., Kristensen, L. E., Weiß, A., et al. 2013, ApJ, 762, L16, doi: 10.1088/2041-8205/762/2/L16
- Power et al. (2011) Power, C., Nayakshin, S., & King, A. 2011, MNRAS, 412, 269, doi: 10.1111/j.1365-2966.2010.17901.x
- Puccetti et al. (2016) Puccetti, S., Comastri, A., Bauer, F. E., et al. 2016, A&A, 585, A157, doi: 10.1051/0004-6361/201527189
- Saito et al. (2018) Saito, T., Iono, D., Ueda, J., et al. 2018, MNRAS, 475, L52, doi: 10.1093/mnrasl/slx207
- Sakamoto et al. (1999) Sakamoto, K., Scoville, N. Z., Yun, M. S., et al. 1999, ApJ, 514, 68, doi: 10.1086/306951
- Sanders & Mirabel (1996) Sanders, D. B., & Mirabel, I. F. 1996, ARA&A, 34, 749, doi: 10.1146/annurev.astro.34.1.749
- Sanders et al. (1988) Sanders, D. B., Soifer, B. T., Elias, J. H., et al. 1988, ApJ, 325, 74, doi: 10.1086/165983
- Scoville et al. (2015) Scoville, N., Sheth, K., Walter, F., et al. 2015, ApJ, 800, 70, doi: 10.1088/0004-637X/800/1/70
- Scoville et al. (2016) Scoville, N., Sheth, K., Aussel, H., et al. 2016, ApJ, 820, 83, doi: 10.3847/0004-637X/820/2/83
- Scoville et al. (2017) Scoville, N., Murchikova, L., Walter, F., et al. 2017, ApJ, 836, 66, doi: 10.3847/1538-4357/836/1/66
- Springel et al. (2005) Springel, V., Di Matteo, T., & Hernquist, L. 2005, MNRAS, 361, 776, doi: 10.1111/j.1365-2966.2005.09238.x
- Tremaine et al. (2002) Tremaine, S., Gebhardt, K., Bender, R., et al. 2002, ApJ, 574, 740, doi: 10.1086/341002
- Wada (2012) Wada, K. 2012, ApJ, 758, 66, doi: 10.1088/0004-637X/758/1/66
- Wada et al. (2016) Wada, K., Schartmann, M., & Meijerink, R. 2016, ApJ, 828, L19, doi: 10.3847/2041-8205/828/2/L19
- Wright (2006) Wright, E. L. 2006, PASP, 118, 1711, doi: 10.1086/510102
- Wurster & Thacker (2013) Wurster, J., & Thacker, R. J. 2013, MNRAS, 431, 539, doi: 10.1093/mnras/stt182