Cold Clouds as Cosmic-Ray Detectors
Abstract
Low energy cosmic-rays (CRs) are responsible for gas heating and ionization of interstellar clouds, which in turn introduces coupling to Galactic magnetic fields. So far the CR ionization rate (CRIR) has been estimated using indirect methods, such as its effect on the abundances of various rare molecular species. Here we show that the CRIR may be constrained from line emission of H2 rovibrational transitions, excited by CRs. We derive the required conditions for CRs to dominate line excitation, and show that CR-excited lines may be detected with the Very Large Telescope (VLT) over 8 hours integration. Our method, if successfully applied to a variety of clouds at different Galactic locations will provide improved constraints on the spectrum of low energy CRs and their origins.
Introduction
The ionization fraction of atomic and molecular clouds is a primary factor in determining the gas evolution: it determines the efficiency of heating and cooling processes, drives the chemistry and molecule formation, and enables coupling to Galactic magnetic fields. Ultraviolet (UV) radiation from starlight provides gas ionization, but this is restricted to localized regions, exposed to intense fluxes in the vicinity of massive stars. For the bulk of the gas in the Galaxy, the ionization is governed by cosmic-rays (CRs) (see Grenier et al. (2015) for a review)
It is the low energy CRs (GeV) that are responsible for gas ionization in the interstellar medium (ISM), however, direct observations from Earth may only probe high energy CRs. Over the past few decades, the CR ionization rate (CRIR), denoted (hereafter is the total number of H2 ionization per molecule, per sec, including both ionizations by CRs and by the secondary electrons produced by CR ionization), was estimated through observations of various molecules and molecular ions in the ISM, such as OH, OH+, H2O+, H, ArH+, etc. When combined with chemical models, these observations constrain the CRIR, yielding typical values ranging from to s-1 in dense and diffuse Galactic clouds Guelin et al. (1982); van der Tak & van Dishoeck (2000); Indriolo & McCall (2012); Neufeld & Wolfire (2017); Bialy et al. (2019); Gaches et al. (2019), and up to s-1 in the Galactic center Le Petit et al. (2016) and in extragalactic sources Indriolo et al. (2018).
However, these determinations rely on the abundances of secondary species and depend on various model assumptions. For example, the gas density, the rate coefficients of the chemical reaction, the fractional abundances of H2, e-, O, CO, etc., the number of clouds along the line-of-sight Dalgarno (2006); Indriolo et al. (2007). Other indirect methods for inferring the CRIR include the analysis of the thermal balance of dust and gas Crapsi et al. (2007); Glassgold et al. (2012); Ivlev et al. (2019), the effect on deuterium fractionation Caselli et al. (1998); Williams et al. (1998); Kong et al. (2015); Shingledecker et al. (2016), and through radio recombination lines Sorochenko & Smirnov (2010); Oonk et al. (2017) and synchrotron radiation Yusef-Zadeh et al. (2013).
The mass of molecular clouds in the ISM is strongly dominated by H2. The gas in molecular clouds is typically cold and the H2 molecules reside mostly in their ground electronic, vibrational and rotational configuration. However, H2 rotational and vibrational transitions have been previously observed in shocked warm gas ( K), where the H2 levels are thermally excited. H2 emission lines are also routinely observed in bright photon-dominated regions (PDRs), in which the H2 is excited by UV pumping. These regions are exposed to abnormally high UV fluxes, , where is the radiation intensity normalized to the mean interstellar radiation field Draine (1978). As we show below, for the more typical conditions of molecular gas in the ISM, i.e., cold ( K) and quiescent (), CRs are expected to dominate H2 excitation.
Numerical computations for H2 excitation by energetic electrons were presented by Tine et al. (1997) and Dalgarno et al. (1999). Excitation by UV photons has been discussed by Black & van Dishoeck (1987) and Sternberg (1988, 1989), and the excitation through the H2 formation process, has been the focus of Le Bourlot et al. (1995), Tiné et al. (2003), and Islam et al. (2010).
In this paper, we show that the CRIR may be determined through observations of line-emission from the main constituent of the cloud mass, H2. The H2 rovibrational levels are excited by interactions with energetic electrons, which are produced by CR ionization. As they radiatively decay they produce line emission in the infrared (IR) that is . We adopt an analytic approach to quantify the conditions required for robust detection of H2 lines that are excited by CRs: (a) we consider the various line excitation mechanisms and their dependence on astrophysical parameters and derive the critical above which CR excitation dominates line emission over UV and formation pumping, and (b) consider the feasibility of line detection above the continuum with state of the art instruments.
[
caption = H2 line emission and excitation for excitation by cosmic-rays (CRs), ultraviolet (UV) radiation, and H2 formation,
notespar,
label = table,
pos = t,
star
]l l l l l l l l — l —— l l l l
H2 Rovibrational transitions. The upper and lower states and are charactarized have vibrational-rotational quantum numbers, , , and different , , as indicated.
For each transition, , and are the transition wavelength, energy, and Einstein coefficient for spontaneous decay.
is the
probability to decay to state given that state is excited.
is the probability for populating state , per CR excitation Gredel & Dalgarno (1995). These values are weakly sensitive to the temperature for K.
(with eV)
is the normalized line brightness, relative to the total line brightness for pure CR excitation.
Correspondingly, and
are the normalized brightness for UV Sternberg (1988) and H2 formation Le Bourlot et al. (1995) excitation (normalized to the total line brightness for pure UV/formation excitation, respectively).
For H2 formation excitation, we consiedred three different H2 formation models, Black & van Dishoeck (1987).
\FLTransition &
(m) (eV)
\ML(1-0)O(2) 0 2 2.63 0.47 8.56 1.00 0.47 45.29 0.94 0.10 0.27 0.66\NN(1-0)Q(2) 2 2 2.41 0.51 3.04 0.36 0.47 17.67 1.01 0.17 0.34 0.88\NN(1-0)S(0) 2 0 2.22 0.56 2.53 0.30 0.47 15.99 0.91 0.16 0.30 0.80\NN(1-0)O(4) 2 4 3.00 0.41 2.91 0.34 0.47 13.57 0.78 0.13 0.26 0.67\ML(1-0)Q(1) 1 1 2.41 0.52 4.30 0.50 0.014 0.76 2.05 0.47 1.10 2.94\NN(1-0)S(1) 3 1 2.12 0.58 3.48 0.42 0.014 0.71 1.86 0.87 1.15 2.82\NN(1-0)O(3) 1 3 2.80 0.44 4.24 0.50 0.014 0.64 1.74 0.41 0.94 2.45\NN(1-0)Q(3) 3 3 2.42 0.51 2.79 0.33 0.014 0.50 1.31 0.61 0.84 1.96\NN(1-0)O(5) 3 5 3.23 0.38 2.09 0.25 0.014 0.28 0.74 0.35 0.46 1.09\LL
Results
Cosmic-ray Pumping
We consider the emission of H2 vibrational transitions from cold molecular clouds, where the vibrational levels are excited by penetrating CRs (and secondary electron). As we discuss below, the line brightness is proportional to the CRIR, and thus may be used to constrain the CRIR inside clouds. Because radiative decay rates are high compared to the excitation rates, any excitation quickly decays back to the initial ground state before encountering the next excitation. Therefore, it is possible to separate the contribution from various excitation processes: CR excitation, UV excitation, and excitation following H2 formation, (as discussed in the following subsections). We focus on cold K gas typical of dense molecular cloud interiors. In Methods we discuss warmer gas and the dependence of the line intensities on temperature.
Assuming that the H2 reside in the ground vibrational states and that each vibrational excitation is rapidly followed by radiative decay (see Methods), the surface brightness of a transition line is
| (1) |
where and denote the upper and lower energy states of the transition and
| (2) |
accounts for dust extinction in the infrared. is the the optical depth for dust extinction, and cm2 is the cross-section per hydrogen nucleus (the numeric value is an average over 2-3 m Draine (2011)), where and are the column densities of H2 and hydrogen nuclei, and . In the limit , and , i.e., the optically thin limit. In the limit , saturates as cm-2. This is the optically thick limit. For typical conditions, , , and . is the total excitation rate by CRs and by secondary electrons, and is the probability per CR excitation to excite level , as determined by the interaction cross-sections for CRs and H, assuming the rotational levels of H are thermalized Gredel & Dalgarno (1995). The factor is the probability to decay to state given state is excited, is Einstein coefficient for radiative decay, and is the energy of the transition. When cascade from high energy states is important, the level populations are coupled. However, for CR excitation of the low rotational levels of , direct impact dominates and the excitation rates simplify to . Values for , , and are presented Table LABEL:table. As discussed in Methods, in the case that the CRIR decreases with cloud depth, and represent the CR excitation and ionization rates in cloud interiors.
The total brightness in all the emitted lines is
| (3) | ||||
where , is the mean transition energy, and is the number of excitations per CR ionization (see Methods). The brightness in each individual line may be written as
| (4) |
where
| (5) |
is the relative emission brightness.
The values for the brightest lines () are presented in Table LABEL:table. The brightest lines (by far) are the (1-0) O(2), Q(2), S(0), O(4) transitions of para-H2. These transitions are strong because the states are efficiently populated by direct impact excitation from the ground (0,0) state, while other levels are populated by radiative cascade Gredel & Dalgarno (1995); Le Bourlot et al. (1995). Radiative cascade populates hundreds of levels, and thus the excitation efficiency for each individual level is low. The ortho-H2 lines (odd ) are weak because the H2 resides almost entirely in the para-H2 ground state , and para-to-ortho conversion is inefficient. The ortho-lines become important in warmer gas (see Methods).
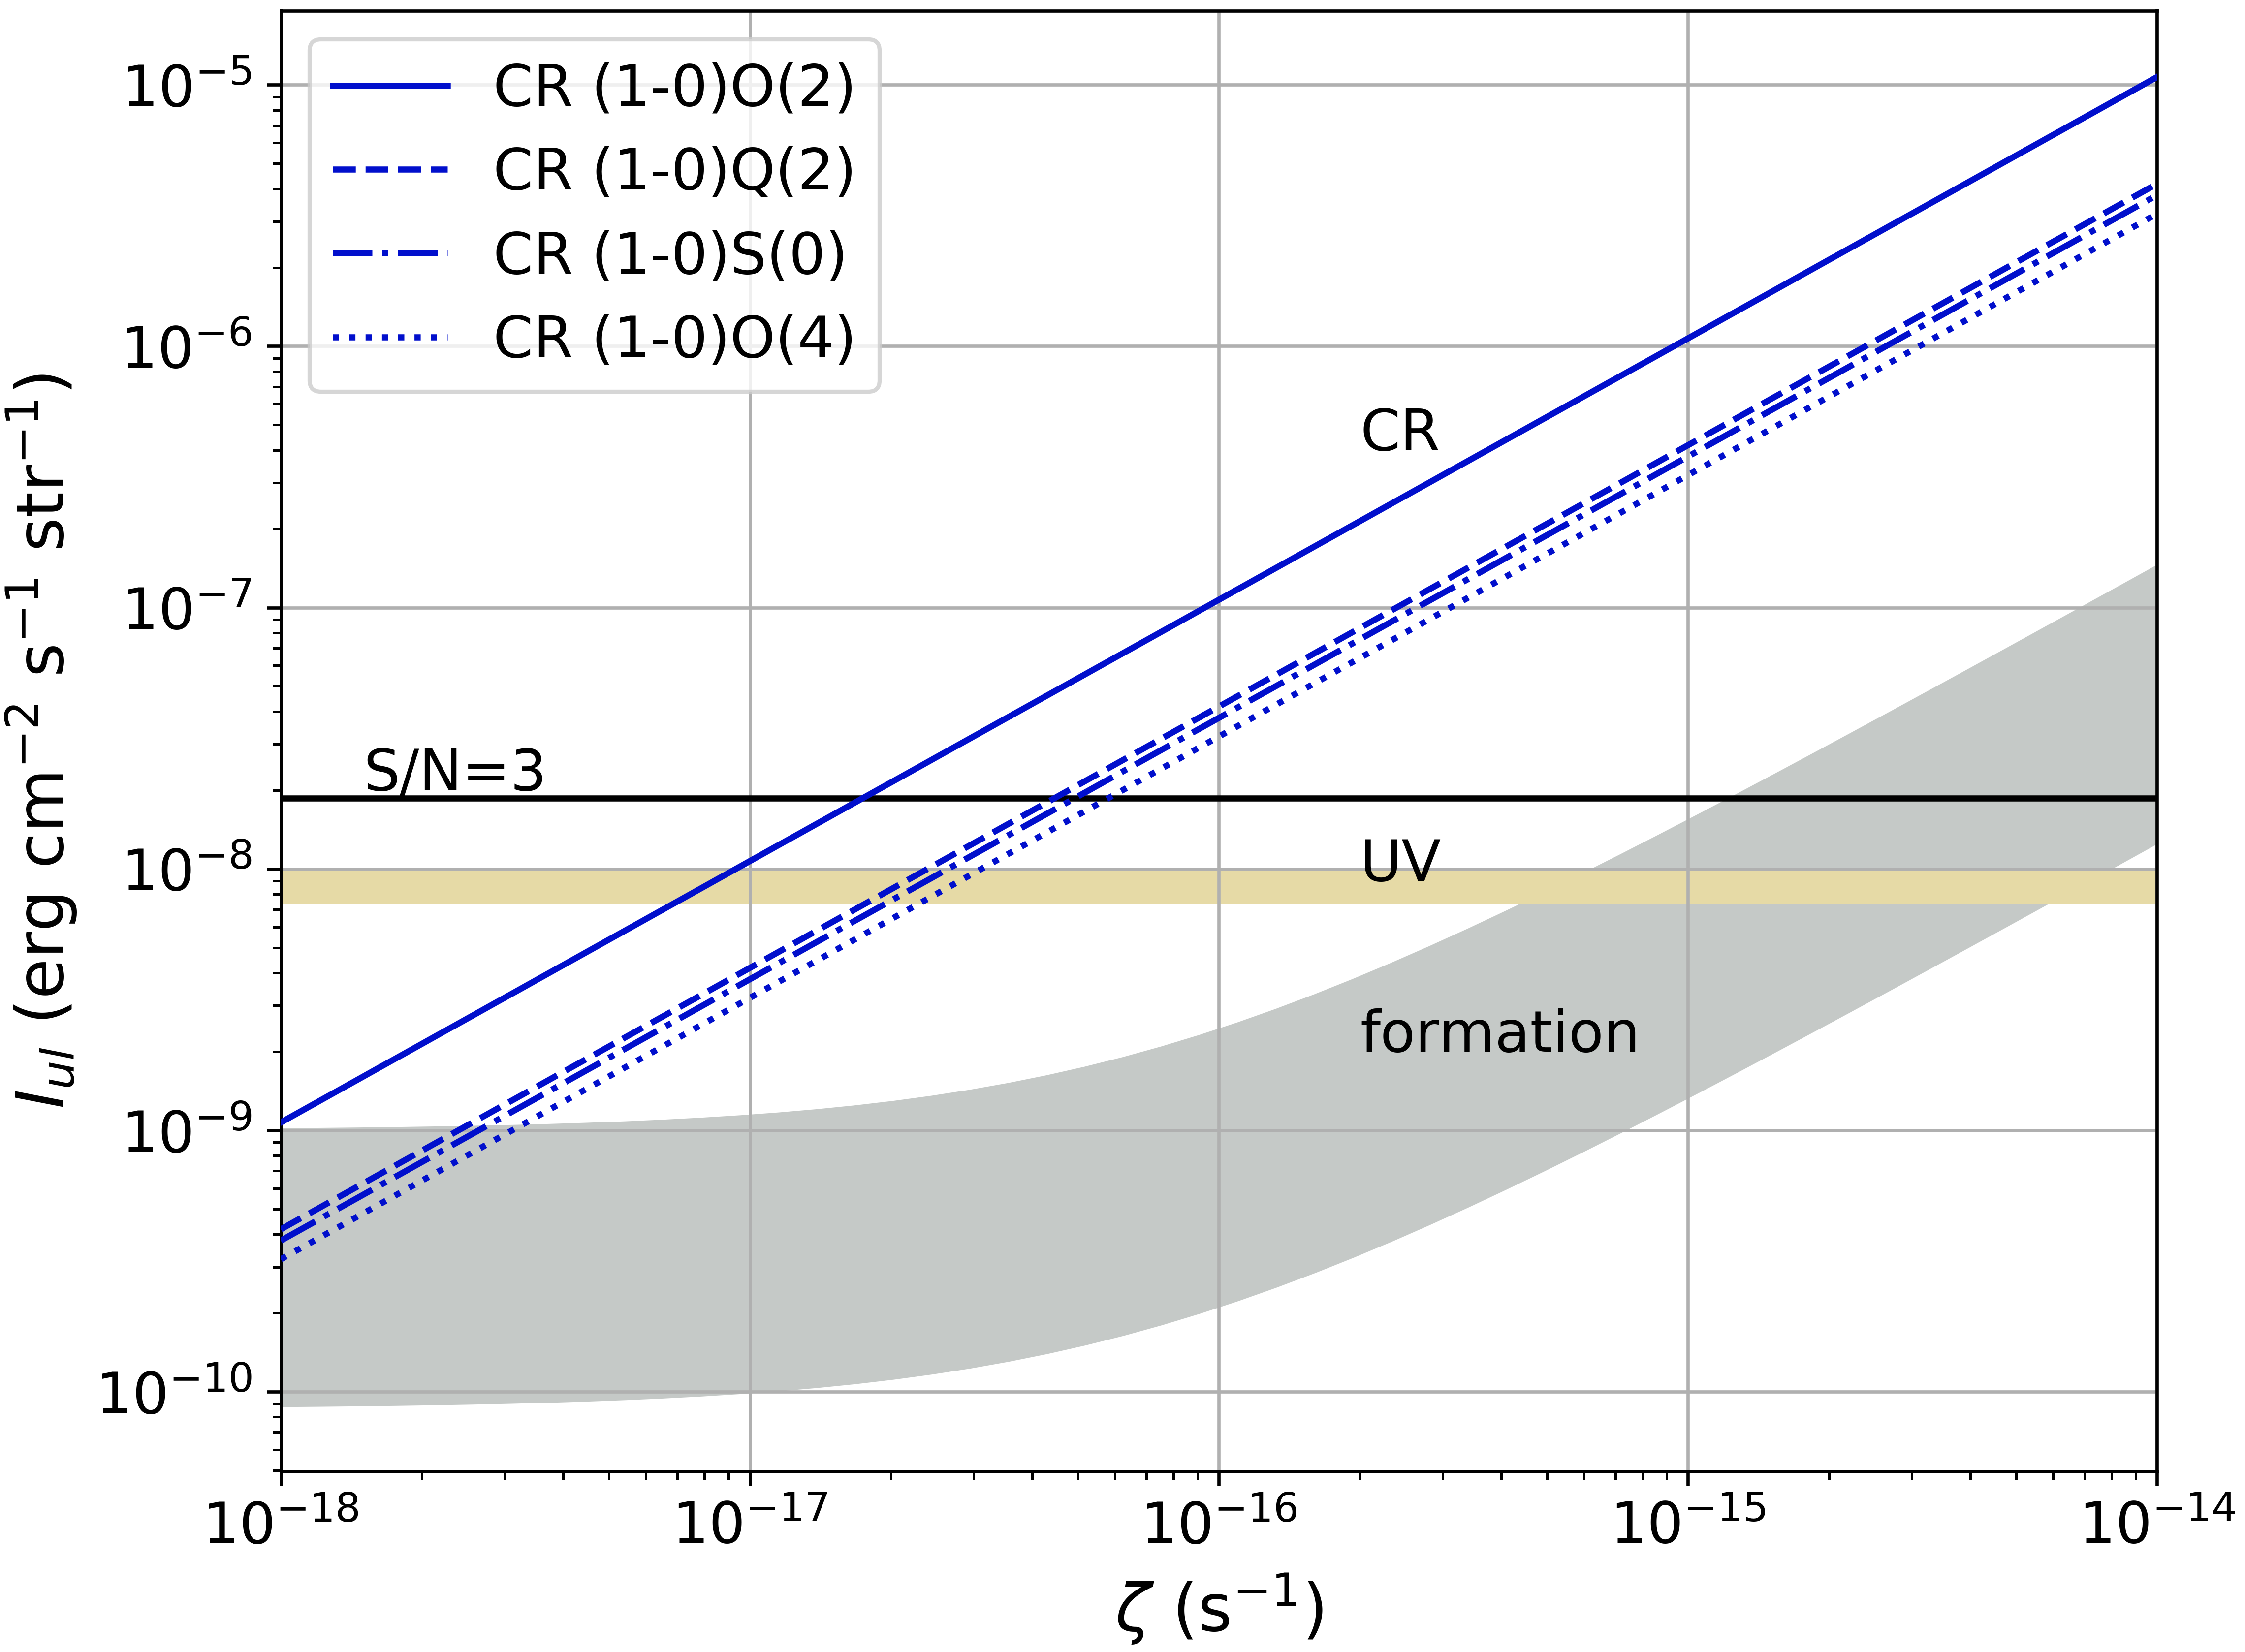
In Fig. 1 we show the strongest line brightness as a function of , for . The O(2) line is a factor of brighter than the other lines, Q(2), S(0), O(4), which are of comparable brightness. This is because there is equal probability for the excitation of both the and levels (i.e., equal ), but while the level is only allowed to decay to , the level may decay to either , or . This is reflected in Table LABEL:table, where for O(2) and for Q(2), S(0) and O(4). For this reason, eV is so close to the energy of the O(2) line.
UV Pumping
UV photons in the Lyman Werner (LW) band (11.2-13.6 eV) excite the H2 electronic states which cascade to the rovibrational levels of the ground electronic state. This UV pumping is effective in the cloud envelopes. With increasing cloud depth the radiation is attenuated by H2 line absorption and dust absorption. Assuming H2 formation-destruction (by photodissociation) steady-state, where H2 destruction leads to H formation and using the fact that the H2 pumping and photodissociation rates are proportional, the surface brightness in all the lines may be written as
| (6) |
see Sternberg (1988) for a derivation of a related quantity (their Eq. 10). In Eq. (6), is the H2 formation rate coefficient, is the gas density, is the free-space H2 photodissociation rate, is the UV pumping rate, and eV is the effective transition energy. We derived by comparing Eq. (6) with Sternberg (1988)’s computations of and . The HI column density is
| (7) |
where , cm2 is the dust absorption cross section over the LW band, per hydrogen nucleus, and is the cross-section in normalized units. and is a self-shielding factor Sternberg et al. (2014); Bialy & Sternberg (2016). Eq. (7) assumes slab geometry and irradiation by isotropic UV field of strength on each of side of the slab. For beamed irradiation, multiply by 2.
For densities cm-2, , and we may expand Eq. (7), giving , and
| (8) | ||||
where in the second equality we used , s-1 and . As long as cm3, the brightness is independent of the density and the H2 formation rate, and is proportional to the UV intensity, .
Given , the brightness in an individual line excited by UV is
| (9) |
where the relative emissions, , are determined by the Einstein radiative decay coefficients. The values are given in Table LABEL:table based on Sternberg (1988). They are of order 1% and are much lower than the corresponding values for CR pumping. This is because UV pumping populates the levels through a cascade from electronic-excited-states, while for CR pumping, the levels are populated by direct impact excitation. Fig. 1 shows the resulting line brightness at , and . Evidently, CR pumping dominates line emission for . More, generally, the ratio of emission arising from CR pumping relative to UV pumping is
| (10) |
and the critical above which CR-pumping dominates is
| (11) |
For (), for O(2), and for Q(2), S(0), O(4).
Formation Pumping
For each H2 formed, a fraction of the binding energy is converted into level excitation. It is useful to separate the line emission by H2 formation pumping into a sum of two components, the contributions from the molecular core in which H2 is destroyed by CRs, and from the outer envelopes where UV photons destroy H2. Assuming chemical steady state, the H2 formation is proportional to H2 destruction and we get
| (12) | ||||
| (13) | ||||
for the inner core, and the outer envelopes, respectively. Here we defined , where eV corresponds excitation of the level, as suggested by experiments Islam et al. (2010), and the factor accounts for additional removal of H2 by H in predominantly molecular gas Bialy & Sternberg (2015). Eqs. (12, 13) have similar forms as Eqs. (3, 8), as in the molecular core the H2 removal rate is , while in the outer envelopes removal is proportional to the UV pumping rate, . The transition from core-to-envelope dominated formation pumping occurs when is smaller than
| (14) |
where is typically of order unity.
The surface brightness of each line is
| (15) |
where . The values are determined by the formation excitation pattern, which is uncertain. To illustrate the possible outcomes, we consider the three qualitatively different formation models, explored by Black & van Dishoeck (1987) (see their Eqs. 2-4). In Fig. 1 we show the resulting line brightness for H2 formation pumping, for the four lines and the three formation models (grey strip), for . As expected, when , as the cloud core dominates formation pumping, while when , is independent of .
However, importantly, in both limits H2 formation pumping is never the dominant excitation mechanism. When ,
| (16) |
Since and , CR pumping dominates line emission. When , although formation-pumping may be more important than CR-pumping, it remains sub-dominant compared to UV pumping, as can be seen by comparing Eqs. (8) and (13). For formation-pumping to dominate over UV, the ratio must be larger than , which generally does not occur.
Continuum
The astronomical source for continuum radiation in the wavelength of interest is dominated by light reflected from interstellar dust grains Foster & Goodman (2006). Following Padoan et al. (2006), in the optically thin limit, the specific intensity in the K band is . Integrating over a spectral bin (as the lines are narrow compared to ), and multiplying by the optical depth correction function, , we get
| (17) |
where is the resolving power, , and where we used Hz corresponding to 2.2 m.
Emission from small dust grains and polycyclic aromatic hydrocarbons (PAHs) heated by the interstellar UV field also contributes to the background continuum, Draine (2011) have calculated the emission spectrum assuming a realistic dust population composed of amorphous silicates and carbonaceous grains of various sizes Draine & Li (2007) and including the effect of temperature fluctuations of small grains and PAHs. At m, they find erg s-1 str-1 per H nucleus. Assuming , cm-2 (at higher columns the UV flux is exponentially absorbed by dust), and integrating over a spectral bin we get
| (18) |
Thus, at the wavelength of interest, dust emission is subdominant compared to scattered light.
Detectability
For ground based observations, Earth sky thermal (and line) emission is typically the dominant noise source. As a proof of concept we examine the detection feasibility with X-shooter on the Very Large Telescope (VLT) and focus on the S(0) and Q(2) lines (O(2) is blocked by the atmosphere and O(4) is outside X-shooter’s range). We assume that the lines are narrow and the source is extended. For , the brightness of S(0) and Q(2) are erg cm-2 s-1 str-1, respectively (Eq. 3,4). The estimated signal-to-noise ratio (SNR) per pixel for 1 hour integration with the 0.4” slit (), is for S(0) and Q(2) respectively (see Methods). For 8 hour integration, and integrating along the slit (55 pixels), .
More generally, , where is the instrument’s field of view (FoV). Nearby clouds extend over angles large compared to typical slit FoVs. For example, the dark cloud Bernard 68 has an angular diameter and arcsec2, whereas the X-shooter slit FoV is only 11” long and has arcsec2. Longer slits will achieve better SNR, but the improvement is limited to a factor . The achieved SNR will also depend on the quality of flat-field correction and the level of signal homogeneity.
Substantial improvement may be achieved for instruments with non-slit geometry, e.g., integral field units, or narrowband filters, with large FoV. For example, for the FoV solid angle is larger by a factor of (compared to the 11” slit), equivalent to an improvement of a factor in the SNR. An alternative avenue is to use space-based observatories, such as the upcoming James Webb Space Telescope. From space, the noise in the IR is much lower, and at the same time the O(2) line, which is a factor of 4 brighter than S(0), is accessible (see Table LABEL:table).
Discussion
We presented an analytic study of H2 rovibrational line formation produced by penetrating CRs, as well as by the competing processes: H2 formation pumping, and UV pumping, and investigated the conditions required for (a) CRs to dominate line formation, and (b) for the lines to be sufficiently bright to be detected. We showed that in cold dense clouds, exposed to the mean UV field, the (1-0)O(2), Q(2), S(0), O(4) line emission is dominated by CR pumping, and thus detection of these lines may be used to constrain the CRIR.
Whether the lines are excited by CRs, UV, or formation pumping may be determined by the line ratios. For example, the ratio of 1-0 S(1) to 1-0 S(0) lines is for UV excitation Sternberg (1988), and is in the range for formation pumping Le Bourlot et al. (1995). On the contrary, for cold clouds excited by CRs, this ratio is predicted to be (see Table LABEL:table).
Observations of the H2 lines may be an efficient method to determine the CRIR in dense clouds. A survey of several clouds in various regions in the Galaxy may reveal the degree of fluctuations in the CRIR, while comparison with the CRIR in diffuse clouds (as probed by chemical tracers, e.g., H, ArH+, etc.), may constrain the attenuation of CRs with cloud depth, and therefore the spectrum of low energy CRs Padovani et al. (2009). Such tests may shed light on the nature and formation process of CRs in the Galaxy.
Methods
Relative line Brightness
The line brightness following CR excitation depend on the excitation probabilities, . We derive and based on data from Gredel & Dalgarno (1995), assuming K and electron energy 30 eV. These authors presented data for the excitation to level per CR ionization (rather than per CR excitation), denoted - see their Table 2. Comparing our and their definitions, we get , .
For H2 formation pumping, we obtain for each of the three models model based on Le Bourlot et al. (1995). We divided their reported line brightness by , as given by our Eq. (12-13) with , , appropriate to the assumed values in Le Bourlot et al. (1995), and assuming for , respectively Black & van Dishoeck (1987).
Gas temperature
[
caption = Cosmic-ray pumping - temperature dependence,
label = table2,
pos = t,
]l l l l l l l
\tnote[a]Based on Gredel & Dalgarno (1995) and (Tine et al., 1997, )
\tnote[b]The O(2), Q(2), S(0) and O(4) intensities are weakly sensitive to temperature at low :
they remain within 3% for K, and within (10, 20, 30)% for 41, 50, 58) K, respectively.
\FLTransition
\tmark[a]
(m) K\tmark[b] K K
\ML(1-0)O(2) 0 2 2.63 45.29 16.419.69 \NN(1-0)Q(2) 2 2 2.41 17.67 6.40 4.31\NN(1-0)S(0) 2 0 2.22 15.99 5.793.90\NN(1-0)O(4) 2 4 3.00 13.57 4.923.31\NN(1-0)Q(1) 1 1 2.41 0.76 15.34 17.76\NN(1-0)S(1) 3 1 2.12 0.71 14.3716.64\NN(1-0)O(3) 1 3 2.800.64 12.9715.02\NN(1-0)Q(3) 3 3 2.42 0.50 10.0911.67\NN(1-0)O(5) 3 5 3.23 0.28 5.666.55\LL
In the results section, we focused on the low K regime, typical of cold molecular cloud interiors. Here we discuss the case of warmer gas. We have carried out calculations for the line intensities as a function of temperature based on data from Gredel & Dalgarno (1995) and Tine et al. (1997). Results for , 100 and 300 K are presented in Table LABEL:table2. As long as K, the spectrum is heavily dominated by the para-H2 lines. In this limit the para-H2 lines remain insensitive to . This is because at these temperatures the H2 molecules always reside mostly in the ground state. For K, the level is sufficiently populated such that CR pumping from this level effectively excites the and states, resulting in emission of ortho-H2 lines: S(1), Q(1), Q(3), O(3), and O(5). While the power in each individual transition is reduced, the total power summed over the lines is conserved.
Variation of with cloud depth
In our Eqs. (3-4) and (12) we assumed a constant CRIR. In practice, CRs interact with the gas leading to an attenuation of the CRIR with an increasing gas column. For columns cm-2, the relation may be described by a power law,
| (19) |
with cm-2, and where the power-index and the normalization depend on the spectrum of the CRs Padovani et al. (2009). To account for a varying , our expressions for the total line brightness should be modified as follows:
| (20) | ||||
where we solved the integral assuming Eq. (20) with (for the four CR spectra considered by Padovani et al. (2009), ).
Eq. (20) shows that even in the case of a varying CRIR, our Eqs. (3-4, 12) still provide an excellent approximation for the line brightness, but with representing the CRIR in cloud interior. The factor approaches unity for relatively flat spectra (i.e., models 1 and 2 in Padovani et al. (2009)), and the brightness is then independent of the spectrum shape. If H2 line observations are further combined with additional observations of the CRIR in diffuse cloud regions (e.g., with ArH+, OH+, H2O+Neufeld & Wolfire (2017)), the CR attenuation may be obtained, constraining the CR spectrum.
Line brightness dependence on
Our Eq. (3) suggests that the line emission is linear in . This relation holds as long as is not too high. With increasing both gas temperature increases (which affect the excitation pattern), and more importantly, the electron fraction, increases. When , coulomb energy loses become substantial and line excitation is quenched (see Tables 2-3 in Tine et al. (1997)). However, this requires extreme CRIR, such that the gas is no longer molecular Bayet et al. (2011); Bialy & Sternberg (2015); Le Petit et al. (2016).
Collisional de-excitation
At sufficiently high density, collisional deexcitation (by thermal H2, H, etc.) dominates over radiative decay, and the line emission is quenched. The critical density at which collisional de-excitation equals radiative decay is , where is the Einstein coefficient for spontaneous emission, is the collisional rate coefficient, and is the fractional abundance of the collision partner.
Let us estimate the critical density for deexcitation in cold-dense clouds. For the , s-1 (see Table LABEL:table). The rate coefficients at K are of order of cm3 s-1 and cm3 s-1, for collisions with H and H2, respectively Lique (2015); Flower & Roueff (1999). In cloud interiors, the H/H2 ratio is set by the balance of H2 ionization by CRs and H2 formation via dust catalysis. This gives where cm3 s-1 is the H2 formation rate coefficient, and (for more details see §4.1 in Bialy & Sternberg (2015)). Hydrogen nucleus conservation () then implies , and . For K we obtain of order of cm-3, both for collisions with H and H2. In practice, the temperature in cloud cores is typically lower than 100 K leading to even lower collisional rates (), and thus even higher critical densities. In conclusion, for the typical temperatures and densities in cold clouds ( K, cm-3), radiative decay strongly dominates over collisional deexcitation from the levels.
Thermal excitation
In our model we ignored thermal (collisional) excitation. Although excitations by the non-thermal CRs occurs rarely (at a rate ), thermal excitation at K is extremely negligible. The thermal excitation rate is , where are the quantum weights of the levels. While cm3 s-1, the exponential factor is ( K). Thus, thermal excitation is negligible.
Exposure Time Calculator
For our estimation of the signal to noise ratio per pixel per hour integration, we used the X-shooter exposure time calculator provided in https://www.eso.org/observing/etc/bin/gen/form?INS.NAME=X-SHOOTER+INS.MODE=spectro, with the following setup. Emission Line: Lambda (2223.2, 2413.3) nm for S(0), Q(2) respectively. Flux erg s-1 cm-2 arcsec2 for S(0), Q(2) respectively. FWHM=0.093 nm (appropriate for a single spectral resolution element of the 0”4 slit). Spatial distribution, Extended source. Moon FLI 0.5, Airmass 1.5, PWV 30mm, Turbulence Category 70%. NIR slit width 0”.4, DIT=900 s, NDIT=4.
Acknowledgements: SB thanks Alyssa Goodman, David Neufeld, Amiel Sternberg, Oren Slone, Brian McLeod and Igor Chilingaryan for fruitful discussions.
Author contribution: The author carried out all the analytic derivations, numerical computations, and manuscript writing.
Competing Interests: The author declares no competing interests.
Data Availability: The author declares that all data supporting the findings of this study is available within the paper.
References
- Bayet et al. (2011) Bayet, E., Williams, D. A., Hartquist, T. W., & Viti, S. 2011, Monthly Notices of the Royal Astronomical Society, 414, 1583
- Bialy et al. (2019) Bialy, S., Neufeld, D., Wolfire, M., Sternberg, A., & Burkhart, B. 2019, The Astrophysical Journal, 885, 109
- Bialy & Sternberg (2015) Bialy, S., & Sternberg, A. 2015, Monthly Notices of the Royal Astronomical Society, 450, 4424
- Bialy & Sternberg (2016) —. 2016, The Astrophysical Journal, 822, 83
- Black & van Dishoeck (1987) Black, J. H., & van Dishoeck, E. F. 1987, The Astrophysical Journal, 322, 412
- Caselli et al. (1998) Caselli, P., Walmsley, C. M., Terzieva, R., & Herbst, E. 1998, The Astrophysical Journal, 499, 234
- Crapsi et al. (2007) Crapsi, A., Caselli, P., Walmsley, M. C., & Tafalla, M. 2007, Astronomy and Astrophysics, 470, 221
- Dalgarno (2006) Dalgarno, A. 2006, Proceedings of the National Academy of Sciences of the United States of America, 103, 12269
- Dalgarno et al. (1999) Dalgarno, A., Yan, M. I. N., & Liu, W. 1999, ApJ, 125, 237
- Draine (1978) Draine, B. T. 1978, The Astrophysical Journal Supplement Series, 36, 595
- Draine (2011) —. 2011, Physics of the Interstellar and Intergalactic Medium
- Draine & Li (2007) Draine, B. T., & Li, A. 2007, The Astrophysical Journal, 657, 810
- Flower & Roueff (1999) Flower, D. R., & Roueff, E. 1999, Journal of Physics B: Atomic, Molecular and Optical Physics, 32, 3399
- Foster & Goodman (2006) Foster, J. B., & Goodman, A. A. 2006, The Astrophysical Journal, 636, L105
- Gaches et al. (2019) Gaches, B. A. L., Offner, S. S. R., & Bisbas, T. G. 2019, The Astrophysical Journal, 878, 105
- Glassgold et al. (2012) Glassgold, A. E., Galli, D., & Padovani, M. 2012, Astrophysical Journal, 756, 157
- Gredel & Dalgarno (1995) Gredel, R., & Dalgarno, A. 1995, apj, 852
- Grenier et al. (2015) Grenier, I. A., Black, J. H., & Strong, A. W. 2015, Annual Review of Astronomy and Astrophysics, 53, 199
- Guelin et al. (1982) Guelin, M., Langer, W., & Wilson, R. 1982, Astronomy and Astrophysics, 107, 107
- Indriolo et al. (2018) Indriolo, N., Bergin, E. A., Falgarone, E., et al. 2018, The Astrophysical Journal, 865, 127
- Indriolo & McCall (2012) Indriolo, N., & McCall, B. J. 2012, The Astrophysical Journal, 745, 91
- Indriolo et al. (2007) Indriolo, N., McCall, B. J., Geballe, T. R., & Oka, T. 2007, Astrophysical Journal, 671, 1736
- Islam et al. (2010) Islam, F., Cecchi-Pestellini, C., Viti, S., & Casu, S. 2010, Astrophysical Journal, 725, 1111
- Ivlev et al. (2019) Ivlev, A. V., Silsbee, K., Sipilä, O., & Caselli, P. 2019, The Astrophysical Journal, 884, 176
- Kong et al. (2015) Kong, S., Caselli, P., Tan, J. C., Wakelam, V., & Sipilä, O. 2015, Astrophysical Journal, 804, 1
- Le Bourlot et al. (1995) Le Bourlot, J., des Forêts, G. P., Roueff, E., Dalgarno, A., & Gredel, R. 1995, The Astrophysical Journal, 449, 178
- Le Petit et al. (2016) Le Petit, F., Ruaud, M., Bron, E., et al. 2016, Astronomy and Astrophysics, 585, A105
- Lique (2015) Lique, F. 2015, Monthly Notices of the Royal Astronomical Society, 453, 810
- Neufeld & Wolfire (2017) Neufeld, D. A., & Wolfire, M. G. 2017, The Astrophysical Journal, 845, 163
- Oonk et al. (2017) Oonk, J. B., van Weeren, R. J., Salas, P., et al. 2017, Monthly Notices of the Royal Astronomical Society, 465, 1066
- Padoan et al. (2006) Padoan, P., Juvela, M., & Pelkonen, V.-M. 2006, The Astronomical Journal, 636, 101
- Padovani et al. (2009) Padovani, M., Galli, D., & Glassgold, A. E. 2009, Astronomy & Astrophysics, 501, 619
- Shingledecker et al. (2016) Shingledecker, C. N., Bergner, J. B., Le Gal, R., et al. 2016, The Astrophysical Journal, 830, 151
- Sorochenko & Smirnov (2010) Sorochenko, R. L., & Smirnov, G. T. 2010, Astronomy Reports, 54, 776
- Sternberg (1988) Sternberg, A. 1988, The Astrophysical Journal, 332, 400
- Sternberg (1989) —. 1989, The Astrophysical Journal, 347, 863
- Sternberg et al. (2014) Sternberg, A., Petit, F. L., Roueff, E., & Bourlot, J. L. 2014, The Astrophysical Journal Supplement Series, 790, 10S
- Tine et al. (1997) Tine, S., Lepp, S., Gredel, R., & Dalgarno, A. 1997, The Astrophysical Journal, 481, 282
- Tiné et al. (2003) Tiné, S., Williams, D., Clary, D., et al. 2003, Astrophysics and Space Science, 288, 377
- van der Tak & van Dishoeck (2000) van der Tak, F. F. S., & van Dishoeck, E. F. 2000, Astronomy and Astrophysics, 358L, 79V
- Williams et al. (1998) Williams, J. P., Bergin, E. A., Caselli, P., Myers, P. C., & Plume, R. 1998, The Astrophysical Journal, 503, 689
- Yusef-Zadeh et al. (2013) Yusef-Zadeh, F., Hewitt, J. W., Wardle, M., et al. 2013, Astrophysical Journal, 762