Spectroscopy of LMC Cluster Stars
Abstract
High resolution spectra of stars in the 200 Myr LMC globular cluster, NGC 1866, reveal rapidly rotating stars with variable H emission and absorption, and signatures of outflowing material. The variable H line can substantially affect photometric measurements obtained with HST/WFC3 narrow-band filters.
keywords:
globular clusters: individual (NGC 1866), galaxies: Magellanic Clouds, line: profiles, stars: emission-line, Be, stars: winds, outflows1 Introduction
Photometry from the Hubble Space Telescope has fundamentally changed our concept of globular clusters (Gratton et al. 2012; Bastian and Lardo 2018). No longer thought to be coeval and chemically homogeneous, ‘multiple populations’ appear ubiquitous. We lack an understanding of the cluster evolution causing this major paradigm shift. Many sources for the abundance patterns have been proposed. However models can not uniquely identify the source of the chemical enrichments in the Milky Way clusters. One approach is to study younger clusters in the large Magellanic Cloud (LMC) in the hopes of understanding the origins of the multiple populations.
LMC clusters are unusual too. The young and intermediate age clusters display a unique extended (broadened) main sequence turnoff defined by HST photometry and a double main sequence (Milone et al. 2009, 2018; Goudfrooij et al. 2009, 2014). Stellar spectra can reveal physical properties of their members.
2 Stellar Spectra
Our spectra were obtained at the Magellan/Clay 6.5-m telescope at Las Campanas Observatory using two spectrographs: the Magellan Inamori Kyocera Echelle (MIKE) and Michigan/Magellan Fiber System (M2FS, Mateo et al. 2012). MIKE is a high throughput double-echelle spectrograph with a blue and red arm spanning the optical region: 335950 nm (Bernstein et al. 2002). M2FS is a multi-object spectrograph with 1.2” fibres and a field of view nearly 30 arcmin in diameter. For M2FS, we selected a filter spanning 612672 nm, and a slit yielding a resolving power 28,000. Targets in the cluster, NGC 1866, were identified by Milone et al. (2017) from the Ultraviolet and Visual Channel of the Wide Field Camera 3 (UVIS/WFC3) of the HST.
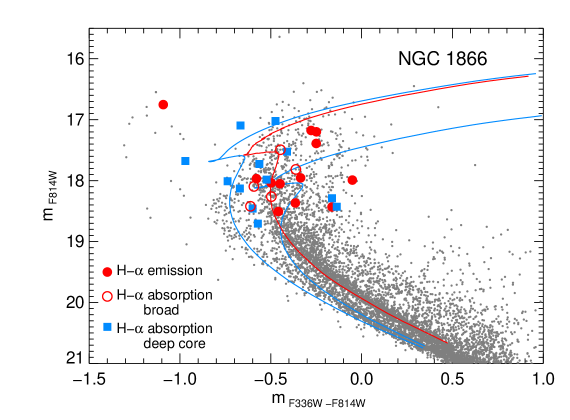
3 The Color-Magnitude Diagram
The first spectroscopy (Dupree et al. 2017) of turn-off stars in a young (200 Myr) LMC cluster, NGC 1866, revealed that rapidly rotating stars are indeed present (Figure 1). The H line appears in emission centered on the stellar radial velocity, and is typical of that found in Be stars. In these stars, the H emission arises in a Keplerian decretion disk surrounding a rapidly rotating star (Rivinius et al. 2013). The emission profile shape can indicate the orientation of the disk. Additionally, other stars exhibit an absorption profile of H from which the stars’ rotational velocity (v sin i) can be inferred. Stars with emission lie to the cooler side (the ‘red’) of the slowly rotating stars in the HST color magnitude diagram. Fitting isochrones in Figure 1, suggests that the population of fast-rotators corresponds to 200 Myr, and the blue main sequence may contain two populations of non-rotating stars with ages of 140 and 220 Myr. Marino et al. (2018) has measured the projected rotational velocities of main sequence stars from the H and He I profiles in a very young (40 Myr) LMC cluster, NGC 1818. They find the blue main sequence to have a lower mean rotation (7110 km s-1) than the red main sequence (20223 km s-1), confirming that rotation is a significant parameter in defining the appearance of the CMD.
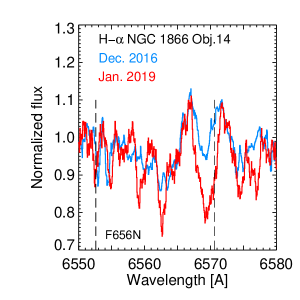
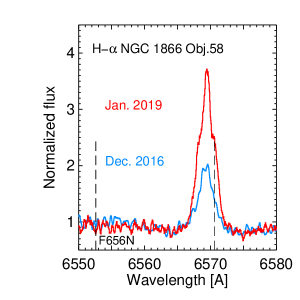
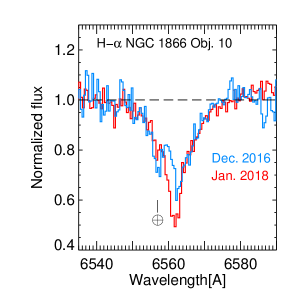
4 Spectroscopic Variability
It is well known that the H emission can vary in Be stars, as studies of Milky Way Be stars have shown (Dimitrov et al. 2018). Not surprisingly, the LMC cluster stars vary in their H profiles too (Fig. 2, 3). In addition to radial velocity shifts, this can be of particular concern for HST/WFC3 photometry which employs a narrow-band filter, F656N, with a passband of only 18Å (6552.6-6570.6Å, full width at half power) to detect H emission. Radial velocities of H I in the LMC can vary between +200 to +330 km s-1 (Staveley-Smith et al. 2003) such that the H profile will not be captured (or completely covered) by the filter. Moreover the variability can amount to a factor of two or more in the flux which creates scatter in a CMD using this photometric parameter.
5 Braking and Spin-Down
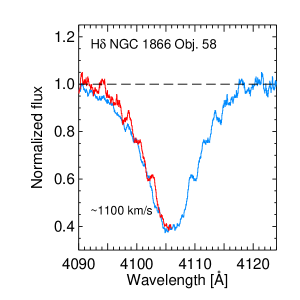
The presence of a split main sequence consisting of rapidly rotating and slowly rotating stars in LMC clusters, led to the suggestion (D’Antona et al. 2017) that cluster stars may be formed initially in a rapidly rotating state. Subsequently they are braked by a stellar wind or as a result of low-frequency oscillation modes if in a binary system, and spun down to become the slowly-rotating stars on the blue main sequence. Such a phenomenon would minimize, if not remove, the apparent age difference between the fast and slowly-rotating stars and perhaps explain the extended main-sequence turnoff in these clusters. Although a scenario invoking a combination of rotation and a distribution of ages may still be required (Goudfrooij et al. 2017). In fact, rotational braking has been inferred in a B-dwarf star, Ori E, based on photometric measures of a systematic change in the star’s rotation rate (Townsend et al. 2010). If mass outflow is the culprit causing the braking, one could seek spectroscopic signatures of such outflow directly from the line profiles. Ultraviolet profiles clearly indicate accelerating outflows occur in Be stars with terminal velocities ranging from 500 to 1200 km s-1 (Slettebak 1994). It may be possible to detect the onset of such flows in Balmer series profiles marked by excess absorption on the ‘blue’ wing caused by outflowing gas as appears in the pole-on Obj 58 (Figure 3). This may be a special object as rapidly rotating stars are thought to have a ratio of polar to equatorial mass loss rate of a factor of 40 (Krtic̆ka 2014). Further observations at high signal-to-noise would be useful.
References
- [] Bastian, N., & Lardo, C. 2018, ARAA, 56, 83
- [] Bernstein, R. A., Shectman, S. A., Gunnels, S. et al. 2002, Proc. SPIE, 4841
- [] D’Antona, F., Milone, A. P., Tailo, M. et al. 2017, NatAs, 1, ID186
- [] Dimitrov, D. P., Kjurkchieva, D. P., & Ivanov, E. I. 2018, AJ, 156, 61
- [] Dupree, A. K., Dotter, A., Johnson, C. I. et al. 2017, ApJ (Letters), 846, L1
- [] Georgy, C., Charbonnel, C., Amard, L. et al. 2019, A&A, 622, A66
- [] Georgy, C., Ekström, S., Granada, A. et al. 2013, A&A, 553, A24
- [] Goudfrooij, P., Girardi, L., & Correnti, A. 2017, ApJ, 846, 22
- [] Goudfrooij, P., Girardi, M. L., Kozhurina-Platais, V. et al. 2014, ApJ, 797, 35
- [] Goudfrooij, P., Puzia, T. H., Kozhurina-Platais, V., & Chandar, R. 2009, AJ, 137, 4988
- [] Gratton, R. G., Carretta, E., & Bragaglia, A. 2012, A&AR, 20, 50
- [] Krtic̆a, J. 2014, A&A, 564, A70
- [] Marino, A. F., Przybilla, N., Milone, A. P. et al. 2018, AJ, 156, 116
- [] Mateo, M., Bailey, J. L., Crane, J. et al. 2012, Proc. SPIE, 8446, 84464Y
- [] Milone, A. P., Bedin, L. R., Piotto, G., & Anderson, J. 2009, A&A, 497, 755
- [] Milone, A. P., Marino, A. F., D’Antona, F. et al. 2017, MNRAS, 465, 4363
- [] Milone, A. P., Marino, A. F., DeCriscienzo, M. et al. 2018, MNRAS, 477, 2640
- [] Mucciarelli, A., Cristallo, S., Brocato, E. et al. 2011, MNRAS, 413, 837
- [] Rivinius, T., Carciofi, A. C., & Martayan, C. 2013, A&AR, 21, 69
- [] Slettebak, A. 1994, ApJS, 94, 163
- [] Staveley-Smith, L., Kim, S., Calabretta, M. R. et al. 2003, MNRAS, 339, 87
- [] Townsend, R. H. D., Oksala, E., Cohen, D. H. et al. 2010, ApJ (Letters), 714, L318