Towards Extracting Highlights From Recorded Live Videos: An Implicit Crowdsourcing Approach
Abstract
Live streaming platforms need to store a lot of recorded live videos on a daily basis. An important problem is how to automatically extract highlights (i.e., attractive short video clips) from these massive, long recorded live videos. One approach is to directly apply a highlight extraction algorithm to video content. However, algorithmic approaches are either domain-specific, which require experts to spend a long time to design, or resource-intensive, which require a lot of training data and/or computing resources. In this paper, we propose Lightor, a novel implicit crowdsourcing approach to overcome these limitations. The key insight is to collect users’ natural interactions with a live streaming platform, and then leverage them to detect highlights. Lightor consists of two major components. Highlight Initializer collects time-stamped chat messages from a live video and then uses them to predict approximate highlight positions. Highlight Extractor keeps track of how users interact with these approximate highlight positions and then refines these positions iteratively. We find that the collected user chat and interaction data are very noisy, and propose effective techniques to deal with noise. Lightor can be easily deployed into existing live streaming platforms, or be implemented as a web browser extension. We recruit hundreds of users from Amazon Mechanical Turk, and evaluate the performance of Lightor using two popular games in Twitch. The results show that Lightor can achieve high extraction precision with a small set of training data and low computing resources.
Index Terms:
Machine learning, implicit crowdsourcing, highlight detection.I Introduction
Video data is booming and will account for 90% of all internet traffic by 2020 as predicted by Cisco [1]. Improving video-related services is of growing interest in the database and data mining community [2, 3, 4, 5, 6, 7]. As an important type of video service, live streaming platforms such as Twitch, Mixer, YouTube Live, and Facebook Live fulfill the mission of democratizing live video broadcasting. With these platforms, anyone can be a broadcaster to record a video and broadcast it in real time; anyone can be a viewer to watch a live video and chat about it in real time. This unique experience makes these platforms more and more popular nowadays. For example, by 2018, Twitch has reached 3.1 million unique monthly broadcasters, and over 44 billion minutes of videos are watched each month [8].
Once a live stream is complete, the recorded video along with time-stamped chat messages will be archived. A recorded video is often very long (from half an hour to several hours). Many users do not have the patience to watch the entire recorded video but only look for a few highlights to watch. A highlight represents a small part of the video that makes people feel excited or interested, and it typically lasts from a few seconds to less than one minute. For example, a highlight in a Dota2 game video could be an exciting battle or a critical knockdown.
We study how to automatically extract highlights from a recorded live video. Finding a good solution to this problem could have a propound impact on live-streaming business. First, since it save users’ time in manually finding the highlights, more and more users might be willing to watch recorded live videos, thus increasing the user engagement of a live-streaming platform. Second, highlight extraction is a fundamental task in video processing. If a live-streaming platform knows the highlights of each video, it will significantly improve the user experience of other profitable video applications, such as video search and video recommendation.
One direction to solve this problem is to adopt a machine-only approach [9, 10, 11, 12, 13]. However, many existing highlight-detection algorithms [9, 10] are domain specific. For example, to apply them to Twitch, domain experts need to design a different algorithm for every game type (e.g. Dota2, LoL, etc.), which is not easy to develop and maintain. Some recent papers study how to train a deep-learning model (e.g., CNN, RNN, LSTM) to detect highlights [11, 12, 13]. However, for each game type, they need to label a large number of videos in order to train a good model. The model trained on one type of game (e.g., Dota2) usually does not generalize well to another (e.g., LoL). Furthermore, the training process is computationally expensive, which take several days to train a model using expensive GPUs.
Crowdsourcing is a potential approach to overcome these limitations. Crowdsourcing seeks to recruit a large number of Internet workers to solve challenging problems (e.g., entity resolution [14, 15], image labeling [16]). A simple solution is to adopt explicit crowdsourcing, which pays workers some money and asks them to extract highlights from videos. Since this solution uses monetary incentives to recruit workers, it does not scale well to a large number of videos in live streaming platforms.
In this paper, we propose a novel implicit crowdsourcing to tackle this problem [17]. Implicit crowdsourcing is the idea of collecting implicit feedback from users (i.e., user’s natural interactions with the system) and then leveraging the feedback to solve a challenging problem. It has achieved great success in many domains. For example, reCAPTCHA [18] leverages this idea to digitize old books. Search engines collect implicit clickthrough data to optimize web search ranking [19]. To apply this idea, we face two challenges. The first one is how to design an implicit crowdsourcing workflow so that video viewers interact with the system naturally but provide useful feedback implicitly. The second one is how to use the implicit (and noisy) feedback to detect and extract video highlights. We address these two challenges as follows.
Implicit Crowdsourcing Workflow. We design a novel implicit crowdsourcing workflow, called Lightor. Lightor consists of two components. i) Highlight Initializer takes a recorded live video as input and uses its time-stamped chat messages to detect which part of the video could have a highlight. For example, when a large number of chat messages pop up within a short period of time, users may talk about a highlight that has just happened. Note that Highlight Initializer can only get an approximate position of a highlight. It is still not clear about the exact boundary (i.e., exact start and end points) of a highlight. ii) Highlight Extractor is designed to address this problem. At each approximate position, it puts a “red dot” on the progress bar of the video, which informs users that there could be a highlight at this position. Note that users will not be forced to watch this highlight. Instead, they can watch the video as usual. Highlight Extractor collects user interaction data w.r.t. each red dot to identify the exact boundary of each highlight.
Noisy User Data. One major challenge in our implicit crowdsourcing design is how to handle the high noise in the implicit feedback from users. For example, in Highlight Initializer, when a user leaves a chat message, she might not comment on the video content but chat with other users. In Highlight Extractor, when a user watches a certain part of video, she might not be attracted by the video content but check whether this part of video has something interesting. Therefore, we have to be able to separate noise from signal. We analyze real-world user data and derive a number of interesting observations. Based on these observations, we develop several effective techniques to deal with noisy user interaction data.
Lightor can be easily deployed on an existing live streaming platform. The only change is to add red dots to the progress bar of recorded videos. Based on a user survey, we find that most users prefer this change since red dots help them find more interesting highlights. Furthermore, Lightor can be implemented as a web browser extension, which has the potential to support any platform.
We recruit about 500 game fans from Amazon Mechanical Turk and evaluate Lightor using two popular games (Dota2 and LoL) from Twitch. The results show that (1) our proposed techniques make Lightor achieve very high precision (up to ) in the returned top- highlights, which changes the system from unusable to usable, and (2) Lightor requires 123 fewer training examples and over 100000 less training time compared to the state-of-the-art deep learning based approach, thus it is much preferable when there is a lack of training data or computing resources.
To summarize, our contributions are:
-
•
We study how to leverage implicit crowdsourcing to extract highlights from a recorded live video. We propose Lightor, a novel workflow to achieve this goal.
-
•
We analyze real-world chat messages, and derive a number of interesting observations. Based on these observations, we develop a simple but effective Highlight Initializer.
-
•
We derive a number of interesting observations from real-world user interaction data, and propose a novel Highlight Extractor to identify the exact boundary of each highlight.
-
•
We discuss how to deploy Lightor on an existing live streaming platform or implement it as a web extension. We recruit hundreds of users and evaluate Lightor using real live video data. The results demonstrate the superiority of Lightor over baseline approaches.
The remainder of this paper is organized as follows. Section II reviews the related work. Section III presents the Lightor workflow. We discuss how Highlight Initializer and Highlight Extractor are built in Section IV and Section V, respectively. Section VI discusses how to deploy Lightor in practice. Experimental results are presented in Section VII. We discuss our findings and lessons learned in Section VIII, and present conclusions and future work in Section IX. We provide a reproducibility report and release all the code and datasets at the project page: http://tiny.cc/lightor.
II Related Work
Crowdsourcing has been extensively studied in the database community in recent years. However, prior work is mainly focused on explicit crowdsourcing [20, 21, 22] or non-video-tasks [23, 24, 25, 26, 27]. This paper shows that exploring the use of implicit crowdsourcing for video tasks is a promising direction, calling for more attention to this exciting research direction. In fact, our work touches a wide range of research topics in other communities.
Computer Vision. There is a recent trend to apply deep learning to highlight detection [28, 12, 13]. For example, a frame-based CNN model [28] was trained to detect the frames with significant visual effects for e-sports. In [13], a joint model of CNN on video and LSTM on chat was trained to detect highlights in game videos. While these deep-learning based approaches achieve good performance, they require large training sets and high computing resources. Unlike these studies, we focus on the use of implicit crowdsourcing which requires much less training data and computational cost. In addition to deep learning, there are some domain specific algorithms [9, 10]. Unlike these works, we focus on a more general approach. Video summarization [29, 12] aims to generate a condensed video to summarize the story of the entire video. Highlight detection often serves as the first step of video summarization and generates a small number of candidate highlights.
Explicit Crowdsourcing. There are some works using explicit crowdsourcing for video analysis [30, 31, 32]. That is, they ask crowd workers to do a certain video-related task explicitly, e.g., video segmentation [30], video tagging [32]. However, none of these studies attempt to apply implicit crowdsourcing to video highlight detection, which is a more monetary-cost efficient and natural way to collect essential data.
Implicit Crowdsourcing (User Comments). There are some works on the use of user comments [2, 33] for video analysis. A LDA model was proposed to generate video tags from time-stamped comments [2]. Another work uses word embedding to extract highlights from time-stamped comments for movies [33]. They are different from Lightor in three aspects. (1) They only focus on user commenting data while Lightor considers both user commenting data and user viewing behavioral data (see Section V). (2) They use bag of words or word embedding as features while Lightor use more general features (see Section IV-B). (3) They use time-stamped comments rather than live chat messages, thus they do not face the challenge that there is a delay between video content and the comments (see Section IV-C).
Twitter data has been leveraged to detect events in some studies [34, 35, 36]. However, live chat messages are usually shorter and more noisy thus requiring the development of new techniques.
Implicit Crowdsourcing (User Viewing Behaviors). HCI and Web researchers have designed systems using click-through or interaction data to measure user engagement. For example, the research on MOOC videos or how-to videos leverage interactions as engagement measurement to detect interesting or difficult parts of videos (e.g., [37], [38]). Some studies have also leveraged interaction data to predict audience’s drop-out rate and analyzed the cause of interaction peak [39, 40]. These works simply sum up all users’ watching sessions along the video and get curves between watched frequency and video timestamps. We have compared with these methods, but found that they did not perform well on our collected user interaction data since when users interact with a casual video, their viewing behaviors are much more unpredictable. The experimental results can be found in Section VII-C.
III The Lightor Workflow
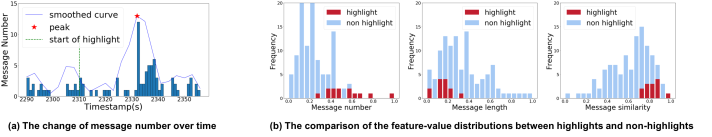
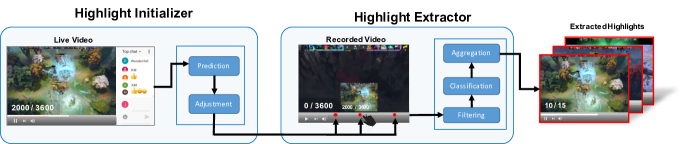
Figure 1 depicts the Lightor workflow. The workflow consists of two major components: Highlight Initializer and Highlight Extractor. The former determines which part of the video could be a highlight, and the latter identifies the exact boundary (start and end time) of each highlight. We will use a simple example to illustrate how they work as well as the challenges that they face. Consider a one-hour video , which starts at 0s and ends at 3600s. Suppose the video has a highlight between 1900s and 2005s, denoted by . The goal is to extract from .
Highlight Initializer. Highlight Initializer aims to identify an approximate start position of each highlight so that if a user starts watching the video from this position, she can tell that there is a highlight nearby. For example, 2000 is a good position since it is within the highlight range but 2100 is a bad one since it is very far away from the highlight. We observe that most live videos allow users to leave chat messages in real time. This can be leveraged as a kind of implicit feedback. However, time-stamped chat messages are short and noisy, thus it is challenging to use them to implement an accurate Highlight Initializer. We will discuss how to address this challenge in Section IV.
Highlight Extractor. Suppose the above component returns 2000 as a result. We will add a “red dot” at this position on the progress bar of the recorded video (see Figure 1). A red dot can be seen as a hint, which informs users that there could be a highlight nearby. Users can click on the red dot and start watching the video. They may drag the progress bar backward if they find the video clip interesting and want to watch it again, or they may drag the progress bard forward if they find the video clip uninteresting. All these interactions can be leveraged as another kind of implicit feedback to extract highlights. However, user interactions are noisy. It is challenging to leverage the user interaction data to implement an accurate Highlight Extractor. We will discuss how to address this challenge in Section V.
IV Highlight Initializer
This section presents the design of Highlight Initializer. We first define the design objective, then discuss the design choices, and finally propose the detailed implementation.
IV-A Design Objective
There could be many highlights in a video, but most users are only interested in viewing the top- ones. Highlight Initializer aims to find an approximate start position for each top- highlight.
Next, we formally define what is a good approximate start position (i.e., what is a good red dot). The goal is to make users see a highlight shortly after they start watching the video from a red dot. Let denote a highlight and denote the red dot w.r.t. . We call a good red dot if it meets three requirements.
First, the red dot should not be put after the end of the highlight (i.e., ). Otherwise, a user is very likely to miss the highlight. This is because a user typically clicks the red dot and starts watching the video for a short period of time. If nothing interesting happens, she may skip to the next red dot. Second, the red dot should not be put at more than 10s before the start of the highlight (i.e., ). Based on existing studies (e.g., [41]), people can accept less than 10s delay, but may lose their patience when the delay is longer. Third, it is not useful to generate two red dots that are very close to each other. Thus, we require that there does not exist another red dot such that , where is a system parameter and is set to 120s by default.
With the definition of good red dots, we define the design objective of Highlight Initializer.
Objective. Given a recorded live video along with time-stamped messages, and a user-specified threshold , Highlight Initializer aims to identify a set of good red dots.
IV-B Design Choices
We face different choices when designing the Highlight Initializer. We will explain how the decision is made for each choice.
Video vs. Chat Data. We choose to only use chat data instead of video data to identify red dots. This design choice has two advantages. First, we can use a small set of training data (e.g., 1 labeled video) to train a good model over chat data. But, it is hard to achieve this for video data. Second, processing video data often requires high computing resources. Since chat data is much smaller in size than video data, this limitation can be avoided. On the other hand, a chat-data based approach may not work well for videos with few chat messages. Nevertheless, as will be shown in the experiment, our model performs well on the videos with 500 chat messages per hour. We find that the majority (more than 80%) of popular videos in Twitch meet this requirement. For the remaining unpopular videos, there may not be a strong demand to generate highlights for them.
General vs. Domain-specific Features. We seek to build a Machine Learning (ML) model to identify red dots. There are two kinds of features that can be used by the model. General features are independent of video type (e.g., Dota2 game vs. LoL game). For example, message number can be seen as a kind of general feature because we can extract this feature for any type of video and use it as a strong predictor for highlights. In contrast, domain-specific features are highly dependent on the selected domains. For example, the keyword “Goal” is a domain-specific feature since it can be used to detect highlights in a Soccer game, but not in a Dota game. We choose to use general features rather than domain-specific features. This will allow our model to have good generalization.
IV-C Implementation
We implement the Highlight Initializer component based on the above design choices. In the following, we first present a naive implementation and identify its limitations. We then propose our implementation to overcome these limitations.
IV-C1 Naive Implementation
A naive implementation is to count which part of the video has the largest message number and put a red dot at that position. Figure 2(a) shows a real-world example. It plots a histogram along with the smoothed curve of the message number in a Twitch live video. We can see that 2332s has the largest message number, thus this naive implementation will put a red dot at 2332s.
Unfortunately, this implementation does not perform well in practice due to two reasons. The first reason is that having the largest message number does not always mean that users are chatting about a highlight. For instance, there could be advertisement chat-bots which post quite a few messages in a very short period of time. The second reason is that in a live video, users will only chat about a highlight after they have seen a highlight. Thus, there is a delay between the start position of a highlight and its comments. For example, in Figure 2(a), we can see the delay (the distance between the green dotted line and the red dot) is around 20s. This naive implementation fails to capture the delay.
IV-C2 Our Implementation
Our implementation consists of two stages.
Prediction. The prediction stage aims to address the first issue mentioned above. Given a set of chat messages within a short sliding window (e.g., 25s), we build a predictive model to determine whether the messages in the sliding window are talking about a highlight or not. We propose three general features for the model.
-
•
Message Number is the number of the messages in the sliding window. The naive implementation only considers this feature.
-
•
Message Length calculates the average length of the messages in the sliding window, where the length of a message is defined as the number of words in the message. We observe that if viewers see a highlight, they tend to leave short messages. If their messages are long, they typically chat about something else.
-
•
Message Similarity measures the similarity of the messages in the sliding window. If the messages are similar to each other, they are more likely to chat about the same topic, instead of random chatting. We use Bag of Words to represent each message as a binary vector and apply one-cluster K-means to find the center of messages. The message similarity is computed as the average similarity of each message to the center. The computation of message similarity can be further enhanced with more sophisticated word representation (e.g., word embedding).
To make these features generalize well, we normalize them to the range in and build a logistic regression model to combine them. We examine the effectiveness of each feature on Twitch chat data. Figure 2(b) shows the analysis results of a random video. The video contains 1860 chat messages in total. We divide them into 109 non-overlapping sliding windows, where 13 are labeled as highlights and 96 are labeled as non-highlights. For each feature, we compare the feature-value distributions of highlights and non-highlights. We can see that their distributions are quite different. For example, for the message-length feature, all the highlights are between 0 and 0.4, but non-highlights can be any length.
Adjustment. The adjustment stage aims to overcome the second limitation of the naive implementation. Given a set of messages in a sliding window which are predicted to be talking about a highlight, we aim to estimate the start position of the highlight.
The key observation is that people can only comment on a highlight after they have seen it. We first detect the peak in the sliding window, where a peak represents the time when the message number reaches the top. After that, we train a model to capture the relationship between the peak’s position () and the highlight’s start position ().
The current implementation considers a simple linear relationship, i.e., , where is a constant value. We can learn the optimal value of from training data. Specifically, for each labeled highlight , the highlight’s ground-truth start position is denoted by . Since it is predicated as , the red dot will be put at . Our goal is to identify as many good red dots as possible. Thus, we aim to find the best such that
where if it is a good red dot; , otherwise.
Once is obtained, we can use it to get the red dot positions. For example, suppose the learned = 20s. It means that we will move the peak backward by 20s. Imagine = 2010s. Then we will select - 20s = 1990s as a red dot’s position. This simple linear relationship leads to good performance as shown in later experiments. We defer the exploration of more complex relationships to future work.
Algorithm Description. To put everything together, Algorithm 1 shows the pseudo-code of the Highlight Initializer component. The input consists of the set of all the time-stamped messages of video , the video length , the number of one’s desired highlights , the sliding window size , the adjustment value , and Trained Logistic Regression Model, LRmodel. The output is the highlight sliding window list, , where is respectively the start and end time of a sliding window .
In line 1, we initially generate the sliding window list . When two sliding windows have an overlap, we keep the one with more messages. From line 2 to line 6, for each sliding window , we apply the trained logistic regression model on the feature vector which is extracted from the massages whose timestamps are in the range of . Lines 7 and 8 retrieve the top-k highlight sliding windows . In function, we make sure that does not contain too close highlights. From line 9 to 11, we adjust the start time by for each sliding window in . Finally, we return as an output.
V Highlight Extractor
This section presents the design of Highlight Extractor. We first define the design objective, then discuss the challenges, and finally propose the detailed implementation.
V-A Design Objective
Highlight Extractor aims to identify the boundary (start and end positions) of each highlight using user interaction data.
User Interaction Data. While watching a video, a user may have different kinds of interactions with the video (e.g., Play, Pause, Seek Forward, and Seek Backward). We analyze user interaction data, and find that if a certain part of video has a large number of views, then this part is very likely to be a highlight. Based on this observation, we transform user interaction data into play data, where each record is in the form of: . For example, means that the user Alice starts playing the video at 100s, and stops at 120s. If the context is clear, we will abbreviate it as and call a play.
We leverage the play data to extract highlights. Note that if a play is far away from a red dot, it may be associated with another highlight. Thus, we only consider the plays within around a red dot (s by default).
The following defines the objective of Highlight Extractor.
Objective. Given the play data w.r.t. a red dot, Highlight Extractor aims to identify the start and end positions of the highlight of the red dot.
V-B Challenges
To achieve the objective, we need to address the following challenges.
How to filter play data? Play data could be very noisy. For example, a user may randomly pick up a position , and watch for a few seconds (e.g., 5s) to check whether this part of video is interesting or not. If uninteresting, she may jump to another position. Obviously, we should filter this since it cannot be interpreted as the user enjoying watching . Note that this example only shows one type of noisy play. There could be many others that need to be considered.
How to aggregate play data? Let donate the play data after the filtering. Each play can be considered as a vote for the highlight. For example, means that the user votes 1990s and 2010s as the start and end positions of the highlight. Users may have different opinions about the highlight. We can aggregate their opinions using median because it is robust to outliers. Thus, the new start and end positions are computed as and .
Unfortunately, when applying this idea to real-world user interaction data, it does not always work well. We have a very interesting observation: whether this idea works well or not strongly depends on the relative positions of the red dot and the highlight. There are two possible relative positions:
Type I: the red dot is after the end of the highlight;
Type II: the red dot is before the end of the highlight.
Since many users start watching the video from a red dot, if they do not find anything interesting, they may skip to the next red dot. Imagine the red dot is put after the end of the highlight (i.e., Type I). Many users may miss the highlight, thus their play data are not reliable indicators of the highlight. Imagine the red dot is put before the start of the highlight (i.e., Type II). Many users will watch the same highlight, thus their play data follow a similar pattern.
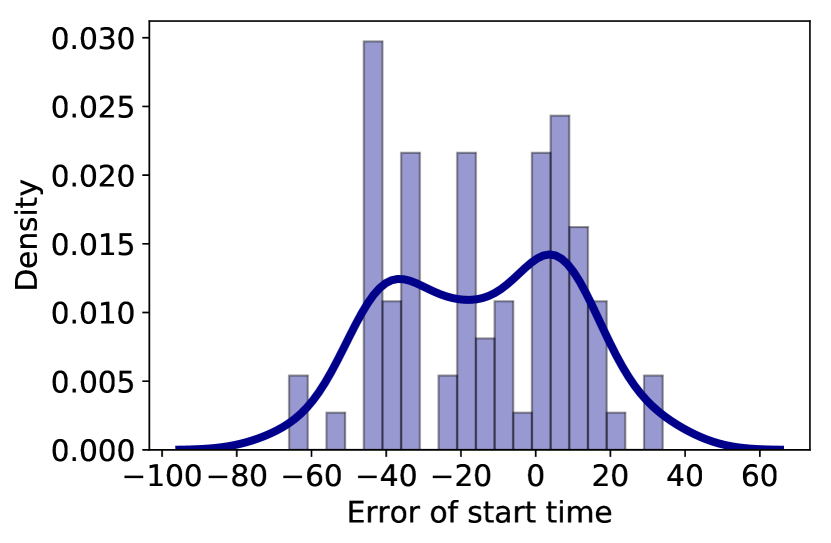
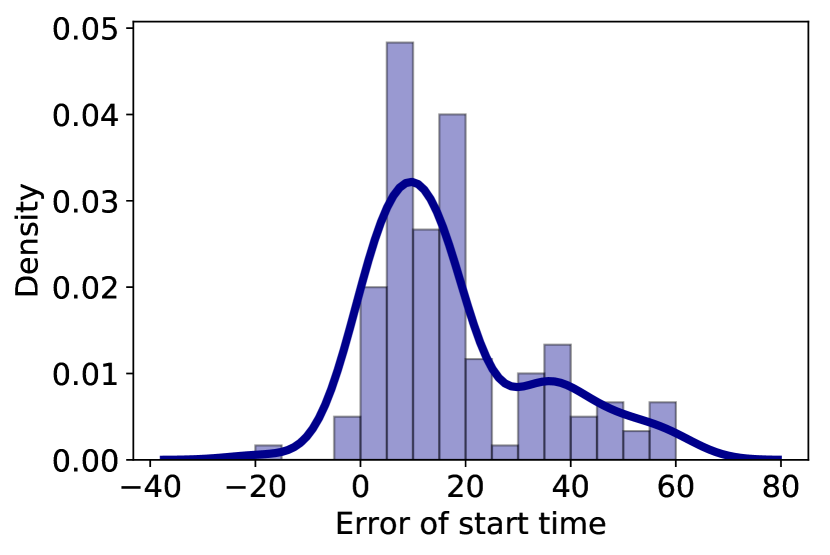
To further examine this observation, we calculate the difference of each play’s start position and the ground-truth start position. Figure 3(a) shows the distribution of all plays of Type I. We can see the curve approximately follows a uniform distribution between -40 and +20. It shows that the play activities for Type I are quite diverse. Users may either play back randomly in order to find the highlight or skip to the next highlight. In comparison, Figure 3(b) shows the distribution of all plays of Type II. We can see the curve approximately follows a normal distribution. It implies that most plays for Type II correspond to highlight watching.
This observation poses two new questions. The first one is that given a red dot, how to determine whether it belongs to Type I or Type II? The second one is that after a red dot is classified as Type I or II, how to aggregate its play data?
V-C Implementation
We propose a series of techniques to address these challenges. The following shows our detailed implementation.
Filtering. The main idea is to filter the plays that are not about watching the highlight but about doing something else (e.g., looking for a highlight). We observe that if a play is far away from the red dot, it typically does not cover the highlight. Thus, we remove such plays from the data. We also notice that if a play is too long or too short, it tends to have little value. A too short play could indicate that viewers watch for a few seconds and find it uninteresting, while a too long play means that viewers may be watching the entire video. Thus, we remove such plays from the data. Third, there could be some outliers, i.e., the play that is far away from the other plays. We adopt the following outlier detection method to find the outliers and then remove them.
We construct an undirected graph . Each node represents a play record, where is respectively the start and end time. Each edge represents that and have overlapping part. Then we find the center node of the graph which has the largest degree. We select and its neighbor nodes as valuable play data and treat the others as outliers. That is, Outliers = .
Classification. Given a red dot, we build a classification model to determine whether it belongs to Type I or Type II. We need to classify the relative position between the red dot and the end of the highlight into Type I or Type II. We find that this (unknown) relative position has a strong correlation with the (known) relative position between the red dot and observed play data. Therefore, we identify the following three features.
-
•
# Plays after red dot computes the number of plays which start at or after the red dot.
-
•
# Plays before red dot computes the number of plays which end before the red dot.
-
•
# Plays across red dot computes the number of plays which starts before the red dot and ends after the red dot.
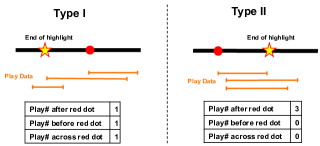
Figure 4 shows an example to illustrate the three features. For Type I, since the highlight ends before the red dot, some users play before or across the red dot in order to find the highlight. In comparison, there is no such play in Type II since if a user starts watching the video at the red dot, she will see the highlight. Our experiments show that our classification model achieves high accuracy (around 80%).
Aggregation. Different aggregation strategies are proposed for Type I and Type II, respectively.
For Type II, as Figure 3(b) shows, the play patterns of most users are similar. The median of the start time offsets is between 5 and 10. This is because that the most exciting part of the highlight usually happens a few seconds after its start point, which causes users to skip the beginning of the highlight. This kind of error is tolerable. Therefore, we can use median to aggregate their play data.
For Type I, as seen from Figure 3(a), the distribution of start time offsets is rather random. Therefore, we need to collect more play data. Our main idea is to convert a red point from Type I to Type II. Given that Type II can collect high-quality play data, once a red dot is converted to Type II, we can get high-quality play data as well. Specifically, once a red dot is classified as Type I, we will move it backward by a constant time (e.g., 20s) and collect new interaction data based on the new red dot location. If the new red dot is classified as Type II, we apply the Type II’s aggregation approach; otherwise, we move it backward by another 20s.
Algorithm Description. To put everything together, Algorithm 2 shows the pseudo-code of the entire Highlight Extractor component. The input consists of a highlight , and a moving duration for Type I, which is a constant described above to convert a Type I to a Type II. The output is the updated .
In lines 2 and 3, we get the user interactions for the current and filter them to get a list of plays, . In lines 4 and 5, we extract the feature from and perform the binary classification to decide ’s . From lines 6 to 14, as we describe above in Aggregation, we update . If is Type II, it means the red dot is before the end of the highlight. From lines 7 to 10, we remove the plays whose ends are before the red dot. Then, we calculate the median to update . If is Type I, it means the red dot is after the end of the highlight, and we move backward by . We iterate this procedure until the red dot position is stable (e.g., ).
VI Deploy Lightor in Practice
In this section, we discuss two ways to deploy the Lightor workflow: one is to wrap it as a web browser extension and the other is to integrate it into existing live streaming platforms.
VI-A Web Browser Extension
Figure 5 depicts the architecture of our web browser extension. It has the potential to support any live streaming platform. We will use Twitch as an example to illustrate how it works.
In addition to the Lightor’s core components, we need two additional components: Web Service and Web Crawler.
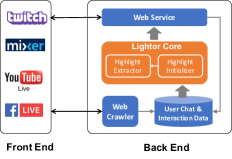
Web Service. When a user opens up a web page in Twitch, if the URL of the web page is a recorded video, Lightor will be automatically activated. It extracts the Video ID from the web page and sends it to the back end server. The server receives the Video ID and checks whether the video’s chat messages have been crawled and stored in the database. If not, it will call the web crawler component to crawl the chat messages. After that, it will use the chat data to identify the positions of top- highlights and return them to the front end. The returned results will be rendered on the original web page by adding red dots on the progress bar of the video. Meanwhile, the user interaction data will be logged. Highlight Extractor will use the data to refine the results. The refined results will be stored in the database continuously.
Web Crawler. The web crawler component crawls the chat messages of recorded videos in Twitch. The crawled chat messages will be stored into the database. The crawling process can be executed both offline and online. The offline crawling periodically checks a given list of popular channels. If new videos are uploaded in those channels, their chat messages will be crawled accordingly. The online crawling will crawl the chat messages on the fly. It will be triggered if the chat messages of a video do not exist in the database.
VI-B Integrate Into Live Streaming Platforms
Lightor can be easily deployed into existing live streaming platforms. The only change is to add red dots to the progress bar of recorded videos. It is easy to implement this feature from a technical point of view. Moreover, based on our user study, this new interface is more attractive since it can help users find more interesting highlights.
Lightor is also useful for improving existing features. For example, Twitch allows broadcasters to cut and upload the highlights of their recorded videos manually. Lightor can provide broadcasters with a set of highlight candidates. This will help broadcasters save a lot of time when they need to edit their highlights repeatedly.
VII Experiments
We evaluate Lightor on real live video data. The experiments aim to answer three questions. (1) How well does Highlight Initializer perform? (2) How well does Highlight Extractor perform? (3) How does Lightor compare with deep-learning based approaches? We will first describe experimental settings and then present experimental results. We provide a reproducibility report in the github repo (https://github.com/sfu-db/Lightor˙Exp), including data description, data preprocessing, model parameters and configurations, and a Jupyter notebook to reproduce all experimental figures.
VII-A Experimental Settings
Game videos dominate mainstream live streaming platforms such as Twitch and Mixer. They were also used to evaluate the state-of-the-art highlight detection approaches [13, 28]. Therefore, we evaluated Lightor using two popular games from Twitch: Dota2 and LoL.
Game Videos. (1) Dota2. We crawled 60 live videos in Dota 2 using Twitch APIs. The length of each video is between 0.5 hour to 2 hours. We asked experienced game players to watch each video and manually label the start and end positions of each highlight. Each video contains 10 labeled highlights on average. The length of each highlight is between 5s to 50s. (2) LoL. We selected 173 live videos of League of Legends (LoL) from NACLS dataset [13]. The length of each video is between 0.5 hour to 1 hour. The labels were obtained by matching with highlight collections of a YouTube channel. Each video contains 14 labeled highlights on average. The length of each highlight is between 2s to 81s.
The Dota2 and LoL datasets are different in two aspects. First, the game types are different, and thus raw visual and textual features do not generalize well. Second, the Dota2 videos were from Twitch personal channels, but the LoL videos came from North America League of Legends Championship Series. Thus, their chat data have different characteristics.
Chat and Play Data. Lightor relies on two kinds of user data: chat data and play data. For chat data, Live streaming platforms make the data accessible. We used their APIs to crawl the data. The number of chat messages crawled for each video is between 800 to 4300.
It is quite challenging to collect play data since they are not accessible from a live streaming platform. To the best of our knowledge, there is even no play data publicly available. To collect the data, we recruited game fans from Amazon Mechanical Turk (AMT), and asked them to watch the recorded live videos. Each video’s progress bar has a single red dot since we would like to get rid of the influence of nearby red dots and study user interactions on one red dot directly. We collected the user interaction data and then generated the play data. Note that we did not ask the crowd to enter the start and end positions of a highlight. Therefore, the crowd provided us with the boundary of a highlight implicitly. There were 492 workers participating our experiments and we spent about $750 to create the dataset. We have published the dataset in the above github repo.
Evaluation Metrics: We used Precision@K to evaluate the performance since most users are only interested in watching a small number of highlights (e.g., k = 5 to 10). We defined three Precision@K metrics in the experiments.
(1) Chat Precision@K is to evaluate the effectiveness of the prediction stage in Highlight Initializer. The prediction stage sorts chat-message sliding windows based on how likely they are talking about a highlight, and returns the top- sliding windows. Chat Precision@K is defined as the percentage of correctly identified sliding windows out of the k identified sliding windows.
(2) Video Precision@K (start) is to evaluate the precision of the identified start positions of highlights. Since people typically cannot tolerate more than 10s delay, we say a start position is correct if there exists a highlight such that . Video Precision@K (start) is defined as the percentage of correctly identified start positions out of the k identified start positions.
(3) Video Precision@K (end) is to evaluate the precision of the identified end positions of highlights. It is similar to Video Precision@K (start). We say an end position is correct if there exists a highlight such that . Video Precision@K (end) is defined as the percentage of correctly identified end positions out of the k identified end positions.
Baselines: Highlight detection is a multidisciplinary problem and there are many solutions proposed in different areas. We compared Lightor with the following approaches.
- •
-
•
Online learning based methods aim to detect key clips of How-To and lecture videos by analyzing viewers’ viewing behaviors. SocialSkip [37] analyzes viewers’ skipping and jumping backwards interactions while Moocer [39] mainly focuses on normal playing interactions. We applied them to our play data to identify the boundary of each highlight. We compared these two baselines with Lightor’s Highlight Extractor in Section VII-C.
-
•
Deep Learning based methods train a deep neural network model on a large amount of labeled data and then apply the model to classify each video frame as highlight or non-highlight. We compared Lightor with the state-of-art deep learning approach [13] in Section VII-E. The approach has two models, where chat model (Chat-LSTM) is trained on chat data only and chat-video joint model (Joint-LSTM) is trained on both chat and video data.
Software Versions and Hardware Configuration: Lightor was implemented using Python 3.5. Logistic regression models were trained using scikit-learn 0.20. The experiments were run over a Ubuntu virtual server with an Intel Xeon CPU E7-4830 v4@2.00GHz with RAM 53GB. The sliding window size was set to 25s. The deep learning models were implemented in PyTorch 1.1 and trained on 4 Nvidia Tesla v100 GPUs.
In the following, we first evaluate the Highlight Initializer and Highlight Extractor of Lightor, and then examine the applicability of Lightor on the Twitch platform. Finally, we compare Lightor with the deep learning methods.
VII-B Evaluation of Highlight Initializer
Highlight Initializer consists of prediction and adjustment stages. We evaluated their performance on Dota2 data.
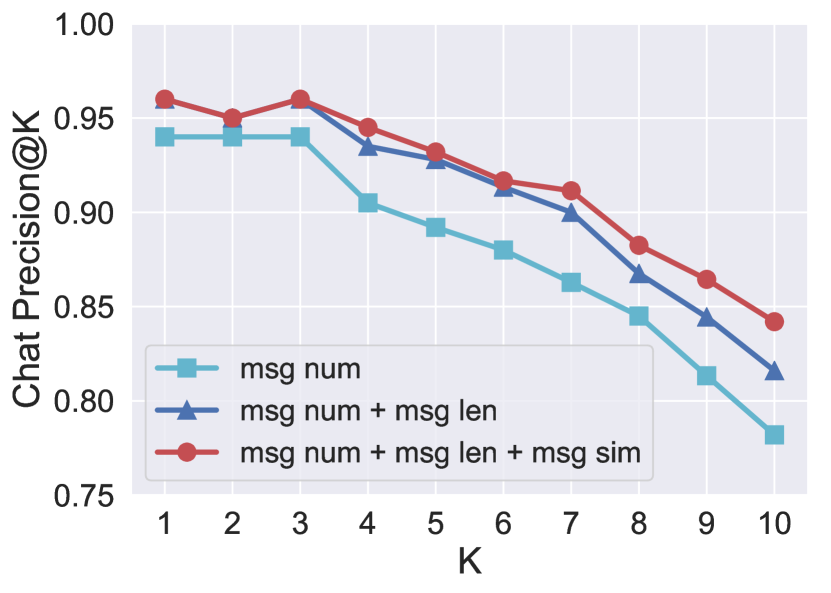
Prediction Stage. The prediction stage is designed to get top sliding windows corresponding to highlights. We propose three features, message number (msg num), message length (msg len), and message similarity (msg sim), and build a logistic regression model based on them. To evaluate the effectiveness of the proposed features, we build two additional logistic regression models using msg num and msg num + msg len. We used 10 video’s sliding windows as training data and used 50 videos’ sliding windows as test data.
Figure 6(a) shows the average Chat Precision@K of the 50 testing videos on different number of desired highlights. We have two interesting observations. First, msg num was an effective feature for small k () but did not perform well as k got larger (e.g., ). This is because that as k increased, it would be more and more challenging to detect new highlights. If we only used the msg num feature, these messages sometimes were sent because viewers were discussing something on random topics which were not related to the highlights. Second, the ML model using all three features was better at capturing the nature of highlight messages especially when one wants to detect more than 5 highlights. The reason is that when viewers saw a highlight, their messages tended to be in a similar pattern. In addition to actively sending more messages, they would send more short messages such as Emojis or Stickers which make the average length of messages in the sliding windows shorter than common ones. When viewers were talking about something particular in the highlights, the messages would have a higher similarity.
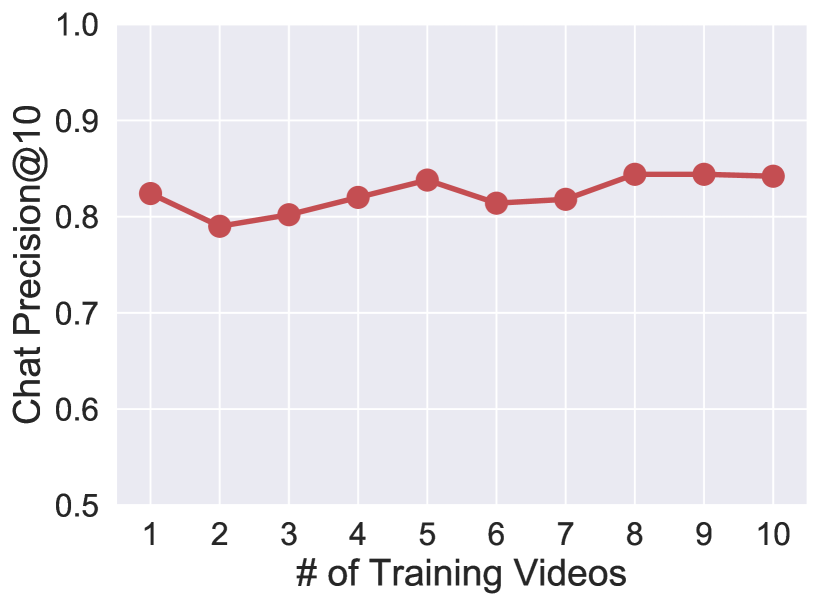
We examine whether our method can still perform well on small training data. We varied the number of training videos from 1 to 10 and trained ten models w.r.t. different training size. Figure 6(b) shows the average Chat Precision@10 of each model evaluated on the 50 testing videos. We can see that the performance stayed stable. For example, when there was only one training video, our method can still achieve the precision of 0.82. The reason for this impressive result is that our ML model was built on a small number of highly effective features.
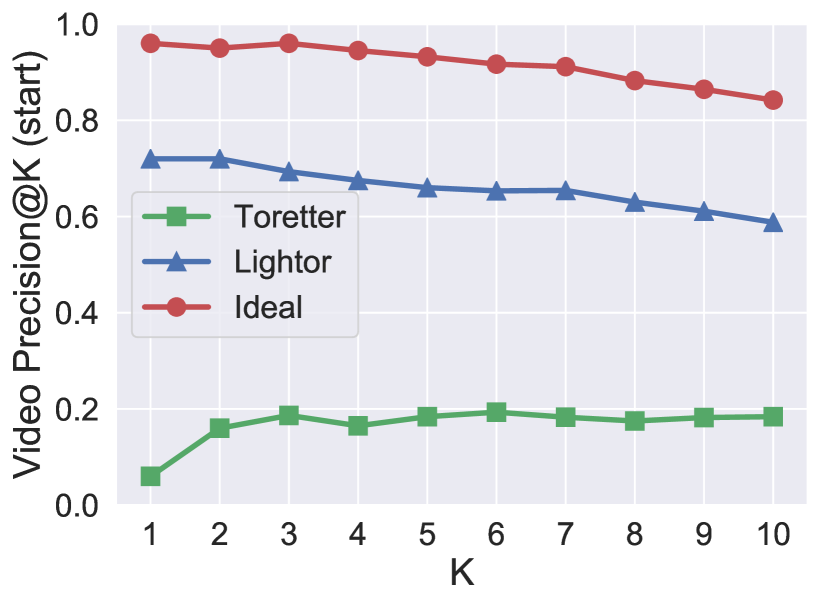
Adjustment Stage. Suppose the prediction stage returns sliding windows as highlights. Then, the adjustment stage aims to find the approximate start positions of the highlights (i.e., red dots). It first finds the peak in each sliding window and subtracts it by a constant value (learned from labeled data) to get the red dot. We used ten videos as training data to get the constant value, and evaluated Video Precision@K (start) on fifty testing videos. The ideal situation of the adjustment stage is to be able to get a correct red dot for every top- highlight. So the Ideal curve in Figure 7(a) is the same as the red line in Figure 6(a). Toretter is a social-network based highlight detection approach. It detects highlights based on the time-series curve of message number. We compare with it to examine the necessity of having the adjustment stage in Highlight Initializer. From Figure 7(a), we can see that Toretter’s precision was below . Our adjustment method outperformed Toretter by around . This result validates that i) there is indeed a delay between the start of a highlight and the discussion of the highlight; ii) our adjustment method can capture the delay well.
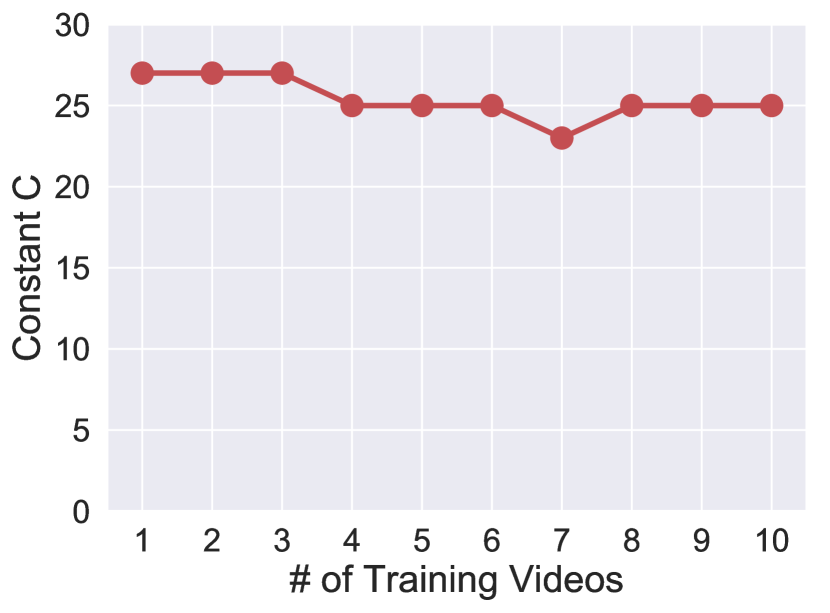
We investigate how robust the constant value is by varying the number of training videos. Figure 7(b) shows the result. We can see that the constant value kept stable. It was in the range from 23s to 27s. This is because that users tend to have similar behaviors when watching highlights. It could be considered as ”reaction time” of viewers, so that we can use a small amount of training data to generate a quite accurate constant value for adjustment.
VII-C Evaluation of Highlight Extractor
Highlight Extractor aims to leverage play data to identify the boundary of each highlight. We compared our method with SocialSkip [37] and Moocer [39]. Both methods model the interaction data as a histogram along the timeline. Each bin represents a 1-second video clip, and the bin height represents how interesting the video clip is. SocialSkip leverages Seek Backward & Forward to construct the histogram. When Seek Forward/Backward happens, it indicates that the range that the user jumps is interesting/uninteresting. The bin height would be added by +1/-1 accordingly. Once all user interactions are collected, SocialSkip smooths the histogram curve and finds all local maxima of the curve. SocialSkip subtracts each local maximum by 10s as the start position and adds it by 10s as the end position of a highlight. Differently, Moocer only leverages Play interactions. When Plays happen, the histogram range being played will be added by 1. After smoothing, Moocer finds the local maxima as well. For each local maximum, it finds two turning points aside the local maximum as the start and end position of a highlight.
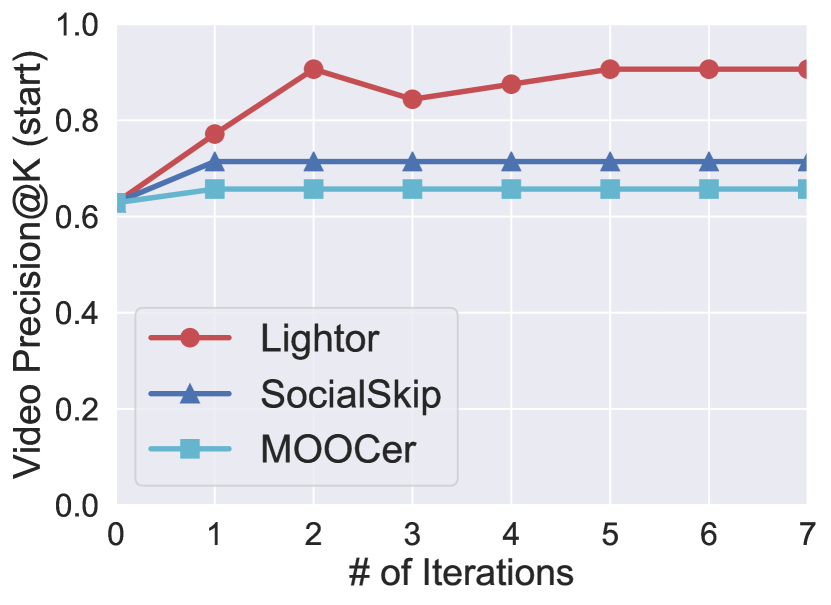
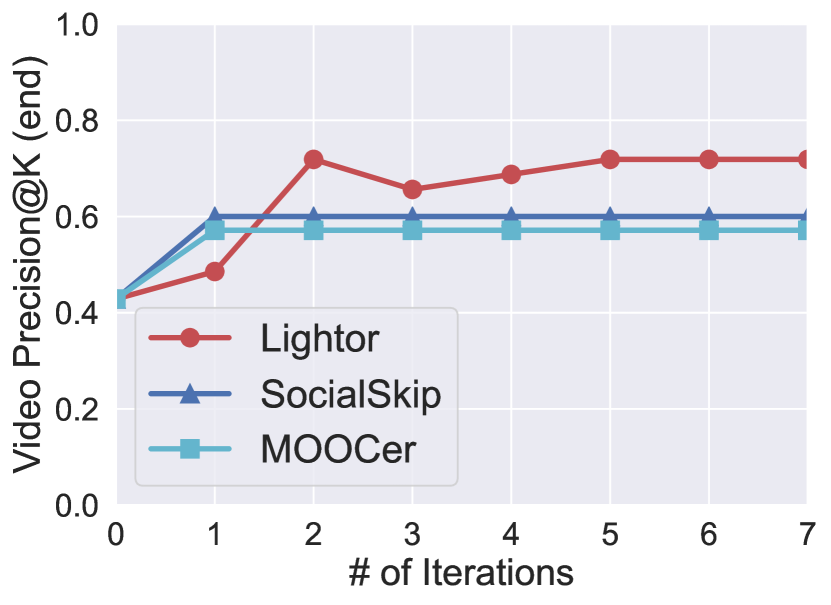
We randomly selected 7 testing videos, and applied Highlight Initializer on them to generate 35 red dots (5 per video). We created one task for each red dot. We first published the 35 tasks to AMT. After receiving 10 responses for each task, we computed the new position of each red dot, and published a set of new tasks with updated red-dot positions to AMT. We repeated this process until users reached a consensus on the extracted highlights. Since SocialSkip and Moocer are not iterative, we applied them using our first iteration of interaction data. Figure 8 shows how Video Precision@K (start) and Video Precision@K (end) change over iterations. We can see that Lightor kept improving over iterations, and outperformed SocialSkip and Moocer by a big margin in the last iteration. This improvement came from two sources. On one hand, it removed the red dots that did not talk about a highlight (i.e., improving the prediction stage in Highlight Initializer); on the other hand, it made a better adjustment about where a red dot should be put (i.e., improving the results of adjustment stage in Highlight Initializer).
VII-D Applicability of Lightor in Twitch
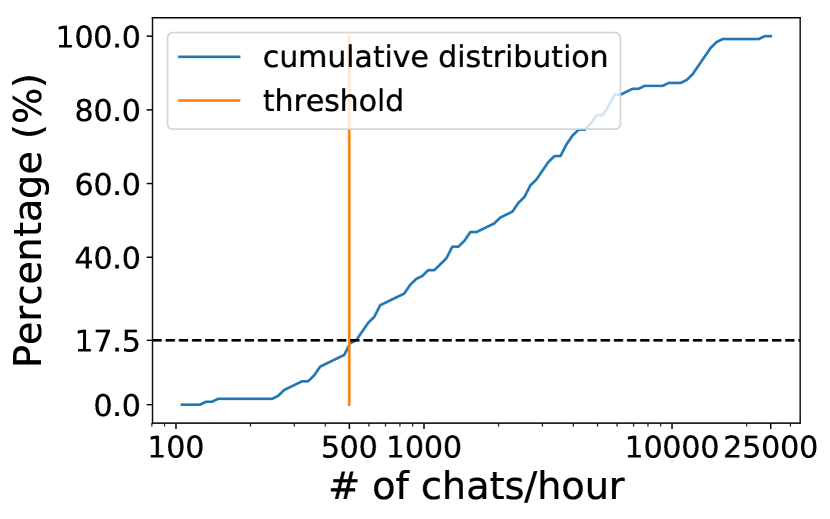
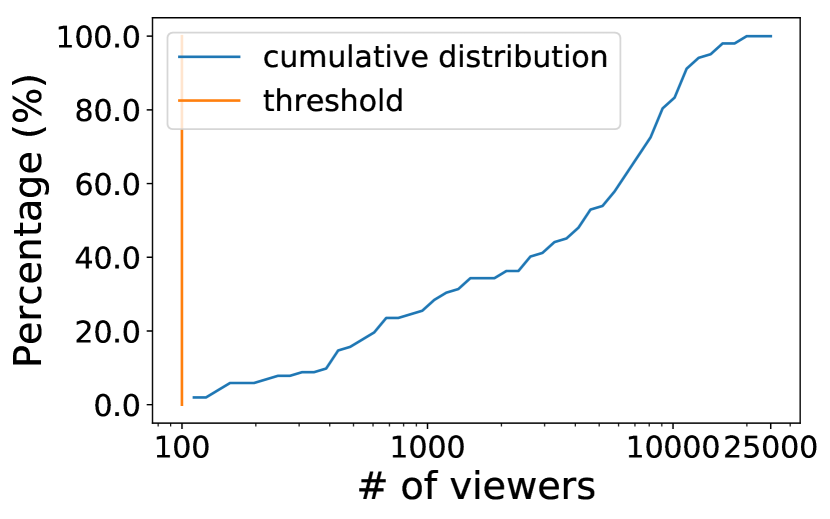
Based on our experiments, in order to achieve high precision, Highlight Initializer requires the number of chat messages per hour larger than 500 and Highlight Extractor requires more than 100 viewers per video. We examine the applicability of Lightor with these requirements in Twitch.
We selected the top-10 channels in Dota 2 and crawled twenty most recently recorded videos from each channel. We plot the CDF of the number of chat messages and the number of viewers, respectively. Figure 9 shows the results. We see that more than of recorded videos have more than 500 chat messages per hour and all the recorded videos have more than 100 viewers. These results indicate that Lightor is applicable to the majority of popular videos in Twitch.
VII-E Comparison with Deep Learning
We compared Lightor with the state-of-the-art deep learning approach [13]. We first compared Lightor’s Highlight Initializer with Chat-LSTM since both of them use chat messages only. Then we conducted an end-to-end comparison between Lightor and Joint-LSTM.
Chat-LSTM is a character-level 3-layer LSTM-RNN [42] model. For each labeled frame, it treats all chat messages that occur in the next 7-second sliding window as input. Joint-LSTM is built on top of a video model and Chat-LSTM. The video model uses a memory-based LSTM-RNN on top of image features extracted from pre-trained image models. We used LoL dataset to train models and applied on both LoL and Dota2 datasets. We applied Chat-LSTM and Joint-LSTM to predict the probability of each frame being a highlight, and selected the top-k frames. Close frames usually mean they belong to the same highlight, thus if two frames are close to each other (within 120s which is consistent with our setting in Section IV-A), we only pick up the frame with a higher probability.
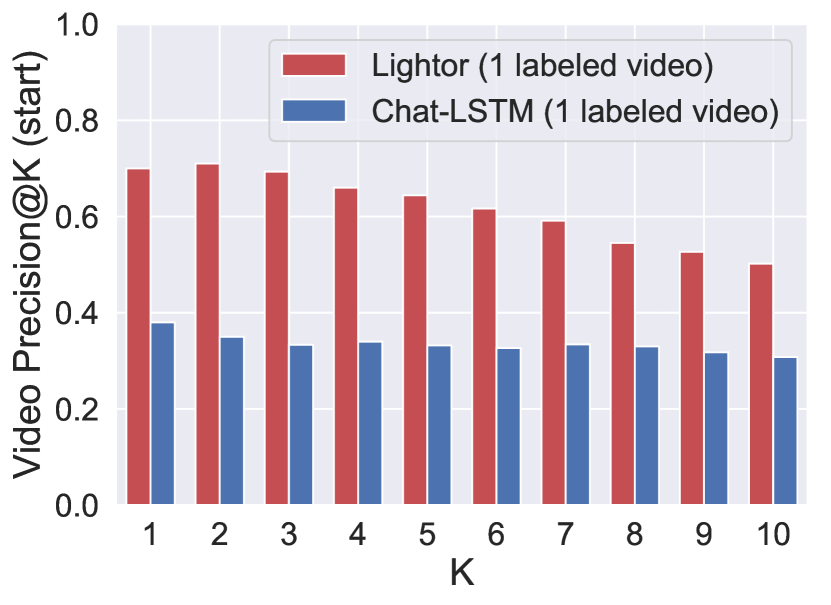
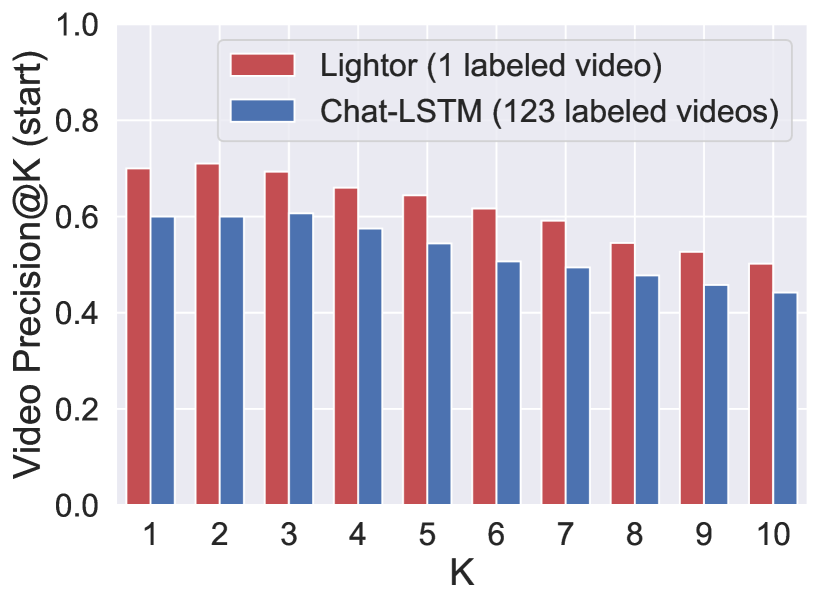
Comparison with Chat-LSTM. We first compare Lightor with Chat-LSTM in terms of training data size. Figure 10(a) shows the result. We can see that Lightor only needed to label a single video in order to achieve a high precision, but Chat-LSTM did not perform well with a single labeled video. This is because that Lightor detects highlights based on a small number of generic features. We increased the training size of Chat-LSTM to 123 labeled videos, and compared with Lightor with 1 labeled training video. As shown in Figure 10(b), Chat-LSTM’s performance got improved but still performed worse than Lightor. This is because that Chat-LSTM is not good at adjusting delay between chat messages and video contents.
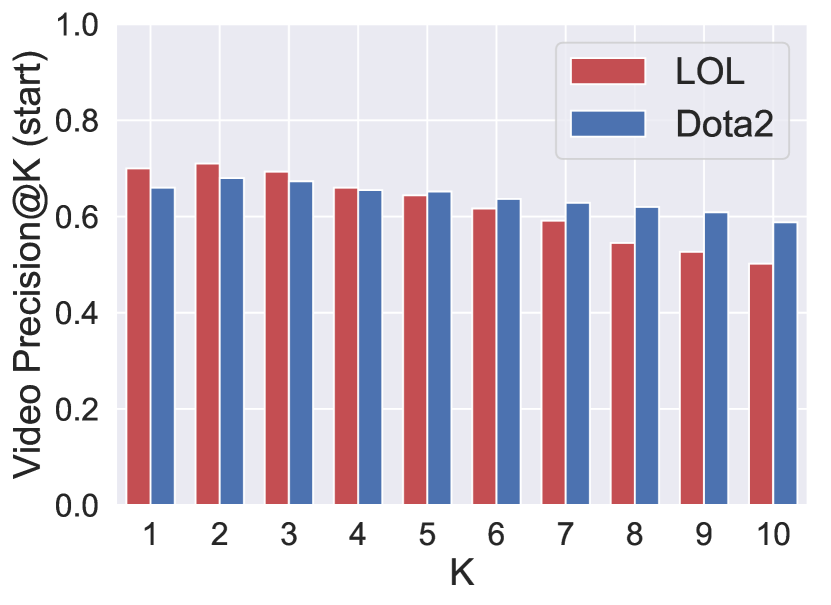
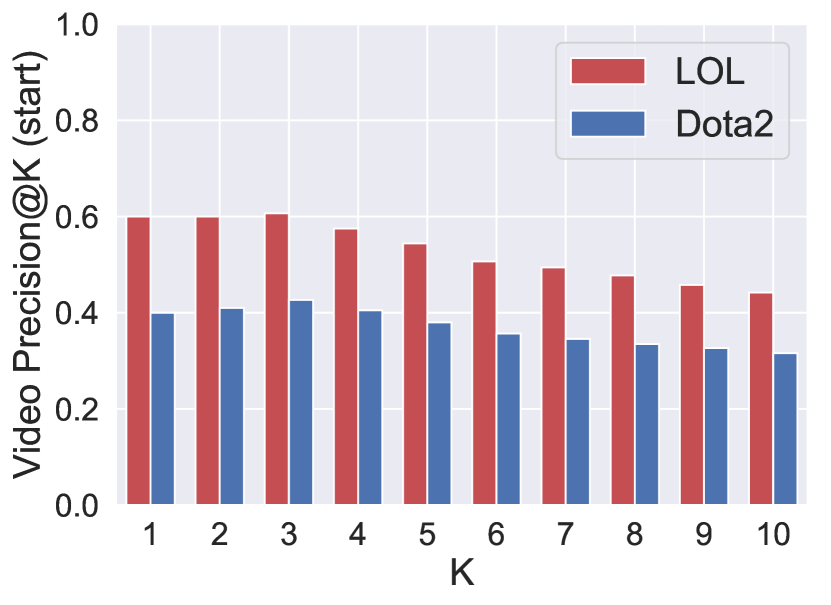
We then compare Lightor with Chat-LSTM in terms of model generalization. Figure 11 shows the result. In Figure 11(a) we can see that for Lightor, the model trained on one game type (LoL) can still achieve high precision on another game type (Dota2). Lightor has good generalization because the selected features are very general. Interestingly, Lightor performed even better on Dota2 data for . This is because Dota2 videos have more highlights. For Chat-LSTM, as shown in Figure 11(b), there is a big performance gap between LoL and Dota2. That is, if we trained the Chat-LSTM model on one game type (LoL) and then tested it on another game type (Dota2), the model did not generalize well.
Comparing with Joint-LSTM. We compare Lightor with Joint-LSTM on their end-to-end performance. Lightor was trained on 1 labeled LoL video and collected user interactions, while Joint-LSTM was trained on 123 labeled LoL videos. We tested them on seven Dota2 videos. Table I reports their training time and Video Precision of Top-5 highlights (k=5). In terms of efficiency, Lightor required 100000 less training time compared to Joint-LSTM. In terms of effectiveness, Lightor achieved a Video Precision@K (start) of 0.906 and a Video Precision@K (end) of 0.719, while the Video Precision@K (start) and the Video Precision@K (end) of Joint-LSTM are both round 0.6. This is because that Lightor has a much better generalization than Joint-LSTM.
| Systems | Precision@K | Precision@K | Training time |
|---|---|---|---|
| (Start) | (End) | ||
| Lightor | 0.906 | 0.719 | 1.06 sec |
| Joint-LSTM | 0.629 | 0.600 | 3 days |
In summary, the experimental results indicate that Lightor has great advantages over these deep-learning based approaches in terms of training data size, computational cost and generalization. Nevertheless, we do not argue to totally replace the deep-learning based approach with Lightor. Deep learning has its own advantages. For example, if a deep learning model is trained over video data, it does not need chat messages or user interaction data to detect highlights. An interesting future direction is to explore how to combine Lightor with Deep Learning, where Lightor is used to generate high-quality labeled data and Deep Learning is then applied to train a model.
VIII Findings & Lessons learned
We present interesting findings and lessons learned.
-
•
It is important to do a pilot test and analyze real user interaction data. For example, we originally thought that Seek Backward could be a useful indicator to detect start positions of highlights. However, from real data we find that since there are various reasons to trigger this interaction (e.g., re-watch a highlight, look for a new highlight), it is not easy to infer users’ true intent.
-
•
The recorded live videos in Twitch typically attract thousands of viewers on average. In our experiments, we recruited around 500 viewers and showed promising results. Based on these findings, we believe that there is no obstacle for Lightor to collect enough user interaction data in real live streaming platforms.
-
•
Users prefer spreading the red dots over the entire progress bar, instead of cluttering them in a narrow region. They think the former can help them have a broader overview of the whole video, while the latter only shows the content of part of the video.
-
•
Viewers sometimes get excited about the interesting clips that are not related to a video’s main theme, such as the break between two games, or the preparation for a game. Lightor may identify these clips as highlights. We will study how to overcome this limitation in future work.
IX Conclusion & Future work
We presented Lightor, a novel implicit crowdsourcing workflow to extract highlights for recorded live videos. Lightor consists of two components. In Highlight Initializer, we explored different design choices and justified our decisions. We proposed three generic features (message number, message length, and message similarity) and built a model to predict highlight positions. We also noticed that there is a delay between a highlight and its comments, and proposed a simple learning-based approach to estimate the delay. In Highlight Extractor, we identified the challenges to use noisy user interaction data to extract highlights, and proposed a three-stage dataflow (filtering classification aggregation) to address these challenges. We discussed how to implement Lightor as a web browser extension and how to integrate Lightor into existing live streaming platforms. We recruited about 500 real users and evaluated Lightor using real Dota 2 and LoL data. We compared with various baselines in the social network, online learning, and deep learning fields. The results showed that Lightor achieved very high detection accuracy (Precision@K: 70%-90%). Furthermore, it only needed to label a single video and spend a few seconds on training, and the obtained model had good generalization.
There are many future research directions to explore. First, we were told by the data science team at a well-known live streaming platform that they stored several terabytes of chat data, but have not tried to extract value from the data. We are planning to deploy Lightor on their platform, and conduct more large-scale real-world experiments. We would like to extensively test our system in terms of the volumes and diverse types of videos. Second, we want to further optimize the workflow, especially on the adjustment stage. The current implementation assumes that there is a simple linear relationship between and . We plan to relax this assumption and build a more sophisticated regression model. Third, we plan to further evaluate the generalization of our system using data collected from other domains (e.g., celebrity events) and other live streaming platforms (e.g., YouTube Live). Fourth, this paper demonstrates a great potential of the application of implicit crowdsourcing to video highlight detection. It is promising to investigate how to design an implicit crowdsourcing workflow for other video analysis tasks (e.g., video querying, video summarization, and video indexing).
References
- [1] C. V. N. Index, “Cisco vni forecast and methodology, 2015–2020,” Cisco white paper, vol. 1, 2016.
- [2] B. Wu, E. Zhong, B. Tan, A. Horner, and Q. Yang, “Crowdsourced time-sync video tagging using temporal and personalized topic modeling,” in SIGKDD, 2014.
- [3] J. Lee, S. Abu-El-Haija, B. Varadarajan, and A. P. Natsev, “Collaborative deep metric learning for video understanding,” in ACM SIGKDD, 2018, pp. 481–490.
- [4] D. Kang, J. Emmons, F. Abuzaid, P. Bailis, and M. Zaharia, “Noscope: Optimizing deep cnn-based queries over video streams at scale,” PVLDB, vol. 10, no. 11, pp. 1586–1597, 2017.
- [5] S. Krishnan, A. Dziedzic, and A. J. Elmore, “Deeplens: Towards a visual data management system,” arXiv preprint arXiv:1812.07607, 2018.
- [6] B. Haynes, A. Mazumdar, A. Alaghi, M. Balazinska, L. Ceze, and A. Cheung, “Lightdb: A DBMS for virtual reality video,” PVLDB, vol. 11, no. 10, pp. 1192–1205, 2018.
- [7] Y. Lu, A. Chowdhery, S. Kandula, and S. Chaudhuri, “Accelerating machine learning inference with probabilistic predicates,” in SIGMOD, 2018, pp. 1493–1508.
- [8] “Twitch Tracker,” https://twitchtracker.com/statistics, 2018, accessed: 2018-11-05.
- [9] Y. Rui, A. Gupta, and A. Acero, “Automatically extracting highlights for TV baseball programs,” in ACM MM, 2000, pp. 105–115.
- [10] A. Ekin, A. M. Tekalp, and R. Mehrotra, “Automatic soccer video analysis and summarization,” IEEE Trans. Image Processing, vol. 12, no. 7, pp. 796–807, 2003.
- [11] H. Yang, B. Wang, S. Lin, D. P. Wipf, M. Guo, and B. Guo, “Unsupervised extraction of video highlights via robust recurrent auto-encoders,” in IEEE ICCV, 2015, pp. 4633–4641.
- [12] T. Yao, T. Mei, and Y. Rui, “Highlight detection with pairwise deep ranking for first-person video summarization,” in CVPR, 2016.
- [13] C. Fu, J. Lee, M. Bansal, and A. C. Berg, “Video highlight prediction using audience chat reactions,” in EMNLP, 2017, pp. 972–978.
- [14] J. Wang, T. Kraska, M. J. Franklin, and J. Feng, “CrowdER: crowdsourcing entity resolution,” PVLDB, vol. 5, no. 11, pp. 1483–1494, 2012.
- [15] S. E. Whang, P. Lofgren, and H. Garcia-Molina, “Question selection for crowd entity resolution,” PVLDB, vol. 6, no. 6, pp. 349–360, 2013.
- [16] L. von Ahn and L. Dabbish, “Labeling images with a computer game,” in CHI, 2004, pp. 319–326.
- [17] “Implicit Crowdsourcing,” https://en.wikipedia.org/wiki/Crowdsourcing#Implicit˙crowdsourcings, 2018, accessed: 2019-06-01.
- [18] L. Von Ahn, B. Maurer, C. McMillen, D. Abraham, and M. Blum, “reCAPTCHA: Human-Based Character Recognition via Web Security Measures,” Science, vol. 321, no. 5895, pp. 1465–1468, 2008.
- [19] T. Joachims, “Optimizing search engines using clickthrough data,” in ACM SIGKDD, 2002, pp. 133–142.
- [20] G. Li, J. Wang, Y. Zheng, and M. J. Franklin, “Crowdsourced data management: A survey,” IEEE Trans. Knowl. Data Eng., vol. 28, no. 9, pp. 2296–2319, 2016.
- [21] Y. Tong, L. Wang, Z. Zhou, L. Chen, B. Du, and J. Ye, “Dynamic pricing in spatial crowdsourcing: A matching-based approach,” in SIGMOD, 2018, pp. 773–788.
- [22] Y. Amsterdamer, S. B. Davidson, T. Milo, S. Novgorodov, and A. Somech, “OASSIS: query driven crowd mining,” in SIGMOD, 2014, pp. 589–600.
- [23] H. Hu, G. Li, Z. Bao, Y. Cui, and J. Feng, “Crowdsourcing-based real-time urban traffic speed estimation: From trends to speeds,” in ICDE, 2016, pp. 883–894.
- [24] Y. Tong, L. Chen, and C. Shahabi, “Spatial crowdsourcing: Challenges, techniques, and applications,” PVLDB, vol. 10, no. 12, pp. 1988–1991, 2017.
- [25] L. Pournajaf, L. Xiong, V. Sunderam, and S. Goryczka, “Spatial task assignment for crowd sensing with cloaked locations,” in 2014 IEEE 15th International Conference on Mobile Data Management, vol. 1. IEEE, 2014, pp. 73–82.
- [26] H. Hu, Y. Zheng, Z. Bao, G. Li, J. Feng, and R. Cheng, “Crowdsourced poi labelling: Location-aware result inference and task assignment,” in 2016 IEEE 32nd International Conference on Data Engineering (ICDE). IEEE, 2016, pp. 61–72.
- [27] S. Novgorodov, G. Elad, I. Guy, and K. Radinsky, “Generating product descriptions from user reviews,” in The World Wide Web Conference. ACM, 2019, pp. 1354–1364.
- [28] Y. Song, “Real-time video highlights for yahoo esports,” CoRR, vol. abs/1611.08780, 2016.
- [29] M. Otani, Y. Nakashima, E. Rahtu, J. Heikkilä, and N. Yokoya, “Video summarization using deep semantic features,” CoRR, vol. abs/1609.08758, 2016.
- [30] A. Kaspar, G. Patterson, C. Kim, Y. Aksoy, W. Matusik, and M. Elgharib, “Crowd-guided ensembles: How can we choreograph crowd workers for video segmentation?” in CHI, 2018.
- [31] Y. Huang, Y. Huang, N. Xue, and J. P. Bigham, “Leveraging complementary contributions of different workers for efficient crowdsourcing of video captions,” in CHI. ACM, 2017, pp. 4617–4626.
- [32] P. Xu and M. Larson, “Users tagging visual moments: timed tags in social video,” in Proceedings of the 2014 International ACM Workshop on Crowdsourcing for Multimedia. ACM, 2014, pp. 57–62.
- [33] Q. Ping and C. Chen, “Video highlights detection and summarization with lag-calibration based on concept-emotion mapping of crowd-sourced time-sync comments,” EMNLP 2017, p. 1, 2017.
- [34] C. Xu, J. Wang, K. Wan, Y. Li, and L. Duan, “Live sports event detection based on broadcast video and web-casting text,” in MM, 2006.
- [35] L. Hsieh, C. Lee, T. Chiu, and W. H. Hsu, “Live semantic sport highlight detection based on analyzing tweets of twitter,” in ICME. IEEE Computer Society, 2012, pp. 949–954.
- [36] T. Sakaki, M. Okazaki, and Y. Matsuo, “Tweet analysis for real-time event detection and earthquake reporting system development,” IEEE Trans. Knowl. Data Eng., vol. 25, no. 4, pp. 919–931, 2013.
- [37] K. Chorianopoulos, “Collective intelligence within web video,” Human-centric Computing and Information Sciences, vol. 3, no. 1, p. 10, 2013.
- [38] J. Kim, P. J. Guo, C. J. Cai, S. D. Li, K. Z. Gajos, and R. C. Miller, “Data-driven interaction techniques for improving navigation of educational videos,” in UIST. ACM, 2014, pp. 563–572.
- [39] J. Kim, P. J. Guo, D. T. Seaton, P. Mitros, K. Z. Gajos, and R. C. Miller, “Understanding in-video dropouts and interaction peaks inonline lecture videos,” in L@S, 2014, pp. 31–40.
- [40] T. Sinha, P. Jermann, N. Li, and P. Dillenbourg, “Your click decides your fate: Leveraging clickstream patterns in MOOC videos to infer students’ information processing and attrition behavior,” CoRR, vol. abs/1407.7131, 2014.
- [41] “Response Times: The 3 Important Limits,” https://www.nngroup.com/articles/response-times-3-important-limits, 1993, accessed: 2019-06-01.
- [42] A. Graves, “Generating sequences with recurrent neural networks,” CoRR, vol. abs/1308.0850, 2013. [Online]. Available: http://arxiv.org/abs/1308.0850