Primary and secondary anti-viral response captured by the dynamics and phenotype of individual T cell clones
Abstract
The diverse repertoire of T-cell receptors (TCR) plays a key role in the adaptive immune response to infections. Using TCR alpha and beta repertoire sequencing for T-cell subsets, as well as single-cell RNAseq and TCRseq, we track the concentrations and phenotypes of individual T-cell clones in response to primary and secondary yellow fever immunization — the model for acute infection in humans — showing their large diversity. We confirm the secondary response is an order of magnitude weaker, albeit days faster than the primary one. Estimating the fraction of the T-cell response directed against the single immunodominant epitope, we identify the sequence features of TCRs that define the high precursor frequency of the two major TCR motifs specific for this particular epitope. We also show the consistency of clonal expansion dynamics between bulk alpha and beta repertoires, using a new methodology to reconstruct alpha-beta pairings from clonal trajectories.
Introduction
T-cells play a crucial role in the immune response to pathogens by mediating antibody formation and clearance of infected cells, and by defining an overall response strategy. The specificity of T-cells is determined by the T-cell receptor (TCR), a heterodimer of alpha and beta protein chains. Genes for alpha and beta chains assemble in a random process of somatic V(D)J-recombination, which leads to a huge variety of possible TCRs (murugan_statistical_2012, ). The resulting diverse naïve repertoire contains T-cell clones that recognize epitopes of yet unseen pathogens, and can participate in the immune response to infection or vaccination. One of the best established models of acute viral infection in humans is yellow fever (YF) vaccination. Yellow fever vaccine is a live attenuated virus with a peak of viremia happening around day 7 after vaccine administration (miller_human_2008, ; akondy_yellow_2009, ; akondy_initial_2015, ). The dynamics of primary T-cell response was investigated by various techniques: cell activation marker staining (miller_human_2008, ; blom_temporal_2013, ; kohler_early_2012, ; kongsgaard_adaptive_2017, ), MHC multimer staining (akondy_yellow_2009, ; blom_temporal_2013, ; james_yellow_2013, ; kongsgaard_adaptive_2017, ), high-throughput sequencing (dewitt_dynamics_2015, ; pogorelyy_precise_2018, ) and deuterium cell labelling (akondy_origin_2017, ). Primary T-cell response sharply peaks around 2 weeks after YFV17D (vaccine strain of yellow fever virus) vaccination (miller_human_2008, ; akondy_yellow_2009, ; kohler_early_2012, ; pogorelyy_precise_2018, ; james_yellow_2013, ). The immune response is very diverse and targets multiple epitopes inside the YF virus (de_melo_t-cell_2013, ; co_human_2002, ; akondy_yellow_2009, ; james_yellow_2013, ; blom_temporal_2013, ). An essential feature of effective vaccination is the formation of immune memory. Although most of the effector cells die shortly after viral clearance, YF-specific T-cells could be found in the blood of vaccinated individuals years (akondy_yellow_2009, ; akondy_origin_2017, ; kongsgaard_adaptive_2017, ; james_yellow_2013, ) and even decades after vaccination (fuertes_marraco_long-lasting_2015, ; wieten_single_2016, ). While the immune response to the primary vaccination has been much studied, there is only limited data on the response to the booster vaccination with YFV17D. Both T-cell activation marker staining and multimer staining show that the secondary response is much weaker than the primary one (kongsgaard_adaptive_2017, ), but their precise dynamics, diversity, and clonal structure are still unknown.
In summary, previous studies provide insight into the macroscopic features of the T-cell response, such as total frequency of T-cells with an activated phenotype, or T-cells specific to a particular viral epitope on different timepoints after vaccination. However, with recently developed methods it is now possible to uncover the microscopic structure of the primary and secondary immune response, such as the dynamics and phenotypes of distinct T-cell clones, as well as the receptor features that determine the recognition of epitopes.
TCR repertoire sequencing allows for longitudinally tracking individual clones of responding T-cells irrespective of their epitope specificity. Single-cell RNAseq (scRNAseq) enables simultaneous quantification of thousands of transcripts per cell for thousands of cells, providing an unbiased characterization of immune cell phenotype. Single-cell TCR sequencing produces paired repertoire data, and thus could help discover conserved sequence motifs in one or both TCR chains. These motifs encode TCR structural features essential to antigen recognition (dash_quantifiable_2017, ; glanville_identifying_2017, ). Information about complete TCR sequences allows homological modeling of TCR structure (schritt_repertoire_2019, ), which can be used for binding prediction with protein-protein docking (pierce_flexible_2013, ). We combine longitudinal TCR alpha and beta repertoire sequencing, scRNAseq, scTCRseq, TCR structure modelling and TCR-pMHC docking simulations to get a comprehensive picture of primary and secondary T-cell response to the yellow fever vaccine – the in vivo model of acute viral infection in humans.
Results
Secondary T-cell response to the YFV17D vaccine is weaker but faster than the primary response
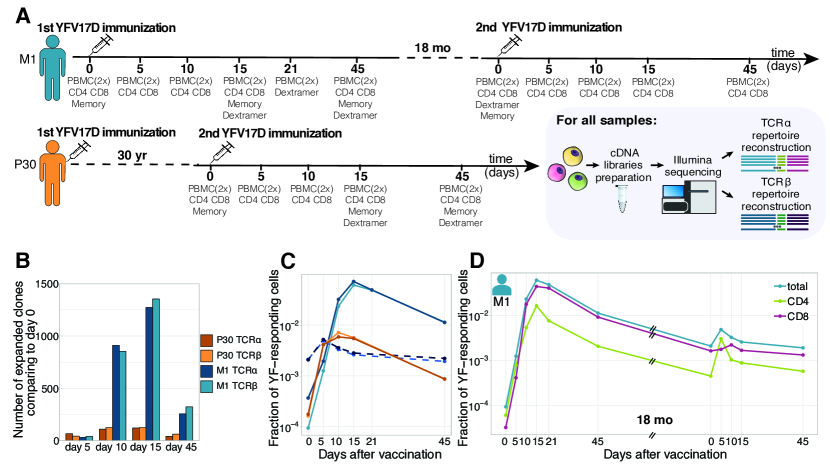
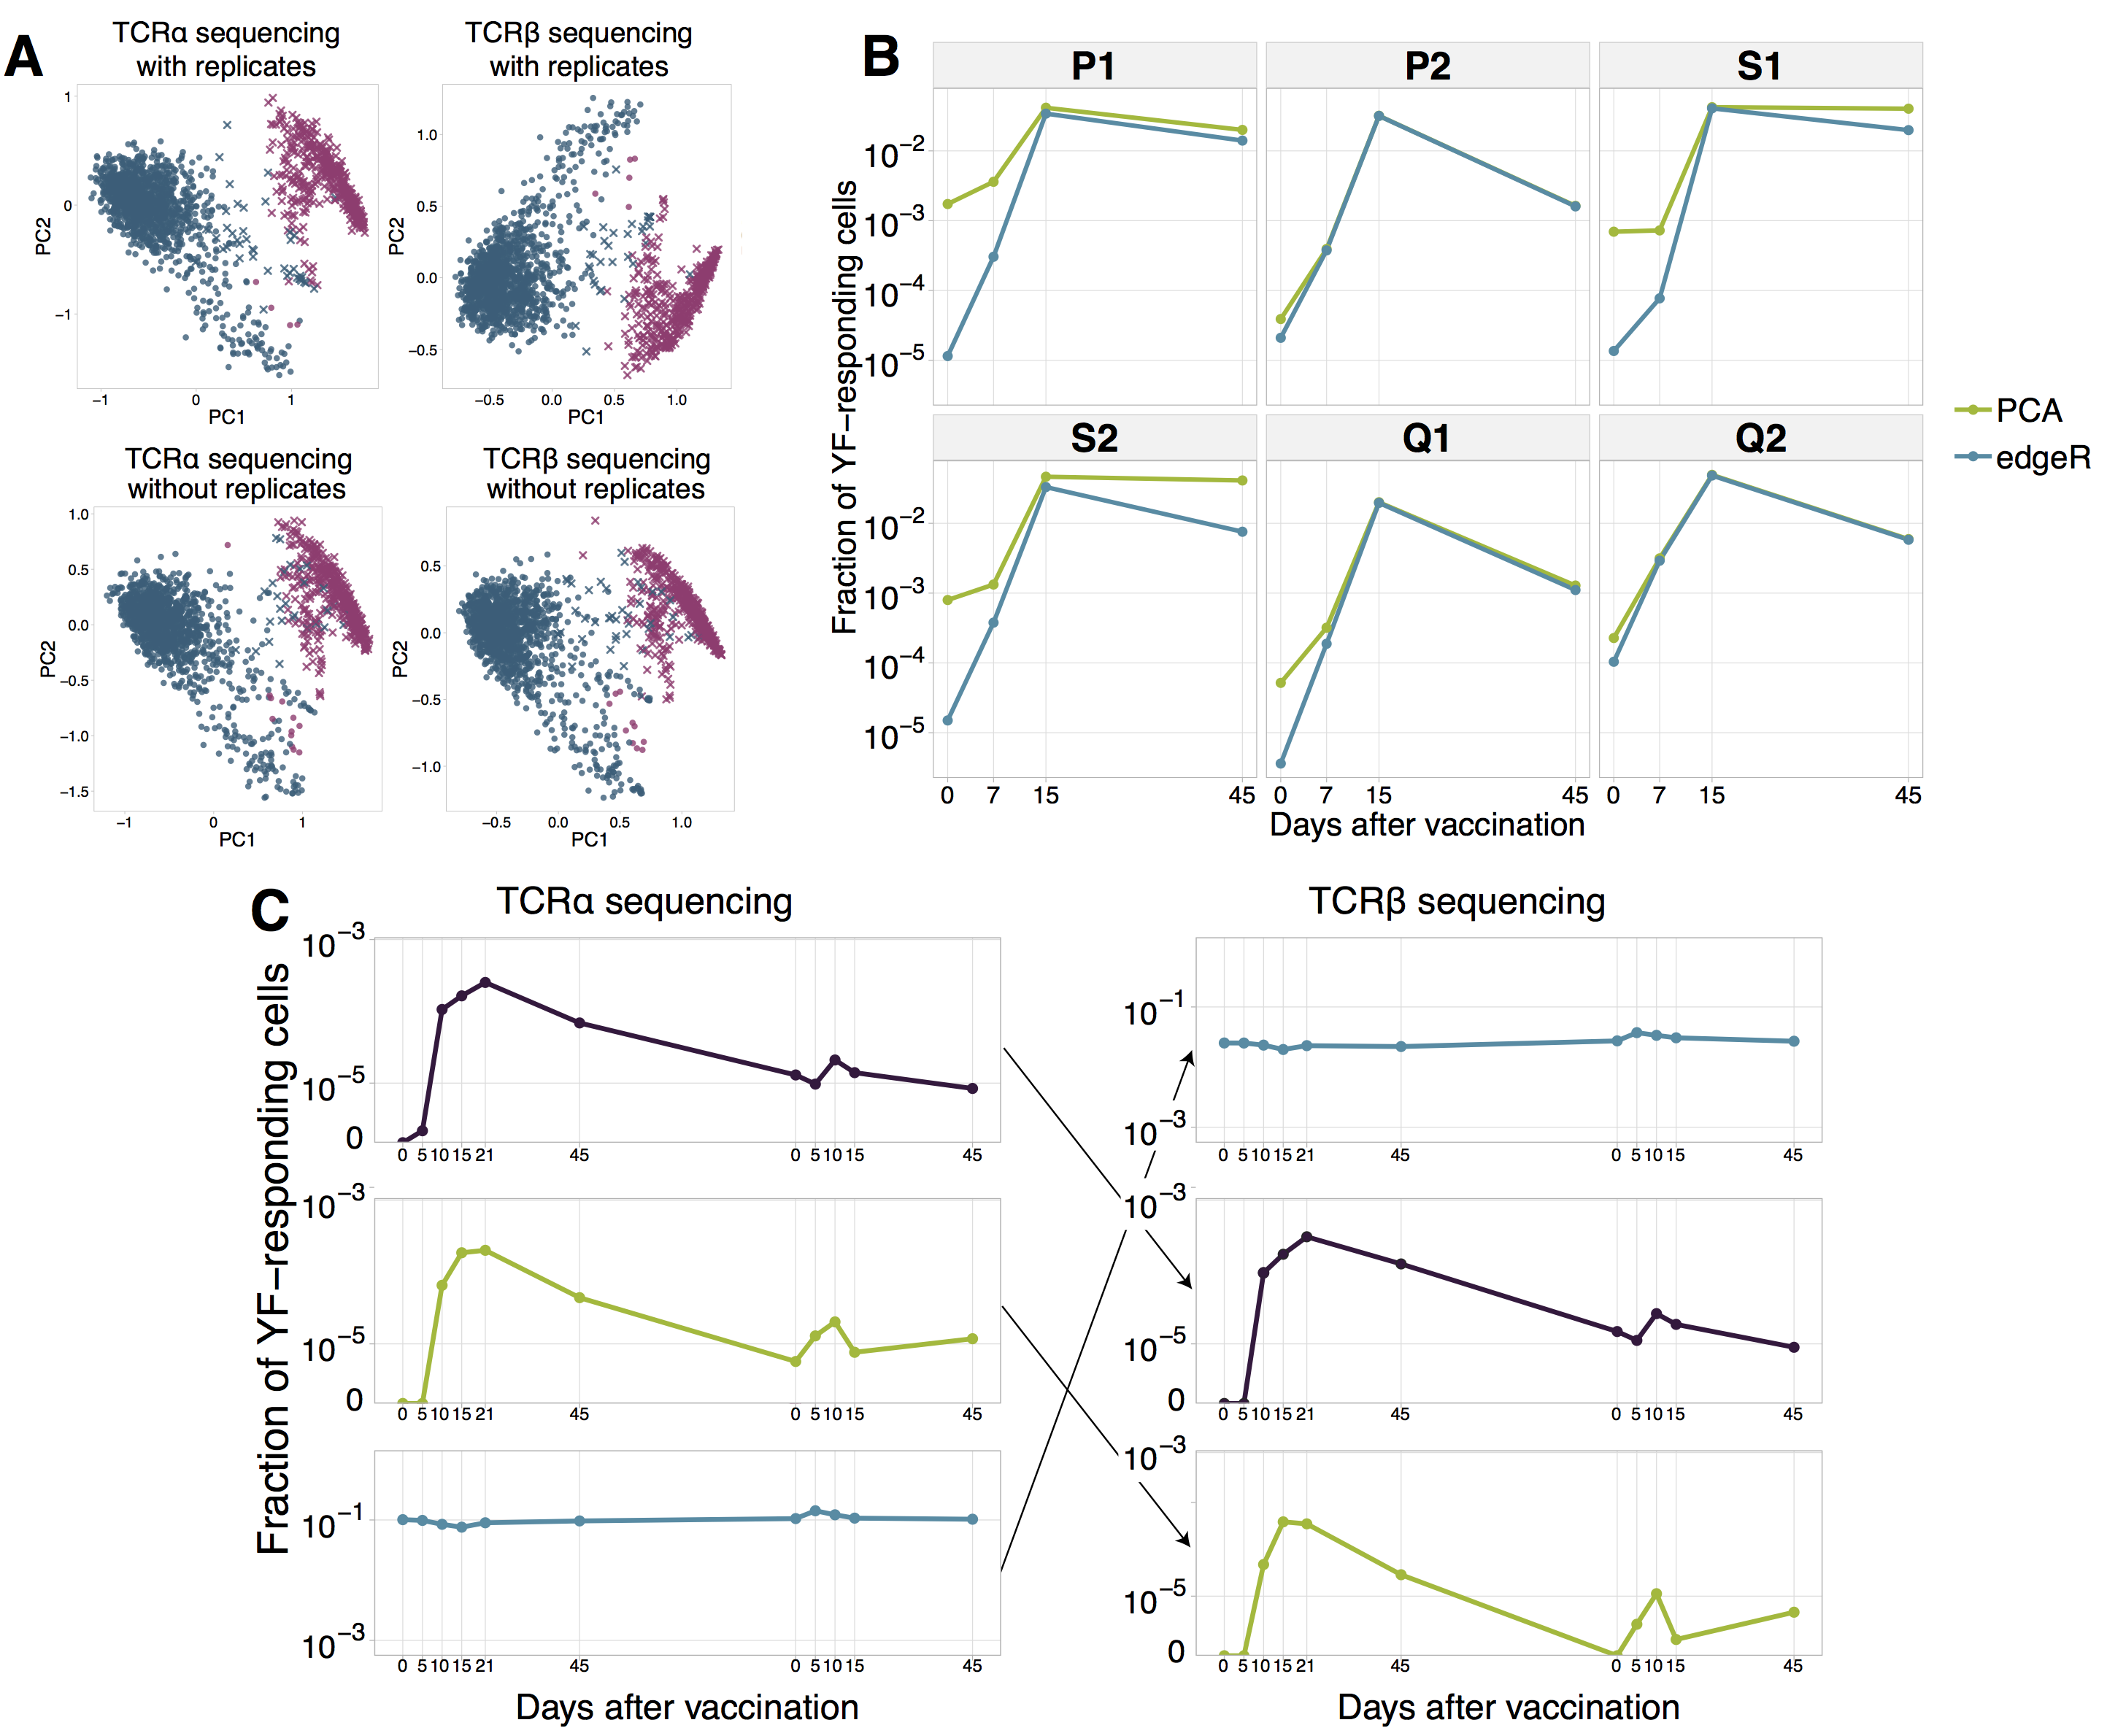
We sequenced TCR alpha and TCR beta repertoires of bulk peripheral blood mononuclear cells (PBMCs) and different T-cell subsets at multiple timepoints before and after primary and booster vaccination against yellow fever of donor M1 (Fig. 1A). Clonotypes responding to the primary YF immunization were identified using the edgeR software as previously described (pogorelyy_precise_2018, ). Briefly, the biological replicates of bulk PBMCs were used to estimate the noise in the TCR mRNA counts. Clonotypes were assumed YF-responding if they increased in concentration more than 32-fold (, see Methods) between any two timepoints before the peak of the primary response (days 0, 5, 10 and 15).
Overall we found 1580 TCR beta and 1566 TCR alpha clonotypes significantly expanded after the primary immunization, respectively occupying 6.7% and 7.8% of the sampled TCR repertoire of bulk PBMCs in cumulative frequency at the peak of the response (Fig. 1B, C). As expected, both the numbers of responding clones and their cumulative frequencies were very similar for expanded clonotypes identified in bulk TCR alpha and beta repertoires. For simplicity in the following sections we focus on TCR beta repertoires, unless stated otherwise. In accordance with previous studies (miller_human_2008, ; blom_temporal_2013, ; akondy_yellow_2009, ; kongsgaard_adaptive_2017, ; pogorelyy_precise_2018, ), we show that during the primary response T-cells expanded intensely (with cumulative increase of about 950-fold) within 2-3 weeks after YF immunization. They subsequently contracted, but still exceeded baseline frequency 18 months afterwards.
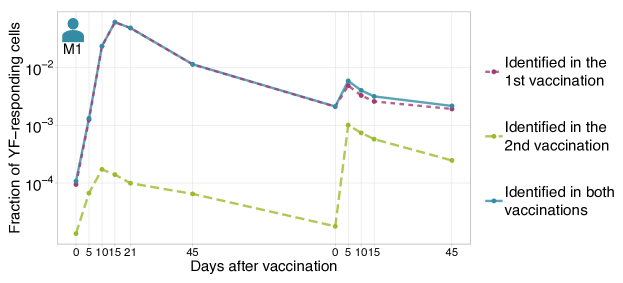
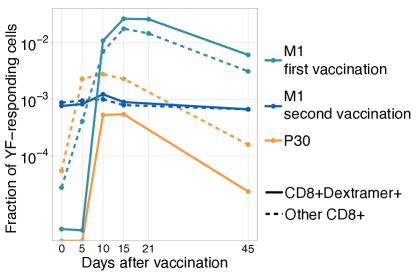
We then tracked these YF-responding clonotypes identified during primary immunization before and after the second vaccination 18 months after the first one. The cumulative frequency of these clonotypes increased 2.5-fold at the peak of the response after the second immunization, reaching 0.5% of the TCR repertoire (Fig. 1D, blue curve). The secondary response was weaker, but happened much faster than the primary one, with a peak frequency of responding clonotypes occurring on day 5 instead of day 15 after vaccination. To check if there was also recruitment of new clonotypes in the secondary response, we applied edgeR to timepoints from the second immunization only. Although we identified 73 additional responding clonotypes, their impact on the magnitude of the secondary response was negligible and we did not use them for further analyses (see Fig. S1). Backtracking of these novel clonotypes showed that they also slightly expanded during the primary response but not enough enough to pass our significance and magnitude thresholds. In summary, we found no evidence of substantial recruitment of naive clones in the response to the booster vaccination.
Using sequenced CD4+ and CD8+ T-cell subsets, we attributed a CD4 or CD8 phenotype to each responding clone (see Methods) and thus could track these two subsets separately. After booster immunization in donor M1, YF-responding CD4+ cells peaked earlier (day 5 vs day 10) and expanded much more ( times vs. times) than CD8+ T-cells (Fig. 1D, green and pink curves). During primary immunization, the difference in response dynamics between CD4+ and CD8+ subsets was less prominent, as they both peaked on day 15. However, by day 21 CD4+ responding clones contracted much more (to 43.6% of peak frequency) than CD8+ clonotypes (87% of peak frequency). These observations confirm previous reports that the CD4 response precedes the CD8 response (blom_temporal_2013, ).
Secondary response to booster vaccination after 18 months and after 30 years have similar features
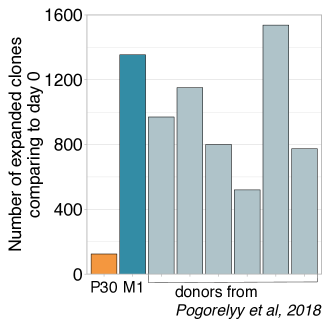
To see how long-lived T-cell memory response to YF can be, we recruited an additional donor (P30), who received the first YF-vaccine 30 years earlier and has not been in YF endemic areas for at least 28 years. From this donor, we collected bulk PBMCs and several T-cell subsets before and after booster immunization. Both the numbers of responding clonotypes (204 for TCR beta and 201 for TCR alpha) and the maximum frequency at the peak of the response (0.69%) were much lower than for any primary vaccinee both from this and other studies (Fig. S2). Most of these clonotypes were low frequency or undetected before the second immunization, although a few were sampled in the memory repertoire prior to vaccination.
The response to the booster vaccination was characterized by a large expansion between days 0 and 5, and a peak on day 10, for both CD4+ and CD8+ T-cells. Overall the dynamics and the magnitude of this response was very similar to the response to the booster vaccination after 18 months we observed in donor M1 (Fig. 1C), suggesting that protection against the virus was maintained even after 30 years.
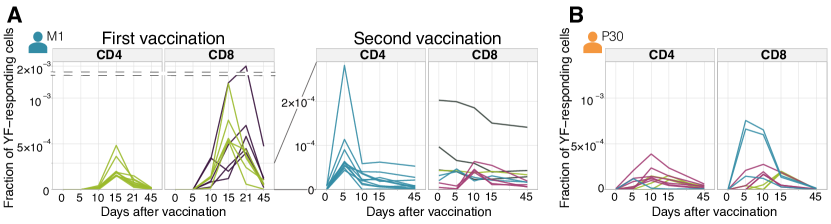
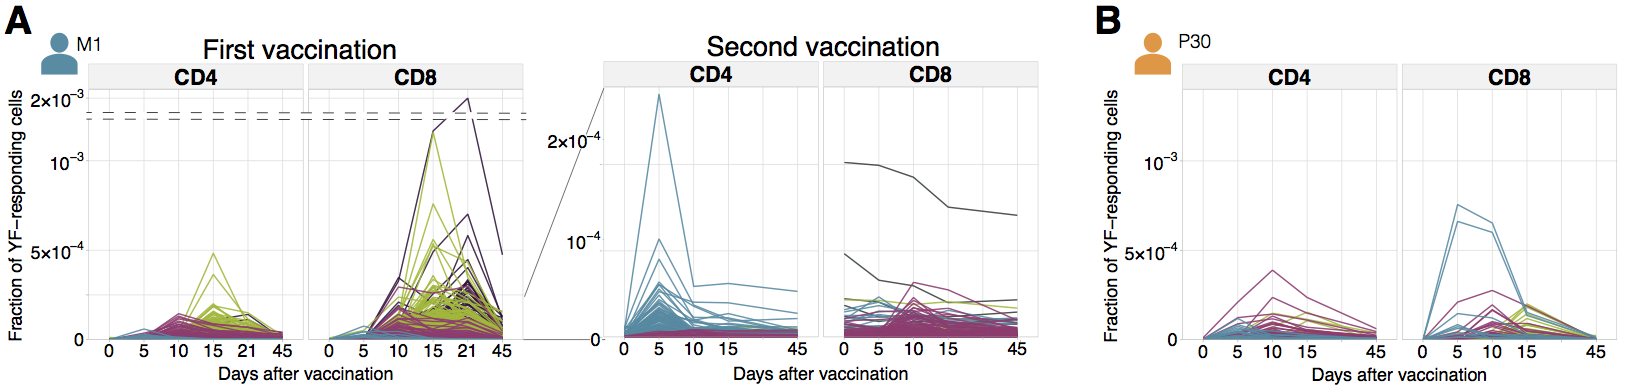
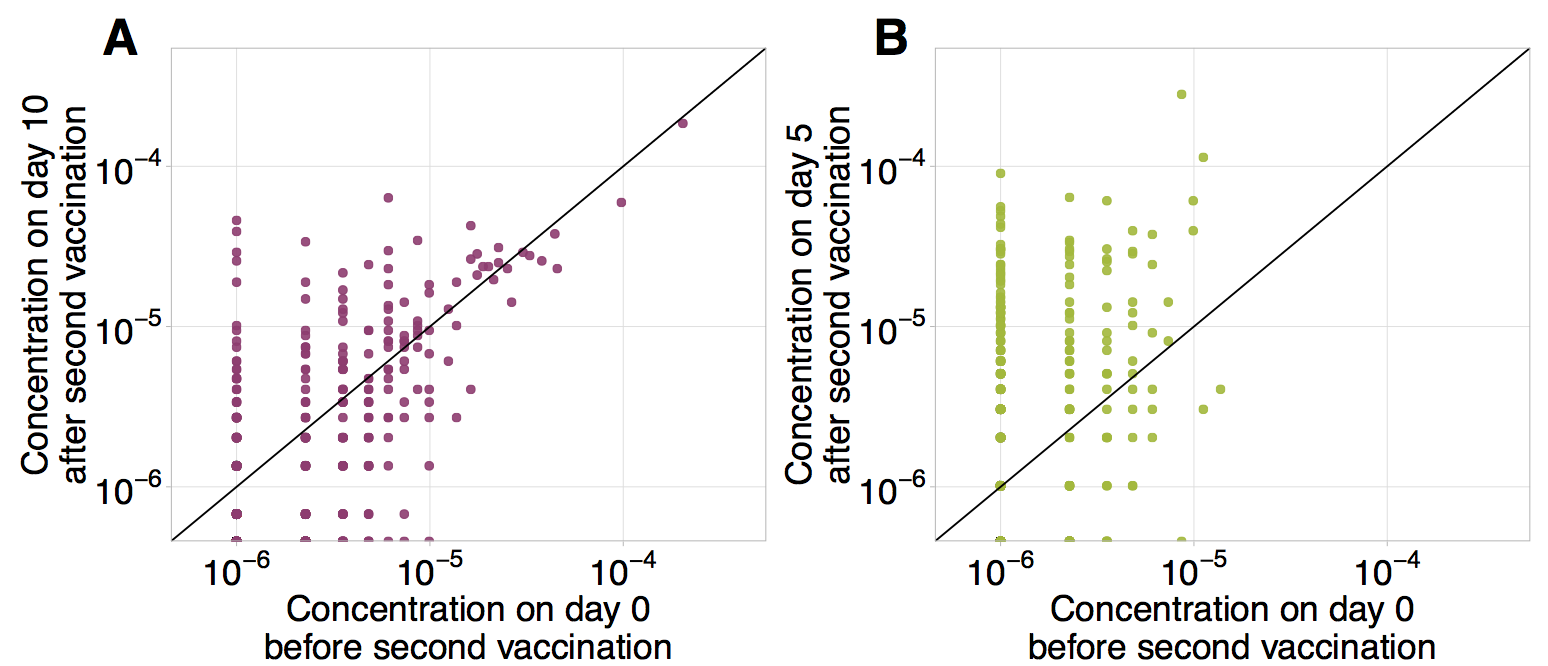
Diversity of clonal time traces in primary and secondary responses
Our approach allows us to estimate the contribution of individual clones to the total response. We already showed that the overall response strength to secondary immunization was an order of magnitude lower compared to the primary response. However, several clones showed remarkable expansion rates and peak frequencies, comparable to the ones observed in primary immunization. Such clones were observed in both donors upon secondary immunization after 18 months and 30 years (Fig. 2A and B, Fig. S3). We traced each single clone during primary and secondary response in donor M1. The concentration of clonotypes prior to the booster immunization correlated well (Pearson r=0.46 ) with their concentration on day 45 after primary immunization (Fig. S4) suggesting a uniform contraction rate for all clones resulting in a half-life of 15812.7 days for the YF-specific T-cell subpopulation. Previously, Akondy et al. using deuterium labeling of cells specific to the immunodominant epitope NS4B214-222 (as determined by a A02-NS4B214-222-multimer binding assay) showed a very similar half-life of 123 days (akondy_origin_2017, ).
It was previously reported that only 5-6% of YF-responding clones are preserved as immune memory, with the preferential recruitment of large clones (dewitt_dynamics_2015, ). By contrast, in our sample we could re-identify 96% of CD4+ and 88% of CD8+ clones that responded to the primary immunization in at least one sample after the booster immunization. This suggests that practically all the diversity of the responding repertoire is maintained in memory. The larger fraction of re-identified YF-responding clones in comparison to previous work may be explained by the sampling depth. Sequencing more T-cells will lead to the re-identification of even more YF-responding clonotypes.
We then wanted to characterize how these persistent clonotypes responded to the booster vaccination. Interestingly, we found that the largest YF-specific CD8+ clones did not expand in response to the booster vaccine. Instead, the most expanded clonotypes were rare prior to the booster immunization (Fig. S5A). The situation was different for CD4+ cells: both high and low-frequency CD4+ clones expanded in response to the booster immunization (Fig. S5B).
The specific features of clonal trajectories shared by YF-responding clones make it possible to distinguish them from non-expanding clones, using unsupervised clustering (see Fig. S6AB and Methods). This method shows good concordance with edgeR and works also without biological replicates. In addition, we demonstrated that the heterogeneity of clonal trajectories could be leveraged to computationally pair alpha and beta chains from from bulk alpha and beta sequencing data, by exploiting the similarity of trajectories of alpha and beta clonotypes belonging to the same clone (see Fig. S6C and Methods).
TCR sequencing shows the transition of clonotypes between memory subpopulations
Several studies have reported subsets of long-lived memory YF-specific T-cells, whose concentration remained stable for years (fuertes_marraco_long-lasting_2015, ; akondy_origin_2017, ). It was shown that these long-lived memory cells are the progenies of effector cells, which divide vigorously during the peak of the response to the vaccine (akondy_origin_2017, ). TCR sequences can be used as “barcodes” to measure transitions between different memory subsets after YF immunization, defined by their surface markers revealed by flow cytometry.
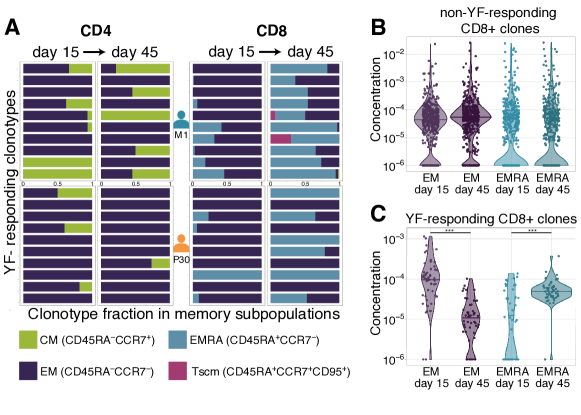
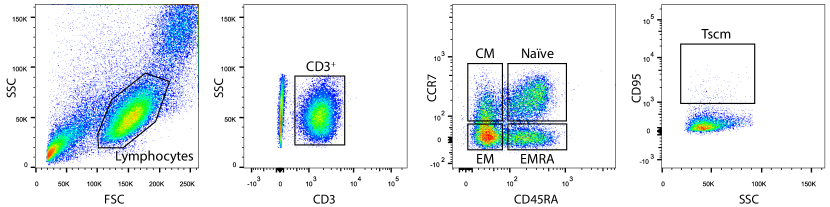
We isolated with FACS (see Fig. S7 for the gating strategy) and sequenced TCR repertoires of 3 conventional T-cell memory subpopulations (fuertes_marraco_long-lasting_2015, ; appay_phenotype_2008, ): effector memory (EM, CCR7-CD45RA-), effector memory re-expressing CD45RA (EMRA, CCR7-CD45RA+), and central memory (CM, CCR7+CD45RA-) on days 0, 15, 45, and 18 months after the primary vaccination of donor M1 and on days 0, 15, and 45 after the second vaccination of donor P30. On day 45 we also isolated and sequenced the repertoire of the recently described Tscm (T-cell stem cell-like memory) subset (CCR7+CD45RA+CD95+).
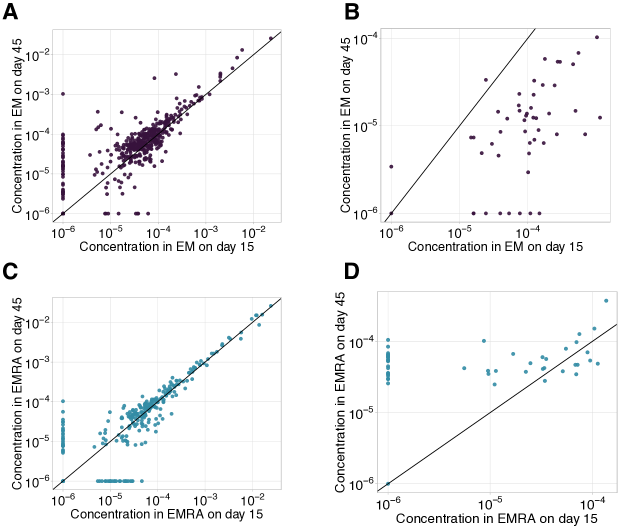
On day 0, the concentration of almost all YF-responding clonotypes was too low to be detected in any of these subpopulations. However, we were able to calculate the distribution of YF-responding clonotypes between these phenotypes after immunization. In agreement with previous studies the memory status of T-cell clones was tightly correlated with their CD4/CD8 status (sathaliyawala_distribution_2013, ; thome_spatial_2014, ). The vast majority of CD4+ T-cells were distributed between EM and CM, with in EMRA, while CD8+ T-cell clones were predominantly found in EM and EMRA with in CM. This difference also held for YF-responding clones (Fig. 3A). While for most CD8+ clonotypes in the total repertoire EM/EMRA phenotypes were stable between day 15 and day 45 (Fig. 3B, and Fig. S8A, C), the distribution of CD8+ YF-responding clones between memory subsets was significantly shifted towards the EMRA phenotype (Fig. 3C). This shift results from two processes: the rapid decay of EM cells (Fig. S8B) and the phenotype switch from EM to EMRA (Fig. S8D). Almost all YF-responding CD8+ clones detected 18 months after the first immunization corresponded to the EMRA phenotype (among 71 clones found in more than 3 copies in bulk repertoire at day 0 before second vaccination, 41 were found only in the EMRA subset, 4 only in EM, and 6 in both). For CD4+ T-cells, we did not observe any trend in phenotype switching between days 15 and 45 after the vaccination. We hypothesize that switching from EM to CM phenotype was masked due to homing of CM cells to lymphoid organs, defined by the expression of the CCR7 chemokine receptor.
The response to a single immunodominant epitope can contribute to up to 60% of the total response
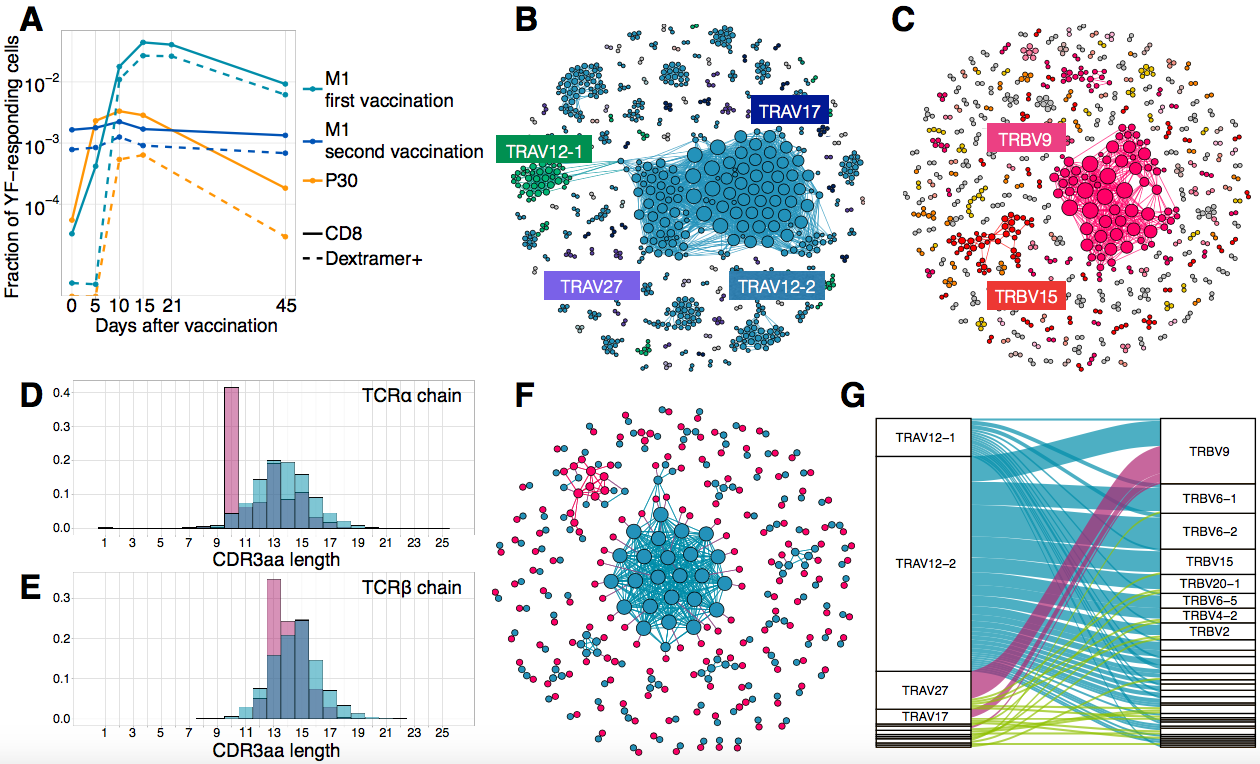
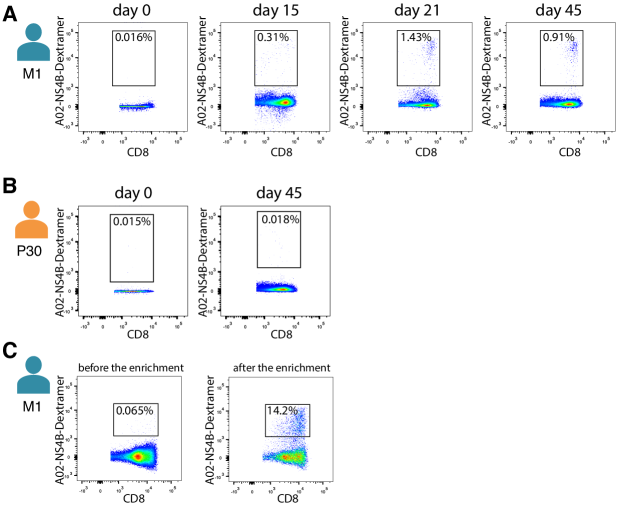
It was previously shown that in HLA-A02 donors the NS4B214-222 LLWNGPMAV immunodominant epitope elicits the strongest CD8+ T-cell response (akondy_yellow_2009, ; wieten_single_2016, ; kongsgaard_adaptive_2017, ; blom_temporal_2013, ). Using an A02-pMHC-dextramer, we isolated NS4B-specific CD8+ T-cells from both donors (Fig. S9A,B) and applied TCR sequencing to get their unpaired TCR alpha and TCR beta repertoires. We obtained 2100 alpha and 2000 beta functional receptor chains, one of the largest datasets for TCRs with a single specificity. YF-responding clonotypes identified by edgeR as expanded between timepoints are not restricted to any particular YF epitope and represent the repertoire targeted towards many different peptides presented by different HLA alleles. This allows us to quantify the relative contribution of NS4B-specific T-cells to the total anti-YF response. At the peak of the response, approximately 24% of all YF-responding CD8+ T-cells were specific to NS4B in the donor vaccinated 30 years ago (P30), and up to 60% in the first time vaccinee (M1) (Fig. 4A). However, NS4B-specific clonotypes could not be distinguished from other YF-responding clonotypes from their time traces alone, as they both responded with similar dynamics (Fig. S10).
Sequence analysis and structural modeling of NS4B-specific TCRs reveals two motifs with distinct peptide binding modes
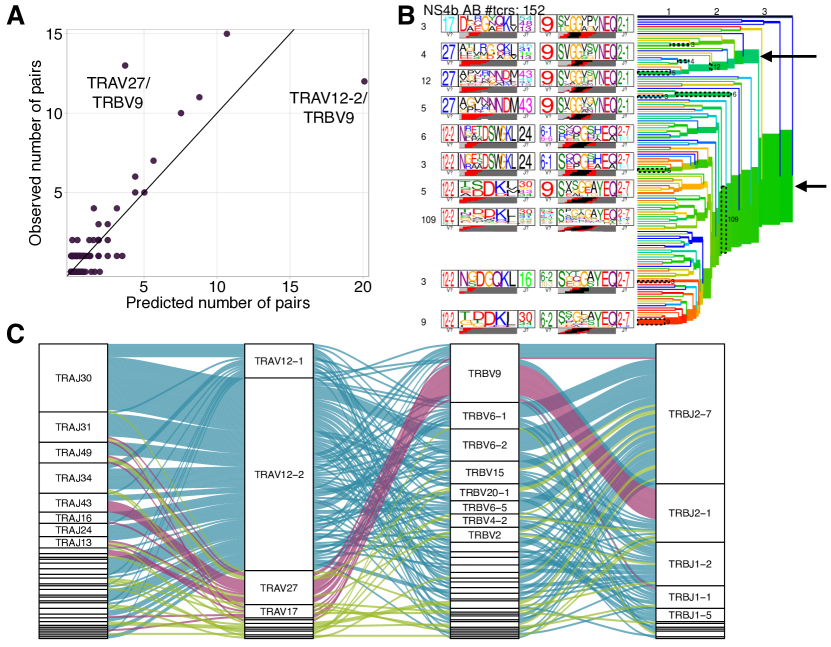
We next asked whether there are distinct features in the sequence of NS4B-specific TCRs, which might explain the immunodominance of this epitope. Figures 4B and C show sequence similarity networks for TCR alpha and TCR beta chains of NS4B-specific clonotypes. The TCR alpha repertoire shows biased V-usage and complementarity determining region 3 (CDR3) lengths (Fig. 4D). TRAV12-2, TRAV12-1, TRAV27, and TRAV17 gene usage were significantly enriched in the NS4B-specific TCRs (exact Fisher test, Benjamini Hochberg adjusted ), with more than 45 percent of the clonotypes expressing TRAV12-2, in comparison to just 4.5% of TRAV12-2 in the total CD8+ TCR repertoire. Beta chains formed several distinct clusters of highly similar sequences, with significant but less marked V-usage biases towards TRBV9, TRBV15, and TRBV6-1/2, as well as some bias in the length distribution (Fig. 4E). Almost 37% of NS4B-specific clonotypes used TRBJ2-7.
We next asked how these clusters of highly similar sequences in the alpha and beta NS4B-specific repertoires corresponded to each other. Prior to booster immunization, we isolated NS4B-specific T-cells from donor M1 (Fig. S9C) and performed single-cell RNA sequencing (scRNAseq) and single-cell paired TCR sequencing (scTCRseq). We collected data from 3500 cells corresponding to 164 clonotypes (see Methods). Fig. 4F shows a joint similarity network for TCR alpha and TCR beta chains, with both intra-chain sequence similarity and inter-chain pairings. Alpha-beta pairing seemed to be mostly random, with some exceptions: for instance, specific TCRs using the most dominant TRAV12-2 alpha motif were paired with many different beta chains with a broad usage of V-segments (Fig. 4G and Fig. S11A), but with a restricted CDR3 length of 13–14 amino acids. TCRs using TRAV27 and TRBV9 segments were also preferentially paired with one another (Fig. S11C). Clustering of paired sequences using the TCRdist measure (Fig. S11B) resulted in two large clusters corresponding to these two major motifs with conserved V-usage.
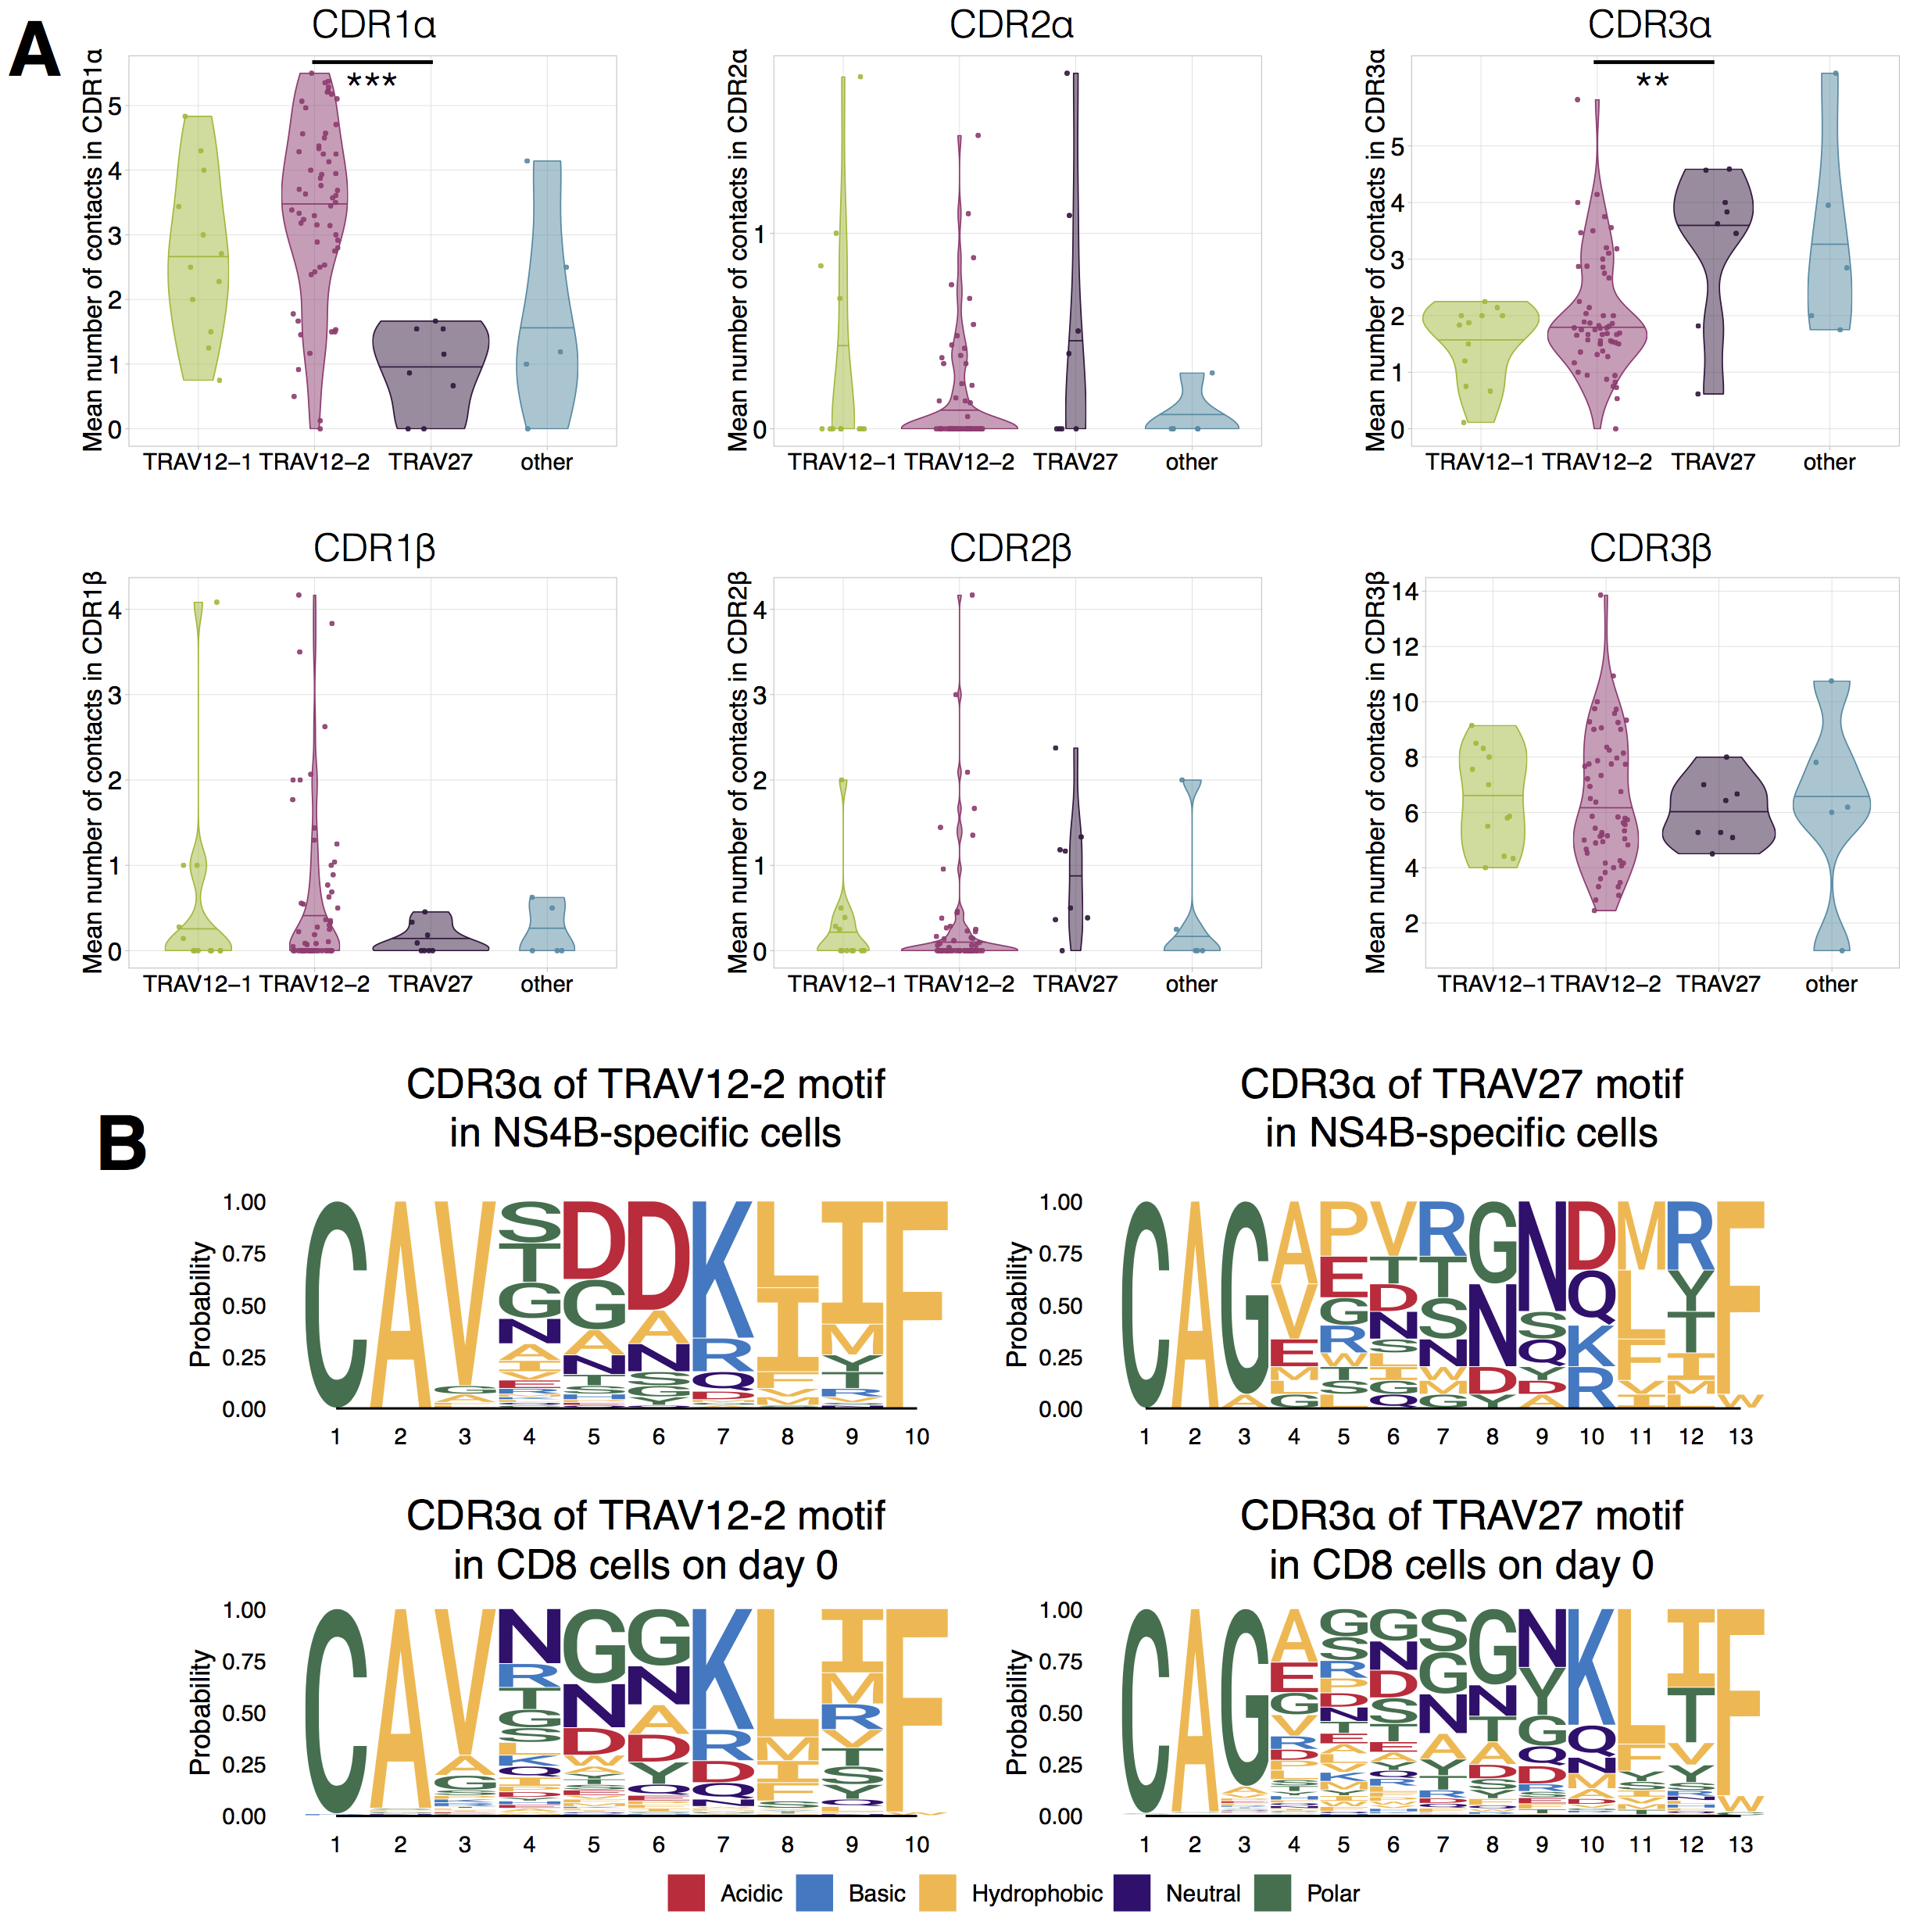
The preferential usage of the TRAV12 family was reported before for TCRs responsive to the NS4B epitope (bovay_t_2018, ; zhang_high-throughput_2018, ). It was speculated (bovay_t_2018, ), that the CDR1 of this V-segment forms contacts with the peptide. To test this hypothesis, we modeled the 3D structures of clonotypes from scTCRseq using the Repertoire Builder server (schritt_repertoire_2019, ) and then docked the resulting model structures using RosettaDock (lyskov_rosettadock_2008, ) to the HLA-A02 pMHC complex structure, recently solved using X-ray crystallography (bovay_t_2018, ), see Methods for details. Models of TCR-pMHC complexes showed that the TRAV12-2 TCRs formed more contacts with the peptide using CDR1 loops, and fewer contacts with CDR3 loops, in comparison to TRAV27 TCRs (Fig. S12A). Interestingly, CDR3 sequences of TRAV12-2 TCRs were very similar to the ones observed in the repertoire of the same donor prior to the immunization, suggesting absence of epitope-driven selection of the CDR3 of these TCRs (Fig. S12B). Based on these results, we hypothesize that TCRs using TRAV12 and TRAV27 motifs represent two independent and distinct solutions to the binding of the NS4B epitope.
scRNAseq of NS4B-specific T-cells reveals two distinct cytotoxic phenotypes
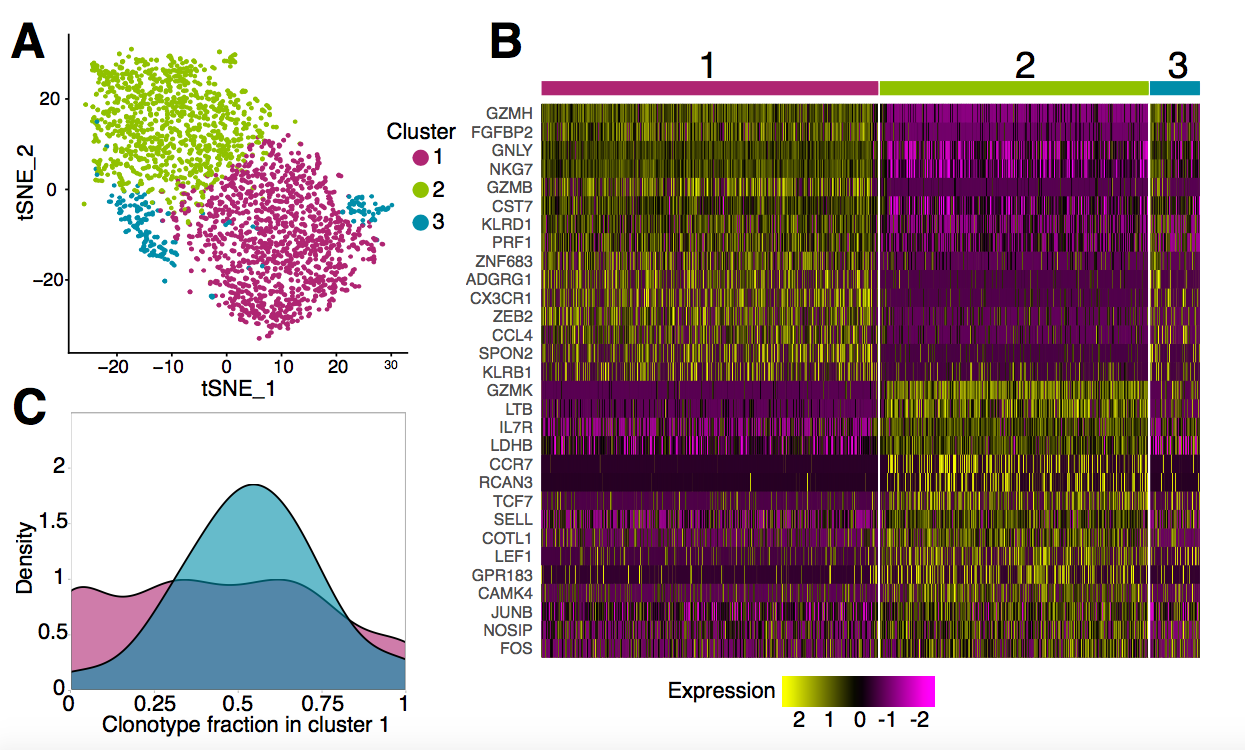
Next we used the scRNAseq gene expression data to investigate the phenotype of specific T-cells in finer detail. While almost all NS4B-specific clonotypes 18 months after vaccination belonged to the conventional EMRA subset, scRNAseq revealed huge heterogeneity of gene expression inside this population. Unsupervised clustering by Seurat 3.0 software (stuart_comprehensive_2019, ; butler_integrating_2018, ) (see Methods) revealed three sub-phenotypes of NS4B-specific cells (Fig. 5A).
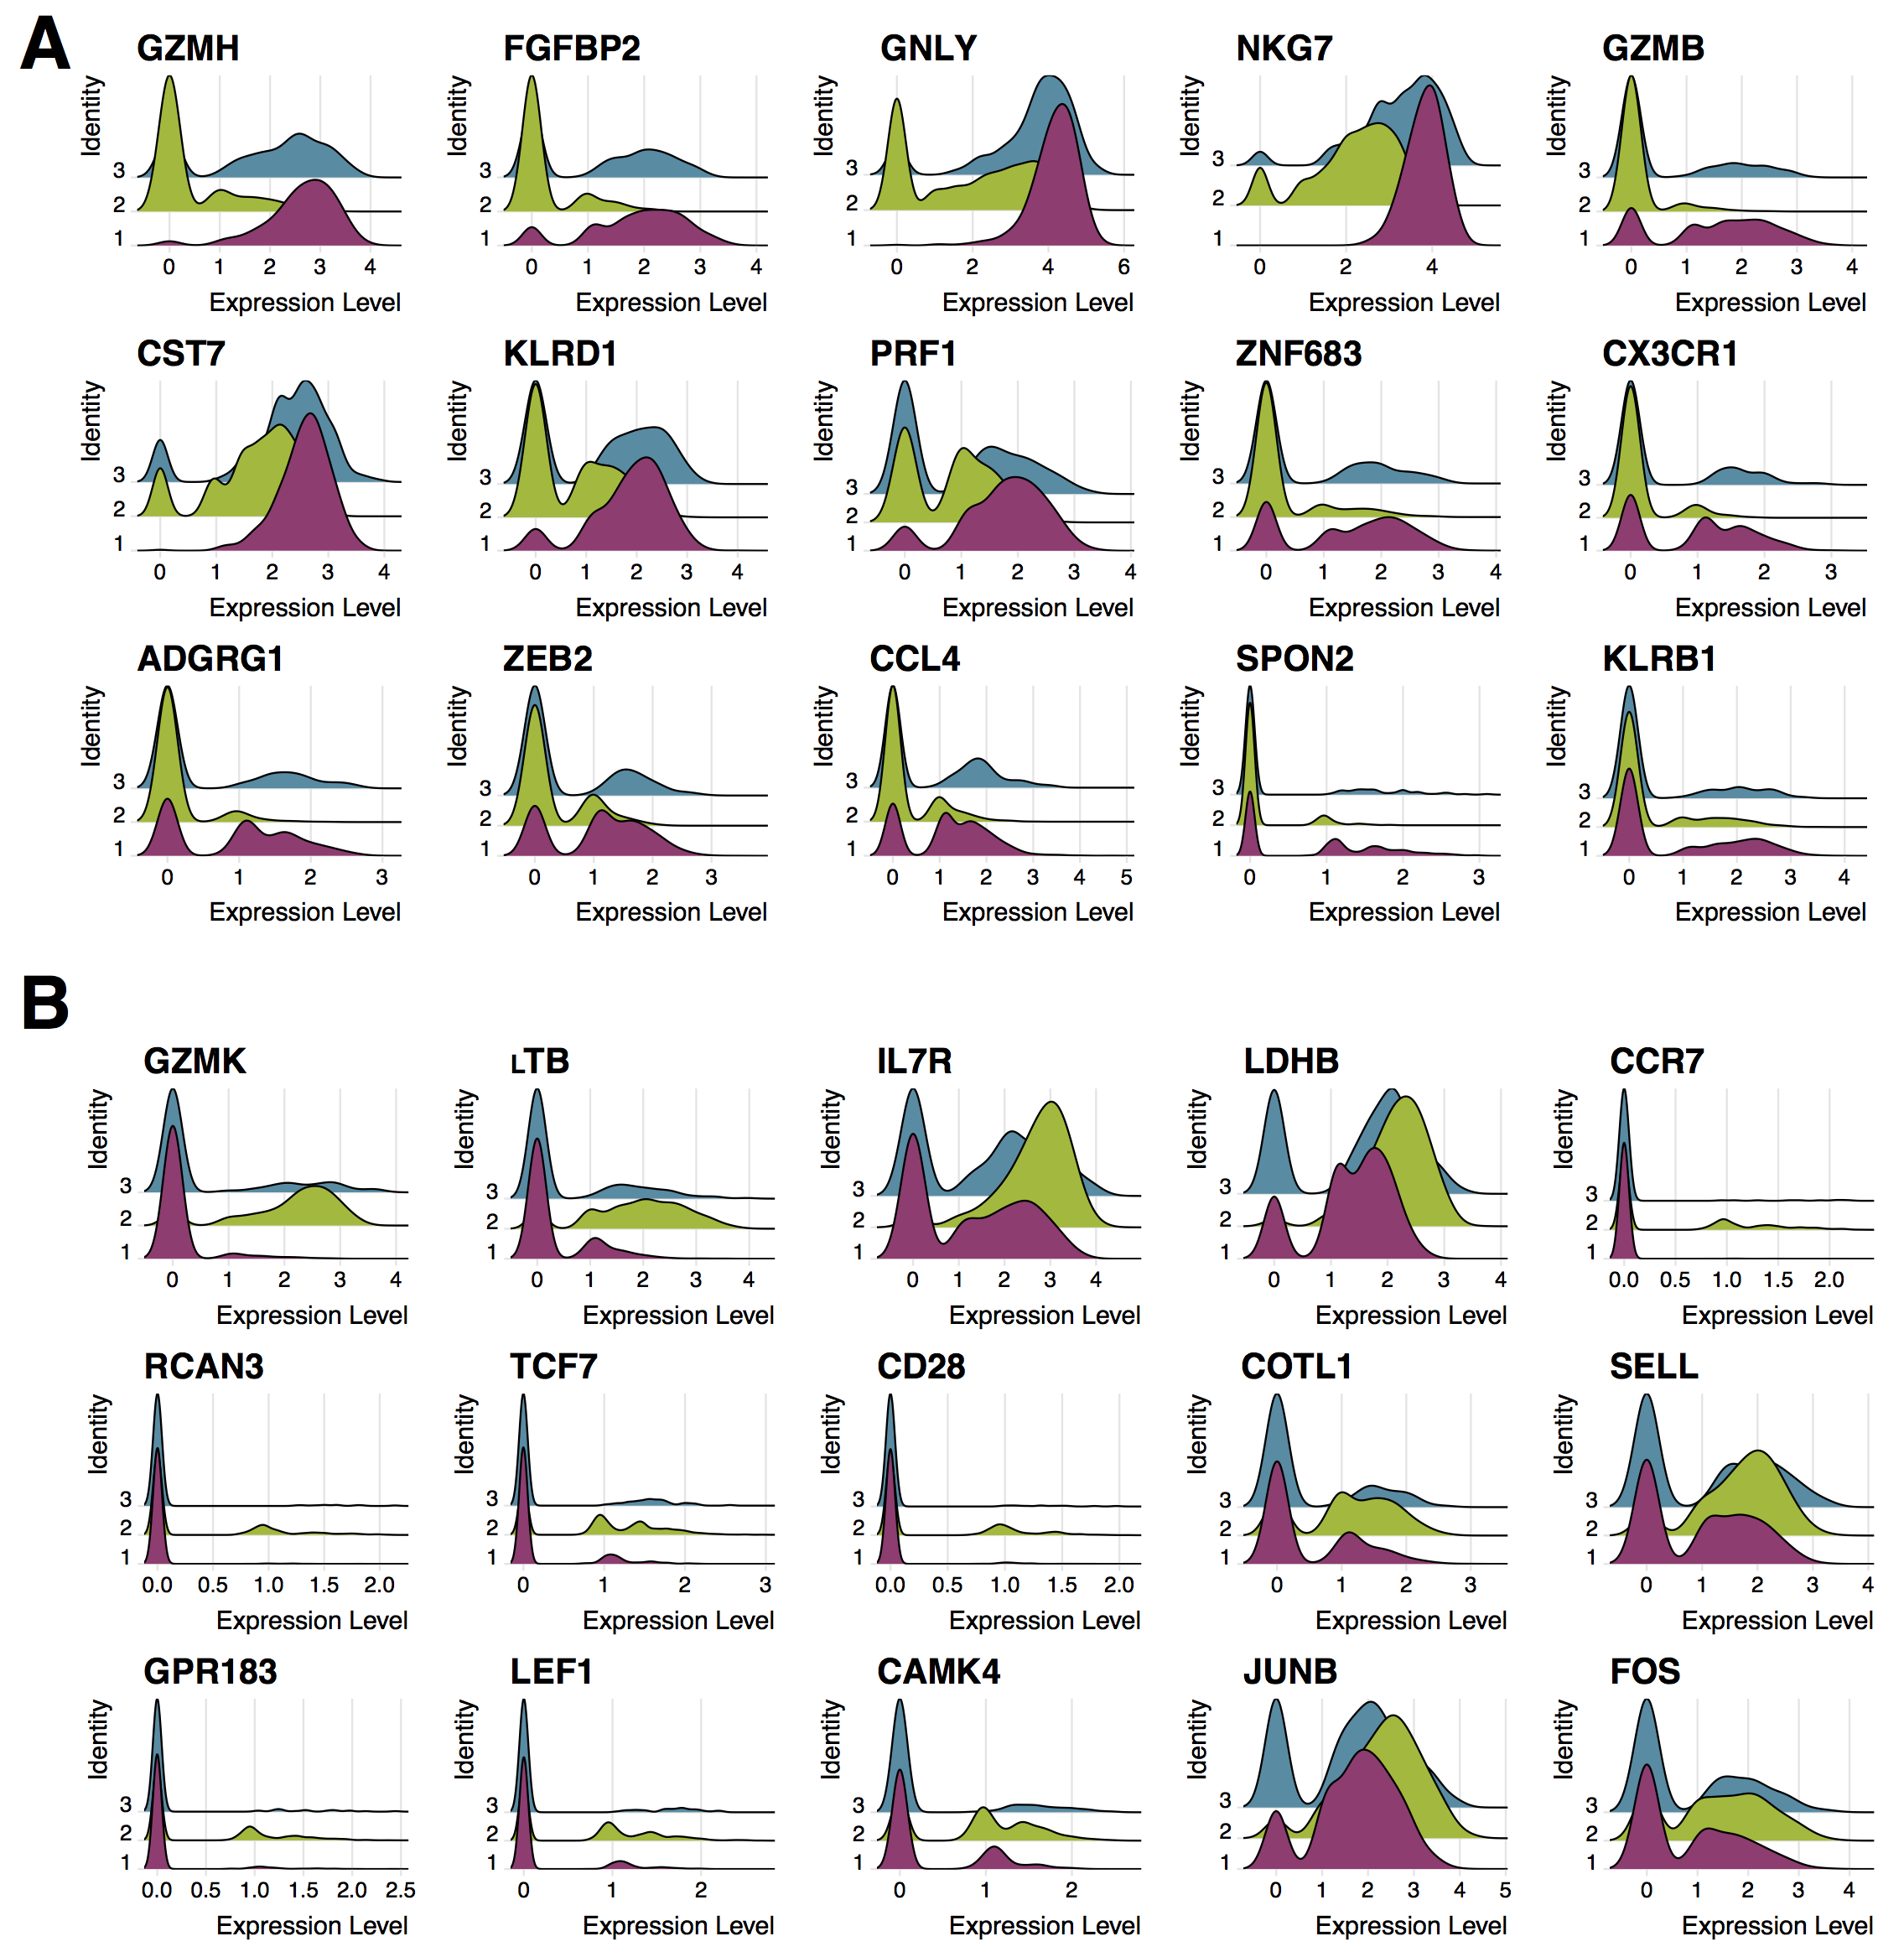
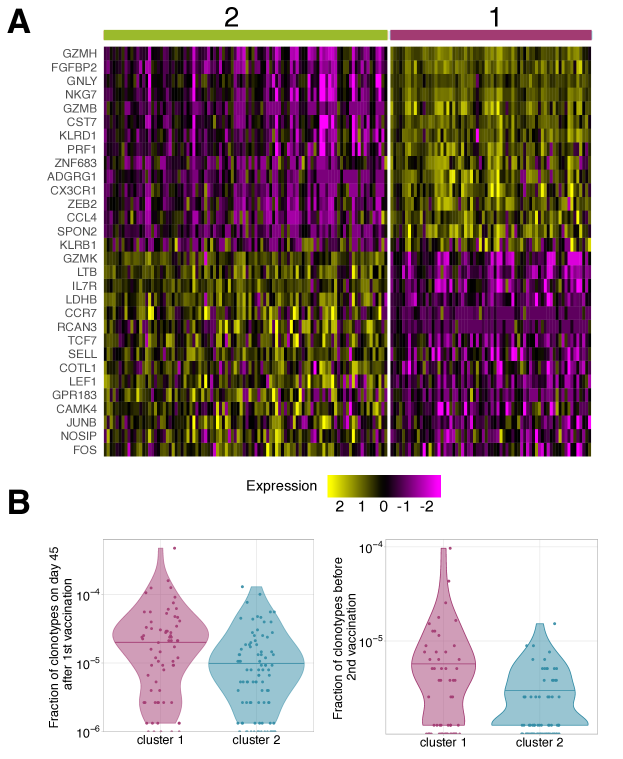
Overall we found 166 genes that were differentially expressed according to the MAST algorithm (finak_mast:_2015, ) between these clusters (Fig. 5B). Cells from cluster 1 showed high expression of cytotoxicity related genes GZMB, GNLY, GZMH, NKG7, PRF1, CX3CR1, SPON2, KLRD1, Hobit and T-bet transcription factors (Fig. S13A). The combination of these genes also suggests that this cytotoxicity is mediated by the perforin pathway. The second cluster of cells is enriched in genes such as CCR7, TCF7, SELL, JUNB, LEF1, and especially IL7R which are essential for long-term survival and maintenance of memory T-cells (Fig. S13B) (jeannet_essential_2010, ; zhou_differentiation_2010, ; kaech_selective_2003, ; jung_ccr7_2016, ; schluns_interleukin-7_2000, ). However, these cells also express unique markers related to cytotoxicity: GZMK, LTB as well as KLRG1, KLRB1, T-bet, and GZMH, albeit at lower levels than cells in cluster 1.
Very similar clusters of genes were found in single-cell RNAseq analysis of CD4-cytotoxic lymphocytes EMRA cells (patil_precursors_2018, ). The expression pattern of granzymes and killer-like receptors in our clusters suggests that cells in cluster 2 may be the precursors of cells in cluster 1. The expression of GZMK (enriched in cluster 2) was shown to be prevalent in early memory stages (harari_distinct_2009, ; bratke_differential_2005, ), while high levels of GZMB, GZMH, KLRB1, KLRG1, and ADGRG1 (enriched in cluster 1) are associated with more terminally differentiated memory cells with higher cytotoxic potential (truong_killer-like_2019, ; takata_three_2006, ). Interestingly, cluster 2 has higher expression of genes encoding ribosomal proteins, which were recently reported to be a feature of memory precursor cells (araki_translation_2017, ). The transition of cells between the two clusters is also supported by the existence of cluster 3, which shows intermediate gene expression of cluster 1 and 2 markers, and thus may represent cells gradually changing phenotype.
For each cell from the scRNAseq experiment, we obtained matched scTCRseq results. We wondered whether the TCR clonotype influenced cell gene expression profile. Interestingly, the distribution of clonotypes between clusters was not random (-test with MC-estimated p-value=0.0005): some clonotypes showed a clear preference for one of the phenotypes (Fig. 5C). To match single-cell gene expression data with measurements of clonotype concentrations obtained with TCRseq, we averaged mRNA counts over the all cells of the same clonotype, and repeated the differential gene expression analysis (see Methods). We obtained two clusters of clonotypes with the same enriched genes (Fig. S14A) as observed for clusters of single cells (Fig. 5B), confirming the association of phenotype and clonotype. Clonotypes from both clusters expanded following the second immunization, indicating that both phenotypes are capable of response. Clonotypes associated to cluster 1 had larger frequencies both on day 45 after the first vaccination (Fig. S14B, left), and 18 months later before the booster shot (Fig. S14B, right), than clonotypes associated to cluster 2. This result suggests that even for T-cells recognizing the same epitope, particular clones are linked to particular memory phenotype.
Discussion
In this study, we applied high-throughput sequencing of TCR alpha and TCR beta repertoires to track T-cell immune response to primary and secondary immunization with yellow fever vaccine. This approach does not require previous knowledge of TCR specificity and thus allows us to quantify and compare the response of individual T-cell clones recognizing different epitopes on the same scale.
We found that up to 60% of all responding CD8+ T-cells were specific to a single immunodominant peptide. Several studies reported high precursor frequency of T-cells reactive to this epitope (zhang_high-throughput_2018, ; bovay_t_2018, ). Bovay et al. recently suggested that recognition of antigenic peptide through the germline-encoded CDR1 loop of the TRAV12 segment is one of the main reasons for high precursor frequency (bovay_t_2018, ). This hypothesis is supported by our TCR structural modeling and TCR-pMHC docking simulations, as well as by the analysis of the NS4B-specific T-cell repertoire. We also identified an additional motif defined by TRAV27+TRBV9+ TCRs. It will be interesting to investigate if these two motifs differ in binding affinity or are susceptible to potential escape mutations that can appear in the antigenic peptide. Another question is how diverse is the level of clonal response to the YF vaccine in HLA-A02 negative donors, and what fraction of the response is directed towards the most immunodominant epitopes in the context of other HLA types.
Most previous studies focused on TCR beta repertoires, partially because the diversity of TCR beta is higher, making it a better marker for clonal tracking (chu_longitudinal_2019, ). We found that TCR alpha may be used for clonal tracking as well, giving almost the same results as TCR beta in terms of the number of expanding clonotypes and their cumulative fractions on different timepoints. In the particular case of the response of HLA-A02 donors to the YF vaccine, the TCR alpha repertoire turned out to be even more informative, as T-cells responding to the immunodominant epitope predominantly use certain TRAV segments.
One of the major limitations of bulk TCR sequencing is that the resulting repertoires are unpaired, while TCR specificity in most cases is defined by the combination of alpha and beta chains. We show that the simultaneous sequencing of bulk alpha and beta repertoires performed on many timepoints allows us to make predictions on alpha-beta pairing. Even with the rise of single-cell sequencing, this method might still be of interest since most available single-cell platforms can only analyze limited numbers of - cells. In addition, these experiments are still expensive in comparison to the bulk TCR sequencing, which enables the profiling of millions of lymphocytes more cheaply.
We found that % clonotypes responding to primary immunization were present in peripheral blood 18 months after immunization. Recently, Akondy et al. showed using deuterium cell labeling that long-survived memory cells have a history of intense clonal expansion, and thus are likely to differentiate from effector cells after response (akondy_origin_2017, ). This explains both the high remaining diversity of YF-responding clonotypes and a proportional decrease of these clonotypes between primary and booster immunizations.
Interestingly, we observed a very different response of CD4+ and CD8+ memory cells to the booster vaccination. It may be explained by differences in antigen presentation mechanisms: CD4+ T-cells may be activated well by antigen presenting cells phagocyting neutralized viral particles and presenting exogenous peptides on MHC-II complexes, while CD8+ memory cells can be more efficiently triggered by a productive viral infection resulting in the presentation of endogenously translated viral proteins on MHC-I. It was previously shown that the magnitude CD8 response depends on the viral load (akondy_initial_2015, ).
It will be interesting to perform a similar study in donors vaccinated with YF backbone chimeric vaccines, where genes from other viruses substitute some of the YFV17D genes. It was shown that preexisting anti-YF immunity (monath_clinical_2002, ) does not affect the formation of neutralizing antibodies to the novel virus. This finding suggests that not only efficient reactivation of existing CD4 memory but also the formation of CD4 responses to novel epitopes is possible during the booster with slightly different antigen.
We found that, while the overall secondary response to the vaccine was much smaller both in terms of clonal diversity and cumulative frequency, a few clones still undergo strong clonal expansion. This may be indirect evidence for the programmed proliferation hypothesis (moore_dependence_2019, ) according to which a single encounter of a TCR with an antigen triggers several rounds of T-cell division. It was shown that the virus is undetectable in the peripheral blood after booster vaccination (reinhardt_development_1998, ), meaning that the amount of available antigen is much lower, and so is the number of encounters and responding clonotypes.
The transition between EM and EMRA phenotypes in CD8+ clones responding to yellow fever vaccine was previously measured using flow cytometry (wieten_single_2016, ; fuertes_marraco_long-lasting_2015, ). Here we confirm these reports with high-throughput sequencing, using TCR as a barcode to mark cells of the same clonal lineage. Furthermore, we identified two distinct cytotoxic phenotypes in NS4B-specific T-cells 18 months after primary immunization. It is not clear why the distribution of clonotypes between two these phenotypes was biased. Since we performed scRNAseq of clonotypes specific to the single antigen, these differences might be either the consequence of different TCR affinity or some phenotypic heterogeneity present in the precursor cells. Additional experiments at later timepoints would be required to estimate the longevity of these clonotypes.
To summarize, we show that vaccination with YFV17D leads to the recruitment of a diverse repertoire of T-cells, which is then available as immune memory for the secondary response years after the immunization. Even T-cells with the same epitope specificity show several distinct motifs in TCR and have different memory phenotypes. Such heterogeneity of cells might be crucial for individual immune response robustness, underlying cross-reactive responses to similar viruses, and the possibility to escape mutants, which could be tested directly in future studies. However, this diverse T-cell response is strongly focused on single HLA-A02 restricted epitope. An interesting question is how many distinct foci of response exist in the human population with a variety of HLA-types; and how this diversity of individual responses contribute to the defense from the infection at the population level. Systematic studies of donors with different genetic backgrounds and corresponding immunodominant epitope-specific repertoires will be able to address this question.
Methods
Donors and blood samples
Blood samples were collected from two healthy donors (M1 male age 26, and P30 male age 39) on multiple timepoints before and after immunization with YFV17D vaccine. All donors gave written informed consent to participate in the study under the declaration of Helsinki. The blood was collected with informed consent in a certified diagnostics laboratory. The study was approved by the institutional review board (IRB) of Pirogov Russian National Research Medical University. HLA haplotypes of donors (Table S1) were determined by in-house RNA-based amplification and sequencing method.
Isolation of T-cell subpopulations
We isolated PBMCs from the blood using standard Ficoll-Paque protocol. CD4 and CD8 fractions were isolated with CD4/CD8 Positive Selection Dynabeads Kits according to the manufacturer’s protocol. For isolation of memory subsets, we stained PBMCs with the mix of antibodies: anti-CD3-FITC (UCHT1, eBioscience), anti-CD45RA-eFluor450 (HI100, eBioscience), anti-CCR7-AlexaFluor647 (3D12, BD Pharmingen), anti-CD95-PE (DX2, eBioscience). Four subsets of cells were sorted into RLT buffer (Qiagen) on BD FACS Aria III: EM (CD3+CD45RA-CCR7-), EMRA (CD3+CD45RA+CCR7-), CM (CD3+CD45RA-CCR7+), Tscm (CD3+CD45RA+CCR7+CD95+). HLA-A02 dextramer loaded with the NS4B214-222 peptide (LLWNGPMAV) from YFV17D (Immudex) was used for epitope-specific T-cells isolation. Cells were stained with NS4B-dextramer-PE, anti-CD3-eFluor450 (UCHT1, eBioscience), and anti-CD8-FITC (SK1, eBioscience) according to the manufacturer’s protocol. RNA was isolated using standard TriZol protocol (for bulk PBMCs, CD4 and CD8, NS4B-specific and negative fractions) or RNAeasy Micro Kit (Qiagen) (for memory subsets). The amount of RNA was measured on Qubit 2.0 (Invitrogen).
Sample preparation for the single-cell gene expression and immune profiling
For 10x Genomics single-cell gene expression and immune profiling, we used PBMCs isolated from 60 ml of blood of donor M1 before the second immunization. PBMCs were stained with NS4B-dextramer-PE (Immudex) according to the manufacturer’s protocol. Additionally, cells were stained with anti-CD3-eFluor450 (eBioscience), and anti-CD8-FITC (eBioscience). Previous to FACS sorting procedure, we used propidium-iodide to mark dead cells. As the NS4B-specific cell frequency was very low (Fig. S9C), we used anti-PE Ultra-pure MicroBeads (Miltenyi) for the enrichment. In brief, every milliard of PBMCs was incubated with 10 l of magnetic beads for 15 minutes on ice. After a washing step with PBS 5% FCS, the cell suspension was applied on MS MACS Column (Miltenyi). Columns were washed three times with PBS 5% FCS and stained with propidium-iodide just before the FACS (FACS Aria II). This procedure resulted in a dramatic increase of NS4B-specific cell frequency in the sample (Fig. S9C) and accordingly lead to reduced FACS procedure time. For single-cell immune profiling of bulk T-cell clonotypes from PBMCs, we stained the cells with anti-CD3-eFluor450 (Invitrogen) and propidium-iodide, thus selecting CD3 positive cells. Approximately 10,000 CD3+ cells were used for 10x Genomics VDJ T-cell receptor enrichment protocol.
High throughput T-cell repertoire sequencing
Libraries of TCR alpha and TCR beta chains were prepared as previously described (pogorelyy_persisting_2017, ). In brief, isolated RNA was used for cDNA synthesis with 5’RACE template switch technology to introduce universal primer binding site and Unique Molecular Identifiers (UMI) at the 5’ end of RNA molecules. Primers complementary to both TCR alpha and TCR beta constant segments were used for cDNA synthesis initiation. cDNA was amplified in two subsequent PCR steps. During the second PCR step, sample barcodes and sequence adapters were introduced to the libraries. Libraries for the fractions with low amount of cells were prepared using SMART-Seq v4 Ultra Low Input RNA kit (TakaraBio). Libraries were sequenced on Illumina platform HiSeq 2500 with 2100 bp sequencing length or NovaSeq 2150 bp sequencing length. Parallel single-cell alpha/beta TCR and 5’ gene expression sequencing was performed using 10x Genomics Kits (Chromium Single Cell A Chip Kit, Chromium Next GEM Single Cell 5’ Library and Gel Bead Kit, Chromium Single Cell V(D)J Enrichment Kit, Human T Cell, Chromium Single Cell 5’ Library Construction Kit, Chromium i7 Multiplex Kit) according to the manufacturer’s protocol. Libraries were sequenced on Illumina platform HiSeq 3000 with 2150 bp sequencing length.
Repertoire data analysis
Raw data preprocessing. Raw repertoire sequencing data were preprocessed as described in (pogorelyy_persisting_2017, ). Briefly, sequencing reads were demultiplexed and clustered by UMI with MIGEC software (shugay_towards_2014, ). The alignment of genomic templates to the resulting consensus sequences was performed with MiXCR (bolotin_mixcr:_2015, ). Raw sequencing data obtained from RNAseq experiments were analyzed directly with MiXCR using default RNAseq analysis pipeline.
Identification of changed clonotypes by edgeR. To identify TCR alpha and TCR beta clonotypes that significantly expand after YF vaccination, we used the edgeR package (robinson_edger:_2010, ) as previously described (pogorelyy_precise_2018, ). In brief, for each timepoint, we used two biological replicates of bulk PBMC. TMM-normalization and trended dispersion estimates were performed according to edgeR manual. We used an exact test based on the quantile-adjusted conditional likelihood (qCML) to identify clonotypes significantly expanded between pairs of timepoints. A clonotype with FDR adjusted p-value (exact qCML-based test) was considered YF-responding if its log2-fold change estimate log2FC between any pairs of timepoints from 0 to the peak of the primary response (day 15). The usage of log2FC threshold in addition to p-value threshold is important to filter statistically significant but small clonal expansions, which were previously shown to occur in healthy donors in the absense of vaccination on the timescale of one week, see (pogorelyy_precise_2018, ). CD4/CD8 in silico phenotyping was performed as suggested before (pogorelyy_precise_2018, ): for each clone from bulk PBMC repertoire we assign CD4 phenotype if it is more abundant in the sequenced CD4 repertoire and vice versa. Over of clonotypes were found exclusively in CD4 or CD8 compartment. However, a small group of clonotypes ( for TCR alpha and for TCR beta for day 15 timepoint of donor M1) was present in both compartments in comparable frequencies. These clonotypes have significantly higher TCR generative probabilities than others (, Mann Whitney U-test) and thus are likely to arise from convergent recombination of the same TCR chain in both compartments.
To quantify the magnitude of the response on each timepoint we inferred the fraction of YF-responding cells as the proportion of all T-cells. To estimate this quantity from TCR repertoire data, for each susbset of interest (CD4+, CD8+, or NS4B-specific YF-responding clonotypes) we calculate the cumulative frequency of these clonotypes in TCR repertoire of bulk PBMCs in each timepoint.
Identification of YF-responding clonotypes by Principal Component Analysis (PCA). We chose clonotypes that appeared in the top 1000 most abundant clonotypes at any timepoint after primary immunization. For these clonotypes, we made matrices of frequencies on all timepoints after primary immunization. Before applying PCA to these matrices, each value was normalized by dividing on maximum frequency for this clonotype. For cluster identification, we used hierarchical clustering with average linkage on euclidean distances between clonotypes. The number of clusters was set to 2. This analysis was performed for both alpha and beta chains of donor M1. For the twin donors (pogorelyy_precise_2018, ), only replicate F1 was used for expanded clones identification.
Memory transition analysis. For this analysis, we used clonotypes that had at least 30 UMIs at day 45 after primary vaccination. The clonotype frequency in memory subset is multiplied by the number of cells obtained by FACS on this timepoint for this subset. Then adjusted frequencies are normalized across all subsets to get a partition of each TCR clonotypes across subsets. Obtained partitions were multiplied by the frequency of a clonotype in bulk at this timepoint to get the concentration of clonotypes with a particular memory phenotype in the bulk repertoire.
Computational decontamination of NS4B-specific repertoire. Since FACS sorting is not precise, TCR repertoires of the population of interest often contains abundant clonotypes from the bulk population. To obtain a list of NS4B-specific TCRs we took clonotypes that were enriched (at least 10 times) in the A02-NS4B-dextramer positive fraction compared to A02-NS4B-dextramer negative fraction. We also discarded TCR clonotypes that were more abundant in CD4 than CD8 subpopulation on day 0 (as only CD8 cells should bind to A02 which is a MHC I allele). Although of resulting unique NS4B-specific clonotypes overlapped with the list of significantly expanded clonotypes identified with edgeR, they corresponded to of NS4B-specific T-cells.
Computational pairing of TCR alpha and TCR beta from bulk repertoires
For pair of clonal time traces we used a Euclidian distance between transformed frequencies:
where and are the concentrations of an and a chain on the -th timepoint. The transformation of clone concentration was chosen to address the overdispersion of frequencies at large concentrations (see (pogorelyy_precise_2018, )):
where and . To address possible systematic bias in expression between and chains in a clonotype, we introduce a log-fold shift in a trajectory with a quadratic penalty (=0.1):
We calculated distances between each pair of and clonotypes out of the 1000 most abundant ones in the bulk repertoires on day 15 post-vaccination. For each clonotype, we picked the 5 closest clonotypes as candidate pairings. As a benchmark, we used two single-cell TCR sequencing (scTCRseq) experiments using the 10x Genomics platform and obtained paired repertoires for samples of bulk T-cells (CD3+) and YF epitope-specific T-cells (CD8+NS4B-dextramer+). Note that these two samples are very different in their clonal time traces: NS4B-specific clones show very active response dynamics, expanding and contracting in the course of primary and booster immunization, while the CD3+ T-cell sample corresponds to the most abundant clones in the repertoire, which are largely stable between timepoints. A TCR clonotype from 10x genomics experiment was considered correctly paired from bulk TCRseq data using the algorithm if the correct TCR beta was present among the 5 most probable TCR beta sequences predicted for the TCR alpha of this clonotype. Out of the 62 NS4B-specific clonotypes sampled in the 10x Genomics experiment, we were able to computationally identify 41 correct pairs from the bulk TCRseq data. Out of 26 CD3+ T-cell clonotypes, 20 were paired correctly.
Paired single-cell TCR sequencing
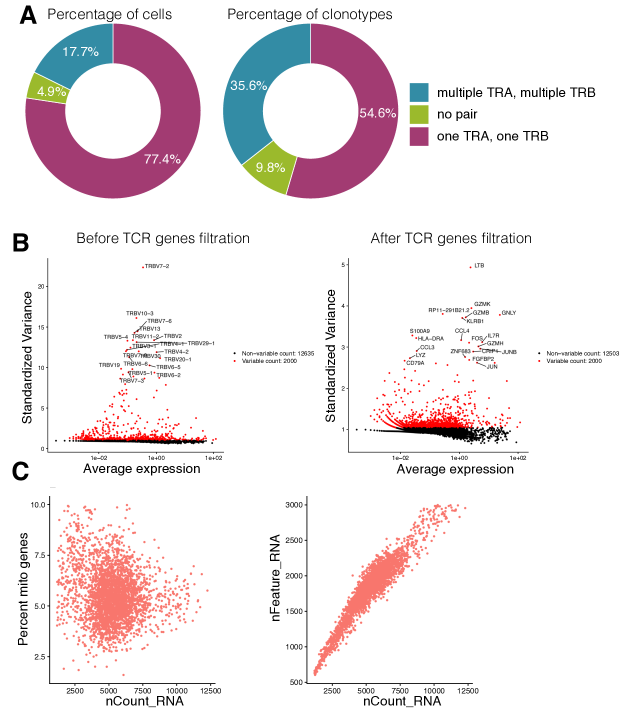
To investigate TCR chains pairing in YF-specific clonotypes, we performed single-cell immune profiling with 10x Genomics protocol. The analysis of the data with Cell Ranger 2.2.0 (10x Genomics) with default parameters resulted in 3244 cells corresponding to 986 clones. Many of these clones had multiple TRA/TRB chains and are likely to represent multimers of cells (Fig. S15A). For further analysis, we chose only high-confident clones that had one TRA and one TRB chain and were present more than twice in the data. This procedure resulted in the list of cells corresponding to 164 TCR alpha/beta clones.
TCR-pMHC complex modeling
Models for each paired alpha-beta TCRs from 10x Genomics data were constructed using the RepBuilder server (https://sysimm.org/rep_builder/) (schritt_repertoire_2019, ) , and then docked to HLA-A02-LLWNGPMAV complex using rosettaDock2 (https://www.rosettacommons.org/software) routine (lyskov_rosettadock_2008, ). 152 TCRs passed the modeling step. For each TCR we obtained 1000 decoys in docking simulations. The thirty best decoys (by interface score) were used to calculate a contact map with the bio3d R package (grant_bio3d:_2006, ). It was previously shown (pierce_flexible_2013, ), that some docking decoys exhibit binding modes which are not found in natural TCRs. In the analysis, we only used decoys in which the root mean squared deviation between the centers of mass of the alpha and beta chains in the decoys, and the centers of mass of these chains in at least one published HLA-A02-TCR complex from ATLAS database (borrman_atlas:_2017, ), were less than 4 . The number of contacts to the peptide was averaged over decoys that passed the threshold. Only clonotypes with of resulting filtered decoys were used for the analysis (see Fig. S12A).
Single cell gene expression analysis
For single-cell gene expression analysis, we pre-processed the data with Cell Ranger 2.2.0 (10x Genomics). We used GRCh38-1.2.0 reference genome for the gene alignment. The resulting gene count matrix was analyzed with Seurat 3.0 package (stuart_comprehensive_2019, ; butler_integrating_2018, ). Cells that had fewer than 200 features detected were filtered out. We also filtered out features that were present in fewer than 3 cells and genes of TCR receptors (e.g., TRAV, TRAJ, TRBV, TRBJ), as they are the source of unwanted variation in the data (Fig. S15B). Then a standard data pre-processing was performed to remove low-quality cells and cells multiplets. We filtered out cells that had more than 2700 features or more than 8% of mitochondrial genes (Fig. S15C). Feature expression measurements for each cell were normalized using default log-normalization in the Seurat package. Following the manual’s suggestion, the 2000 most variable features were selected for further analysis. Prior to dimensionality reduction, data were scaled so that the mean expression was 0 and the variance equals to 1. The first 10 dimensions of PCA were used for cluster identification with the resolution parameter set to 0.4. To identify differentially expressed genes between clusters we used the MAST algorithm (finak_mast:_2015, ) implemented in the Seurat package. We only tested genes that were present in more than 25% of cells in any group and that had at least a 0.25 log fold difference between the two groups of cells.
We performed a similar analysis to identify differentially expressed genes between clonotypes (rather than individual cells). We created a matrix containing the mean gene expressions over cells within each clonotype, and treated it like normal single-cell results. In this case, we did not filter multiplet cells (with a high number of features and a high percentage of mitochondrial genes), as all our “cells” were indeed computational multimers. The rest of the analysis was performed in the same way. To check the results we shuffled cell barcodes between the clonotypes and repeated the analysis. All cells ended up in a single cluster for this random control.
Acknowledgments
We thank J.C. Crawford and P.G. Thomas for assistance with TCRdist software and for helpful discussions. This work was funded by the European Research Council Consolidator Grant n. 724208 and RSF 15-15-00178. IZM was supported by RFBR 18-29-09132 and 19-54-12011. PB, ER and AF were supported by the Deutsche Forschungsgemeinschaft (DFG) through the Cluster of excellence Precision Medicine in Chronic Inflammation (Exc2167). ER was partially supported by DFG 4096610003. DMC was supported by grant 075-15-2019-1660 from the Ministry of Science and Higher Education of the Russian Federation to the Center for Precision Genome Editing and Genetic Technologies for Biomedicine under Federal Research Programme for Genetic Technologies Development from 2019 to 2027.
References
- (1) Murugan A, Mora T, Walczak AM, Callan CG (2012) Statistical inference of the generation probability of T-cell receptors from sequence repertoires. Proceedings of the National Academy of Sciences of the United States of America 109:16161–16166.
- (2) Miller JD, et al. (2008) Human effector and memory CD8+ T cell responses to smallpox and yellow fever vaccines. Immunity 28:710–722.
- (3) Akondy RS, et al. (2009) The yellow fever virus vaccine induces a broad and polyfunctional human memory CD8+ T cell response. Journal of Immunology (Baltimore, Md.: 1950) 183:7919–7930.
- (4) Akondy RS, et al. (2015) Initial viral load determines the magnitude of the human CD8 T cell response to yellow fever vaccination. Proceedings of the National Academy of Sciences of the United States of America 112:3050–3055.
- (5) Blom K, et al. (2013) Temporal dynamics of the primary human T cell response to yellow fever virus 17d as it matures from an effector- to a memory-type response. Journal of Immunology (Baltimore, Md.: 1950) 190:2150–2158.
- (6) Kohler S, et al. (2012) The early cellular signatures of protective immunity induced by live viral vaccination. European Journal of Immunology 42:2363–2373.
- (7) Kongsgaard M, et al. (2017) Adaptive immune responses to booster vaccination against yellow fever virus are much reduced compared to those after primary vaccination. Scientific Reports 7:662.
- (8) James EA, et al. (2013) Yellow fever vaccination elicits broad functional CD4+ T cell responses that recognize structural and nonstructural proteins. Journal of Virology 87:12794–12804.
- (9) DeWitt WS, et al. (2015) Dynamics of the cytotoxic T cell response to a model of acute viral infection. Journal of Virology 89:4517–4526.
- (10) Pogorelyy MV, et al. (2018) Precise tracking of vaccine-responding T cell clones reveals convergent and personalized response in identical twins. Proceedings of the National Academy of Sciences of the United States of America 115:12704–12709.
- (11) Akondy RS, et al. (2017) Origin and differentiation of human memory CD8 T cells after vaccination. Nature 552:362–367.
- (12) de Melo AB, et al. (2013) T-cell memory responses elicited by yellow fever vaccine are targeted to overlapping epitopes containing multiple HLA-I and -II binding motifs. PLoS neglected tropical diseases 7:e1938.
- (13) Co MDT, Terajima M, Cruz J, Ennis FA, Rothman AL (2002) Human cytotoxic T lymphocyte responses to live attenuated 17d yellow fever vaccine: identification of HLA-B35-restricted CTL epitopes on nonstructural proteins NS1, NS2b, NS3, and the structural protein E. Virology 293:151–163.
- (14) Fuertes Marraco SA, et al. (2015) Long-lasting stem cell-like memory CD8+ T cells with a naïve-like profile upon yellow fever vaccination. Science Translational Medicine 7:282ra48.
- (15) Wieten RW, et al. (2016) A Single 17d Yellow Fever Vaccination Provides Lifelong Immunity; Characterization of Yellow-Fever-Specific Neutralizing Antibody and T-Cell Responses after Vaccination. PloS One 11:e0149871.
- (16) Dash P, et al. (2017) Quantifiable predictive features define epitope-specific T cell receptor repertoires. Nature 547:89–93.
- (17) Glanville J, et al. (2017) Identifying specificity groups in the T cell receptor repertoire. Nature 547:94–98.
- (18) Schritt D, et al. (2019) Repertoire Builder: high-throughput structural modeling of B and T cell receptors. Molecular Systems Design & Engineering 4:761–768.
- (19) Pierce BG, Weng Z (2013) A flexible docking approach for prediction of T cell receptor-peptide-MHC complexes. Protein Science: A Publication of the Protein Society 22:35–46.
- (20) Appay V, van Lier RAW, Sallusto F, Roederer M (2008) Phenotype and function of human T lymphocyte subsets: Consensus and issues: Phenotype and Function of Human T Lymphocyte Subsets: Consensus and Issues. Cytometry Part A 73A:975–983.
- (21) Sathaliyawala T, et al. (2013) Distribution and compartmentalization of human circulating and tissue-resident memory T cell subsets. Immunity 38:187–197.
- (22) Thome JJC, et al. (2014) Spatial map of human T cell compartmentalization and maintenance over decades of life. Cell 159:814–828.
- (23) Bovay A, et al. (2018) T cell receptor alpha variable 12-2 bias in the immunodominant response to Yellow fever virus. European Journal of Immunology 48:258–272.
- (24) Zhang SQ, et al. (2018) High-throughput determination of the antigen specificities of T cell receptors in single cells. Nature Biotechnology.
- (25) Lyskov S, Gray JJ (2008) The RosettaDock server for local protein-protein docking. Nucleic Acids Research 36:W233–238.
- (26) Stuart T, et al. (2019) Comprehensive Integration of Single-Cell Data. Cell 177:1888–1902.e21.
- (27) Butler A, Hoffman P, Smibert P, Papalexi E, Satija R (2018) Integrating single-cell transcriptomic data across different conditions, technologies, and species. Nature Biotechnology 36:411–420.
- (28) Finak G, et al. (2015) MAST: a flexible statistical framework for assessing transcriptional changes and characterizing heterogeneity in single-cell RNA sequencing data. Genome Biology 16:278.
- (29) Jeannet G, et al. (2010) Essential role of the Wnt pathway effector Tcf-1 for the establishment of functional CD8 T cell memory. Proceedings of the National Academy of Sciences of the United States of America 107:9777–9782.
- (30) Zhou X, et al. (2010) Differentiation and persistence of memory CD8(+) T cells depend on T cell factor 1. Immunity 33:229–240.
- (31) Kaech SM, et al. (2003) Selective expression of the interleukin 7 receptor identifies effector CD8 T cells that give rise to long-lived memory cells. Nature Immunology 4:1191–1198.
- (32) Jung YW, Kim HG, Perry CJ, Kaech SM (2016) CCR7 expression alters memory CD8 T-cell homeostasis by regulating occupancy in IL-7- and IL-15-dependent niches. Proceedings of the National Academy of Sciences of the United States of America 113:8278–8283.
- (33) Schluns KS, Kieper WC, Jameson SC, Lefrançois L (2000) Interleukin-7 mediates the homeostasis of naïve and memory CD8 T cells in vivo. Nature Immunology 1:426–432.
- (34) Patil VS, et al. (2018) Precursors of human CD4+ cytotoxic T lymphocytes identified by single-cell transcriptome analysis. Science Immunology 3.
- (35) Harari A, Bellutti Enders F, Cellerai C, Bart PA, Pantaleo G (2009) Distinct profiles of cytotoxic granules in memory CD8 T cells correlate with function, differentiation stage, and antigen exposure. Journal of Virology 83:2862–2871.
- (36) Bratke K, Kuepper M, Bade B, Virchow JC, Luttmann W (2005) Differential expression of human granzymes A, B, and K in natural killer cells and during CD8+ T cell differentiation in peripheral blood. European Journal of Immunology 35:2608–2616.
- (37) Truong KL, et al. (2019) Killer-like receptors and GPR56 progressive expression defines cytokine production of human CD4+ memory T cells. Nature Communications 10:2263.
- (38) Takata H, Takiguchi M (2006) Three memory subsets of human CD8+ T cells differently expressing three cytolytic effector molecules. Journal of Immunology (Baltimore, Md.: 1950) 177:4330–4340.
- (39) Araki K, et al. (2017) Translation is actively regulated during the differentiation of CD8+ effector T cells. Nature Immunology 18:1046–1057.
- (40) Chu ND, et al. (2019) Longitudinal immunosequencing in healthy people reveals persistent T cell receptors rich in highly public receptors. BMC immunology 20:19.
- (41) Monath TP, et al. (2002) Clinical proof of principle for ChimeriVax: recombinant live, attenuated vaccines against flavivirus infections. Vaccine 20:1004–1018.
- (42) Moore JR, et al. (2019) Dependence of CD8 T Cell Response upon Antigen Load During Primary Infection : Analysis of Data from Yellow Fever Vaccination. Bulletin of Mathematical Biology 81:2553–2568.
- (43) Reinhardt B, Jaspert R, Niedrig M, Kostner C, L’age-Stehr J (1998) Development of viremia and humoral and cellular parameters of immune activation after vaccination with yellow fever virus strain 17d: a model of human flavivirus infection. Journal of Medical Virology 56:159–167.
- (44) Pogorelyy MV, et al. (2017) Persisting fetal clonotypes influence the structure and overlap of adult human T cell receptor repertoires. PLoS computational biology 13:e1005572.
- (45) Shugay M, et al. (2014) Towards error-free profiling of immune repertoires. Nature Methods 11:653–655.
- (46) Bolotin DA, et al. (2015) MiXCR: software for comprehensive adaptive immunity profiling. Nature Methods 12:380–381.
- (47) Robinson MD, McCarthy DJ, Smyth GK (2010) edgeR: a Bioconductor package for differential expression analysis of digital gene expression data. Bioinformatics (Oxford, England) 26:139–140.
- (48) Grant BJ, Rodrigues APC, ElSawy KM, McCammon JA, Caves LSD (2006) Bio3d: an R package for the comparative analysis of protein structures. Bioinformatics (Oxford, England) 22:2695–2696.
- (49) Borrman T, et al. (2017) ATLAS: A database linking binding affinities with structures for wild-type and mutant TCR-pMHC complexes. Proteins 85:908–916.
| Locus | M1 | P30 |
|---|---|---|
| A | 02:01:01/24:02:01 | 02:01:01/31:01:02 |
| B | 15:01:01/39:01:01 | 35:01:01/48:01:01 |
| C | 03:04:01/12:03:01 | 04:01:01/08:01:01 |
| DQB1 | 02:01:01/03:02:01 | 03:01:01/03:01:01 |
| DRB1 | 03:01:01/04:01:01 | 11:01:01/12:01:01 |
| DRB3 | 02:02:01 | 01:01:02/02:02:01 |
| DRB4 | 01:03:01 | - |