The High-Redshift Clusters Occupied by Bent Radio AGN (COBRA) Survey: Follow-up Optical Imaging
Abstract
Here we present new red sequence overdensity measurements for 77 fields in the high- Clusters Occupied by Bent Radio AGN (COBRA) survey, based on - and -band imaging taken with Lowell Observatory’s Discovery Channel Telescope. We observe 38 COBRA fields in -band and 90 COBRA fields in -band. By combining the - and -band photometry with our 3.6 m and 4.5 m IRAC observations, we identify 39 red sequence cluster candidates that host a strong overdensity of galaxies when measuring the excess of red sequence galaxies relative to a background field. We initially treat the radio host as the cluster center and then determine a new cluster center based on the surface density of red sequence sources. Using our color selection, we identify which COBRA cluster candidates have strong red sequence populations. By removing foreground and background contaminants, we more securely determine which fields include cluster candidates with a higher significance than our single-band observations. Additionally, of the 77 fields we analyze with a redshift estimate, 26 include newly estimated photometric redshifts.
1 Introduction
Forming at the deepest potential wells in the matter distribution of the early universe, galaxy clusters are a tool for studying galaxy evolution and the cosmological make-up and dark matter distribution of the universe. Because we search for high- galaxy clusters, especially at 1, we see clusters with a variety of different characteristics, from large-scale cluster mergers, to clusters dominated by populations of star forming and red early-type galaxies (e.g., McGee et al., 2009; Brodwin et al., 2013; Cooke et al., 2016; Hennig et al., 2017). These observations yield many exciting questions: how does the dynamical state of the cluster change over time? At high-, are clusters merging or are they dynamically relaxed? How do cluster galaxies evolve and merge over time? Additionally, because clusters are comprised of tens to thousands of similarly aged galaxies, some of which host active galactic nuclei (AGN), observing a sample of clusters across redshift space allows us to gain a better overall understanding of how these cluster galaxies change over time.
There are thousands of low- ( 0.25) spectroscopically-confirmed galaxy clusters, but the number of confirmed high- clusters diminishes dramatically at 1. In the era of high- astrophysics, the methods for identifying galaxy clusters have evolved. Some of the earliest recognized galaxy clusters were identified purely by large optical overdensity surveys (Abell, 1958). Difficulties due to the overcounting of foreground and background galaxies make this method problematic, especially for high- searches where field contamination is prevalent. However, infrared (IR) overdensity searches, similar to those performed by Abell (1958), but also taking advantage of multiple longer wavelength bands, are excellent for identifying high- clusters. At 0.5, the optical peak of a typical galaxy’s spectral energy distribution (SED) shifts from the optical into the IR. At these wavelengths, the galaxy population should be brighter than the typical foreground contaminants, making it easier to identify high- galaxies. By searching the IR sky with satellites such as the and the - () and taking advantage of multi-wavelength photometry, new, 1 clusters and cluster candidates have been identified (e.g., Eisenhardt et al., 2008; Muzzin et al., 2009; Wilson et al., 2009; Demarco et al., 2010; Brodwin et al., 2011; Muzzin et al., 2013; Stanford et al., 2014; Gonzalez et al., 2018).
With the aid of multi-band photometry, single band optical and IR overdensity searches can be dramatically improved. One of the most recognizable components of evolved galaxy clusters are dense cores of early-type galaxies. Since early-type galaxies are characterized by little to no star formation and populations of older, redder stars, these early-type galaxies populate the red sequence (Gladders & Yee, 2000). The red sequence, a prominent evolutionary track on color magnitude diagrams (CMDs), includes large populations of similarly colored galaxies across a range of magnitudes and has been studied thoroughly across multiple wavebands in, for example, the Coma cluster (e.g., Brodwin et al., 2006; Eisenhardt et al., 2007). These red galaxies not only identify clusters, but also can be used to estimate a cluster’s redshift. The similar color of red sequence galaxies yields reliable photometric redshift estimates for galaxy clusters that lack the spectroscopic redshifts of individual cluster galaxies needed to confirm a cluster (Eisenhardt et al., 2008). Although Gladders & Yee (2000) first identified the red sequence in clusters out to 1, dense populations of red galaxies exist in clusters out to 1.5 - 1.8 (e.g., Andreon et al., 2014; Cerulo et al., 2016). Unlike traditional overdensity searches, which are dramatically hampered by field contamination, the level of red sequence contamination is low (Cerulo et al., 2016).
Instead of searching for galaxy populations across large survey fields, AGN targeting can also be used to find clusters across a wide range of redshifts with a broad range of masses (e.g., Galametz et al., 2012; Wylezalek et al., 2013; Cooke et al., 2015; Paterno-Mahler et al., 2017). The Clusters Around Radio-Loud AGN (CARLA) survey find that radio-loud AGN (RLAGN) at 1.3 3.2 preferentially live in environments with positive excesses of galaxy counts above an average background in 92 of their sample and in denser, 2 environments, such as clusters or groups, 55.3 of the time (e.g., Wylezalek et al., 2013, 2014). CARLA galaxy cluster candidates include both mature and young galaxy populations, as well (Cooke et al., 2016). Additionally, Castignani et al. (2014) reinforce this result by showing that 70 of low-luminosity RLAGN at 1 2 are found in overdense environments. Furthermore, using the CARLA survey, Hatch et al. (2014) find a significant correlation between environment and radio power; when looking at similarly massive host galaxies, on average RLAGN reside in more significantly overdense structures than their radio quiet counterparts. Hatch et al. (2014) also estimate the spatial distribution of RLAGN in the universe and find a similar distribution to protoclusters, possibly implying that all high- cluster progenitors at 1.3 3.2 experience an epoch of powerful AGN feedback, although there are clear counterexamples (e.g., Cucciati et al., 2014).
The Clusters Occupied by Bent Radio AGN (COBRA) survey was compiled to provide another way to identify galaxy clusters. Each COBRA bent, double-lobed radio source was observed as a part of the Very Large Array Faint Images of the Radio Sky at Twenty-Centimeters (VLA FIRST) survey (Becker et al., 1994). The VLA FIRST survey consists of observations of 10,000 square degrees of the radio sky primarily around the North Galactic Cap, but also including the South Galactic Cap. It was designed to cover approximately the same area of the sky as the Palomar Sky Survey. This same region of the sky was further observed as part of the Sloan Digital Sky Survey (SDSS). Each low- and high- COBRA source was selected from larger samples of visual-bent and auto-bent samples described in Wing & Blanton (2011). The low- sample was assembled by identifying the host galaxies of each radio source in SDSS -band images to a limit of = 22.0 mag within a search radius set to ensure a 95 accuracy (Wing & Blanton, 2011), while the high- sample consists of sources where no SDSS host galaxy was identified. The visual-bent sample consists of 384 sources identified by eye from a portion ( 3000 square degrees) of the VLA FIRST survey to have a bent morphology (Blanton, 2000). Of those, 112 lack an SDSS host. The auto-bent sample was selected using a pattern recognition program (Proctor, 2006) to locate three-component radio sources (nominally a core and two lobes). From the 1546 auto-bent sources selected from the VLA FIRST survey, 541 sources were identified as being at high-. Both the visual- and auto-selected samples limit the distance between each radio component to be no greater than 60. The 653 sources lacking optical hosts were placed in the high- sample. Based on the limiting magnitude of SDSS, any source in the high- sample should be at 0.5.
Bent, double-lobed radio sources, such as those in the COBRA survey, offer a highly efficient method for selecting clusters (e.g., Blanton et al., 2000, 2001, 2003; Wing & Blanton, 2011). The distinctive “c” shapes of bent radio sources, caused by the ram pressure of radio jets as their host galaxies and the ICM in which they are embedded move relative to each other (e.g., Owen & Rudnick, 1976; O’Donoghue et al., 1993), act as beacons that reveal otherwise concealed high- clusters. The host galaxies of these bent radio sources are often luminous giant elliptical galaxies in the centers of clusters. In the low- universe, 0.5, 40 - 80 of bent sources have been shown to reside in cluster environments depending on different richness cutoffs and samples (Wing & Blanton, 2011). In clusters where the central galaxies may not have the necessary peculiar velocity to create the observed bent lobes, the bent morphology may result from large-scale fluid flows of the surrounding gas, as can be found in cluster-cluster mergers (e.g., Burns, 1990; Roettiger et al., 1996; Burns et al., 1996; Douglass et al., 2011). Bent sources can also reside in relatively relaxed systems, where “sloshing spirals” of hot ICM gas are observed in the X-ray (e.g., Paterno-Mahler et al., 2013). Here, the bent shape results from the displacement of the hot ICM in the main galaxy cluster due to an off-axis encounter with a nearby subcluster. When the subcluster approaches the main cluster, the main cluster’s hot ICM is pulled toward it; when the subcluster recedes, the hot ICM falls back, creating a sloshing pattern. Wing & Blanton (2013) find that bent, double-lobed radio sources are found in a range of dynamical environments. Based on an optical substructure analysis of low- bent sources, Wing & Blanton (2013) find that bent sources are no more likely to be found in major merging environments than non-bent AGN. Additionally, when not in clusters, bent radio sources can be found in other environments with surrounding gas, including groups, fossil groups, and large-scale filaments (e.g., Edwards et al., 2010).
The first results of the high- COBRA survey are presented in Blanton et al. (2015) and Paterno-Mahler et al. (2017). Of the 653 sources in the original sample, 646 were successfully observed with in 3.6 m with the Infrared Array Camera (IRAC; Fazio et al., 2004). Additionally, 135 of these sources were observed with in 4.5 m. These observations were designed such that our exposure times led to a S/N of 5.0 in the 3.6 m observations. Although the sample was designed to exclude sources at 0.5, when we carefully compare our hosts with SDSS, we find that 119 of the 646 high- sources have SDSS photometric redshift estimates at 0.5. The low- objects result from uncertainty as to which radio component is the core, thus resulting in previous misidentification of the lack of a radio host in the early automated analysis of our sources, and a range of absolute magnitudes for the host galaxies. Of the 646 sources, there are 41 quasars, each with SDSS spectroscopic redshifts, ranging from 0.708 2.943.
Paterno-Mahler et al. (2017) find that 190 of the high- COBRA candidates are in cluster environments, defined as a 2 overdensity in the number of galaxies found within either a 1 or 2 region centered on each radio source when compared to galaxy counts in the Ultra Deep Survey (SpUDs, PI: J. Dunlop) field. Overall, 530 of the total 646 sources ( 82) are in regions that have a higher density of sources than the mean of the SpUDs field. Paterno-Mahler et al. (2017) additionally directly compare the COBRA selection methodology to that of the CARLA sample of RLAGN (Wylezalek et al., 2013). In doing a direct comparison, Paterno-Mahler et al. (2017) find that COBRA and CARLA identify regions with a similar overdensity, although CARLA identifies a higher percentage of rich clusters. The differences between the two surveys when compared at the same depth (29 for COBRA versus 44 for CARLA) may result from bent, double-lobed radio sources being found in a larger range of cluster and group environments than the CARLA sources, which have a higher average radio power.
In this paper, we present results from optical follow-up imaging of the high- COBRA survey. A summary of our observations and data analysis are presented in §2. Our photometric redshift estimates are discussed in §3. Our initial measurements of red sequence galaxy overdensity are presented in §4. Further analysis of the red sequence overdensity is presented in §5. Our results are discussed in §6 and our conclusions are presented in §7. We assume a CDM cosmology with H0 = 70 km s-1 Mpc-1, Λ = 0.7, and M = 0.3. All magnitudes presented are AB magnitudes unless otherwise specified.
2 Observations
The observations for the high- COBRA survey include IR observations taken with the via a Snapshot Proposal (PID 80161, PI Blanton) using IRAC and optical follow-up observations taken at Lowell Observatory’s 4.3 m Discovery Channel Telescope (DCT) using the Large Monolithic Imager (LMI; Massey et al., 2013).
2.1 Optical Imaging
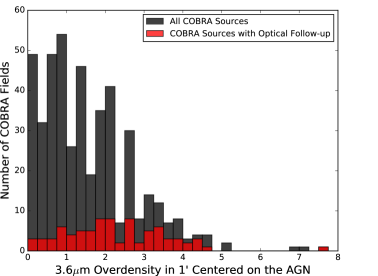
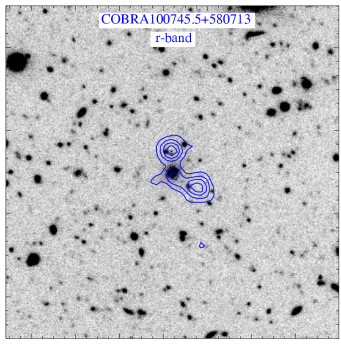
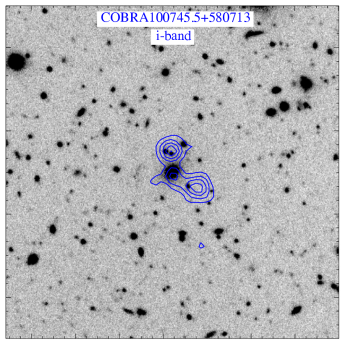
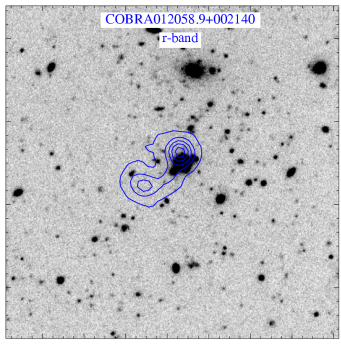
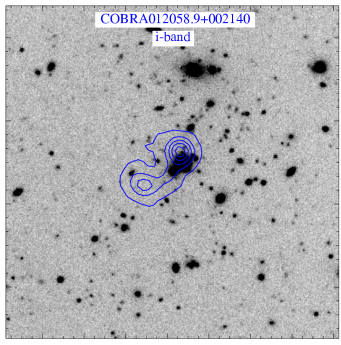
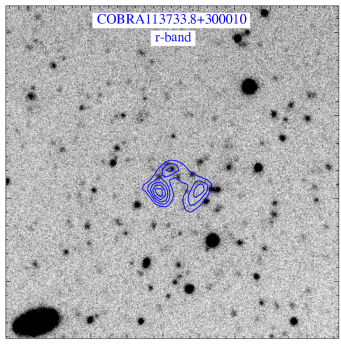
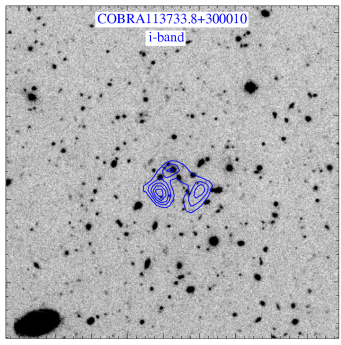
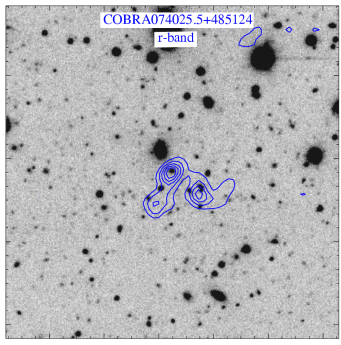
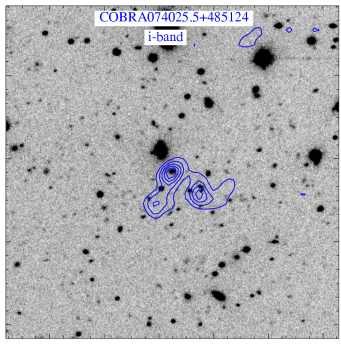
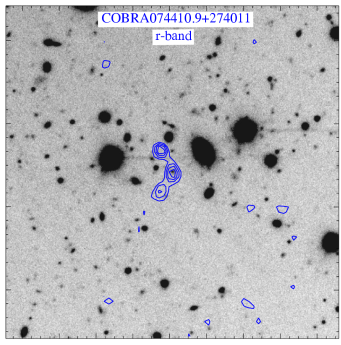
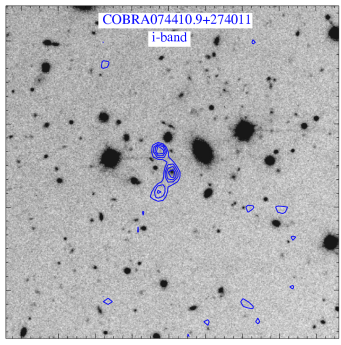
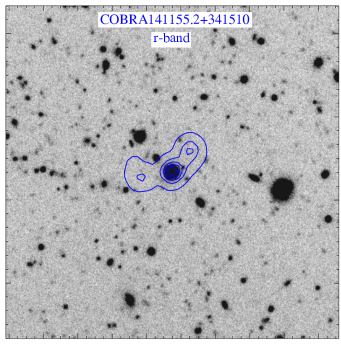
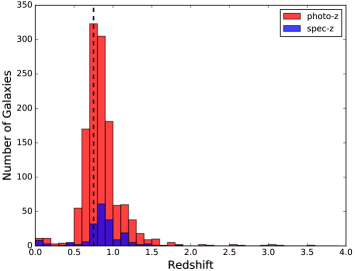
The optical follow-up for the high- COBRA survey was performed at Lowell Observatory’s 4.3m DCT using the 123 123 field-of-view (FOV) LMI. The LMI has a 024 per pixel scale (when binned by a factor of two, typical for LMI). Fields were observed on 26.5 nights over a four year span from 2013 through 2017. The typical seeing was 08, but ranged from 06 to 19. We observed 38 fields in the SDSS -band and 90 fields in the SDSS -band. Each field observed in -band was also observed in -band (see Table 1 for information on the observations). Since our optical follow-up began before the analysis presented in Paterno-Mahler et al. (2017) was completed, the earlier DCT observed fields were chosen based on radio observations and morphology. Specifically, we targeted fields that included either particularly distinct bent radio sources or quasars. More recently observed fields were additionally chosen based on strong IR overdensities ( 2) determined in Paterno-Mahler et al. (2017), although we avoid fields with known low- clusters in them. The 3.6 m overdensity in 1 of all COBRA sources relative to the sources with optical follow-up is shown in Figure 1. As can be seen, we have follow-up observations of a larger fraction of fields with stronger overdensities. Of the 90 fields observed, 57 are classified as clusters in Paterno-Mahler et al. (2017). These fields are noted in Table 2. Examples of 2 2 cutouts of COBRA fields observed at the DCT in - and -band are shown in Figure 2.
The majority of our observations are either 3600 s (3900 s) with the average depth reached being = 24.5 mag ( = 25.0 mag for the longer exposure) and = 24.0 mag ( = 24.5 mag), respectively. The average magnitude of an L* galaxy, which we model using EzGal (Mancone & Gonzalez, 2012) and discuss fully in §3, at = 1 is 24.6 mag in -band and 23.5 mag in -band. Our deeper -band imaging is sufficiently sensitive to detect objects as faint as L* + 0.5 mag, and our deeper -band imaging reaches L* + 1.0 mag. Of the 38 -band targets, 6 host quasars, while 20 of the 90 -band targets host quasars. The quasars in our sample have been labeled in Table 1.
2.2 Data Reduction
2.2.1 DCT Observations
We reduce our DCT data using standard IRAF (Tody, 1993) reduction methods. We correct each object image for bias and flat fields. Typically, twilight flat fields are used from the night of the observation. In some instances, we use either dome flats or twilight flats from the nearest possible night if no flats are available from the night of the observation. Because we dither between each exposure, we align the images before combining them. The final image for each field is a combination of two to four frames using an exposure time weighted average. The world coordinate system (wcs) solutions are calculated for the combined images using positions of SDSS objects in the field.
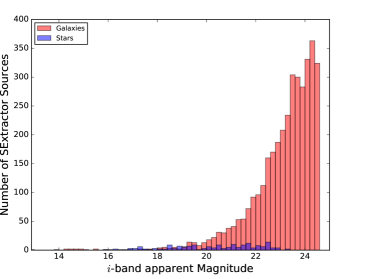
We perform photometry on each field with SExtractor (Bertin & Arnouts, 1996) in single-image mode. We apply the tophat2.03x3.conv filter, a 33 convolution mask of a top-hat PSF with a diameter of 2 pixels, to better detect low surface brightness sources. To deblend our sources, we set the minimum contrast to deblend two objects, DEBLENDMINCONT, to 0.0001 to accurately separate the closely spaced sources common in our denser fields. We use the SDSS catalog to determine a unique zeropoint for each field by comparing the magnitudes of non-saturated stars in our fields to the SDSS magnitudes, allowing us to determine standard magnitudes for nights that are not photometric. Our field star magnitudes are measured using the MAGAUTO measurement in SExtractor that uses a flexible elliptical aperture to capture the flux surrounding each object. We determine color corrections for the magnitudes, and find that these corrections are 0.02 mag, and are therefore neglected. Additionally, we use the CLASSSTAR parameter in SExtractor to examine our fields for stellar contaminants. The parameter uses the measured SEEINGFWHM to differentiate between point sources and extended sources and identifies galaxies as closer to 0.0 and stars as closer to 1.0. Melchior et al. (2015) identify galaxies in their sample of four Dark Energy Survey galaxy clusters as having a CLASSSTAR value 0.95 in their approximately 11 seeing - and -band observations. We follow this methodology for our COBRA sources (see Figure 3). We find a strong excess of extended sources out to 23 mag in -band. At this magnitude, the star/galaxy separation appears to break down because there are obviously stars at fainter magnitudes (even though the classifier doesn’t detect them). Because of this breakdown and the very small contribution of stars to the overall object counts in general, we do not exclude sources based on morphology (star vs galaxy). The exception may be at brighter magnitudes, where the relative contribution of stars is more significant. However, the absolute number is small and the impact on our statistics is minimal.
2.2.2 Observations
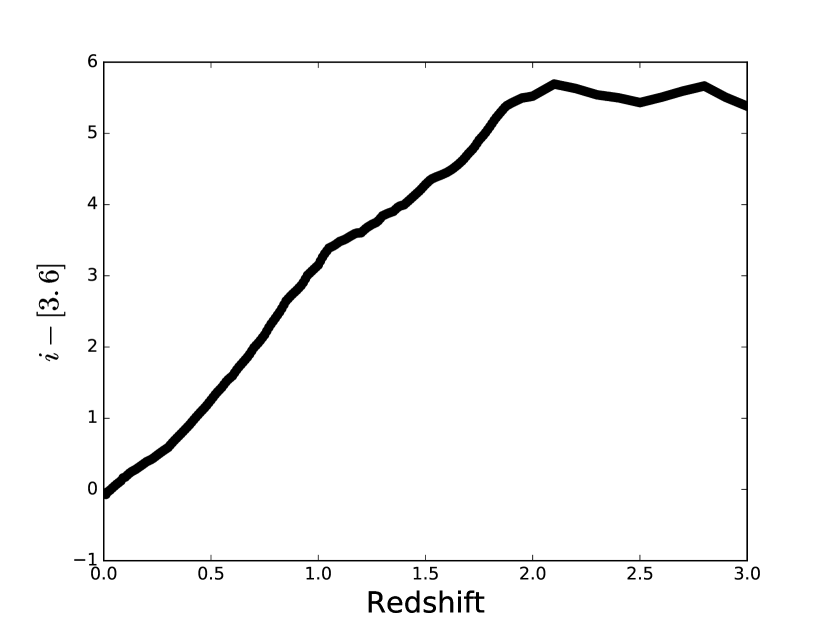
We reduce the observations following the procedures described in Paterno-Mahler et al. (2017). For photometry, we use SExtractor in single-image mode for all fields, unlike Paterno-Mahler et al. (2017), with the same parameters as the optical images for each field (described in §2.2.1). We use single-image mode to best capture the full extent of each source for our color analysis since the pixel scale of IRAC and the LMI differs by over a factor of two. The magnitude limit of the observations is 21.4 mag in both 3.6 m and 4.5 m. The average magnitude of an EzGal modeled L* galaxy at = 1 is 20.3 mag in 3.6 m and 20.6 mag in 4.5 m. Thus we can detect 1.0 mag fainter than an L* galaxy in 3.6 m and 0.8 mag fainter than an L* galaxy in 4.5 m. For our analysis, we match our output -band catalogues with our 3.6 m catalogues to measure the colors of the surrounding galaxies. This methodology is described in §4.
3 Photometric Redshift Estimates
Our new optical photometry allows us to refine the first-order redshift estimates presented in Paterno-Mahler et al. (2017). The photometric redshift of each field is estimated based on the color of the AGN host galaxy identified in Paterno-Mahler et al. (2017). In both Paterno-Mahler et al. (2017) and this work, we assume that each bent radio source is hosted by a normal early-type galaxy with an SED not strongly affected by the AGN, as is typical of these sources (Wing & Blanton, 2011). Since quasars are generally significantly bluer than typical early-type galaxies at these redshifts and all quasars in our sample have spectroscopic redshifts from SDSS, we remove them from the sample for estimating photometric redshifts. To transform our host galaxy colors into photometric redshift estimates, we use EzGal (Mancone & Gonzalez, 2012), a galaxy SED modeling program, to model a typical early-type galaxy with no AGN component. We use a standard CDM cosmology, a Bruzual & Charlot (2003) Stellar Population Synthesis (SPS) model, a Salpeter initial mass function (IMF), a single burst of star formation at a formation redshift of = 5.0, and normalize these magnitudes to the location of the knee of the luminosity function of the Coma Cluster111The values of our Coma normalization are standard input for EzGal and can be found at http://www.baryons.org/ezgal/model.php.. Throughout this paper, when we refer to an m* galaxy, we are referring to the magnitude of an m* galaxy calculated using EzGal at various redshifts based on our star formation history. It should be noted that these values will differ slightly from the measured value as we are not accounting for galaxy mergers that are prevalent in cluster environments.
Some of the initial conditions for EzGal differ from Paterno-Mahler et al. (2017) and result in different photo- estimates. Specifically, the change in formation redshift from = 3.0 to = 5.0 better accounts for the existence of massive field galaxies at 5.0 and the populations of massive galaxies with AGN and large star formation rates seen at 2.0 in clusters (e.g., Stark, 2016; Coogan et al., 2018; Shimakawa et al., 2018). Additionally, the switch from = 3.0 to = 5.0 allows us to better account for galaxies of our predicted color and redshift evolving onto the red sequence. However, the difference in formation redshifts only affects the highest redshift sources in our sample. At 1.2, the redshift estimates are unaffected. We experimented with different IMFs and find identical results.
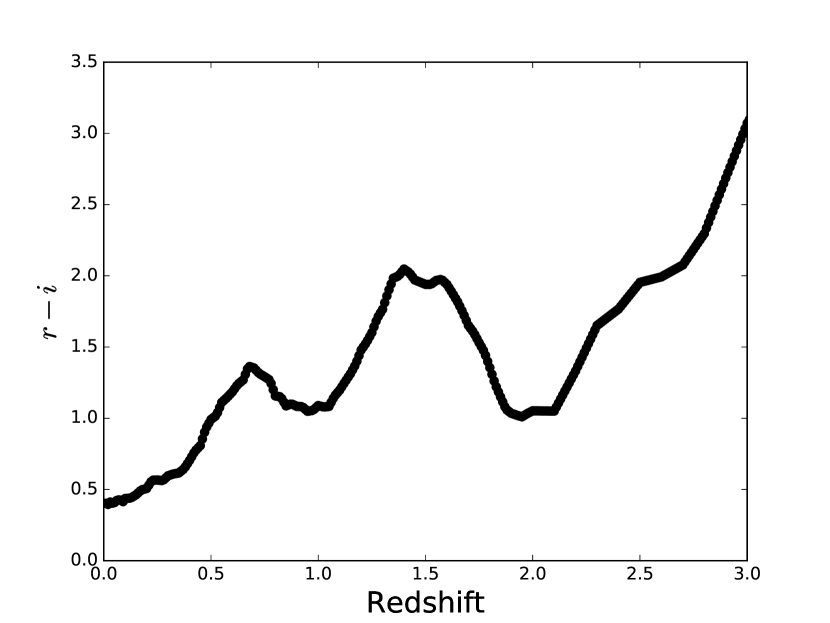
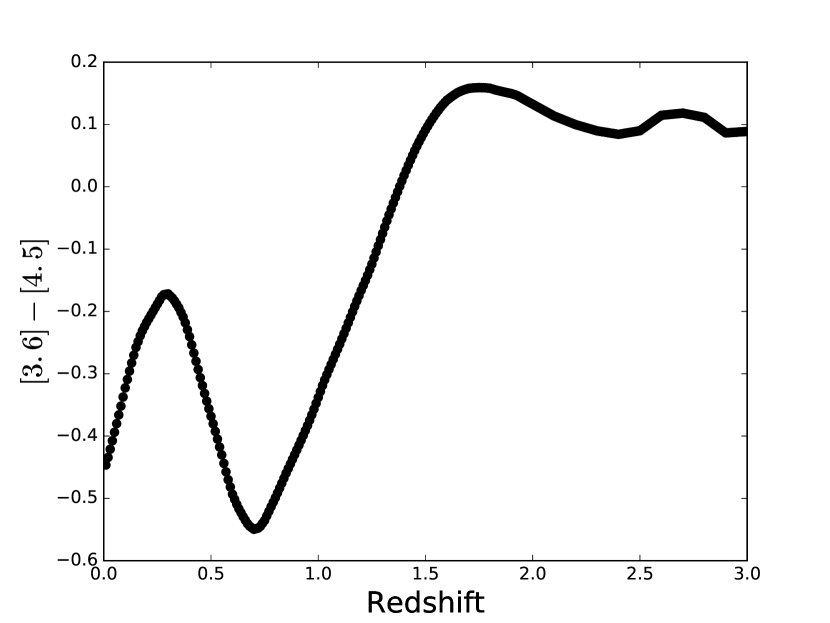
To account for the lack of pre-existing SDSS photometric redshift estimates for most of the fields observed on the DCT, we examine each radio host’s , , and colors when available. To determine the redshifts of the COBRA candidates, we measure the difference between our measured host galaxy colors and the modeled EzGal colors in all available colors ( , , ) at every redshift between 0.0 and 3.0 with a spacing of 0.01 in redshift (see Figure 4). Since some relationships between redshift and color are degenerate, we identify the redshifts that minimize the difference between the measured and modeled colors. In doing this, we compare possible redshifts across different bands, allowing us to break most degeneracies and verify the values reported in Paterno-Mahler et al. (2017).
We present photo- estimates for 73 fields based on host galaxy identification. With our color-redshift relation from EzGal, we estimate redshifts for 45 fields (see Table 3 for the individual redshift estimates). Additionally, four COBRA fields that aren’t quasars in this sample have SDSS photo- estimates (12 other fields have SDSS photo-’s that match our own photo- estimates and are included in the 45 fields above). We use previously observed spectra from SDSS, with the exception of COBRA113733.8+300010, which was verified using Keck II LRIS spectra in Blanton et al. (2003), to determine the redshift for 24 COBRA fields. Of these 24 COBRA fields with spectroscopic host redshifts, four are non-quasar host galaxies. As shown in Table 3, each photo- estimate is within 0.05 - 0.1 of the spectroscopic redshift in at least one color. Since this is within the expected uncertainty of our photometric redshifts, we are confident in our photometric redshifts without a spectroscopically confirmed host galaxy. All four spectroscopically confirmed host galaxies that are not quasars are surrounded by red sequence cluster overdensities at greater than or equal to 2, making them red sequence cluster candidates. For the analysis in this paper, we use the spectroscopic redshift when available as the host redshift. We are unable to estimate a redshift for the remaining 17 fields using the color of the host galaxy either because Paterno-Mahler et al. (2017) identify no host, we identify no host with our -band observations (despite a host being identified with our 3.6 m observations in (Paterno-Mahler et al., 2017)), or the host’s color does not agree with the EzGal models. For 18 of the fields observed in at least three bands, the redshift estimates match and are within 0.05 in redshift space of one another.
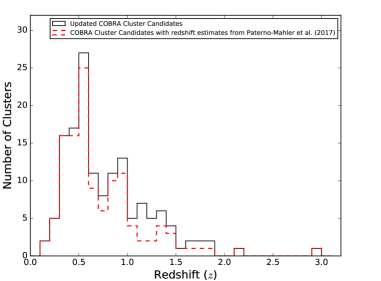
By combining our optical and IR imaging with our EzGal analysis, we measure new redshift estimates for 26 fields previously lacking such a measurement (this includes the additional four redshift estimates made in §4.1). Of these fields with new redshift estimates, 21 are cluster candidates (13 are red sequence cluster candidates), increasing the total number of COBRA clusters with a redshift estimate reported here or in Paterno-Mahler et al. (2017) from 125 to 146. Within this sample of 21 cluster candidates with newly reported redshift estimates, all are at 0.5 (four are at 0.5 0.75, five are at 0.75 1.0, and twelve are at 1.0). The highest new redshift estimate is at 1.80. Of the cluster candidates with new redshift estimates, only two are newly identified cluster candidates based on this work (the remaining 19 were identified in Paterno-Mahler et al. (2017); see §4 and §5 for a detailed discussion of how we determine cluster candidates).
Though we increase the number of COBRA cluster candidates with a redshift estimate, we still only have redshift estimates for 146 of 195 cluster candidates in COBRA. We have at least 49 additional COBRA cluster candidates reported in Paterno-Mahler et al. (2017) lacking redshift information. We expect these fields to populate the high- portion of Figure 5. We aim to observe these fields with the DCT in the coming years. Although we have only observed a small subset of COBRA in the optical, these results emphasize that our cluster candidates without redshift estimates are likely at high- (see Paterno-Mahler et al., 2017).
4 Red Sequence Analysis
Clusters are expected to host overdensities of red sequence early-type galaxies (e.g., Gladders & Yee, 2000; Rykoff et al., 2014; Andreon et al., 2014; Cooke et al., 2015; Cerulo et al., 2016). Thus, to better determine which bent, double-lobed radio sources are associated with high- galaxy clusters and improve on the single-band IR overdensities in Paterno-Mahler et al. (2017), we identify which bent AGN are surrounded by red sequence galaxies. In this section, we measure the red sequence overdensity for each field by comparing the number of red sequence sources within 1 of the radio source to a background field. We use similarities to the host galaxy color as the basis for the detection of a red sequence.
To determine which galaxies are red, we compare the optical and IR SExtractor catalogues for each COBRA field and match sources within 1 of each other (matching 3.6 m to -band, 4.5 m to 3.6 m, and -band to -band). Our matching routine is a nearest-neighbor matching routine, which determines the nearest source in one catalogue to another and removes sources without a match within 1. To verify the efficacy of our search region, we compare the number of matched sources in two bands to the number of sources that match when one of the catalogues is offset by 1. Since there are no real matches with the offset catalogue, we treat this number of matches as the fraction of non-real matches that we find. The 1 search radius yields 95 accuracy in real galaxy matches. Any source without a match is removed since we cannot determine a color (this removes low stellar mass foreground objects that are not detected in the IR, but removes IR-bright, potentially dusty, galaxies that are not detected in the optical). Using our catalogues of matched sources, we search for red sequence galaxies within 1 of the bent radio source. We focus on a 1 ( 430 kpc at = 0.7, 480 kpc radius at 1.0, and 503 kpc at = 1.3 as compared to R200 800 kpc for a 1014M cluster (e.g., Sifón et al., 2016)) region because we expect a dense core of red early-type galaxies near the cluster center.
4.1 Analysis
We focus our analysis on the color because it is monotonically redder with increasing redshift out to 2.0 (see Figure 4) and because we have images in both bands for all 90 fields. Additionally, at 0.8, these bands straddle the 4000 Å break characteristic of an elliptical galaxy’s spectrum, making this color a good identifier of red sequence galaxies at the redshifts of most of our COBRA cluster candidates.
We measure the color of each galaxy in each field for which both 3.6 m and LMI -band imaging are available, down to the m*+1 mag sensitivity limit in 3.6 m whenever possible. Because each cluster candidate lies at a different redshift, and some cluster candidates are too distant for us to achieve the m*+1 magnitude limit given the sensitivity of our imaging, we divide our sample into two subsamples that reflect the different ways they have been analyzed. We call the first the m*+1 sample, to indicate that our colors are reliable to this level, and we call the other the magnitude-limited sample. The m*+1 sample and magnitude-limited cluster samples consist of 35 and 38 fields, respectively. At 3.6 m, the m*+1 magnitude limit corresponds to 1.1 clusters, so all fields at 1.1 are in the m*+1 subsample by construction (the values of m*+1 in this sample range from 3.6 m 19.80 mag to 21.35 mag). The higher- clusters are in the magnitude-limited subsample. Within this subsample, our 3.6 m magnitude limit is 21.4 mag for all fields, meaning we reach a different absolute magnitude limit for each field in the sample. For reference, our 3.6 m magnitude limit of 21.4 mag corresponds to an m* galaxy at = 2.1. In order to match the most possible galaxies in each field, we do not use the m*+1 value in -band as the magnitude limit. Since some galaxies will be brighter than our m*+1 limit in 3.6 m, but fainter in -band, we use the magnitude limit of our DCT observations for the -band observations regardless of the cluster candidate redshift to best identify the most possible cluster members (this allows the colors of our red sequence galaxies to range from 0.6 mag to 3.4 mag depending on the redshift for our m*+1 subsample and 3.5 mag to 5.0 mag for our magnitude-limited sample).
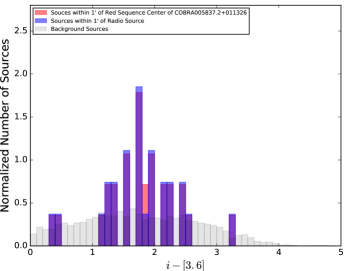
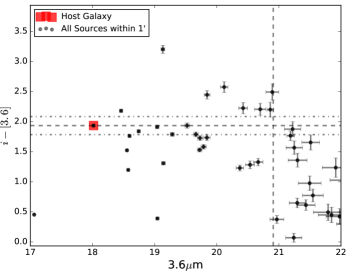
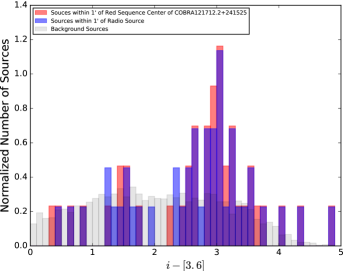
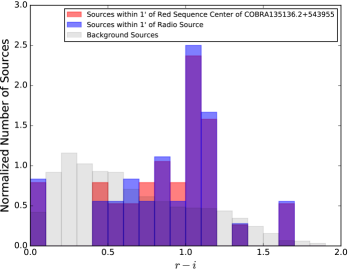
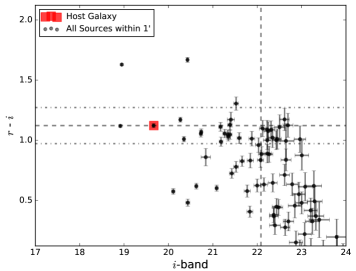
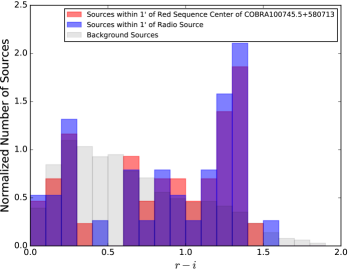
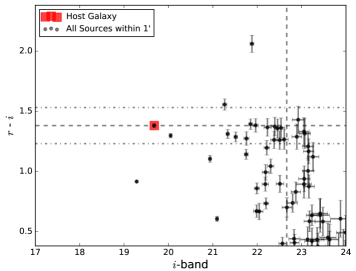
To examine the richness of red sequence galaxies relative to foreground and background interlopers, we plot histograms of galaxy color and CMDs in Figure 6. As shown in the left-hand side of Figure 6, there is a spread in the peak of galaxies relative to the background around the color of the host galaxy, although we see strong evidence for an evolved red sequence in the right-hand side of Figure 6. To minimize background/foreground contamination, and best estimate red sequence galaxies, we adopt a red sequence width of 0.15 mag, in agreement with literature (e.g., Blakeslee et al., 2003; Mei et al., 2006, 2009; Snyder et al., 2012; Lemaux et al., 2012; Cerulo et al., 2016), to estimate red sequence members. Specifically, we are using the presence of a red sequence to inform our understanding of the environments of these bent radio AGN. Our use of the 0.15 mag width accounts for the 3 detection of the typical red sequence width of 0.05 mag, which allows us to detect the full range of potential red sequence galaxies. This is explicitly shown in the right-hand side of Figure 6, where the red sequence color range is centered on the dashed horizontal line and bounded by the dot-dashed horizontal lines.
To further verify our host galaxy redshift estimates, we compare these colors to the color distribution of galaxies within 1 of the radio source to estimate the redshift of the cluster. We find that 41 of 73 fields with redshift estimates show a strong overdensity at the host color/redshift in . Of the 41 fields, three are quasar fields with spectroscopic host redshifts. The lack of a well-defined peak in color-space for some fields does not discredit those redshift estimates as our search for a peak at the color of the host is predicated on having a strong, evolved red sequence, which may not be a characteristic for all COBRA cluster candidates, especially those at higher redshifts (e.g., Krick et al., 2009; Brodwin et al., 2013; Hennig et al., 2017). Furthermore, 19 of the fields are at redshifts ( 1.4) where our observations are not sensitive enough to detect fainter red sequence galaxies (see §4.1.1 for a full description of these fields), meaning that the histograms identify only foreground structure. Although not all 19 of these fields have 3.6 m and 4.5 m observations, we find evidence for a peak in the color distribution near our host color in six of these fields with our analysis (see §4.2 for a description of this analysis).
In many of the fields where the host color doesn’t lie at a peak in the color distribution in the field, the histograms do not show a strong peak at any color, which may mean that some of these bent radio sources are not in clusters. However, in some of them, including the few fields with host galaxy photometric redshifts from SDSS in our sample, there is a peak at a bluer or redder color than our expected redshift range. This could indicate a foreground/background cluster unassociated with the radio sources and/or an error in the host redshift (i.e., the redshift of the host galaxy is incorrect, or the host is incorrectly identified). In future work, where we do a more rigorous red sequence fit, we may revisit some of these fields.
For fields without a host redshift estimate, we explore the galaxies surrounding the radio source to determine a redshift estimate. We find strong evidence for the existence of a red sequence in four COBRA clusters at 0.6 0.9 (marked in Table 3). This yields a total of 77 fields with redshift estimates, 39 in the m*+1 sample and 38 in the magnitude-limited sample.
We quantify our red sequence measurements by estimating the overdensity of red sequence galaxies relative to the background. For this analysis, we use 0.15 mag as our red sequence width. In choosing this width, we reflect a narrow range of red sequence colors needed to include most potential red sequence galaxies and mirror the uncertainty on our redshift estimates. However, we use the host color to uniformly include all fields with a redshift estimate (for the four fields with redshift estimates from color histograms, we use the color of the peak and for the quasars, we use the EzGal modeled color associated with the spectroscopic redshift). It is possible for fields where a host galaxy is intrinsically bluer or redder than other potential red sequence members that we will not identify all cluster galaxies using a set color range, especially given that the red sequence can have a non-zero slope (e.g., Brodwin et al., 2006; Eisenhardt et al., 2007; Stott et al., 2009; Cooke et al., 2016). We address how to account for these potential cluster members in §4.1.2 using imaging from the ORELSE survey (Lubin et al., 2009) to correct for populations of redder and bluer galaxies at our target redshift.
To better constrain our cluster candidate demographics, we need a background field with which to compare to. We use the overlapping area between the SpUDS and UKIDSS Ultra Deep Survey (UDS; PI O. Almaini) fields as our background field. Excluding regions with saturated stars, we construct 238 1 radius regions and determine a unique background measurement for each field to mirror the magnitude limits of each field. To create uniformity between our cluster and backgrounds measurements, we restrict the background counts to those sources with a color within 0.15 mag of the host galaxy color.
| (1) |
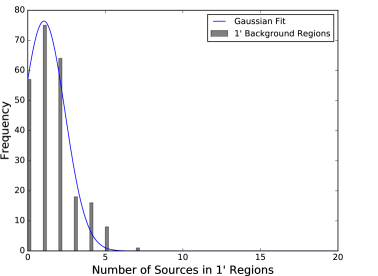
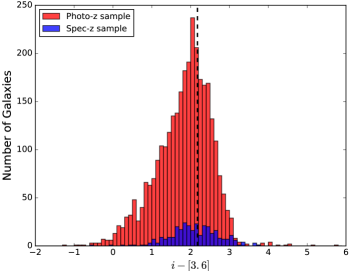
As in Galametz et al. (2012) and Paterno-Mahler et al. (2017), we find that each background distribution can be approximated by a Gaussian distribution, except for a high-density tail representing large scale structure in the field (see Figure 7). Because of this, we determine the mean and variance of our Gaussian fit by excluding this tail. Like Paterno-Mahler et al. (2017), we measure the significance of each overdensity using Equation 1, where is the significance of each red sequence cluster measurement, is the number of detected red sequence galaxies within 1 of the radio source, is the mean of the Gaussian fit to each background distribution, and is the standard deviation of the Gaussian fit to each background distribution. , N (the net number of red sequence sources, Ncounts - MGauss), and for all cluster candidates are included in Tables 4 , 8, 9 and for all fields in Table 2. Like Paterno-Mahler et al. (2017), we use the 2 cut as our lower limit for red sequence cluster candidates.
Additionally, since the mean of the Gaussian distribution for our background is less than 1.0 red sequence galaxy per 1 region (given our magnitude limits and color range) in many cases, we require at least three galaxies to be identified to be a red sequence cluster candidate. This removes fields where a two galaxy detection yields a significance exceeding 2, which occurs within our magnitude-limited sample. Given the relatively bright limits required on the luminosity of galaxies that enter into our subsamples, specifically of the magnitude-limited subsample, it is possible that at the highest-redshifts, these overdensity measurements overestimate the true strength of the detection. To compare the success of our red sequence cluster search to our random background, we measure how many of our 238 background regions are above our 2 cluster candidate threshold. We find that 5 of these background regions fall above this 2 cluster candidate threshold in the m*+1 sample, while 5 - 10 of these background regions fall above this threshold in the magnitude-limited sample.
4.1.1 Results
This red sequence analysis is the first step toward determining which high- fields host galaxy clusters. While previous works (e.g., Wing & Blanton, 2011, 2013) have analyzed bent sources in well studied photometric and spectroscopic samples at low-, only COBRA113733.8+300010 is spectroscopically confirmed (Blanton et al., 2003), and only two of the other 89 fields host confirmed cluster candidates with multi-wavelength observations (see §6.3 for a discussion of previously identified clusters within our sample). In the m*+1 sample (magnitude-limited sample), 20 of the 39 (7 of the 38) fields are red sequence cluster candidates (see Table 4). For the complete list of overdensities, see Table 2. Of these 27 fields, two are cluster candidates not previously identified in Paterno-Mahler et al. (2017) (see Table 4). Although our strongest red sequence cluster candidate has 11 red sequence galaxies when centered on the AGN, we do find, that like Cerulo et al. (2016), the expected number of galaxies based on our SpUDS-UDS background that have colors similar to those of our target red sequence is low, with most regions expecting fewer than two galaxies, based on our magnitude limits. This mean Gaussian background value is well below that reported in Paterno-Mahler et al. (2017), and only serves to strengthen the efficacy of the red sequence color cut at identifying real structures.
| Field | Redshift ()llFields with mutliple redshift estimates are due to disagreements in our EzGal photo- estimates for the different colors used. | Red Sequence Overdensity | Combined Overdensity | ||||||||||
|---|---|---|---|---|---|---|---|---|---|---|---|---|---|
| AGN Center | RS Center | AGN Center | RS Center | ||||||||||
| NaaN = The total number of red sequence members in the 1 region. | NbbN = The excess of counts in the 1 region above the background. | cc = The significance calculated using Equation 1. | NaaN = The total number of red sequence members in the 1 region. | NbbN = The excess of counts in the 1 region above the background. | cc = The significance calculated using Equation 1. | NtotalddNtotal = The total number of galaxies (red sequence, redder, and bluer) in the 1 region. | NtotaleeNtotal = The excess of galaxies in the 1 region above the combined background adjusted for the red sequence completeness fraction. | ff = The significance calculated using Equation 3. | NtotalddNtotal = The total number of galaxies (red sequence, redder, and bluer) in the 1 region. | NtotaleeNtotal = The excess of galaxies in the 1 region above the combined background adjusted for the red sequence completeness fraction. | ff = The significance calculated using Equation 3. | ||
| COBRA005837.2+011326ggFields in the m*+1 sample. | 0.71 | 6 | 5.5 | 3.6 | 7 | 6.5 | 4.3 | 28 | 4.4 | 4.0 | 27 | 4.9 | 4.4 |
| COBRA012058.9+002140ggFields in the m*+1 sample. | 0.75 | 5 | 4.2 | 2.5 | 4 | 3.2 | 1.9 | 36 | 4.4 | 3.8 | 33 | 3.6 | 3.1 |
| COBRA014741.6004706ggFields in the m*+1 sample.iiNew cluster candidates (not in Paterno-Mahler et al. (2017)) with AGN Center. | 0.60 | 5 | 4.0 | 2.0 | 5 | 4.0 | 2.0 | 23 | 3.5 | 2.8 | 23 | 3.6 | 2.9 |
| COBRA015313.0001018ggFields in the m*+1 sample.jjNew cluster candidates (not in Paterno-Mahler et al. (2017)) with just the Red Sequence Center. | 0.44 | 1 | 1.0 | 0.7 | 3 | 3.0 | 2.1 | 6 | 0.1 | 0.1 | 12 | 1.6 | 2.3 |
| COBRA074025.5+485124hhFields in the magnitude-limited sample. | 1.10 | 4 | 4.0 | 3.6 | 3 | 3.0 | 2.7 | 33 | 2.6 | 3.9 | 29 | 1.9 | 2.9 |
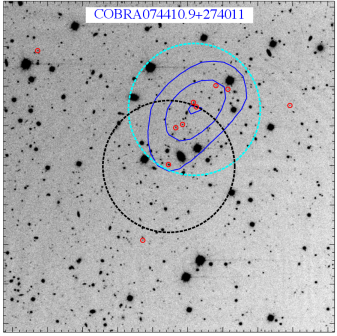
| COBRA074410.0+274011hhFields in the magnitude-limited sample. | 1.30 | 4 | 3.7 | 4.0 | 7 | 6.7 | 7.3 | 41 | 2.6 | 4.3 | 45 | 4.0 | 6.7 |
| COBRA075516.6+171457ggFields in the m*+1 sample. | 0.64 | 2 | 1.8 | 1.1 | 6 | 5.8 | 3.4 | 29 | 2.7 | 2.4 | 39 | 6.4 | 5.6 |
| COBRA100745.5+580713ggFields in the m*+1 sample. | 0.656 | 6 | 6.0 | 3.1 | 5 | 5.0 | 2.6 | 24 | 3.2 | 2.6 | 25 | 2.9 | 4.3 |
| COBRA100841.7+372513hhFields in the magnitude-limited sample. | 1.20/1.35 | 5 | 4.4 | 5.1 | 5 | 4.4 | 5.1 | 35 | 3.7 | 5.0 | 34 | 3.4 | 4.5 |
| COBRA103434.2+310352hhFields in the magnitude-limited sample. | 1.20 | 5 | 4.6 | 4.8 | 5 | 4.6 | 4.8 | 40 | 4.0 | 5.8 | 42 | 4.2 | 6.1 |
| COBRA104254.8+290719ggFields in the m*+1 sample. | 1.35/1.05 | 3 | 3.0 | 3.3 | 5 | 5.0 | 5.4 | 32 | 1.7 | 3.4 | 36 | 2.4 | 4.9 |
| COBRA113733.8+300010ggFields in the m*+1 sample. | 0.96 | 8 | 7.4 | 4.6 | 7 | 6.4 | 4.0 | 36 | 4.2 | 4.1 | 36 | 4.0 | 3.9 |
| COBRA120654.6+290742ggFields in the m*+1 sample.iiNew cluster candidates (not in Paterno-Mahler et al. (2017)) with AGN Center.kkFields that are only combined cluster candidates, not red sequence cluster candidates. | 0.85 | 2 | 1.7 | 0.9 | 3 | 2.7 | 1.4 | 30 | 30 | 3.1 | 2.4 | ||
| COBRA121712.2+241525ggFields in the m*+1 sample. | 0.90 | 11 | 10.0 | 7.3 | 12 | 11.0 | 8.1 | 46 | 7.2 | 6.2 | 45 | 7.0 | 6.1 |
| COBRA123940.7+280828ggFields in the m*+1 sample. | 0.92 | 7 | 6.0 | 3.6 | 7 | 6.0 | 3.6 | 37 | 3.5 | 2.9 | 38 | 3.8 | 3.1 |
| COBRA125047.4+142355ggFields in the m*+1 sample. | 0.90 | 5 | 4.2 | 2.5 | 5 | 4.2 | 2.5 | 32 | 3.8 | 2.9 | 36 | 4.6 | 3.5 |
| COBRA130729.2+274659hhFields in the magnitude-limited sample.jjNew cluster candidates (not in Paterno-Mahler et al. (2017)) with just the Red Sequence Center. | 1.144 | 1 | 1.0 | 0.9 | 6 | 6.0 | 5.5 | 19 | 0.4 | 0.7 | 25 | 2.9 | 4.4 |
| COBRA133507.1+132329hhFields in the magnitude-limited sample.jjNew cluster candidates (not in Paterno-Mahler et al. (2017)) with just the Red Sequence Center. | 1.25 | 2 | 3 | 3.0 | 4.5 | 21 | 0.9 | 1.7 | 22 | 1.3 | 2.5 | ||
| COBRA134104.4+055841ggFields in the m*+1 sample. | 0.90 | 3 | 2.6 | 2.2 | 3 | 2.6 | 2.2 | 19 | 2.3 | 2.2 | 22 | 2.7 | 2.6 |
| COBRA135136.2+543955ggFields in the m*+1 sample. | 0.55 | 10 | 9.9 | 6.4 | 11 | 10.9 | 7.0 | 31 | 6.4 | 6.7 | 32 | 7.0 | 7.3 |
| COBRA135838.1+384722ggFields in the m*+1 sample. | 0.81 | 1 | 0.3 | 0.2 | 4 | 3.3 | 2.4 | 21 | 1.1 | 1.1 | 28 | 2.7 | 2.6 |
| COBRA142238.1+251433ggFields in the m*+1 sample. | 1.00 | 5 | 4.3 | 2.6 | 9 | 8.3 | 5.1 | 37 | 3.7 | 3.7 | 38 | 4.8 | 4.7 |
| COBRA145023.3+340123hhFields in the magnitude-limited sample. | 1.20 | 2 | 3 | 3.0 | 3.9 | 29 | 38 | 2.6 | 5.2 | ||||
| COBRA150238.1+170146hhFields in the magnitude-limited sample. | 1.10 | 5 | 4.2 | 2.9 | 5 | 4.2 | 2.9 | 27 | 1.7 | 2.2 | 26 | 1.6 | 2.1 |
| COBRA151458.0011749ggFields in the m*+1 sample. | 0.80 | 6 | 5.0 | 3.0 | 6 | 5.0 | 3.0 | 36 | 4.8 | 4.5 | 36 | 4.8 | 4.5 |
| COBRA152647.5+554859hhFields in the magnitude-limited sample. | 1.10 | 3 | 3.0 | 4.1 | 3 | 3.0 | 4.1 | 29 | 2.1 | 3.3 | 33 | 2.5 | 4.0 |
| COBRA154638.3+364420ggFields in the m*+1 sample. | 0.939 | 3 | 1.9 | 1.4 | 6 | 4.9 | 3.5 | 23 | 1.2 | 1.1 | 23 | 2.0 | 1.9 |
| COBRA162955.5+451607ggFields in the m*+1 sample. | 0.78 | 5 | 3.8 | 2.2 | 5 | 3.8 | 2.2 | 31 | 3.4 | 3.0 | 39 | 4.8 | 4.2 |
| COBRA164551.2+153230ggFields in the m*+1 sample.kkFields that are only combined cluster candidates, not red sequence cluster candidates. | 0.65 | 2 | 1.0 | 0.7 | 3 | 2.0 | 1.4 | 17 | 1.5 | 1.4 | 18 | 2.1 | 2.0 |
| COBRA164611.2+512915ggFields in the m*+1 sample. | 0.351 | 9 | 8.7 | 8.7 | 8 | 7.7 | 7.7 | 26 | 5.3 | 8.5 | 22 | 4.5 | 7.3 |
| COBRA164951.6+310818ggFields in the m*+1 sample. | 0.52 | 4 | 4.0 | 2.3 | 4 | 4.0 | 2.3 | 18 | 2.5 | 2.8 | 17 | 2.0 | 2.3 |
| COBRA170105.4+360958ggFields in the m*+1 sample. | 0.80 | 7 | 6.0 | 4.2 | 7 | 6.0 | 4.2 | 42 | 6.4 | 5.8 | 39 | 5.9 | 5.3 |
| COBRA170614.5+243707ggFields in the m*+1 sample. | 0.71 | 8 | 7.2 | 5.2 | 9 | 8.2 | 5.9 | 41 | 6.1 | 5.5 | 39 | 5.9 | 5.3 |
| COBRA171330.9+423502ggFields in the m*+1 sample.iiNew cluster candidates (not in Paterno-Mahler et al. (2017)) with AGN Center. | 0.698 | 4 | 4.0 | 2.0 | 2 | 2.0 | 1.0 | 19 | 1.9 | 1.5 | 17 | 1.0 | 0.8 |
| COBRA172248.2+542400hhFields in the magnitude-limited sample. | 1.45/1.25 | 3 | 3.0 | 4.7 | 3 | 3.0 | 4.7 | 29 | 1.5 | 2.2 | 30 | 1.6 | 2.4 |
| COBRA221605.1081335ggFields in the m*+1 sample. | 0.70 | 5 | 4.4 | 3.2 | 4 | 3.4 | 2.4 | 23 | 2.7 | 2.1 | 21 | 2.2 | 1.9 |
| COBRA232345.9+002925ggFields in the m*+1 sample.iiNew cluster candidates (not in Paterno-Mahler et al. (2017)) with AGN Center.kkFields that are only combined cluster candidates, not red sequence cluster candidates. | 0.73 | 3 | 2.2 | 1.7 | 3 | 2.2 | 1.7 | 22 | 2.2 | 2.1 | 26 | 2.4 | 2.3 |
We present only the number of detected sources in Table 2 for the 19 fields at 1.4 because our sensitivity in the color is insufficient for a statistical analysis. We do likewise for the five fields which appear to be red sequence cluster candidates, but which have fewer than three red sequence galaxies. Setting aside such fields, we find 27 of the 53 remaining fields have strong red sequences at or above the 2 threshold. Several of the remaining fields have red sequence significances between 1 and 2 (see Table 5), including 13 cluster candidates in Paterno-Mahler et al. (2017) that are not red sequence cluster candidates despite being in our statistically analyzed sample. It is possible that these are either less massive galaxy groups, poorer clusters, or clusters with larger star forming populations.
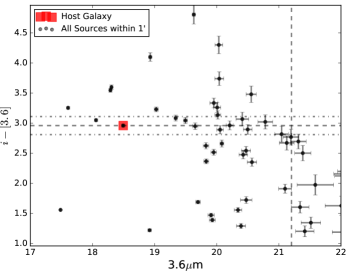
In examining our CMDs, we find that the vast majority of our AGN host galaxies are among the brightest red sequence galaxies (see the right-hand side of Figure 6). Although most host galaxies are at least 1.0 mag brighter than an m* galaxy, many do not appear to be proto-BCGs. Because centering our search region on the AGN implicitly requires the AGN to be at the cluster center, and thus a proto-BCG, that we see host galaxies that do not appear to be the BCG likely means that these sources are not always at the cluster center, even under the ideal assumption that the BCG is situated in the center of of its parent cluster.
| Sample | Cluster Candidates | Non-Cluster Candidates | ||
|---|---|---|---|---|
| 2 | 0 | 0 1 | 1 2 | |
| m*+1 | 20 | 1 | 12 | 6 |
| magnitude-limitedaaThis excludes the 19 fields in the magnitude-limited sample for which we are unable to accurately measure a background value. We also exclude the five fields for which we are not confident in the red sequence overdensity based on having a measurement above 2 for fewer than three red sequence members. | 7 | 3 | 2 | 2 |
| subsample | 4 | 6 | 6 | 4 |
| subsample | 8 | 0 | 5 | 1 |
4.1.2 Statistical Analysis & Combined Overdensity
Since the current COBRA data set lacks spectroscopic verification and our photometric redshift estimates are made solely based on red sequence colors, it is possible that we are identifying interloping galaxies that have the same photometric color, but are not at the redshift we estimate via EzGal. Additionally, some fraction of galaxies that do not fall within our red sequence range are at our target redshift. To correct our measurements to better account for all potential cluster galaxies, we statistically analyze our sample and our color cuts to estimate what fraction of the galaxies that we identify are within our expected redshift range (0.10) of the host galaxy’s redshift. To do this, we take advantage of data from the Observations of Redshift Evolution in Large Scale Environments (ORELSE) survey. ORELSE is a spectroscopic and photometric survey designed to examine the effects of galaxy environment at high- (0.5 1.4) by examining the structure out to 10 Mpc around 20 known clusters at 0.6 (Lubin et al., 2009; Lemaux et al., 2018; Hung et al., 2019). The high quality spectroscopic data ( 100 - 500 confirmed members per structure) and the deep photometric observations have been used to identify high- structures beyond those it was intended to study (e.g., Gal et al., 2008; Lemaux et al., 2018).
Although ORELSE spans 5 square degrees, for our analysis, we use the data presented in Hung et al. (2019) for four ORELSE fields; SC1604, SC0910, SC0849, and CL1137 (which overlaps with COBRA113733.8+300010, the spectroscopically confirmed cluster from Blanton et al. (2003)). These fields were chosen because they have confirmed structures at both the low- and high- ends of the COBRA redshift range and are among the fields with the most comprehensive spectroscopic samples in ORELSE. One of the strengths of the ORELSE photometric data is the extensive number of bands with deep observations. Additionally, the ORELSE photometric redshifts are based on multi-band optical to mid-IR SED fitting as opposed to our single or multi-color estimates (Hung et al., 2019).
To compare to the COBRA sample, we take advantage of the similar wavebands covered by both surveys. All ORELSE fields were observed with IRAC 3.6 m and 4.5 m, and each has fainter magnitude limits than our COBRA fields. However, while every field has coverage with some variation on the -band filter, not every field contains sufficient observations with an SDSS-like -band. Additionally, for those fields that do have an SDSS-like -band, they are generally much shallower and narrower than these observations in other -band variations (Hung et al., 2019). To combat this problem and thus allow for us to compare our sample to the largest possible statistical sample, we convert the ORELSE and bands into an SDSS-like -band using a transformation similar to that discussed in Gal et al. (2008) and shown below (Equation 2).
| (2) |
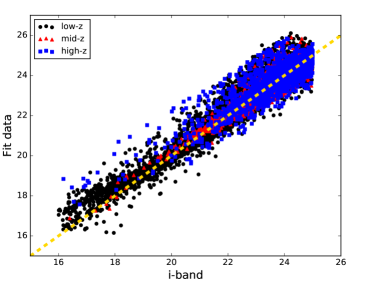
To do the conversion, we treat A, B, and C as free parameters that we fit to our data using a minimization. We first convert I+ to Ic using a similar version of Equation 2 and then convert the data to an SDSS-like -band. To reduce the scatter in the measurements and our fitting, we divide our sample into three fiducially estimated redshift bins, 0 0.85, 0.85 1.2, and 1.2 (See Figure 8). This reduces the noticeable amount of scatter at fainter magnitudes. We find that a simple magnitude cut did not impact the scatter. To measure the statistical dispersion of this transformation, we measure the normalized median, absolute deviation and find rather small values for each sample set (0.18 mag for the low- sample, 0.16 mag for the mid- sample, and 0.20 mag for the high- sample). We applied this same correction to all fields of comparison.
With the transformed ORELSE data, we can estimate the fraction of red sequence, bluer, and redder galaxies that are in a given redshift range to determine correction factors for our measurements. We apply each individual COBRA magnitude limit to create a unique ORELSE data set for each COBRA field. To estimate the fraction of red sequence galaxies that have our expected redshift, we remove sources without photometric or spectroscopic redshifts to create 77 unique samples with all the galaxies within the red sequence color range for each field. To properly sample the ORELSE data, we randomly sample the data set 1,000 times and measure the fraction of fields that fall within the 0.1 of our redshift estimate. Although we see general agreement between the ORELSE photometric and spectroscopic samples, because of the large difference in sample size, we follow the values derived from the ORELSE photometric sample. We find that between 35 - 55 of red ORELSE galaxies have the redshift we expect from our EzGal models (See the left-hand panel of Figure 9). The complete list of expected red sequence fractions is found in Table 6.
To verify that we are looking in the correct color range for a given redshift, we plot the color distribution of all ORELSE galaxies within 0.1 of our redshift estimate and find that out to 1.2 the host color is at or near the peak of the color distribution (see the right hand panel of Figure 9). When we examine ORELSE galaxies at 1.3, we find that the peak is generally bluer than our host color, which follows typical cluster galaxy evolution because red sequence early-type galaxies are not always the dominant population at high-. It should be noted that this methodology treats each ORELSE galaxy individually. It is possible that if we accounted for the spatial clustering of galaxies of a similar color, these values may be higher.
For all of our fields, ORELSE galaxies exceed both the red and blue limits of the red sequence color selection range (an example is shown in the right-hand side of Figure 9. While significantly bluer galaxies may be AGN or actively forming stars, the width, specifically slightly blueward of the host galaxy color likely results from the natural slope in the red sequence leading to a population of slightly bluer galaxies still at our target redshift. Similar to how we estimate the fraction of red sequence galaxies at the target redshift, we also measure what fraction of galaxies at each target redshift are bluer or redder than the COBRA red sequence range. The bluer and redder subsets are made by using the same COBRA magnitude cuts for each field and identifying ORELSE galaxies bluer than our minimum red sequence color and redder than our maximum red sequence color. From these bluer and redder samples of ORELSE galaxies, we find that 15 - 20 of the bluer ORELSE galaxies and 10 - 15 of the redder ORELSE galaxies typically lie within our redshift range, with the fraction of bluer galaxies decreasing with redshift (see Table 6 for the complete list of fractions).
The goal of using the ORELSE data is to correct our overdensity measurements to account for the fraction of red sequence galaxies that are at our target redshift and account for redder and bluer galaxies that are at the target redshift. In doing this, we can account for some of the slightly bluer galaxies we miss by assuming the red sequence has no slope. We quantify our new overdensity measurement by determining a combined overdensity that factors in the number of red sequence galaxies, redder, and bluer galaxies above our background distribution (again measured using unique versions of the combined SpUDS and UDS fields for each COBRA field). The combined overdensity measurement (Equation 3) is an expansion of the original overdensity measurement (Equation 1), and fully accounts for the completeness fraction of the COBRA red sequence measurements, as well as the populations of redder and bluer galaxies measured using the ORELSE data (see Table 7 for the complete list of values).
| (3) |
In the combined overdensity, NRS is the number of red sequence galaxies in the 1 region, MRS is the mean of the Gaussian distribution of the red sequence background, and is the standard deviation of the Gaussian fit of the background red sequence distribution. These three values are identical to those in Equation 1. NB is the number of bluer galaxies, MB is the mean of the Gaussian distribution of bluer galaxies, and is the standard deviation of the Gaussian fit for the background bluer galaxies. The versions with the “R” subscript represent the same components, but for the redder galaxies. We use the same physical background regionss for the bluer and redder galaxies our red sequence backgrounds. fRS, fB, and fR are the fraction of red sequence, bluer, and redder galaxies that fall within 0.1 of the cluster redshift estimate (see Table 6 for the complete list of values). To verify that our redder and bluer backgrounds also follow a Gaussian distribution, we checked the values of the median, 16th, and 84th percentile and find strong agreement with our Gaussian fit. Like our previous red sequence overdensities, we require at least three red sequence galaxies for a given field to be a combined overdensity cluster candidate.
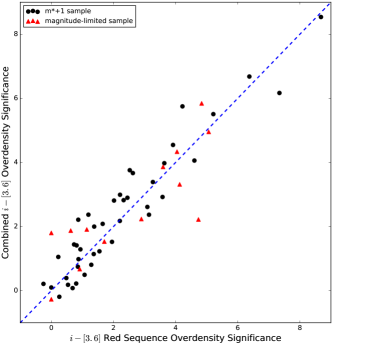
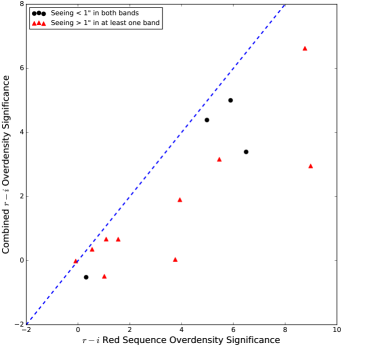
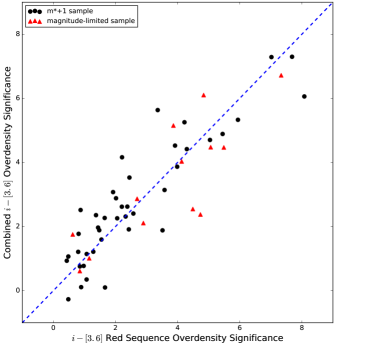
As shown in Figure 10, the two overdensity measurements have a linear relationship, with the combined overdensity giving a similar value to the red sequence overdensity. The nearly one-to-one trend between the red sequence signficance and combined overdensity significance strengthens our confidence in the detection of our COBRA red sequence clusters because clusters should also be overdense, even if just slightly, in the number of non-red galaxies relative to the field.
Since the initial COBRA overdensity measurements from Paterno-Mahler et al. (2017) did not account for galaxy color, these combined overdensities allow us to further characterize the fractions of bluer and redder cluster galaxies and better estimate which fields are the strongest cluster candidates. In total, we identify 20 combined cluster candidates in the m*+1 sample and 7 in the magnitude-limited sample. Of these fields, one is not a red sequence cluster candidate, although it has a 1.7 overdensity in just the red sequence measurement. However, one red sequence cluster candidate does fall below the 2 threshold for the combined overdensity. Overall, the similarity between these two measurements further strengthens our confidence that our red sequence detections are, in fact, real cluster candidates.
4.2 Analysis Results
A 0.15 mag color cut can efficiently identify high- ( 1.2) galaxies, including red sequence and star forming galaxies (e.g., Papovich, 2008; Wylezalek et al., 2014; Cooke et al., 2015). Due to the effectiveness of this cut, and the bimodal nature of this color-redshift distribution at low-, we apply this color cut to the 20 fields at 1.2 within our sample with these observations. Although this cut is an excellent identifier of high- galaxies, our measurements are hindered by the limiting magnitude of our images, 21.4 mag in both bands, which corresponds to an EzGal modeled m* galaxy at = 2.1 in 3.6 m and an m* galaxy at = 2.25 in 4.5 m.
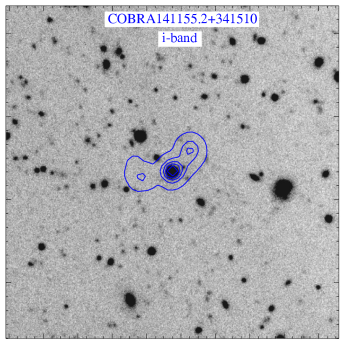
With the color cut, and the SpUDS 3.6 m and 4.5 m combined images as our background, we identify four of the highest-redshift cluster candidates in the COBRA survey above the 2 significance (see Table 8; for the overdensities of the remaining fields, see Table 2). Two of the cluster candidates are not identified in §4.1.1 or Table 4 as they are at 1.4. The other two cluster candidates are identified by our red sequence analysis. However, each cluster candidate is identified in Paterno-Mahler et al. (2017).
| Field | Redshift ()iiFields with mutliple redshift estimates are due to disagreements in our EzGal photo- estimates for the different colors used. | Red Sequence Overdensity | Combined Overdensity | ||||||||||
|---|---|---|---|---|---|---|---|---|---|---|---|---|---|
| AGN Center | RS Center | AGN Center | RS Center | ||||||||||
| NaaN = The total number of red sequence members in the 1 region. | NbbN = The excess of counts in the 1 region above the background. | cc = The significance calculated using Equation 1. | NaaN = The total number of red sequence members in the 1 region. | NbbN = The excess of counts in the 1 region above the background. | cc = The significance calculated using Equation 1. | NtotalddNtotal = The total number of galaxies (red sequence and bluer) in the 1 region. | NtotaleeNtotal = The excess of galaxies in the 1 region above the combined background adjusted for the red sequence completeness fraction. | ff = The significance calculated using a slightly altered version of Equation 3 (without the redder term). | NtotalddNtotal = The total number of galaxies (red sequence and bluer) in the 1 region. | NtotaleeNtotal = The excess of galaxies in the 1 region above the combined background adjusted for the red sequence completeness fraction. | ff = The significance calculated using a slightly altered version of Equation 3 (without the redder term). | ||
| COBRA072805.2+312857ggFields that are cluster candidates with the AGN center, but not identified in Table 4. | 1.75 | 22 | 12.2 | 3.3 | 19 | 9.2 | 2.5 | 47 | 7.9 | 3.6 | 46 | 6.2 | 2.9 |
| COBRA100841.7+372513 | 1.20/1.35 | 21 | 11.2 | 3.0 | 25 | 15.2 | 4.1 | 39 | 6.8 | 3.1 | 40 | 9.0 | 4.1 |
| COBRA103256.8+262335ggFields that are cluster candidates with the AGN center, but not identified in Table 4. | 2.18 | 18 | 8.2 | 2.2 | 17 | 7.2 | 1.9 | 34 | 5.0 | 2.3 | 31 | 4.3 | 2.0 |
| COBRA104254.8+290719 | 1.35/1.05 | 21 | 11.2 | 3.0 | 22 | 12.2 | 3.3 | 41 | 7.0 | 3.2 | 44 | 7.7 | 3.5 |
| COBRA121128.5+505253hhFields that are cluster candidates with just the high- galaxy center, but not the AGN center or in Table 4. | 1.364 | 15 | 5.2 | 1.4 | 20 | 10.2 | 2.7 | 41 | 3.9 | 1.7 | 45 | 6.7 | 3.1 |
| COBRA141155.2+341510hhFields that are cluster candidates with just the high- galaxy center, but not the AGN center or in Table 4. | 1.818 | 12 | 2.2 | 0.6 | 18 | 8.2 | 2.2 | 39 | 2.2 | 1.0 | 37 | 5.2 | 2.4 |
| COBRA222729.1+000522hhFields that are cluster candidates with just the high- galaxy center, but not the AGN center or in Table 4. | 1.513 | 11 | 1.2 | 0.3 | 20 | 10.2 | 2.7 | 34 | 1.3 | 0.6 | 45 | 6.7 | 3.1 |
4.2.1 Statistical Analysis & Combined Overdensity
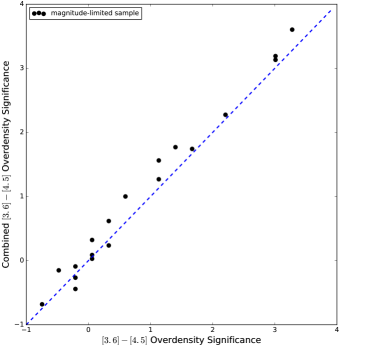
Like our analysis in §4.1.2, we again use data from the ORELSE sample to estimate what fraction of ORELSE galaxies that fall within our given color range are within our redshift range. Although ORELSE is designed to go out to 1.4 (Lubin et al., 2009), the number of galaxies with photometric redshifts is roughly flat out to 1.8 (with 20,000 galaxies per redshift bin with z = 0.1), thus allowing us to estimate the fraction of high- ORELSE galaxies that are within our color range ( 0.15) for the majority of the COBRA sample. Given that number of high- ORELSE galaxies decreases at redshifts similar to where we approach the COBRA magnitude limit, we treat the ORELSE sample as a representative sample. Since the ORELSE data set contains both bands, no transformations are necessary. Using a similar methodology to the analysis, we measure the fraction of ORELSE galaxies with -0.15 at 1.2, as well as the fraction of bluer galaxies at 1.2. Given the well-studied nature of this color cut, it is not surprising that we find that 58.1 of galaxies in this range are at 1.2, while only 6.4 of bluer galaxies are at this redshift range, further reinforcing the effectiveness of this color cut. Like the red sequence analysis, we see a tight correlation between the two measurements (see Figure 11 and Table 7 for the complete list of combined overdensities). This trend is likely due to the small fraction of bluer high- galaxies, with both methodologies (red sequence and combined overdensity) identifying the same four high- cluster candidates.
4.3 Analysis Results
To further explore the m*+1 sample, we analyze the 14 fields with - and -band observations at 1.0, the m*+1 magnitude limit for our -band images. Although we have - and -band observations for fields at higher-redshifts, the m*+1 limit and the redshifted wavelength of the 4000 Å break falling outside of this color range at 0.91 lead to our focus on the m*+1 sample. To again evaluate the spread in our red sequence galaxies, we plot histograms and CMDs (see Figure 12). Unlike the histograms, we see a large bluer distribution at 0.9 mag due to foreground stars and galaxies. Based on this blue peak and the nature of the color-redshift trend (see Figure 4) and in agreement with the literature for high- cluster red sequences (e.g., Blakeslee et al., 2003; Mei et al., 2006, 2009; Snyder et al., 2012; Lemaux et al., 2012; Cerulo et al., 2016), we estimate the red sequence width as 0.15 mag, identical to that of our analysis.
Since there is no UDS -band image, we take advantage of the large FOV on our DCT observations taken with the LMI to create a composite background measurement. From our 21 fields with observations in both bands and an average seeing less than 12, we create a composite background region for each field made up of 252 1 regions. Like in our analysis, we create a unique background for each of the 14 fields from the same regions.
We find that 8 of our 14 fields are red sequence cluster candidates (see Table 9; for the complete list of overdensities, see Table 2). Of these eight fields, seven were identified as cluster candidates with the color, which further confirms our prior findings. The only addition is COBRA075516.6+171457, which is one of the strongest candidates in , but has a 1.1 overdensity measurement in . This discrepancy may be due to the differing angular resolution of the LMI and IRAC. In our DCT image, we see one galaxy surrounded by smaller satellites, while in our image, the BCG is blended with these satellites. This removes potential red sequence galaxies from the analysis and artificially lowers the overdensity (and impacts the host color).
| Field | Redshift () | Red Sequence Overdensity | Combined Overdensity | ||||||||||
|---|---|---|---|---|---|---|---|---|---|---|---|---|---|
| AGN Center | RS Center | AGN Center | AGN Center | ||||||||||
| NaaN = The total number of red sequence members in the 1 region. | NbbN = The excess of counts in the 1 region above the background. | cc = The significance calculated using Equation 1. | NaaN = The total number of red sequence members in the 1 region. | NbbN = The excess of counts in the 1 region above the background. | cc = The significance calculated using Equation 1. | NtotalddNtotal = The total number of galaxies (red sequence, redder, and bluer) in the 1 region. | NtotaleeNtotal = The excess of galaxies in the 1 region above the combined background adjusted for the red sequence completeness fraction. | ff = The significance calculated using Equation 3. | NtotalddNtotal = The total number of galaxies (red sequence, redder, and bluer) in the 1 region. | NtotaleeNtotal = The excess of galaxies in the 1 region above the combined background adjusted for the red sequence completeness fraction. | ff = The significance calculated using Equation 3. | ||
| COBRA005837.2+011326 | 0.71 | 9 | 7.2 | 3.9 | 10 | 8.2 | 4.5 | 39 | 3.1 | 1.9 | 39 | 3.3 | 2.0 |
| COBRA012058.9+002140 | 0.80 | 19 | 15.3 | 5.9 | 17 | 13.3 | 5.1 | 68 | 9.6 | 5.0 | 68 | 8.9 | 4.6 |
| COBRA075516.6+171457ggFields that are not identified as cluster candidates in Table 4 with the radio source center. | 0.64 | 12 | 9.3 | 5.0 | 14 | 11.3 | 6.0 | 46 | 5.4 | 4.4 | 52 | 6.3 | 5.1 |
| COBRA100745.5+580713 | 0.656 | 14 | 12.2 | 6.5 | 14 | 12.2 | 6.5 | 40 | 4.4 | 3.4 | 41 | 4.6 | 3.6 |
| COBRA113733.8+300010 | 0.96 | 13 | 9.1 | 3.8 | 10 | 6.1 | 2.5 | 55 | 0.1 | 0.0 | 59 | 0.4 | 0.2 |
| COBRA121712.2+241525 | 0.90 | 28 | 13.4 | 5.5 | 17 | 12.4 | 5.1 | 78 | 6.8 | 3.2 | 79 | 6.8 | 3.1 |
| COBRA135136.2+543955 | 0.55 | 16 | 13.9 | 9.0 | 17 | 14.9 | 9.6 | 36 | 3.4 | 3.0 | 38 | 3.8 | 3.3 |
| COBRA135838.2+384722ggFields that are not identified as cluster candidates in Table 4 with the radio source center. | 0.81 | 4 | 0.2 | 0.1 | 10 | 5.8 | 2.3 | 44 | 0.0 | 0.0 | 68 | 5.4 | 3.1 |
| COBRA164611.2+512915 | 0.351 | 18 | 16.3 | 8.8 | 16 | 14.3 | 7.7 | 26 | 5.5 | 6.6 | 23 | 4.7 | 5.6 |
4.3.1 Statistical Analysis & Combined Overdensity
Following our analysis of the fraction of ORELSE red sequence galaxies that lie within our target redshift range for the analysis, we perform a similar analysis using the ORELSE data for our analysis. Like with the SDSS-like -band, not all ORELSE fields have available or expansive SDSS-like -band observations. Thus, we convert the RC to an SDSS-like -band using identical methodology as IC to -band (see Equation 2). We again test the statistical dispersion of this sample using the normalized median, absolute deviation and find small values, showing the strength of the fit (0.15 mag for the low- sample, 0.14 mag for the mid- sample, and 0.17 mag for the high- sample). Using the shifted ORELSE - and -band data, we measure the fraction of ORELSE galaxies that are red sequence, redder, or bluer galaxies and use this information to measure a combined overdensity (Equation 3). These completeness fraction values are generally slightly below the values (see Table 6 for the complete list).
Unlike the strong one-to-one trend between the red sequence overdensity significance and the combined overdensity significance (see Figure 10 and Table 7 for the complete table of combined overdensities), the red sequence overdensity significance appears to be significantly offset from it’s combined counterpart (see Figure 13). In examining the overdensity values and the CMDs, the major discrepancy appears to arise in lack of bluer galaxies measured relative to what is expected from our background. By dividing the subsample by the seeing, we highlight that fields with better seeing are somewhat closer to the one-to-one trend, especially at higher overdensities. For the fields where this discrepancy is the largest, we visually inspected the DCT images and our histograms of the individual level of completeness for each field. We find that our -band images generally have worse sky conditions and slightly worse seeing than our best fields used to create the background. Additionally, the magnitude limit of these -band images is closer to the peak in completeness than for our fields taken with worse seeing. As a result, the number of faint blue galaxies relative to the expected background is greatly diminished for these fields. This demonstrates that the variability in sky conditions impacts our confidence in the analysis and further emphasizes why we treat it as a supplemental measurement relative to the red sequence analysis. An alternative explanation is that at lower redshifts, specifically where the the color is most effective, cluster populations are far more distinct from the field populations, with significantly fewer bluer galaxies at bright magnitudes. Since we don’t factor in a specific cluster population to our ORELSE analysis, we may be weighting our measurement too heavily toward the bluer galaxies in this color, making our statistics less valid.
5 Determining the Cluster Center and Re-Evaluating Cluster Candidates
As discussed in Sakelliou & Merrifield (2000), bent, double-lobed radio sources need not reside in the center of galaxy clusters. As evidenced by our CMDs (see Figure 6 and Figure 12), not all of our host galaxies are BCGs, allowing for the possibility that some are fast-moving galaxies on cluster outskirts. Since clusters hosting bent, double-lobed radio sources are found in merging and relaxed clusters, bent sources may be farther offset from the cluster center. Thus, unlike the previous overdensity measurements (discussed in §4 and in Paterno-Mahler et al. (2017)), we should not automatically assume the bent AGN is located at the cluster center. To more accurately locate each COBRA cluster candidate, we evaluate the 2D spatial distribution of all surrounding galaxies in color space, specifically looking for galaxies at similar colors to the host galaxy. By identifying a cluster center based on red sequence galaxies, we should be able to better trace the true cluster center for relaxed clusters because this center has the strongest correlation with the X-ray cluster center (e.g., Rumbaugh et al., 2018).
In this section, we measure the surface density of red sequence sources to better estimate cluster centers. From these new centers, we re-measure both the red sequence overdensity and the combined overdensity to identify additional red sequence COBRA cluster candidates. We measure the surface density within our and DCT images by counting all sources of the target color within a 10 radius of each point in a regular grid of 10 spacing imposed on the image. At this grid spacing, there is double-counting of sources due to the overlap of search radii. However, the overall shape of the density distribution is unaffected, especially after the image is smoothed, as described below.
To determine a new cluster center, we smooth the surface density images using a Gaussian kernel. Then, we determine where the peak overdensity is relative to the radio source, assigning higher weight to sources closer to the radio source to avoid identifying other structures. Thus, each new cluster center is the location of the peak overdensity of our red sequence galaxies in a given field. Since our composite images are 5 5, it is possible that the highest density peak could be offset by as much as 3 from the radio source ( 1.4 Mpc at = 1.0). We follow Sakelliou & Merrifield (2000), who found that the majority of their wide-angle tail radio sources are offset from the cluster center by 300 kpc, although one radio source is offset by 1.6 Mpc. Given that the average redshift of COBRA clusters is 1.0, 300 kpc is 06. For this reason, in the few cases with multiple density peaks and no obvious strongest peak, we select the closer peak as the cluster center. We note that we in no way limit our offset to 06, but use the result from Sakelliou & Merrifield (2000) to keep our offsets on reasonable galaxy cluster scales.
Although some of the fields change their center minimally, a new “central” location was chosen for each field based on the surface density of red sequence galaxies. These positions are noted in Table 2. However, we stress that although this technique allows us to identify regions of peak density, most density structures do not encompass the entire 1 radius circular region. Because of this, for some fields, the overall overdensity is slightly lower when centered on the most overdense region because we lose a galaxy or two located on the edge of the 1 search region.
5.1 Analysis Results
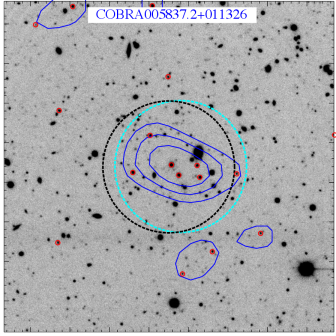
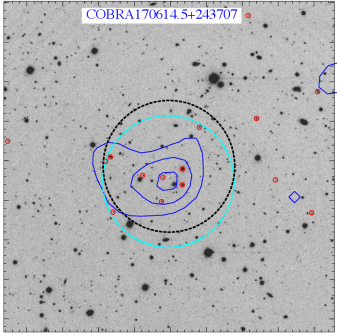
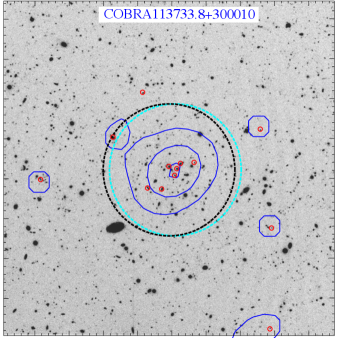
We measure the surface density of red sequence cluster galaxies in for the 39 m*+1 fields and the 38 magnitude-limited fields (see Figure 14 for examples of the red sequence surface density measurements). From our newly determined cluster centers, we estimate the red sequence overdensity using identical background statistics to §4.1. We identify 22 fields in the m*+1 sample and 10 fields in the magnitude-limited sample that are red sequence cluster candidates (see Table 4; for the complete list of overdensities and new cluster centers, see Table 2).
Of the 32 red sequence cluster candidates we identify with the new cluster centers, seven are not identified in the analysis when centered on the radio source, and three are newly identified cluster candidates increasing the total number of COBRA cluster candidates to 195 (See Table 4). Since we had previously only done single-band overdensity measurements, the identification of new red sequence cluster candidates that are not overdense at the 2 level based on the observations may be indicative of a population of smaller, red galaxy groups that may be underdense and potentially offset from the bent radio source. Each of these newly identified red sequence cluster candidates is also a cluster candidate via the combined overdensity, further emphasizing the importance of accounting for galaxy color.
Of the newly detected cluster candidates using the new red sequence center, two are fields with two red sequence galaxies detected when centered on the AGN. Two other new red sequence cluster candidates, COBRA135838.1+384722 and COBRA154638.3+364420, highlight the necessity of determining an offset between the bent, double-lobed radio source and the galaxy cluster center because each is a cluster candidate in Paterno-Mahler et al. (2017) based on 3.0 overdensities in the 2 search region centered on the radio source. By moving to our new cluster centers, these fields become red sequence cluster candidates. Another new red sequence cluster candidate is COBRA075516.6+171457, identified in , which we note in §4.3 has a host galaxy that is blended due to the resolution of . Because of this, the cluster center identified in Table 2 may be inaccurate, although the galaxies identified are real.
Despite the increase in the number of cluster candidates, five m*+1 fields and two magnitude-limited fields show a slight decrease in the number of detected sources with this method (see Table 2 for the fields which show a slight decrease in overdensity), including two AGN centered red sequence cluster candidates. Since the average difference is 1.1 sources, this is likely due to non-central red galaxies falling outside of the 1 circular region with our new center or asymmetric distributions of red sequence cluster galaxies.
Like in §4.1.2, we also re-measure the combined overdensity using identical background statistics. We identify 24 combined overdensity cluster candidates in the m*+1 sample and ten combined overdensity cluster candidates in the magnitude-limited sample. This sample includes both the newly identified red sequence cluster candidates as well as the one new field (COBRA120654.6+290742 at 0.85). When we compare the new red sequence overdensity to the combined overdensity (see Figure 15), we find a bit more scatter than when centered on the AGN, but still an agreement between the two measurements. The differences likely factor from our new cluster center being chosen based specifically on the overdensity of red sequence galaxies, and not a weighted distribution of redder and bluer galaxies. The strong similarity between the two measurements still emphasizes the similar rate at which each measurement identifies cluster candidate fields.
5.2 Analysis Results
For the 20 fields at 1.2 with colors, six show evidence for cluster candidacy based on our color surface density analysis (see Table 8; for the complete list of overdensities and new cluster centers, see Table 2). Of these six, three are new cluster candidates (one AGN centered cluster candidate falls just below the 2 threshold using this method). All three new color cluster candidates (1.3 1.85) are cluster candidates identified in Paterno-Mahler et al. (2017) and are quasars. Interestingly, one of these fields, COBRA121128.5+505253, has just two red sequence sources and a significance above 2 that we choose not to report because of our three red sequence galaxy criterion. This overlap lends some validity to the strength of that measurement. We measure a slight decrease in seven fields ( 1.3 sources on average) due to sources at the edge of our search region. A discussion of the cross-correlation between central positions for fields in and can be found in §6.
When we measure the combined overdensity, we again find a strong one-to-one relation between the two overdensity measurements (see Figure 16). All six shifted red sequence cluster candidates are identified as combined overdensity cluster candidates, as is the field that dips just below the cluster candidate threshold.
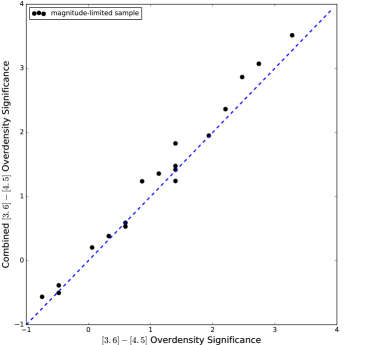
5.3 Analysis Results
For the 14 fields at 1.0 with analysis (see §4.3 for an explanation of the fields and field parameters chosen), we find nine fields are cluster candidates based on our red sequence surface density analysis (see Table 9; for the complete list of overdensities and new cluster centers, see Table 2). Five fields show a slight decrease in the number of detected sources ( 2.0 sources on average) due to the change of the edge region. Since all fields in the sample are in the sample, we discuss the correlation of cluster center and overdensity in §6. When we measure the combined overdensity using these new red sequence cluster centers, we find, that like in Figure 13, there exists a similar amount of scatter and a large offset from the one-to-one linear relations (see Figure 17), again reinforcing that the differences in the two values for our analysis are likely symptomatic of the image quality or our underlying assumptions overvaluing blue galaxies.

6 Discussion
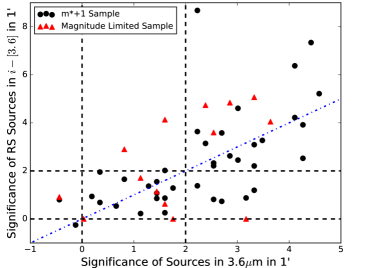
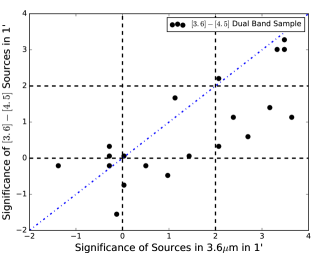
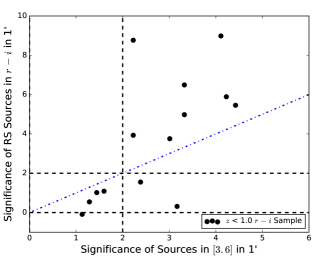
In §6.1, we compare our color-based cluster significance estimates to those of Paterno-Mahler et al. (2017). We base this comparison on our analysis centered on the COBRA AGNs to ensure identical search regions to those of Paterno-Mahler et al. (2017). In §6.2, we examine the impact of using cluster centers derived from the galaxy distributions as described in §5. We discuss the likelihood of cluster mis-identification in §6.3. Finally, we compare COBRA to other high- cluster searches in §6.4.
6.1 Comparing Overdensity measurements
6.1.1 Comparisons to 3.6 m overdensities
The original COBRA overdensity measurements are single-band IRAC 3.6 m measurements, with no color component. The additional optical photometry allows us to determine which galaxies are potential red sequence members and thus improve our understanding of the systems that host bent, double-lobed radio sources. Figure 18 compares the 3.6 m overdensity estimates from Paterno-Mahler et al. (2017) to our color-selected AGN centered overdensities for COBRA fields common to both works. Although the two estimates generally agree, Figure 18 highlights that for clusters detected at 3 in Paterno-Mahler et al. (2017), the color selection is more effective at identifying the strongest cluster candidates than the single-band measurement. Although not shown, a similar trend exists between our combined overdensities and our overdensities.
The red sequence color cut effectively removes foreground and background contaminants, better highlighting the cluster candidates. This can be seen particularly well in the magnitude-limited sample, where six of the seven cluster candidates exceed their counterparts, likely due to the removal of the numerous lower-redshift galaxies that lie along the line of sight.
Although there is a strong one-to-one trend, some fields that are not red sequence clusters are cluster candidates in Paterno-Mahler et al. (2017). Some of these fields are cluster candidates based on the 2 search region, while others lack a redshift estimate. However, four of these fields have between a 1 and 2 red sequence overdensity in . As noted before, the lack of a 2 red sequence measurement does not remove a cluster candidate detection. There are many clusters lacking large populations of red sequence members, and as such, the fields that are cluster candidates based on the 3.6 m observations are also included as cluster candidates. Additionally, some of these fields may have inaccurate redshift estimates caused by bluer or redder host galaxies than our EzGal models predict, especially if the host galaxy’s colors are affected by an AGN component.
Since the goal of this analysis is to uniformly identify red sequence populations in these fields, we treat the red sequence as having no intrinsic slope. Doing so allows us to measure a red sequence population for fields that might not host cluster candidates, but also may remove some potential red sequence galaxies that are slightly bluer than our color range, which could diminish some of the red sequence overdensities, especially if the slope is coupled with a redder host galaxy. The population of fainter, slightly bluer galaxies, can be seen if we examine the CMDs of the strongest red sequence cluster candidates. In future work, we plan to thoroughly study the red sequence populations of our strongest cluster candidates to account for this.
Figure 19 compares the and color-derived overdensity estimates to those of Paterno-Mahler et al. (2017). For sample, on average, the cluster measurements are more significant when using the 3.6 m galaxy density as the sole criterion than the measurement (Figure 19, left panel). Because the color cut is a well-studied and effective selection criteria, that our 3.6 m selection generally yields a greater overdensity for these fields is surprising. It is possible that the high- nature of these fields and the IR bands used in these images combine yielding a higher fraction of galaxies in our background being at high- as opposed to our and color cuts which isolate only a small fraction of the total galaxies detected. Additionally, the relative bright magnitude limits required on the luminosity of galaxies relative to an m* galaxy at high- means that we can only detect a small fraction of the highest-redshift galaxies.
By contrast, in the right panel of Figure 19, the color cut has a comparable efficiency to the 3.6 m overdensity. Like our color cut, above 3, the color cut is far more effective than the single-band measurement. The similarity between the effectiveness of these two red sequence color cuts likely stems from the similar selection methods in terms of isolating red sequence galaxies. That we see a similar trend in both the and red sequence analyses emphasizes that our strongest overdensities ( 3) generally indicate strong red sequence cluster candidates, which can help further prioritize fields to observe as we continue the optical campaign (See Figure 1).
6.1.2 Comparing our Color Selections to One Another
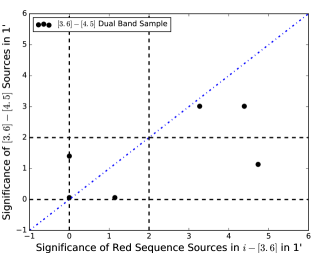
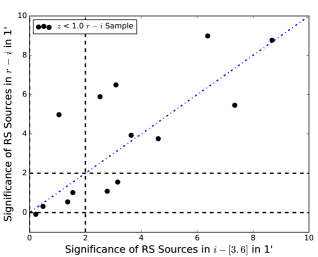
We compare our color-based overdensity measurements to each other to estimate the reliability of each color cut. Since we only have six overlapping fields with and , we cannot make any definitive statements on trends between these two colors. We note that two of the three red sequence cluster candidates in the overlapping sample are cluster candidates based on our and analysis (see Figure 20). This may imply similar detection levels of galaxies with these two color cuts. The other cluster candidate lies below the line of unity and is one of the magnitude-limited sample where the mean background value is nearly zero and thus the three galaxies detected may yield a slightly inflated red sequence overdensity significance.
For the 14 fields with and shown in the right side of Figure 20, we see a roughly linear trend with a large degree of scatter. Although one point is due to the blended host in COBRA075516.6+171457 (see §4.3), the remaining scatter may be due to poor seeing for some of our -band observations (as discussed in §4.3.1), since 6 of the 14 -band images have seeing worse than 12. Additionally, based on the measured fractions of red sequence galaxies at the expected redshifts, the level of red sequence contamination is higher for the color, thus resulting in greater foreground/background contamination, which may impact these measurements. Although not shown, we see a similar amount of scatter when we compare the combined overdensities, especially for the fields with poorer seeing. Overall, these results show how similarly each color identifies high- cluster candidates, specifically within the redshift ranges of our analysis. This strengthens our confidence in combining our color analysis to show that 39 of the 77 fields with redshift estimates are red sequence cluster candidates.
We measure a total of 42 combined overdensity and red sequence cluster candidates with redshift estimates. The additional fields from the combined overdensities generally have three or four red sequence members, with less than a 2.5 measurement. While these still might be cluster candidates, the lack of red sequence 2 overdensities and the relatively small number of red sequence members makes us less confident in these additional fields. In our strongest red sequence overdensities, we see extended populations of red galaxies brighter than m* with populations of fainter bluer and redder galaxies (as seen in our CMDs; see Figure 6 and Figure 12), similar to what is expected of a cluster or group, which we do not see in all of these fields.
6.2 Comparing Cluster Center Offsets and Color Surface Density Profiles
6.2.1 Measuring the Offset from the Cluster Center
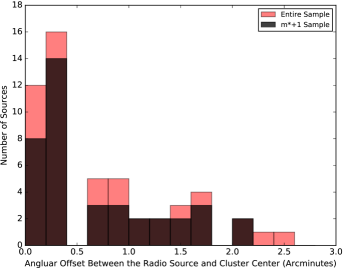
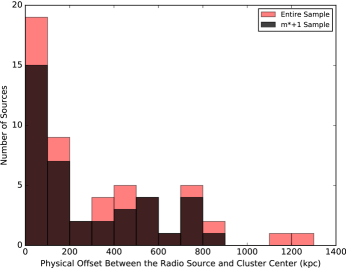
Sakelliou & Merrifield (2000) find that the majority of their wide-angle tail radio sources are offset by less than 300 kpc from the cluster center (with a few sources at greater offsets, and one source offset by 1.6 Mpc). We find a similar distribution for our sources. In the analysis shown in Figure 21, 24 of 39 m*+1 fields and 6 of 14 magnitude-limited fields that we can determine a significance of are offset by less than 300 kpc from our cluster centers determined by the surface density of red sequence galaxies. Given this measured offset and the correlation between red sequence cluster center and true cluster center in relaxed clusters (e.g., Rumbaugh et al., 2018), we find that many of our bent, double-lobed radio sources have either fallen through the cluster center or are infalling near the cluster center. Additionally, when we examine our CMDs, we find that our host galaxies are generally brighter than m* 1.0, although they are not always BCGs. When these host magnitudes are coupled with the measured offset, it allows for the possibility that our bent AGN need not be found in the center of clusters.
When we measure the offset using our analysis, we find a similar trend; 10 of 14 are fields offset by less than 300 kpc. However, this trend is not as strong in , where 11 of 20 sources are offset by greater than 300 kpc. As the subsample represents some of the highest-redshift cluster candidates in COBRA, and the fraction of unrelaxed clusters increases with increasing redshift, this offset may be because the red sequence cluster galaxies do not trace the true cluster center as accurately in unrelaxed clusters (Rumbaugh et al., 2018). Physically, this larger offset could also be the result of these high- bent sources infalling into the cluster center for the first time. However, this offset may result from our single color cut as opposed to a specific color range, since the color range aims to identify red sequence members, as opposed to any high- galaxies ( 1.2). Between the color cut and the high- nature of each field in the subsample, our cluster centers may be subject to more contamination and uncertainty using the dual-band analysis.
6.2.2 Comparing Color Cluster Centers and Surface Density Profiles
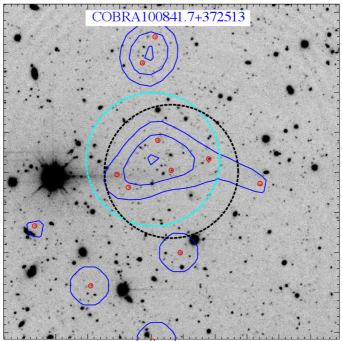
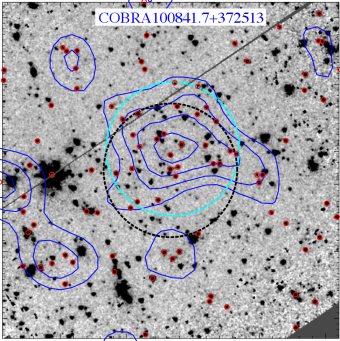
To compare the effectiveness of our independent color cuts at identifying similar galaxies in a given cluster, and thus determining similar cluster centers, we compare our limited overlapping sample. For the six fields with and analyses, we find that four of the fields are offset from one another by less than 05 ( 220 kpc). The fields with larger cluster center differences may result from the low number of detected sources in the analysis; each field has less than three detected red sequence galaxies in , leading to more uncertainty. Additionally, some of the differences may result from the color cut identifying red sequence galaxies and the color cut identifying all high- galaxies. Since clusters are not limited to our 1 radial region, the larger offset does not preclude these color cuts from identifying the same structures. Additionally, as highlighted in the combined analysis and the statistical analysis with the ORELSE data, a larger fraction of the redder and bluer galaxies in are actually at the target redshift, than the bluer galaxies in . Since the color cut does a better job of identifying high- galaxies and we expect larger populations of bluer galaxies at high-, this may further explain the offsets and differences in structure. As we continue to study COBRA fields, we will further address how these different color cuts compare to one another.
An example of a comparison between the and analysis is shown in Figure 22, which shows COBRA100841.7+372513, one of the strongest red sequence cluster candidates in and in the magnitude-limited sample. Although we see a slight offset between the cluster centers ( 170 kpc), these methods identify three of the same galaxies in the inner 1 region of the central region, as well as four other sources in the FOV. Of the sources not detected in both color cuts, many result from either being below our magnitude limit in -band, as is evident by comparing the two images, or fall outside of the color range in the other color. Despite using different color cuts, we identify shared high- cluster galaxies between the two colors.
We find a similar level of agreement in our new cluster centers between our and analyses, with eight of the cluster centers being offset by less that 06 ( 300 kpc) and an additional low- cluster candidate offset by 400 kpc (though it is offset by 1). This likely results from both colors identifying red sequence galaxies. Of the fields with offsets greater that 1, two have significances 1, which increases the degree of uncertainty in the central position of the distribution of galaxies. Additionally, two other fields are more offset; one is at 0.351 (COBRA164611.2+512915, which is the field offset by 400 kpc), where large angular sizes yield much smaller distances, and the other has a known blending issue with the BCG, thus increasing the error in a color estimated center (COBRA075516.6+171457). It is also worth noting that the large separation between potential centers for COBRA135838.1+384722 ( 1 Mpc), likely implies two distinct structures associated with the radio source.
For most of the fields, the difference in the position between the and cluster centers relative to the overall size of clusters is small, which implies both colors detect the same sources. Figure 23 shows COBRA121712.2+241525, one of the strongest red sequence candidates in both and . The two red sequence color ranges identify five shared galaxies in the central region based on the [3.6] analysis and identify cluster centers almost identical to one another (offset by 150 kpc). The majority of sources detected in one color but not another are either below the -band magnitude limit, or are blended sources in our image. Additionally, both pick up sources of a similar color to east of the bent AGN, which may imply that this is some kind of infalling subcluster or filament. The similarity between the different color cuts further strengthens our resolve that these methods identify similar cluster galaxies.
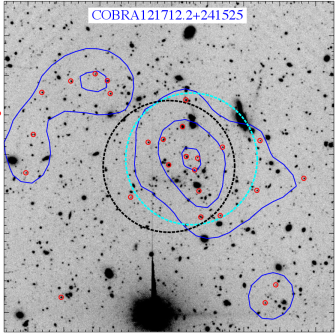
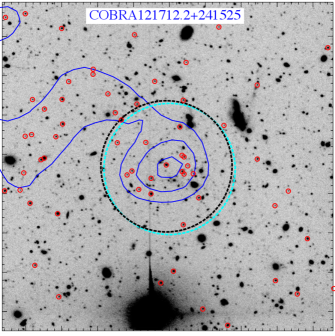
6.3 Determining Potential Cluster Contamination and Identifying Previously Detected Clusters
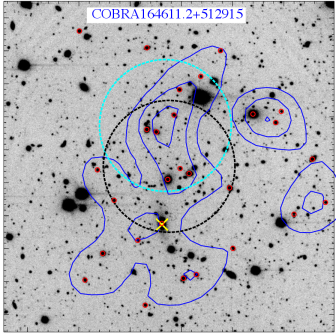
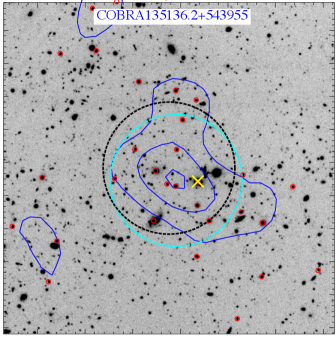
To strengthen our confidence that we are detecting real overdensities rather than random alignments of galaxies, we measure the fraction of , , and background regions that are above our 2 limit and the average separation between these fields. The separation in 1 regions between our various background regions is an approximation of the spacing between the original AGN centered search region and our new red sequence surface density centered search region. In our analysis, 5 of our background regions are above 2 for the m*+1 sample, while 5 - 10 of background regions are above 2 in the magnitude-limited sample. The average separation between 2 overdensities in these background regions is 15 in the m*+1 sample and 13 in the magnitude-limited sample. In our analysis, 4 of background regions are at the 2 level and the average distance between 2 regions is 16. Although we are not able to measure the mean spacing between 2 regions for our background, 6 - 12 of background regions are above the 2 threshold. We identify well above 10 of our COBRA fields as cluster candidates ( 67 for , 35 for , and 64 for ) and most fields are offset less than 1 from the radio source, far less than the mean separation between 2 background regions in all of our samples. These factors strengthen our confidence that we are not identifying random line of sight alignments of galaxies.
To verify that we are not identifying low- clusters, we measure the distance between each radio source and the nearest redMaPPer cluster (Rykoff et al., 2014) and search the NASA/IPAC Extragalactic Database (NED) archive for all clusters within 6 of the radio source (the maximum distance a cluster center could be offset from our AGN and still be in our image based on the AGN being the center of our 12 12 DCT LMI images). In comparing our cluster coordinates to those of redMaPPer v6.3, we find that COBRA164611.2+51915 ( 0.35) is the only COBRA cluster in redMaPPer (with an offset of 089), while 4 other fields include redMaPPer clusters within 10. Of these fields, none overlap with our cluster centers. From our NED search, we find some fields have at least one low- cluster within 6 of the radio source. To verify that we aren’t detecting low- contaminants, we compare our new cluster centers to these low- clusters for all fields. Only two fields show a slight overlap between 1 radial regions centered on the new cluster center and the NED cluster, while the vast majority are significantly offset. Additionally, only one field has a low- cluster within 2 of the radio source. As a result of this search, we find that two of our cluster candidates, COBRA135136.2+543955 ( 0.55) and COBRA164611.2+512915 ( 0.35; also in redMaPPer), are previously identified clusters (both redshift estimates agree with our measurements). Interestingly, in both clusters, the bent radio source is offset by more than 05 from the reported cluster center (056 for COBRA135136.2+543955 and 089 for COBRA164611.2+512915 - the same location as the redMapper identification). These results are encouraging as we continue to search for overdensities offset from the radio source.
We compare the positions of our cluster centers with the locations reported in NED for these fields and find that our locations are slighty offset from the reported values ( 03 for COBRA135136.2+543955 and 15 for COBRA164611.2+512915; See Figure 24). The major difference between are center locations comes down to how we identify cluster centers. We estimate the cluster center based on the overall distribution of all red sequence galaxies. We do not bias ourselves to the BCG or proto-BCG. However, the NED and redMaPPer center values are all the location of the BCG, creating the difference. Although our centers are offset from the BCG, the fact that our host galaxy in these clusters is not the BCG strengthens our decision to not treat the radio source as the cluster center. Additionally, the low- nature of both sources may allow for more non-cluster contaminants based on our color criteria.
6.4 Comparing COBRA to Other High- Galaxy Cluster Surveys
Using a similar method of AGN targeting, Wylezalek et al. (2013) find that 55.3 of CARLA RLAGN are in overdense cluster environments. When CARLA fields are analyzed with identical methodology to COBRA, Paterno-Mahler et al. (2017) find that 44 of CARLA sources and 29 of COBRA bent, double-lobed radio sources are in overdense cluster environments ( 2). Although we only examine a small and biased sample of COBRA with our new measurements of the cluster center and red sequence galaxies, we add four cluster candidates not previously identified in Paterno-Mahler et al. (2017) to the COBRA cluster candidate sample (the other 35 red sequence cluster candidates were all identified using the 3.6 m analysis in Paterno-Mahler et al. (2017) or using the red sequence analysis centered on the radio source), thus increasing the number of cluster candidates to 195 of 646, or 30. Since we find these four fields in the 77 with redshift estimates that we analyze in this work, we might expect to find an additional 30 fields that are cluster candidates in the entire sample. However, given that our sample of optical fields was selected based on stronger IRAC overdensities presented in Paterno-Mahler et al. (2017) (see Figure 1), and in general our red sequence overdensity scales linearly with overdensity, if we assume a 30 field increase as an upper limit for the entire COBRA sample, we expect 210 cluster candidates. Thus, addressing the offset in cluster position with respect to the AGN could account for some of the difference between CARLA and COBRA’s ability to detect high- cluster candidates described in §1 and Paterno-Mahler et al. (2017).
Furthermore, Cooke et al. (2015) report the significance of their 37 high- cluster candidates with their 3.6 m and 4.5 m observations and find that most are above 3, with the highest being 6.3. This is in contrast with our seven cluster candidates found using our analysis (see Table 8), where four of the seven are between 2 and 3 and the maximum overdensity is 4.1. As noted, these differences likely result from COBRA on average finding less massive cluster candidates than CARLA and CARLA observations reaching a fainter completeness limit and thus being more sensitive to high- clusters.
Although CARLA is one of the largest AGN targeting cluster surveys, our methodology shares many similarities with other large scale cluster surveys. The Massive and Distant Clusters of Survey (MaDCoWS), which covers the entire sky, has found at least 11 1 spectroscopically confirmed clusters by searching for rich overdensities of IR galaxies with and (e.g., Stanford et al., 2014; Gonzalez et al., 2015). With further optical observations from Pan-STARRS and the SuperCOSMOS Sky survey, Gonzalez et al. (2018) identify 2683 MADCoWS cluster candidates at 0.7. These massive clusters have a median redshift of 1.0 (Gonzalez et al., 2018), thus covering a similar redshift range to our sample. Additionally, Moravec et al. (2018) undertake a pilot study of 10 1.0 MaDCoWS clusters with extended radio sources and find sources offset between 0 and 1 from their centers. Although their methodology for determining cluster centers differs from our own, the similarity between this result and ours measured offset between the radio source and the cluster center highlights that radio sources can be offset from high- cluster centers.
Beyond MaDCoWS, the IRAC Shallow Cluster Survey (ISCS) explored the 8.5 square degree Boötes field using a mixture of optical and observations. Unlike this COBRA analysis, ISCS identifies clusters using photometric redshifts of all galaxies regardless of SED type to do wavelet analysis on galaxy density maps (Eisenhardt et al., 2008). ISCS reaches similar magnitude limits in their optical and IR observations to COBRA (=21.935 for ISCS compared to 21.4 mag in COBRA; ISCS is complete for an L* galaxy at 1.3 in -band, which is approximately the same depth as COBRA in -band). Of the 335 ISCS galaxy cluster candidates, 106 are at 1.0 (Eisenhardt et al., 2008), while 36 of 146 (with redshift estimates) COBRA galaxy cluster candidates are at 1.0. We find 24.7 of cluster cadidates are at 1.0 in COBRA as compared to 26.7 in ISCS. Thus, both surveys find higher- clusters at a similar rate. Since there are still 49 COBRA cluster candidates without redshift estimates, this number should rise, bringing the rate of high- clusters in COBRA closer to or beyond that of ISCS.
To further characterize our local red sequence surface density measurements discussed in §5 and shown in Figure 14, we measured the local surface density of ISCS J1432+3332 ( = 1.11). ISCS J1432+3332 was one of the first spectroscopically confirmed clusters at 1.0 and was observed as part of the FLAMINGOS Extragalactic Survey (Elston et al., 2006), the NAOA Deep Wide-Field Survey (Brown et al., 2003), and ISCS (Eisenhardt et al., 2008). It has a weak-lensing mass of M200 = 4.9 1014 M⊙ (Jee et al., 2011). Using an identical analysis for the Spitzer observations and a magnitude limit of 23.1 mag (Vega magnitudes) in -band, we find a similar distribution of red sequence galaxies to our own cluster candidates (Figure 25). For comparison, we show the same 5 5 FOV. We find similar results for the ISCS fields as for our COBRA fields, with ISCS fields showing an excess of galaxies near, but slightly offset from, their IRAC centroid (the 1 radius dashed black circle is centered on the IRAC centroid). The similarity between our cluster candidates and ISCS confirmed high- galaxy clusters solidifies our use of the surface density measurements to identify high- clusters.
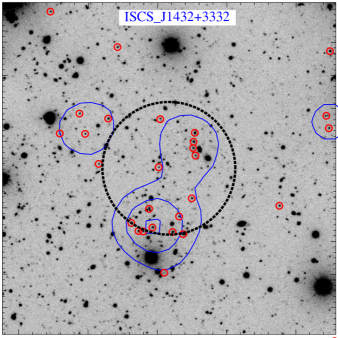
The XMM-Large Scale Structure (XMM-LSS) survey also explores a similar range of redshifts to COBRA. XMM-LSS detects clusters in a 9 square degree field by identifying extended X-ray sources and comparing them to optical/IR observations to look for an excess of all sources as well as red sources. Using the XMM-LSS, Willis et al. (2013) find nine spectroscopically confirmed clusters at 0.8 1.2 and 11 cluster candidates with photometric redshifts at 0.8 2.2. The XMM-LSS cluster finding method requires a high surface density of red sources within each cluster, similar to our work. We note that Willis et al. (2013) find that although many of their clusters have developed red sequences consistent with passive evolution, a subset of clusters have bluer red sequences, implying differences in the high- stellar population. Additionally, Willis et al. (2013) estimate a range of cluster masses of 6 to 1 , as opposed to the more massive clusters reported for the MaDCoWS sample (Brodwin et al., 2015). This mass range makes the XMM-LSS survey clusters similar to the lower-mass end expected in the COBRA survey because bent-sources are not a mass-biased cluster tracer.
O’Brien et al. (2018) more recently examine the environment of 46 bent-tail radio galaxies using the 86 square degree -South Pole Telescope deep field. Of their 46 sources, only 16 have known redshifts. Of these, four are associated with clusters, all of lower mass ( 3.75 1014 M). Although O’Brien et al. (2018) do not identify any high-mass clusters hosting bent sources, their sample is small and the area of the sky covered is much smaller than the area probed by the COBRA survey. In contrast to these results, COBRA contains 646 bent, double-lobed radio sources, and based on our overdensity measurements, we find both low- and high-mass cluster candidates.
7 Conclusion
This is the second in a series of COBRA papers and the first introducing our optical follow-up observations. For the 646 COBRA fields, 195 of which are cluster candidates, we use our new DCT - and - band imaging to measure photometric redshifts for 77 COBRA fields. Of these 77 fields with redshift estimates, 26 are new redshift estimates for COBRA fields, allowing us to better determine the redshift distribution of COBRA sources in the universe. By combining these redshift estimates with our determinations of which fields are cluster candidates, we increase the number of COBRA cluster candidates with redshift estimates from 125 to 146. More importantly, we explore the idea that bent, double-lobed radio sources need not live at the cluster center by measuring the surface density of red sequence galaxies across the entire field. This allows us to identify which bent, double-lobed radio sources live in clusters and which clusters appear to host evolved red sequence galaxies. Additionally, we use the surface density of red sequence galaxies to estimate new cluster centers, further showing that these bent AGN need not reside at the center of clusters. Through this red sequence analysis, we identify 39 red sequence cluster candidates, the most likely clusters within our sample. We analyze these overdensities by accounting for the fraction of red sequence galaxies at our target redshift and find general agreement between our red sequence overdensities and our combined overdensities, which further strengthens our confidence that high- bent, double-lobed radio sources reside in overdense clusters with populations of red sequence galaxies.
To further understand these cluster candidates, we will continue exploring the positional offset between the radio source and the cluster center with respect to the geometry of the radio source in future work. We will further this work by analyzing the overall distribution of red sequence galaxies to analyze cluster morphology as well as estimate red sequence slopes and populations.
References
- Abell (1958) Abell, G. O. 1958, ApJS, 3, 211
- Andreon et al. (2014) Andreon, S., Newman, A. B., Trinchieri, G., et al. 2014, A&A, 565, A120
- Becker et al. (1994) Becker, R. H., White, R. L., Helfand, D. J., & Zoonematkermani, S. 1994, ApJS, 91, 347
- Bertin & Arnouts (1996) Bertin, E., & Arnouts, S. 1996, A&AS, 117, 393
- Blakeslee et al. (2003) Blakeslee, J. P., Franx, M., Postman, M., et al. 2003, The Astrophysical Journal, 596, L143
- Blanton (2000) Blanton, E. L. 2000, PhD thesis, COLUMBIA UNIVERSITY
- Blanton et al. (2001) Blanton, E. L., Gregg, M. D., Helfand, D. J., Becker, R. H., & Leighly, K. M. 2001, AJ, 121, 2915
- Blanton et al. (2000) Blanton, E. L., Gregg, M. D., Helfand, D. J., Becker, R. H., & White, R. L. 2000, ApJ, 531, 118
- Blanton et al. (2003) —. 2003, AJ, 125, 1635
- Blanton et al. (2015) Blanton, E. L., Paterno-Mahler, R., Wing, J. D., et al. 2015, in IAU Symposium, Vol. 313, Extragalactic Jets from Every Angle, ed. F. Massaro, C. C. Cheung, E. Lopez, & A. Siemiginowska, 315–320
- Brodwin et al. (2006) Brodwin, M., Brown, M. J. I., Ashby, M. L. N., et al. 2006, ApJ, 651, 791
- Brodwin et al. (2011) Brodwin, M., Stern, D., Vikhlinin, A., et al. 2011, ApJ, 732, 33
- Brodwin et al. (2013) Brodwin, M., Stanford, S. A., Gonzalez, A. H., et al. 2013, ApJ, 779, 138
- Brodwin et al. (2015) Brodwin, M., Greer, C. H., Leitch, E. M., et al. 2015, ApJ, 806, 26
- Brown et al. (2003) Brown, M. J. I., Dey, A., Jannuzi, B. T., et al. 2003, ApJ, 597, 225
- Bruzual & Charlot (2003) Bruzual, G., & Charlot, S. 2003, MNRAS, 344, 1000
- Burns (1990) Burns, J. O. 1990, AJ, 99, 14
- Burns et al. (1996) Burns, J. O., Ledlow, M. J., Loken, C., et al. 1996, ApJ, 467, L49
- Castignani et al. (2014) Castignani, G., Chiaberge, M., Celotti, A., Norman, C., & De Zotti, G. 2014, ApJ, 792, 114
- Cerulo et al. (2016) Cerulo, P., Couch, W. J., Lidman, C., et al. 2016, MNRAS, 457, 2209
- Coogan et al. (2018) Coogan, R. T., Daddi, E., Sargent, M. T., et al. 2018, MNRAS, 479, 703
- Cooke et al. (2015) Cooke, E. A., Hatch, N. A., Rettura, A., et al. 2015, MNRAS, 452, 2318
- Cooke et al. (2016) Cooke, E. A., Hatch, N. A., Stern, D., et al. 2016, ApJ, 816, 83
- Cucciati et al. (2014) Cucciati, O., Zamorani, G., Lemaux, B. C., et al. 2014, A&A, 570, A16
- Demarco et al. (2010) Demarco, R., Wilson, G., Muzzin, A., et al. 2010, ApJ, 711, 1185
- Douglass et al. (2011) Douglass, E. M., Blanton, E. L., Clarke, T. E., Randall, S. W., & Wing, J. D. 2011, ApJ, 743, 199
- Edwards et al. (2010) Edwards, L. O. V., Fadda, D., & Frayer, D. T. 2010, ApJ, 724, L143
- Eisenhardt et al. (2007) Eisenhardt, P. R., De Propris, R., Gonzalez, A. H., et al. 2007, ApJS, 169, 225
- Eisenhardt et al. (2008) Eisenhardt, P. R. M., Brodwin, M., Gonzalez, A. H., et al. 2008, ApJ, 684, 905
- Elston et al. (2006) Elston, R. J., Gonzalez, A. H., McKenzie, E., et al. 2006, ApJ, 639, 816
- Fazio et al. (2004) Fazio, G. G., Hora, J. L., Allen, L. E., et al. 2004, ApJS, 154, 10
- Gal et al. (2008) Gal, R. R., Lemaux, B. C., Lubin, L. M., Kocevski, D., & Squires, G. K. 2008, The Astrophysical Journal, 684, 933
- Galametz et al. (2012) Galametz, A., Stern, D., De Breuck, C., et al. 2012, ApJ, 749, 169
- Gladders & Yee (2000) Gladders, M. D., & Yee, H. K. C. 2000, AJ, 120, 2148
- Gonzalez et al. (2015) Gonzalez, A. H., Decker, B., Brodwin, M., et al. 2015, ApJ, 812, L40
- Gonzalez et al. (2018) Gonzalez, A. H., Gettings, D. P., Brodwin, M., et al. 2018, ArXiv e-prints, arXiv:1809.06820
- Hatch et al. (2014) Hatch, N. A., Wylezalek, D., Kurk, J. D., et al. 2014, MNRAS, 445, 280
- Hennig et al. (2017) Hennig, C., Mohr, J. J., Zenteno, A., et al. 2017, MNRAS, 467, 4015
- Hung et al. (2019) Hung, D., Lemaux, B. C., Gal, R. R., et al. 2019, arXiv e-prints, arXiv:1905.09298
- Jee et al. (2011) Jee, M. J., Dawson, K. S., Hoekstra, H., et al. 2011, ApJ, 737, 59
- Krick et al. (2009) Krick, J. E., Surace, J. A., Thompson, D., et al. 2009, ApJ, 700, 123
- Lemaux et al. (2012) Lemaux, B. C., Gal, R. R., Lubin, L. M., et al. 2012, ApJ, 745, 106
- Lemaux et al. (2018) Lemaux, B. C., Tomczak, A. R., Lubin, L. M., et al. 2018, arXiv e-prints, arXiv:1812.04624
- Lubin et al. (2009) Lubin, L. M., Gal, R. R., Lemaux, B. C., Kocevski, D. D., & Squires, G. K. 2009, The Astronomical Journal, 137, 4867
- Mancone & Gonzalez (2012) Mancone, C. L., & Gonzalez, A. H. 2012, PASP, 124, 606
- Massey et al. (2013) Massey, P., Dunham, E. W., Bida, T. A., et al. 2013, in American Astronomical Society Meeting Abstracts, Vol. 221, American Astronomical Society Meeting Abstracts #221, 345.02
- McGee et al. (2009) McGee, S. L., Balogh, M. L., Bower, R. G., Font, A. S., & McCarthy, I. G. 2009, MNRAS, 400, 937
- Mei et al. (2006) Mei, S., Blakeslee, J. P., Stanford, S. A., et al. 2006, The Astrophysical Journal, 639, 81
- Mei et al. (2009) Mei, S., Holden, B. P., Blakeslee, J. P., et al. 2009, The Astrophysical Journal, 690, 42
- Melchior et al. (2015) Melchior, P., Suchyta, E., Huff, E., et al. 2015, MNRAS, 449, 2219
- Moravec et al. (2018) Moravec, E., Gonzalez, A. H., Stern, D., et al. 2018, arXiv e-prints, arXiv:1812.01052
- Muzzin et al. (2013) Muzzin, A., Wilson, G., Demarco, R., et al. 2013, ApJ, 767, 39
- Muzzin et al. (2009) Muzzin, A., Wilson, G., Yee, H. K. C., et al. 2009, ApJ, 698, 1934
- O’Brien et al. (2018) O’Brien, A. N., Norris, R. P., Tothill, N. F. H., & Filipović, M. D. 2018, MNRAS, 481, 5247
- O’Donoghue et al. (1993) O’Donoghue, A. A., Eilek, J. A., & Owen, F. N. 1993, ApJ, 408, 428
- Owen & Rudnick (1976) Owen, F. N., & Rudnick, L. 1976, ApJ, 205, L1
- Papovich (2008) Papovich, C. 2008, ApJ, 676, 206
- Paterno-Mahler et al. (2017) Paterno-Mahler, R., Blanton, E. L., Brodwin, M., et al. 2017, ApJ, 844, 78
- Paterno-Mahler et al. (2013) Paterno-Mahler, R., Blanton, E. L., Randall, S. W., & Clarke, T. E. 2013, ApJ, 773, 114
- Proctor (2006) Proctor, D. D. 2006, ApJS, 165, 95
- Roettiger et al. (1996) Roettiger, K., Burns, J. O., & Loken, C. 1996, ApJ, 473, 651
- Rumbaugh et al. (2018) Rumbaugh, N., Lemaux, B. C., Tomczak, A. R., et al. 2018, MNRAS, 478, 1403
- Rykoff et al. (2014) Rykoff, E. S., Rozo, E., Busha, M. T., et al. 2014, ApJ, 785, 104
- Sakelliou & Merrifield (2000) Sakelliou, I., & Merrifield, M. R. 2000, MNRAS, 311, 649
- Shimakawa et al. (2018) Shimakawa, R., Koyama, Y., Röttgering, H. J. A., et al. 2018, MNRAS, 481, 5630
- Sifón et al. (2016) Sifón, C., Battaglia, N., Hasselfield, M., et al. 2016, MNRAS, 461, 248
- Snyder et al. (2012) Snyder, G. F., Brodwin, M., Mancone, C. M., et al. 2012, The Astrophysical Journal, 756, 114
- Stanford et al. (2014) Stanford, S. A., Gonzalez, A. H., Brodwin, M., et al. 2014, ApJS, 213, 25
- Stark (2016) Stark, D. P. 2016, ARA&A, 54, 761
- Stott et al. (2009) Stott, J. P., Pimbblet, K. A., Edge, A. C., Smith, G. P., & Wardlow, J. L. 2009, MNRAS, 394, 2098
- Tody (1993) Tody, D. 1993, in Astronomical Society of the Pacific Conference Series, Vol. 52, Astronomical Data Analysis Software and Systems II, ed. R. J. Hanisch, R. J. V. Brissenden, & J. Barnes, 173
- Willis et al. (2013) Willis, J. P., Clerc, N., Bremer, M. N., et al. 2013, MNRAS, 430, 134
- Wilson et al. (2009) Wilson, G., Muzzin, A., Yee, H. K. C., et al. 2009, ApJ, 698, 1943
- Wing & Blanton (2011) Wing, J. D., & Blanton, E. L. 2011, AJ, 141, 88
- Wing & Blanton (2013) —. 2013, ApJ, 767, 102
- Wylezalek et al. (2013) Wylezalek, D., Galametz, A., Stern, D., et al. 2013, ApJ, 769, 79
- Wylezalek et al. (2014) Wylezalek, D., Vernet, J., De Breuck, C., et al. 2014, ApJ, 786, 17
| Host Coordinates | DCT | Spitzer | |||||||
|---|---|---|---|---|---|---|---|---|---|
| Field | RA | DEC | DateaaAll dates are given as year/month/day in UT time and refer to the dates of the DCT observations. | Exp | Seeing | Exp | Seeing | Exp 3.6 m | Exp 4.5 m |
| (s) | () | (s) | () | (s) | (s) | ||||
| COBRA003447.7002137 | 00 34 48.07 | 00 21 32.0 | 13/11/03 | 3 600 | 1.3 | 4 100 | 4 100 | ||
| COBRA005837.2+011326 | 00 58 37.03 | +01 13 27.8 | 15/10/08 | 3 600 | 1.4 | 3 600 | 1.3 | 4 100 | 4 100 |
| COBRA010329.5+004055ccQuasar Fields | 01 03 29.40 | +00 40 55.2 | 15/10/10 | 4 900 | 1.2 | 3 900 | 1.3 | 4 100 | 4 100 |
| COBRA012058.9+002140 | 01 20 58.87 | +00 21 41.7 | 13/11/04 | 4 600 | 0.8 | 4 600 | 0.8 | 7 30 | |
| COBRA014147.2092812 | bbNo host coordinate is identified in Paterno-Mahler et al. (2017). | bbNo host coordinate is identified in Paterno-Mahler et al. (2017). | 15/10/10 | 3 600 | 1.5 | 3 600 | 1.1 | 7 30 | |
| COBRA014741.6004706 | 01 47 41.73 | 00 47 08.5 | 15/10/09 | 3 900 | 1.3 | 3 600 | 1.5 | 7 30 | |
| COBRA015313.0001018 | 01 53 12.96 | 00 10 19.9 | 13/11/04 | 4 600 | 0.8 | 7 30 | |||
| COBRA020823.8011536 | 02 08 23.30 | 01 15 48.9 | 15/10/11 | 3 900 | 0.8 | 3 900 | 0.8 | 7 30 | |
| COBRA025059.6+001241 | 02 50 59.76 | +00 12 39.2 | 13/11/02 | 5 600 | 1.0 | 7 30 | |||
| COBRA025059.6+001241 | 02 50 59.76 | +00 12 39.2 | 15/10/09 | 3 900 | 1.4 | 7 30 | |||
| COBRA031807.2+002133 | 03 18 07.07 | +00 21 34.89 | 13/11/02 | 3 600 | 1.4 | 7 30 | |||
| COBRA072805.2+312857 | 07 28 05.35 | +31 28 59.5 | 15/02/17 | 3 600 | 1.8 | 4 100 | 4 100 | ||
| COBRA072805.2+312857 | 07 28 05.35 | +31 28 59.5 | 16/03/08 | 1 600 | 0.7 | 4 100 | 4 100 | ||
| 2 900 | |||||||||
| COBRA073320.4+272103ccQuasar Fields | 07 33 20.50 | +27 21 03.6 | 15/02/18 | 3 900 | 0.8 | 3 900 | 0.6 | 4 100 | 4 100 |
| COBRA073406.1+293316 | 07 34 06.10 | +29 33 15.5 | 15/02/19 | 5 900 | 0.9 | 4 100 | 4 100 | ||
| COBRA073406.1+293316 | 07 34 06.10 | +29 33 15.5 | 17/03/27 | 3 900 | 0.7 | 4 100 | 4 100 | ||
| COBRA074025.5+485124 | 07 40 25.51 | +48 51 25.2 | 13/11/04 | 3 600 | 0.8 | 7 30 | |||
| COBRA074025.5+485124 | 07 40 25.51 | +48 51 25.2 | 15/02/18 | 3 900 | 0.8 | 7 30 | |||
| COBRA074410.9+274011 | 07 44 10.92 | +27 40 12.7 | 15/02/18 | 3 900 | 0.8 | 7 30 | |||
| COBRA074410.9+274011 | 07 44 10.92 | +27 40 12.7 | 17/03/27 | 3 900 | 0.7 | 7 30 | |||
| COBRA074527.0+505317 | 07 45 27.31 | +50 53 14.2 | 17/03/26 | 3900 | 1.3 | 7 30 | |||
| COBRA075516.6+171457 | 07 55 17.35 | +17 14 54.9 | 15/02/19 | 3 900 | 0.8 | 3 900 | 0.7 | 7 30 | |
| COBRA082643.4+143426ccQuasar Fields | 08 26 43.46 | +14 34 27.8 | 15/04/19 | 3 900 | 1.2 | 3 900 | 1.1 | 4 100 | 4 100 |
| COBRA090102.7+420746ccQuasar Fields | 09 01 02.74 | +42 07 46.6 | 16/03/08 | 2 900 | 0.8 | 3 900 | 0.7 | 4 100 | 4 100 |
| COBRA090745.5+382740ccQuasar Fields | 09 07 45.48 | +38 27 39.6 | 15/04/17 | 5 600 | 1.3 | 6 600 | 1.2 | 4 100 | 4 100 |
| COBRA092305.6+275832 | 09 23 04.78 | +27 58 38.2 | 15/02/19 | 3 900 | 0.8 | 3 900 | 0.7 | 7 30 | |
| COBRA093726.6+365550 | 09 37 26.32 | +36 55 47.6 | 17/03/27 | 3 900 | 0.7 | 7 30 | |||
| COBRA100745.5+580713 | 10 07 45.60 | +58 07 15.2 | 15/02/18 | 3 900 | 0.9 | 3 900 | 0.9 | 4 100 | 4 100 |
| COBRA100841.7+372513 | 10 08 41.71 | +37 25 14.2 | 16/05/04 | 3 900 | 0.9 | 4 100 | 4 100 | ||
| COBRA103256.8+262335ccQuasar Fields | 10 32 56.83 | +26 23 36.2 | 14/04/29 | 3 900 | 1.4 | 4 100 | 4 100 | ||
| COBRA103256.8+262335ccQuasar Fields | 10 32 56.83 | +26 23 36.2 | 17/03/27 | 2 900 | 0.7 | 4 100 | 4 100 | ||
| COBRA103434.2+310352 | 10 34 34.20 | +31 03 52.2 | 15/02/19 | 3 900 | 0.7 | 3 900 | 0.9 | 7 30 | |
| COBRA104254.8+290719 | 10 42 54.74 | +29 07 19.6 | 14/04/28 | 3 600 | 1.9 | 4 100 | 4 100 | ||
| COBRA104254.8+290719 | 10 42 54.74 | +29 07 19.6 | 16/05/05 | 3 900 | 0.6 | 4 100 | 4 100 | ||
| COBRA104641.5+282028 | 10 46 41.54 | +28 20 28.3 | 17/03/26 | 3 900 | 1.2 | 7 30 | |||
| COBRA110903.2002543ccQuasar Fields | 11 09 03.26 | 00 25 44.8 | 15/04/18 | 3 900 | 1.2 | 3 900 | 1.0 | 4 100 | 4 100 |
| COBRA111707.3+305307 | 11 17 07.32 | +30 52 54.1 | 16/05/04 | 3 900 | 0.8 | 4 100 | 4 100 | ||
| COBRA113733.8+300010 | 11 37 33.74 | +30 00 09.7 | 14/04/28 | 3 900 | 1.3 | 4 100 | 4 100 | ||
| COBRA113733.8+300010 | 11 37 33.74 | +30 00 09.7 | 17/03/27 | 3 900 | 0.6 | 4 100 | 4 100 | ||
| COBRA120654.6+290742 | 12 06 54.60 | +29 07 42.6 | 16/05/05 | 3 900 | 0.7 | 4 100 | 4 100 | ||
| COBRA121128.5+505253ccQuasar Fields | 12 11 28.56 | +50 52 52.5 | 17/03/27 | 3 900 | 0.6 | 4 100 | 4 100 | ||
| COBRA121623.4+383822 | eeUpon further analysis, we are uncertain of the host identified in Paterno-Mahler et al. (2017) for this field and choose not to report one. We are keeping this fields in the overall sample of 646 sources, but need to redetermine the host coordinates. | eeUpon further analysis, we are uncertain of the host identified in Paterno-Mahler et al. (2017) for this field and choose not to report one. We are keeping this fields in the overall sample of 646 sources, but need to redetermine the host coordinates. | 17/03/26 | 3 900 | 1.4 | 7 30 | |||
| COBRA121712.2+241525 | 12 17 12.31 | +24 15 26.6 | 15/02/18 | 3 900 | 1.2 | 3 900 | 0.9 | 4 100 | 4 100 |
| COBRA122616.2+190626 | 12 26 16.08 | +19 06 25.9 | 17/04/27 | 3 900 | 1.7 | 7 30 | |||
| COBRA123347.0+354133 | 12 33 47.08 | +35 41 34.0 | 16/05/05 | 3 100 | 0.7 | 7 30 | |||
| COBRA123940.7+280828 | 12 39 40.58 | +28 08 29.4 | 16/05/04 | 3 900 | 0.8 | 7 30 | |||
| COBRA125047.4+142355 | 12 50 47.85 | +14 23 47.0 | 17/04/30 | 2 900 | 1.1 | 7 30 | |||
| COBRA125209.6001553ccQuasar Fields | 12 52 09.66 | 00 15 53.4 | 17/04/28 | 3 900 | 1.5 | 4 100 | 4 100 | ||
| COBRA130729.2+274659ccQuasar Fields | 13 07 29.25 | +27 46 59.4 | 17/04/29 | 4 600 | 1.3 | 4 100 | 4 100 | ||
| COBRA131854.0+231153 | 13 18 54.02 | +23 11 53.5 | 17/03/26 | 2 900 | 1.3 | 7 30 | |||
| COBRA132903.2+253110ccQuasar Fields | 13 29 03.20 | +25 31 10.0 | 17/03/27 | 3 900 | 0.7 | 4 100 | 4 100 | ||
| COBRA133227.8+213507ccQuasar Fields | 13 32 27.96 | +21 35 08.9 | 14/04/29 | 3 600 | 1.3 | 4 100 | 4 100 | ||
| COBRA133227.8+213507ccQuasar Fields | 13 32 27.96 | +21 35 08.9 | 15/04/19 | 2 600 | 0.8 | 4 100 | 4 100 | ||
| COBRA133507.1+132329 | 13 35 08.16 | +13 23 33.0 | 17/04/28 | 4 900 | 1.3 | 7 30 | |||
| COBRA134104.4+055841 | 13 41 04.01 | +05 58 40.4 | 17/03/28 | 3 900 | 1.7 | 7 30 | |||
| COBRA135136.2+543955ddThe RA and DEC of this field were misidentified in Paterno-Mahler et al. (2017). Here, we report the correct RA and DEC of our identified host galaxy. | 13 51 37.57 | +54 39 52.3 | 15/04/18 | 3 600 | 1.0 | 3 600 | 1.0 | 5 30 | |
| COBRA135450.6+251240 | 13 54 50.52 | +25 12 39.2 | 16/05/04 | 3 900 | 0.9 | 7 30 | |||
| COBRA135838.1+384722 | 13 58 38.30 | +38 47 22.2 | 15/04/17 | 3 900 | 1.2 | 4 100 | 4 100 | ||
| COBRA135838.1+384722 | 13 58 38.30 | +38 47 22.2 | 15/04/18 | 3 900 | 1.0 | 4 100 | 4 100 | ||
| COBRA140119.7+061204 | 14 01 19.56 | +06 12 13.3 | 17/04/29 | 3 900 | 1.4 | 7 30 | |||
| COBRA140935.3+210347 | 14 09 35.44 | +21 03 44.2 | 15/02/19 | 3 900 | 0.9 | 3 900 | 0.8 | 7 30 | |
| COBRA141155.2+341510ccQuasar Fields | 14 11 55.25 | +34 15 10.1 | 15/02/18 | 3 900 | 0.9 | 4 100 | 4 100 | ||
| COBRA141155.2+341510ccQuasar Fields | 14 11 55.25 | +34 15 10.1 | 14/04/28 | 5 600 | 1.1 | 4 100 | 4 100 | ||
| COBRA142238.1+251433 | 14 22 38.90 | +25 14 31.5 | 16/05/05 | 3 900 | 0.7 | 7 30 | |||
| COBRA142242.5+014139ccQuasar Fields | 14 22 42.51 | +04 14 39.1 | 17/03/26 | 3 900 | 1.5 | 4 100 | 4 100 | ||
| COBRA143518.7+174217 | 14 35 18.72 | +17 42 16.9 | 17/04/30 | 3 900 | 1.0 | 7 30 | |||
| COBRA143817.6+491233ccQuasar Fields | 14 38 17.66 | +49 12 33.8 | 16/05/04 | 3 900 | 1.1 | 4 100 | 4 100 | ||
| COBRA144207.1+562522 | 14 42 07.13 | +56 25 21.4 | 17/03/28 | 3 900 | 1.6 | 4 100 | 4 100 | ||
| COBRA145023.3+340123 | 14 50 22.99 | +34 01 30.0 | 14/04/28 | 6 300 | 1.2 | 1 300 | 0.9 | 5 30 | |
| 2 600 | |||||||||
| COBRA145416.9+135201 | 14 54 16.89 | +13 52 00.1 | 17/03/28 | 5 600 | 1.3 | 7 30 | |||
| COBRA145656.0+501748 | 14 56 55.99 | +50 17 49.6 | 16/03/07 | 3 600 | 1.7 | 4 100 | 4 100 | ||
| COBRA145656.0+501748 | 14 56 55.99 | +50 17 49.6 | 16/05/05 | 3 900 | 0.9 | 4 100 | 4 100 | ||
| COBRA150238.1+170146 | 15 02 38.18 | +17 01 46.2 | 14/04/29 | 7 300 | 1.2 | 7 30 | |||
| COBRA151458.0011749 | 15 14 58.51 | 01 17 49.5 | 17/04/29 | 4 900 | 1.7 | 7 30 | |||
| COBRA152647.5+554859 | 15 26 47.57 | +55 48 59.4 | 14/04/28 | 3 600 | 1.3 | 3 600 | 1.2 | 4 100 | 4 100 |
| COBRA152934.7+275416ccQuasar Fields | 15 29 34.82 | +27 54 16.2 | 17/04/30 | 3 900 | 1.0 | 5 30 | |||
| COBRA153317.4+391804ccQuasar Fields | 15 33 17.42 | +39 18 04.7 | 17/04/29 | 2 900 | 1.8 | 5 30 | |||
| COBRA154638.3+364420ccQuasar Fields | 15 46 38.30 | +36 44 20.0 | 15/04/18 | 3 600 | 1.1 | 4 100 | 4 100 | ||
| COBRA154638.3+364420ccQuasar Fields | 15 46 38.30 | +36 44 20.0 | 15/02/18 | 3 900 | 1.1 | 4 100 | 4 100 | ||
| COBRA155000.5+294953ccQuasar Fields | 15 50 00.60 | +29 49 54.1 | 14/04/29 | 3 900 | 1.4 | 3 900 | 1.2 | 4 100 | 4 100 |
| COBRA155343.8+002513 | 15 53 43.77 | +00 25 18.8 | 17/04/30 | 2 900 | 1.3 | 7 30 | |||
| COBRA160815.0003613 | 16 08 14.80 | 00 35 58.9 | 17/04/28 | 3 900 | 1.4 | 7 30 | |||
| COBRA161531.3+234249 | 16 15 31.39 | +23 42 49.6 | 16/05/05 | 3 900 | 0.9 | 7 30 | |||
| COBRA162955.5+451607 | bbNo host coordinate is identified in Paterno-Mahler et al. (2017). | bbNo host coordinate is identified in Paterno-Mahler et al. (2017). | 17/03/26 | 2 900 | 1.2 | 5 30 | |||
| COBRA163745.9+521735 | 16 37 45.86 | +52 17 35.5 | 17/04/28 | 4 600 | 1.8 | 5 30 | |||
| COBRA164551.2+153230 | 16 45 51.51 | +15 32 30.5 | 17/04/27 | 3 900 | 1.4 | 7 30 | |||
| COBRA164611.2+512915 | 16 46 11.31 | +51 29 03.4 | 15/04/18 | 4 900 | 1.1 | 4 900 | 0.8 | 4 100 | 4 100 |
| COBRA164951.6+310818 | 16 49 52.36 | +31 08 07.8 | 17/04/30 | 3 900 | 1.2 | 5 30 | |||
| COBRA170105.4+360958 | 17 01 05.35 | +36 09 56.8 | 17/03/27 | 2 900 | 0.8 | 5 30 | |||
| COBRA170443.9+295246 | 17 04 43.58 | +29 52 41.8 | 16/05/05 | 3 900 | 0.8 | 5 30 | |||
| COBRA170614.5+243707 | 17 06 13.61 | +24 37 04.4 | 16/05/05 | 3 900 | 0.8 | 4 100 | 4 100 | ||
| COBRA171231.4+243528 | 17 12 31.44 | +24 35 30.1 | 17/04/28 | 2 600 | 1.4 | 5 30 | |||
| COBRA171330.9+423502 | 17 13 30.57 | +42 35 06.0 | 17/04/30 | 2 900 | 1.0 | 5 30 | |||
| COBRA172248.2+542400 | 17 22 48.07 | +54 23 57.5 | 16/05/04 | 3 900 | 1.0 | 4 100 | 4 100 | ||
| COBRA172655.5+281841 | 17 26 55.99 | +28 18 48.2 | 17/03/27 | 3 900 | 0.7 | 5 30 | |||
| COBRA220852.0002724 | 22 08 52.12 | 00 27 22.3 | 13/11/02 | 3 600 | 1.2 | 7 30 | |||
| COBRA221605.1081335 | 22 16 04.61 | 08 13 32.1 | 15/10/10 | 3 600 | 1.4 | 3 600 | 1.1 | 7 30 | |
| COBRA222729.1+000522ccQuasar Fields | 22 27 29.04 | +00 05 22.2 | 15/10/11 | 4 900 | 1.0 | 3 900 | 1.1 | 4 100 | 4 100 |
| COBRA223506.9094819 | 22 35 07.54 | 09 48 28.4 | 13/11/03 | 3 600 | 0.9 | 7 30 | |||
| COBRA223634.5012119 | 22 36 34.56 | 01 21 19.0 | 13/11/04 | 4 600 | 0.9 | 7 30 | |||
| COBRA232345.9+002925 | 23 23 45.88 | +00 29 20.4 | 13/11/02 | 3 600 | 1.1 | 7 30 | |||
| COBRA232457.8+005529 | 23 24 57.91 | +00 55 27.8 | 13/11/01 | 5 300 | 1.0 | 4 100 | 4 100 | ||
| COBRA233820.5005555 | 23 38 20.57 | 00 55 56.3 | 15/10/10 | 3 600 | 1.2 | 3 600 | 1.2 | 4 100 | 4 100 |
| Field | Central Coordinates | 3.6 miiFields where a two galaxy red sequence detection is mathematically above a 2 measurement and thus we do not report the measurement. | ||||||||||
|---|---|---|---|---|---|---|---|---|---|---|---|---|
| RA | DEC | NaaN The total number of red sequence members in the 1 region. | NbbN = The excess of counts in the 1 region above the background. | cc = The significance calculated using Equation 1. | NaaN The total number of red sequence members in the 1 region. | NbbN = The excess of counts in the 1 region above the background. | cc = The significance calculated using Equation 1. | NaaN The total number of red sequence members in the 1 region. | NbbN = The excess of counts in the 1 region above the background. | cc = The significance calculated using Equation 1. | cc = The significance calculated using Equation 1. | |
| COBRA003447.7002137 | 00 34 47.70 | 00 21 37.0 | 0ffFields where the background has an overwhelming majority of background regions with zero red sequence sources and thus we do not report a significance of the measurement. | 10 | 0.2 | 0.1 | 0.3 | |||||
| “ ” | 00 34 47.70 | 00 21 37.0 | 0ffFields where the background has an overwhelming majority of background regions with zero red sequence sources and thus we do not report a significance of the measurement. | |||||||||
| “ ” | 00 34 46.45 | 00 23 33.3 | 15 | 5.2 | 1.4 | |||||||
| COBRA005837.2+011326hhFields that are cluster candidates according to either the 1 or 2 analysis in Paterno-Mahler et al. (2017). | 00 58 37.20 | +01 13 26.0 | 6 | 5.5 | 3.6eeFields where overdensities are measured with a magnitude limit of m*+1. | 9 | 7.2 | 3.9eeFields where overdensities are measured with a magnitude limit of m*+1. | 2.2 | |||
| “ ” | 00 58 36.47 | +01 13 26.4 | 7 | 6.5 | 4.3eeFields where overdensities are measured with a magnitude limit of m*+1. | |||||||
| “ ” | 00 58 35.45 | +01 13 15.7 | 10 | 8.2 | 4.5eeFields where overdensities are measured with a magnitude limit of m*+1. | |||||||
| COBRA010329.5+004055 | 01 03 29.50 | +00 40 55.0 | 0ffFields where the background has an overwhelming majority of background regions with zero red sequence sources and thus we do not report a significance of the measurement. | 7 | 2.8 | 0.7 | 0.0 | |||||
| “ ” | 01 03 27.18 | +00 42 16.0 | 1ffFields where the background has an overwhelming majority of background regions with zero red sequence sources and thus we do not report a significance of the measurement. | |||||||||
| “ ” | 01 03 28.15 | +00 39 30.7 | 12 | 2.2 | 0.6 | |||||||
| COBRA012058.9+002140hhFields that are cluster candidates according to either the 1 or 2 analysis in Paterno-Mahler et al. (2017). | 01 20 58.90 | +00 21 40.0 | 5 | 4.2 | 2.5eeFields where overdensities are measured with a magnitude limit of m*+1. | 19 | 15.3 | 5.9eeFields where overdensities are measured with a magnitude limit of m*+1. | 4.3 | |||
| “ ” | 01 20 58.17 | +00 21 46.8 | 4 | 3.2 | 1.9eeFields where overdensities are measured with a magnitude limit of m*+1. | |||||||
| “ ” | 01 20 57.87 | +00 21 49.8 | 17 | 13.3 | 5.1eeFields where overdensities are measured with a magnitude limit of m*+1. | |||||||
| COBRA014147.2092812ddFields with no redshift estimate. Because of this, we are unable to do a red sequence analysis and thus present no overdensity measurements. | 01 41 47.20 | 09 28 12.0 | 0.8 | |||||||||
| COBRA014741.6004706 | 01 47 41.60 | 00 47 06.0 | 5 | 4.0 | 2.0eeFields where overdensities are measured with a magnitude limit of m*+1. | 4 | 1.8 | 1.1eeFields where overdensities are measured with a magnitude limit of m*+1. | 1.6 | |||
| “ ” | 01 47 41.29 | 00 46 36.1 | 5 | 4.0 | 2.0eeFields where overdensities are measured with a magnitude limit of m*+1. | |||||||
| “ ” | 01 47 40.31 | 00 46 29.1 | 2 | 0.2 | 0.1eeFields where overdensities are measured with a magnitude limit of m*+1. | |||||||
| COBRA015313.0001018 | 01 53 13.00 | 00 10 18.0 | 1 | 1.0 | 0.7eeFields where overdensities are measured with a magnitude limit of m*+1. | 0.3 | ||||||
| “ ” | 01 53 19.46 | 00 10 22.1 | 3 | 3.0 | 2.1eeFields where overdensities are measured with a magnitude limit of m*+1. | |||||||
| COBRA020823.8011536ddFields with no redshift estimate. Because of this, we are unable to do a red sequence analysis and thus present no overdensity measurements. | 02 08 23.80 | 01 15 36.0 | 1.1 | |||||||||
| COBRA025059.6+001241ddFields with no redshift estimate. Because of this, we are unable to do a red sequence analysis and thus present no overdensity measurements.hhFields that are cluster candidates according to either the 1 or 2 analysis in Paterno-Mahler et al. (2017). | 02 50 59.60 | +00 12 41.0 | 4.0 | |||||||||
| COBRA031807.2+002133 | 03 18 07.20 | +00 21 33.0 | 1 | 1.0 | 0.7eeFields where overdensities are measured with a magnitude limit of m*+1. | 0.2 | ||||||
| “ ” | 03 18 00.31 | +00 22 47.6 | 2 | 2.0 | 1.5eeFields where overdensities are measured with a magnitude limit of m*+1. | |||||||
| COBRA072805.2+312857hhFields that are cluster candidates according to either the 1 or 2 analysis in Paterno-Mahler et al. (2017). | 07 28 05.20 | +31 28 57.0 | 1ffFields where the background has an overwhelming majority of background regions with zero red sequence sources and thus we do not report a significance of the measurement. | 22 | 12.2 | 3.3 | 3.5 | |||||
| “ ” | 07 28 05.20 | +31 28 58.7 | 1ffFields where the background has an overwhelming majority of background regions with zero red sequence sources and thus we do not report a significance of the measurement. | |||||||||
| “ ” | 07 28 06.26 | +31 28 52.1 | 19 | 9.2 | 2.5 | |||||||
| COBRA073320.4+272103hhFields that are cluster candidates according to either the 1 or 2 analysis in Paterno-Mahler et al. (2017). | 07 33 20.40 | +27 21 03.0 | 0ffFields where the background has an overwhelming majority of background regions with zero red sequence sources and thus we do not report a significance of the measurement. | 14 | 4.2 | 1.1 | 3.6 | |||||
| “ ” | 07 33 20.40 | +27 21 03.0 | 0ffFields where the background has an overwhelming majority of background regions with zero red sequence sources and thus we do not report a significance of the measurement. | |||||||||
| “ ” | 07 33 20.70 | +27 21 41.0 | 13 | 3.2 | 0.9 | |||||||
| COBRA073406.1+293316hhFields that are cluster candidates according to either the 1 or 2 analysis in Paterno-Mahler et al. (2017).ggFields where the host galaxy is fainter than our magnitude limit, and thus why we don’t detect at least one galaxy of the expected color. | 07 34 06.10 | +29 33 16.0 | 4.0 | |||||||||
| COBRA074025.5+485124hhFields that are cluster candidates according to either the 1 or 2 analysis in Paterno-Mahler et al. (2017). | 07 40 25.50 | +48 51 24.0 | 4 | 4.0 | 3.6 | 2.5 | ||||||
| “ ” | 07 40 24.24 | +48 51 08.3 | 3 | 3.0 | 2.7 | |||||||
| COBRA074410.9+274011hhFields that are cluster candidates according to either the 1 or 2 analysis in Paterno-Mahler et al. (2017). | 07 44 10.90 | +27 40 11.0 | 4 | 3.7 | 4.0 | 3.6 | ||||||
| “ ” | 07 44 09.15 | +27 41 03.0 | 7 | 6.7 | 7.3 | |||||||
| COBRA074527.0+505317 | 07 45 27.00 | +50 53 17.0 | 1 | 0.4 | 0.2eeFields where overdensities are measured with a magnitude limit of m*+1. | 1.6 | ||||||
| “ ” | 07 45 25.67 | +50 54 13.6 | 2 | 1.4 | 0.9eeFields where overdensities are measured with a magnitude limit of m*+1. | |||||||
| COBRA075516.6+171457hhFields that are cluster candidates according to either the 1 or 2 analysis in Paterno-Mahler et al. (2017). | 07 55 16.60 | +17 14 57.0 | 2 | 1.8 | 1.1eeFields where overdensities are measured with a magnitude limit of m*+1. | 12 | 9.3 | 5.0eeFields where overdensities are measured with a magnitude limit of m*+1. | 3.3 | |||
| “ ” | 07 55 16.8 | +17 16 41.2 | 6 | 5.8 | 3.4eeFields where overdensities are measured with a magnitude limit of m*+1. | |||||||
| “ ” | 07 55 17.54 | +17 14 59.9 | 14 | 11.3 | 6.1eeFields where overdensities are measured with a magnitude limit of m*+1. | |||||||
| COBRA082643.4+143427 | 08 26 43.40 | +14 34 27.0 | 0ffFields where the background has an overwhelming majority of background regions with zero red sequence sources and thus we do not report a significance of the measurement. | 4 | 5.8 | 1.6 | 0.1 | |||||
| “ ” | 08 26 43.40 | +14 34 27.0 | 0ffFields where the background has an overwhelming majority of background regions with zero red sequence sources and thus we do not report a significance of the measurement. | |||||||||
| “ ” | 08 26 47.77 | +14 35 05.0 | 8 | 1.8 | 0.5 | |||||||
| COBRA090102.7+420746hhFields that are cluster candidates according to either the 1 or 2 analysis in Paterno-Mahler et al. (2017). | 09 01 02.70 | +42 07 46.0 | 1ffFields where the background has an overwhelming majority of background regions with zero red sequence sources and thus we do not report a significance of the measurement. | 9 | 0.8 | 0.2 | 0.3 | |||||
| “ ” | 09 01 22.5 | +42 09 59.9 | 1ffFields where the background has an overwhelming majority of background regions with zero red sequence sources and thus we do not report a significance of the measurement. | |||||||||
| “ ” | 09 01 00.36 | +42 07 41.9 | 12 | 2.2 | 0.6 | |||||||
| COBRA090745.5+382740hhFields that are cluster candidates according to either the 1 or 2 analysis in Paterno-Mahler et al. (2017). | 09 07 45.50 | +38 27 40.0 | 0ffFields where the background has an overwhelming majority of background regions with zero red sequence sources and thus we do not report a significance of the measurement. | 8 | 1.8 | 0.5 | 1.0 | |||||
| “ ” | 09 07 32.56 | +38 27 48.1 | 1ffFields where the background has an overwhelming majority of background regions with zero red sequence sources and thus we do not report a significance of the measurement. | |||||||||
| “ ” | 09 07 44.18 | +38 27 38.2 | 7 | 2.8 | 0.7 | |||||||
| COBRA092305.0+275832hhFields that are cluster candidates according to either the 1 or 2 analysis in Paterno-Mahler et al. (2017). | 09 23 04.78 | +27 58 38.2 | 1 | 0.6 | 0.5eeFields where overdensities are measured with a magnitude limit of m*+1. | 2 | 0.5 | 0.3eeFields where overdensities are measured with a magnitude limit of m*+1. | 3.2 | |||
| “ ” | 09 23 04.10 | +27 58 46.3 | 1 | 0.6 | 0.5eeFields where overdensities are measured with a magnitude limit of m*+1. | |||||||
| “ ” | 09 23 11.46 | +27 57 42.2 | 3 | 1.5 | 0.9eeFields where overdensities are measured with a magnitude limit of m*+1. | |||||||
| COBRA093726.6+365550hhFields that are cluster candidates according to either the 1 or 2 analysis in Paterno-Mahler et al. (2017). | 09 37 26.60 | +36 55 50.02 | 2iiFields where a two galaxy red sequence detection is mathematically above a 2 measurement and thus we do not report the measurement. | 1.8 | ||||||||
| “ ” | 09 37 25.46 | +36 56 01.4 | 2iiFields where a two galaxy red sequence detection is mathematically above a 2 measurement and thus we do not report the measurement. | |||||||||
| COBRA100745.5+580713hhFields that are cluster candidates according to either the 1 or 2 analysis in Paterno-Mahler et al. (2017). | 10 07 45.50 | +58 07 13.0 | 6 | 6.0 | 3.1eeFields where overdensities are measured with a magnitude limit of m*+1. | 14 | 12.2 | 6.5eeFields where overdensities are measured with a magnitude limit of m*+1. | 3.3 | |||
| “ ” | 10 07 45.60 | +58 07 27.6 | 5 | 5.0 | 2.6eeFields where overdensities are measured with a magnitude limit of m*+1. | |||||||
| “ ” | 10 07 45.09 | +58 07 29.8 | 14 | 12.2 | 6.5eeFields where overdensities are measured with a magnitude limit of m*+1. | |||||||
| COBRA100841.7+372513hhFields that are cluster candidates according to either the 1 or 2 analysis in Paterno-Mahler et al. (2017). | 10 08 41.70 | +37 25 13.0 | 5 | 4.4 | 5.1 | 21 | 11.2 | 3.0 | 3.3 | |||
| “ ” | 10 08 43.08 | +37 25 23.7 | 5 | 4.4 | 5.1 | |||||||
| “ ” | 10 08 41.53 | +37 25 32.3 | 25 | 15.2 | 4.1 | |||||||
| COBRA103256.8+262335hhFields that are cluster candidates according to either the 1 or 2 analysis in Paterno-Mahler et al. (2017). | 10 32 56.80 | +26 23 35.0 | 0ffFields where the background has an overwhelming majority of background regions with zero red sequence sources and thus we do not report a significance of the measurement. | 18 | 8.2 | 2.2 | 2.1 | |||||
| “ ” | 10 32 56.80 | +26 23 35.0 | 0ffFields where the background has an overwhelming majority of background regions with zero red sequence sources and thus we do not report a significance of the measurement. | |||||||||
| “ ” | 10 32 54.49 | +26 23 33.3 | 17 | 7.2 | 1.9 | |||||||
| COBRA103434.2+310352hhFields that are cluster candidates according to either the 1 or 2 analysis in Paterno-Mahler et al. (2017). | 10 34 34.20 | +31 03 52.0 | 5 | 4.6 | 4.8 | 2.9 | ||||||
| “ ” | 10 34 33.55 | +31 03 53.0 | 5 | 4.6 | 4.8 | |||||||
| COBRA104254.8+290719hhFields that are cluster candidates according to either the 1 or 2 analysis in Paterno-Mahler et al. (2017). | 10 42 54.80 | +29 07 19.0 | 3 | 3.0 | 3.3eeFields where overdensities are measured with a magnitude limit of m*+1. | 21 | 11.2 | 3.0 | 3.5 | |||
| “ ” | 10 42 53.41 | +29 07 25.2 | 5 | 5.0 | 5.4eeFields where overdensities are measured with a magnitude limit of m*+1. | |||||||
| “ ” | 10 42 55.45 | +29 07 22.7 | 22 | 12.2 | 3.3 | |||||||
| COBRA104641.5+282028hhFields that are cluster candidates according to either the 1 or 2 analysis in Paterno-Mahler et al. (2017). | 10 46 41.00 | +28 20 28.0 | 1ffFields where the background has an overwhelming majority of background regions with zero red sequence sources and thus we do not report a significance of the measurement. | 4.0 | ||||||||
| “ ” | 10 46 41.52 | +28 20 25.8 | 1ffFields where the background has an overwhelming majority of background regions with zero red sequence sources and thus we do not report a significance of the measurement. | |||||||||
| COBRA110903.2002543hhFields that are cluster candidates according to either the 1 or 2 analysis in Paterno-Mahler et al. (2017). | 11 09 03.20 | 00 26 43.0 | 0 | 0.0 | 0.0 | 10 | 0.2 | 0.1 | 0.0 | |||
| “ ” | 11 08 58.85 | 00 24 46.5 | 1 | 1.0 | 1.0 | |||||||
| “ ” | 11 09 02.06 | 00 27 10.4 | 15 | 5.2 | 1.4 | |||||||
| COBRA111707.3+305307hhFields that are cluster candidates according to either the 1 or 2 analysis in Paterno-Mahler et al. (2017). | 11 17 07.30 | +30 53 07.0 | 1 | 0.8 | 0.9eeFields where overdensities are measured with a magnitude limit of m*+1. | 2.2 | ||||||
| “ ” | 11 17 05.78 | +30 53 02.9 | 1 | 0.8 | 0.9eeFields where overdensities are measured with a magnitude limit of m*+1. | |||||||
| COBRA113733.8+300010hhFields that are cluster candidates according to either the 1 or 2 analysis in Paterno-Mahler et al. (2017). | 11 37 33.80 | +30 00 10.0 | 8 | 7.4 | 4.6eeFields where overdensities are measured with a magnitude limit of m*+1. | 13 | 9.1 | 3.8eeFields where overdensities are measured with a magnitude limit of m*+1. | 3.0 | |||
| “ ” | 11 37 33.36 | +30 00 07.8 | 7 | 6.4 | 4.0eeFields where overdensities are measured with a magnitude limit of m*+1. | |||||||
| “ ” | 11 37 30.82 | +30 00 01.2 | 10 | 6.1 | 2.5eeFields where overdensities are measured with a magnitude limit of m*+1. | |||||||
| COBRA120654.6+290742 | 12 06 54.60 | +29 07 42.0 | 2 | 1.7 | 0.9eeFields where overdensities are measured with a magnitude limit of m*+1. | 1.6 | ||||||
| “ ” | 12 06 53.94 | +29 07 44.3 | 3 | 2.7 | 1.4eeFields where overdensities are measured with a magnitude limit of m*+1. | |||||||
| COBRA121128.5+505253hhFields that are cluster candidates according to either the 1 or 2 analysis in Paterno-Mahler et al. (2017). | 12 11 28.50 | +50 52 53.0 | 0 | 0.0 | 0.0 | 15 | 5.2 | 1.4 | 3.2 | |||
| “ ” | 12 11 22.79 | +50 54 23.7 | 2iiFields where a two galaxy red sequence detection is mathematically above a 2 measurement and thus we do not report the measurement. | |||||||||
| “ ” | 12 11 25.79 | +50 52 16.0 | 20 | 10.2 | 2.7 | |||||||
| COBRA121623.4+383822ddFields with no redshift estimate. Because of this, we are unable to do a red sequence analysis and thus present no overdensity measurements. | 12 16 23.40 | +38 38 22.0 | 0.7 | |||||||||
| COBRA121712.2+241525hhFields that are cluster candidates according to either the 1 or 2 analysis in Paterno-Mahler et al. (2017). | 12 17 12.20 | +24 15 25.0 | 11 | 10.0 | 7.3eeFields where overdensities are measured with a magnitude limit of m*+1. | 18 | 13.4 | 5.5eeFields where overdensities are measured with a magnitude limit of m*+1. | 4.4 | |||
| “ ” | 12 17 10.69 | +24 15 31.83 | 12 | 11.0 | 8.1eeFields where overdensities are measured with a magnitude limit of m*+1. | |||||||
| “ ” | 12 17 11.99 | +24 15 22.6 | 17 | 12.4 | 5.1eeFields where overdensities are measured with a magnitude limit of m*+1. | |||||||
| COBRA122616.2+190626ddFields with no redshift estimate. Because of this, we are unable to do a red sequence analysis and thus present no overdensity measurements. | 12 26 16.2 | +19 06 26.0 | 0.3 | |||||||||
| COBRA123347.0+354133 | 12 33 47.00 | +35 41 33.0 | 2 | 1.7 | 1.1eeFields where overdensities are measured with a magnitude limit of m*+1. | 1.4 | ||||||
| “ ” | 12 33 49.84 | +35 41 10.3 | 3 | 1.7 | 1.1eeFields where overdensities are measured with a magnitude limit of m*+1. | |||||||
| COBRA123940.7+280828hhFields that are cluster candidates according to either the 1 or 2 analysis in Paterno-Mahler et al. (2017). | 12 39 40.70 | +28 08 28.0 | 7 | 6.0 | 3.6eeFields where overdensities are measured with a magnitude limit of m*+1. | 2.7 | ||||||
| “ ” | 12 39 39.68 | +28 08 32.2 | 7 | 6.0 | 3.6eeFields where overdensities are measured with a magnitude limit of m*+1. | |||||||
| COBRA125047.4+142355hhFields that are cluster candidates according to either the 1 or 2 analysis in Paterno-Mahler et al. (2017). | 12 50 47.40 | +14 23 55.0 | 5 | 4.2 | 2.5eeFields where overdensities are measured with a magnitude limit of m*+1. | 3.0 | ||||||
| “ ” | 12 50 47.39 | +14 24 07.6 | 5 | 4.2 | 2.5eeFields where overdensities are measured with a magnitude limit of m*+1. | |||||||
| COBRA125209.6001553 | 12 52 09.60 | 00 15 53.0 | 1 | 1.0 | 1.3eeFields where overdensities are measured with a magnitude limit of m*+1. | 1.8 | ||||||
| “ ” | 12 52 06.03 | 00 16 08.1 | 1 | 1.0 | 1.3eeFields where overdensities are measured with a magnitude limit of m*+1. | |||||||
| COBRA130729.2+274659 | 13 07 29.20 | +27 46 59.0 | 1 | 1.0 | 0.9 | 0.4 | ||||||
| “ ” | 13 07 37.96 | +27 48 33.2 | 6 | 6.0 | 5.5 | |||||||
| COBRA131854.0+231153hhFields that are cluster candidates according to either the 1 or 2 analysis in Paterno-Mahler et al. (2017). | 13 18 54.00 | +23 11 53.0 | 1ffFields where the background has an overwhelming majority of background regions with zero red sequence sources and thus we do not report a significance of the measurement. | 2.1 | ||||||||
| “ ” | 13 18 54.04 | +23 11 51.5 | 1ffFields where the background has an overwhelming majority of background regions with zero red sequence sources and thus we do not report a significance of the measurement. | |||||||||
| COBRA132903.2+253110hhFields that are cluster candidates according to either the 1 or 2 analysis in Paterno-Mahler et al. (2017). | 13 29 03.20 | +25 31 10.0 | 2 | 1.4 | 0.9eeFields where overdensities are measured with a magnitude limit of m*+1. | 1.4 | ||||||
| “ ” | 13 29 02.34 | +25 30 09.1 | 2 | 1.4 | 0.9eeFields where overdensities are measured with a magnitude limit of m*+1. | |||||||
| COBRA133227.8+213507 | 13 32 27.80 | +21 35 07.0 | 0ffFields where the background has an overwhelming majority of background regions with zero red sequence sources and thus we do not report a significance of the measurement. | 9 | 0.8 | 0.2 | 0.5 | |||||
| “ ” | 13 32 27.80 | +21 35 07.0 | 0ffFields where the background has an overwhelming majority of background regions with zero red sequence sources and thus we do not report a significance of the measurement. | |||||||||
| “ ” | 13 32 25.89 | +21 34 13.1 | 11 | 1.2 | 0.3 | |||||||
| COBRA133507.1+132329 | 13 35 07.10 | +13 23 39.0 | 2iiFields where a two galaxy red sequence detection is mathematically above a 2 measurement and thus we do not report the measurement. | 1.9 | ||||||||
| “ ” | 13 35 08.01 | +13 23 20.1 | 3 | 3.0 | 4.5 | |||||||
| COBRA134104.4+055841hhFields that are cluster candidates according to either the 1 or 2 analysis in Paterno-Mahler et al. (2017). | 13 41 04.40 | +05 58 41.0 | 3 | 2.6 | 2.2eeFields where overdensities are measured with a magnitude limit of m*+1. | 3.3 | ||||||
| “ ” | 13 41 03.82 | +05 58 41.4 | 3 | 2.6 | 2.2eeFields where overdensities are measured with a magnitude limit of m*+1. | |||||||
| COBRA135136.2+543955hhFields that are cluster candidates according to either the 1 or 2 analysis in Paterno-Mahler et al. (2017). | 13 51 36.20 | +54 39 55.0 | 10 | 9.9 | 6.4eeFields where overdensities are measured with a magnitude limit of m*+1. | 16 | 13.9 | 9.0eeFields where overdensities are measured with a magnitude limit of m*+1. | 4.1 | |||
| “ ” | 13 51 35.45 | +54 39 43.8 | 11 | 10.9 | 7.0eeFields where overdensities are measured with a magnitude limit of m*+1. | |||||||
| “ ” | 13 51 34.70 | +54 39 46.3 | 17 | 14.9 | 9.6eeFields where overdensities are measured with a magnitude limit of m*+1. | |||||||
| COBRA135450.6+251240ddFields with no redshift estimate. Because of this, we are unable to do a red sequence analysis and thus present no overdensity measurements.hhFields that are cluster candidates according to either the 1 or 2 analysis in Paterno-Mahler et al. (2017). | 13 54 50.60 | +25 12 40.0 | 3.2 | |||||||||
| COBRA135838.1+384722hhFields that are cluster candidates according to either the 1 or 2 analysis in Paterno-Mahler et al. (2017). | 13 59 38.10 | +38 47 22.0 | 1 | 0.3 | 0.2eeFields where overdensities are measured with a magnitude limit of m*+1. | 4 | 0.2 | 0.1eeFields where overdensities are measured with a magnitude limit of m*+1. | 1.1 | |||
| “ ” | 13 58 30.31 | +38 47 36.6 | 4 | 3.3 | 2.4eeFields where overdensities are measured with a magnitude limit of m*+1. | |||||||
| “ ” | 13 58 41.84 | +38 48 40.7 | 10 | 5.8 | 2.3eeFields where overdensities are measured with a magnitude limit of m*+1. | |||||||
| COBRA140119.7+061204ddFields with no redshift estimate. Because of this, we are unable to do a red sequence analysis and thus present no overdensity measurements. | 14 01 19.27 | +06 12 04.0 | 1.9 | |||||||||
| COBRA140935.3+210347hhFields that are cluster candidates according to either the 1 or 2 analysis in Paterno-Mahler et al. (2017). | 14 09 35.30 | +21 03 47.0 | 1ffFields where the background has an overwhelming majority of background regions with zero red sequence sources and thus we do not report a significance of the measurement. | 2.5 | ||||||||
| “ ” | 14 09 35.34 | +21 03 44.2 | 1ffFields where the background has an overwhelming majority of background regions with zero red sequence sources and thus we do not report a significance of the measurement. | |||||||||
| COBRA141155.2+341510hhFields that are cluster candidates according to either the 1 or 2 analysis in Paterno-Mahler et al. (2017). | 14 11 55.20 | +34 15 10.0 | 0ffFields where the background has an overwhelming majority of background regions with zero red sequence sources and thus we do not report a significance of the measurement. | 12 | 2.2 | 0.6 | 2.7 | |||||
| “ ” | 14 11 55.20 | +34 15 10.0 | 0ffFields where the background has an overwhelming majority of background regions with zero red sequence sources and thus we do not report a significance of the measurement. | |||||||||
| “ ” | 14 11 46.31 | +34 14 35.5 | 18 | 8.2 | 2.2 | |||||||
| COBRA142238.1+251433hhFields that are cluster candidates according to either the 1 or 2 analysis in Paterno-Mahler et al. (2017). | 14 22 38.10 | +25 14 33.0 | 5 | 4.3 | 2.6eeFields where overdensities are measured with a magnitude limit of m*+1. | 2.9 | ||||||
| “ ” | 14 22 34.16 | +25 13 54.7 | 9 | 8.3 | 5.0eeFields where overdensities are measured with a magnitude limit of m*+1. | |||||||
| COBRA142242.5+041439 | 14 22 42.50 | +04 14 39.0 | 0 | 0.3 | 0.3eeFields where overdensities are measured with a magnitude limit of m*+1. | 0.1 | ||||||
| “ ” | 14 22 39.51 | +04 15 35.5 | 1 | 0.6 | 0.4eeFields where overdensities are measured with a magnitude limit of m*+1. | |||||||
| COBRA143518.7+174217 | 14 35 18.70 | +17 42 15.5 | 2iiFields where a two galaxy red sequence detection is mathematically above a 2 measurement and thus we do not report the measurement. | 0.8 | ||||||||
| “ ” | 14 35 14.80 | +17 42 41.0 | 2iiFields where a two galaxy red sequence detection is mathematically above a 2 measurement and thus we do not report the measurement. | |||||||||
| COBRA143817.6+491233hhFields that are cluster candidates according to either the 1 or 2 analysis in Paterno-Mahler et al. (2017). | 14 38 17.60 | +49 12 33.0 | 1 | 1.0 | 1.1 | 10 | 0.2 | 0.1 | 1.4 | |||
| “ ” | 14 38 11.70 | +49 12 29.5 | 1 | 1.0 | 1.1 | |||||||
| “ ” | 14 38 10.72 | +49 12 11.8 | 14 | 4.2 | 1.1 | |||||||
| COBRA144207.1+562522 | 14 42 07.10 | +56 25 22.0 | 1ffFields where the background has an overwhelming majority of background regions with zero red sequence sources and thus we do not report a significance of the measurement. | 16 | 6.2 | 1.7 | 1.1 | |||||
| “ ” | 14 42 06.80 | +56 25 21.8 | 1ffFields where the background has an overwhelming majority of background regions with zero red sequence sources and thus we do not report a significance of the measurement. | |||||||||
| “ ” | 14 42 06.51 | +56 25 40.5 | 15 | 5.2 | 1.4 | |||||||
| COBRA145023.3+340123hhFields that are cluster candidates according to either the 1 or 2 analysis in Paterno-Mahler et al. (2017). | 14 50 20.90 | +34 01 33.0 | 2iiFields where a two galaxy red sequence detection is mathematically above a 2 measurement and thus we do not report the measurement. | 3.6 | ||||||||
| “ ” | 14 50 23.34 | +34 01 29.5 | 3 | 3.0 | 3.9 | |||||||
| COBRA145416.9+135201hhFields that are cluster candidates according to either the 1 or 2 analysis in Paterno-Mahler et al. (2017).ggFields where the host galaxy is fainter than our magnitude limit, and thus why we don’t detect at least one galaxy of the expected color. | 14 54 16.90 | +13 52 01.0 | 0ffFields where the background has an overwhelming majority of background regions with zero red sequence sources and thus we do not report a significance of the measurement. | 2.2 | ||||||||
| “ ” | 14 54 16.90 | +13 52 01.0 | 0ffFields where the background has an overwhelming majority of background regions with zero red sequence sources and thus we do not report a significance of the measurement. | |||||||||
| COBRA145656.0+501748hhFields that are cluster candidates according to either the 1 or 2 analysis in Paterno-Mahler et al. (2017). | 14 56 56.00 | +50 17 48.0 | 3 | 2.2 | 1.5eeFields where overdensities are measured with a magnitude limit of m*+1. | 7 | 2.6 | 1.0eeFields where overdensities are measured with a magnitude limit of m*+1. | 1.4 | |||
| “ ” | 14 56 56.61 | +50 17 50.4 | 3 | 2.2 | 1.5eeFields where overdensities are measured with a magnitude limit of m*+1. | |||||||
| “ ” | 14 56 59.71 | +50 17 43.4 | 5 | 0.6 | 0.2eeFields where overdensities are measured with a magnitude limit of m*+1. | |||||||
| COBRA150238.1+170146hhFields that are cluster candidates according to either the 1 or 2 analysis in Paterno-Mahler et al. (2017). | 15 02 38.10 | +17 01 46.0 | 5 | 4.2 | 2.9 | 0.8 | ||||||
| “ ” | 15 02 38.33 | +17 01 51.9 | 5 | 4.2 | 2.9 | |||||||
| COBRA151458.0011749hhFields that are cluster candidates according to either the 1 or 2 analysis in Paterno-Mahler et al. (2017). | 15 14 58.00 | 01 17 50.0 | 6 | 5.0 | 3.9eeFields where overdensities are measured with a magnitude limit of m*+1. | 4.3 | ||||||
| “ ” | 15 14 56.97 | 01 17 57.0 | 6 | 5.0 | 3.9eeFields where overdensities are measured with a magnitude limit of m*+1. | |||||||
| COBRA152647.5+554859hhFields that are cluster candidates according to either the 1 or 2 analysis in Paterno-Mahler et al. (2017). | 15 26 47.50 | +55 48 59.0 | 3 | 3.0 | 4.1 | 1.6 | ||||||
| “ ” | 15 26 52.36 | +55 49 05.0 | 3 | 3.0 | 4.1 | |||||||
| COBRA152934.7+275416 | 15 29 34.96 | +27 54 16.0 | 0 | 0.0 | 0.0 | 1.8 | ||||||
| “ ” | 15 29 42.22 | +27 52 35.1 | 1 | 1.0 | 1.2 | |||||||
| COBRA153317.4+391804 | 15 33 17.40 | +39 18 04.0 | 2 | 1.4 | 0.8eeFields where overdensities are measured with a magnitude limit of m*+1. | 0.4 | ||||||
| “ ” | 15 33 17.29 | +39 17 18.6 | 2 | 1.4 | 0.8eeFields where overdensities are measured with a magnitude limit of m*+1. | |||||||
| COBRA154638.3+364420hhFields that are cluster candidates according to either the 1 or 2 analysis in Paterno-Mahler et al. (2017). | 15 46 38.30 | +36 44 20.0 | 3 | 1.9 | 1.4eeFields where overdensities are measured with a magnitude limit of m*+1. | 6 | 1.5 | 0.5eeFields where overdensities are measured with a magnitude limit of m*+1. | 1.3 | |||
| “ ” | 15 46 30.89 | +36 44 12.6 | 6 | 4.9 | 3.5eeFields where overdensities are measured with a magnitude limit of m*+1. | |||||||
| “ ” | 15 46 39.27 | +36 44 40.1 | 7 | 2.5 | 0.9eeFields where overdensities are measured with a magnitude limit of m*+1. | |||||||
| COBRA155000.5+294953 | 15 50 00.50 | +29 49 53.0 | 0ffFields where the background has an overwhelming majority of background regions with zero red sequence sources and thus we do not report a significance of the measurement. | 9 | 0.8 | 0.2 | 1.4 | |||||
| “ ” | 15 49 48.99 | +29 48 00.1 | 1ffFields where the background has an overwhelming majority of background regions with zero red sequence sources and thus we do not report a significance of the measurement. | |||||||||
| “ ” | 15 50 03.34 | +29 49 00.6 | 8 | 1.8 | 0.5 | |||||||
| COBRA155343.8+002513ddFields with no redshift estimate. Because of this, we are unable to do a red sequence analysis and thus present no overdensity measurements.hhFields that are cluster candidates according to either the 1 or 2 analysis in Paterno-Mahler et al. (2017). | 15 53 43.80 | +00 25 13.0 | 1.8 | |||||||||
| COBRA160815.0003613hhFields that are cluster candidates according to either the 1 or 2 analysis in Paterno-Mahler et al. (2017). | 16 08 15.00 | 00 36 13.0 | 2iiFields where a two galaxy red sequence detection is mathematically above a 2 measurement and thus we do not report the measurement. | 7.7 | ||||||||
| “ ” | 16 08 14.26 | 00 36 17.8 | 2iiFields where a two galaxy red sequence detection is mathematically above a 2 measurement and thus we do not report the measurement. | |||||||||
| COBRA161531.3+234249hhFields that are cluster candidates according to either the 1 or 2 analysis in Paterno-Mahler et al. (2017). | 16 15 31.30 | +23 42 49.0 | 2 | 1.2 | 0.8eeFields where overdensities are measured with a magnitude limit of m*+1. | 2.5 | ||||||
| “ ” | 16 15 29.99 | +23 42 45.5 | 2 | 1.2 | 0.8eeFields where overdensities are measured with a magnitude limit of m*+1. | |||||||
| COBRA162955.5+451607hhFields that are cluster candidates according to either the 1 or 2 analysis in Paterno-Mahler et al. (2017). | 16 29 55.50 | +45 16 07.0 | 5 | 3.8 | 2.2eeFields where overdensities are measured with a magnitude limit of m*+1. | 2.5 | ||||||
| “ ” | 16 29 55.56 | +45 15 07.2 | 5 | 3.8 | 2.2eeFields where overdensities are measured with a magnitude limit of m*+1. | |||||||
| COBRA163745.9+521735 | 16 37 45.90 | +52 17 35.0 | 1.8 | |||||||||
| COBRA164551.2+153230hhFields that are cluster candidates according to either the 1 or 2 analysis in Paterno-Mahler et al. (2017). | 16 45 51.20 | +15 32 30.0 | 2 | 1.0 | 0.7eeFields where overdensities are measured with a magnitude limit of m*+1. | 2.7 | ||||||
| “ ” | 16 45 49.24 | +15 31 58.8 | 3 | 2.0 | 1.4eeFields where overdensities are measured with a magnitude limit of m*+1. | |||||||
| COBRA164611.2+512915hhFields that are cluster candidates according to either the 1 or 2 analysis in Paterno-Mahler et al. (2017). | 16 46 11.20 | +51 29 15.0 | 9 | 8.7 | 8.7eeFields where overdensities are measured with a magnitude limit of m*+1. | 18 | 16.3 | 8.8eeFields where overdensities are measured with a magnitude limit of m*+1. | 2.2 | |||
| “ ” | 16 46 11.57 | +51 29 52.2 | 8 | 7.7 | 7.7eeFields where overdensities are measured with a magnitude limit of m*+1. | |||||||
| “ ” | 16 46 09.03 | +51 28 54.7 | 16 | 14.3 | 7.7eeFields where overdensities are measured with a magnitude limit of m*+1. | |||||||
| COBRA164951.6+310818hhFields that are cluster candidates according to either the 1 or 2 analysis in Paterno-Mahler et al. (2017). | 16 49 51.60 | +31 08 18.0 | 4 | 4.0 | 2.3eeFields where overdensities are measured with a magnitude limit of m*+1. | 2.5 | ||||||
| “ ” | 16 49 53.33 | +31 07 49.4 | 4 | 4.0 | 2.3eeFields where overdensities are measured with a magnitude limit of m*+1. | |||||||
| COBRA170105.4+360958hhFields that are cluster candidates according to either the 1 or 2 analysis in Paterno-Mahler et al. (2017). | 17 01 05.40 | +36 09 58.00 | 7 | 6.0 | 4.2eeFields where overdensities are measured with a magnitude limit of m*+1. | 4.1 | ||||||
| “ ” | 17 01 04.98 | +36 10 04.2 | 7 | 6.0 | 4.2eeFields where overdensities are measured with a magnitude limit of m*+1. | |||||||
| COBRA170443.9+295246hhFields that are cluster candidates according to either the 1 or 2 analysis in Paterno-Mahler et al. (2017). | 17 04 43.90 | +29 52 46.0 | 1 | 0.6 | 0.6 | 1.6 | ||||||
| “ ” | 17 04 43.71 | +29 52 43.4 | 1 | 0.6 | 0.6 | |||||||
| COBRA170614.5+243707hhFields that are cluster candidates according to either the 1 or 2 analysis in Paterno-Mahler et al. (2017). | 17 06 14.50 | +25 37 07.0 | 8 | 7.2 | 5.2eeFields where overdensities are measured with a magnitude limit of m*+1. | 4.6 | ||||||
| “ ” | 17 06 14.54 | +24 36 53.2 | 9 | 8.2 | 5.9eeFields where overdensities are measured with a magnitude limit of m*+1. | |||||||
| COBRA171231.4+243528ddFields with no redshift estimate. Because of this, we are unable to do a red sequence analysis and thus present no overdensity measurements.hhFields that are cluster candidates according to either the 1 or 2 analysis in Paterno-Mahler et al. (2017). | 17 12 31.40 | +24 35 28.0 | 1.8 | |||||||||
| COBRA171330.9+423502 | 17 13 30.90 | +42 35 02.0 | 4 | 4.0 | 2.0eeFields where overdensities are measured with a magnitude limit of m*+1. | 0.3 | ||||||
| “ ” | 17 13 29.85 | +42 35 18.9 | 2 | 2.0 | 1.0eeFields where overdensities are measured with a magnitude limit of m*+1. | |||||||
| COBRA172248.2+542400hhFields that are cluster candidates according to either the 1 or 2 analysis in Paterno-Mahler et al. (2017). | 17 22 48.20 | +54 24 00.0 | 3 | 3.0 | 4.7 | 14 | 4.2 | 1.1 | 2.4 | |||
| “ ” | 17 22 48.62 | +54 23 56.7 | 3 | 3.0 | 4.7 | |||||||
| “ ” | 17 22 49.89 | +54 23 37.3 | 15 | 5.2 | 1.4 | |||||||
| COBRA172655.5+281841ddFields with no redshift estimate. Because of this, we are unable to do a red sequence analysis and thus present no overdensity measurements.hhFields that are cluster candidates according to either the 1 or 2 analysis in Paterno-Mahler et al. (2017). | 17 26 55.50 | +28 18 41.0 | 2.2 | |||||||||
| COBRA220852.0002724ggFields where the host galaxy is fainter than our magnitude limit, and thus why we don’t detect at least one galaxy of the expected color. | 22 08 52.00 | 00 27 24.0 | 0ffFields where the background has an overwhelming majority of background regions with zero red sequence sources and thus we do not report a significance of the measurement. | 1.5 | ||||||||
| “ ” | 22 08 52.00 | 00 27 24.0 | 0ffFields where the background has an overwhelming majority of background regions with zero red sequence sources and thus we do not report a significance of the measurement. | |||||||||
| COBRA221605.1081335hhFields that are cluster candidates according to either the 1 or 2 analysis in Paterno-Mahler et al. (2017). | 22 16 05.10 | 08 13 35.0 | 5 | 4.4 | 3.2eeFields where overdensities are measured with a magnitude limit of m*+1. | 6 | 3.4 | 1.6eeFields where overdensities are measured with a magnitude limit of m*+1. | 2.4 | |||
| “ ” | 22 16 02.88 | 08 14 14.6 | 4 | 3.4 | 2.4eeFields where overdensities are measured with a magnitude limit of m*+1. | |||||||
| “ ” | 22 16 04.65 | 08 13 36.0 | 6 | 3.4 | 1.6eeFields where overdensities are measured with a magnitude limit of m*+1. | |||||||
| COBRA222729.1+000522hhFields that are cluster candidates according to either the 1 or 2 analysis in Paterno-Mahler et al. (2017). | 22 27 29.10 | +00 05 22.0 | 0ffFields where the background has an overwhelming majority of background regions with zero red sequence sources and thus we do not report a significance of the measurement. | 11 | 1.2 | 0.3 | 2.1 | |||||
| “ ” | 22 27 39.28 | +00 05 34.9 | 1ffFields where the background has an overwhelming majority of background regions with zero red sequence sources and thus we do not report a significance of the measurement. | |||||||||
| “ ” | 22 27 36.06 | +00 04 58.4 | 20 | 10.2 | 2.7 | |||||||
| COBRA223506.9094819ddFields with no redshift estimate. Because of this, we are unable to do a red sequence analysis and thus present no overdensity measurements. | 22 36 06.90 | 09 48 19.0 | 0.8 | |||||||||
| COBRA223634.5012119 | 22 36 34.50 | 01 21 19.0 | 1 | 1.0 | 0.5eeFields where overdensities are measured with a magnitude limit of m*+1. | 0.7 | ||||||
| “ ” | 22 36 30.02 | 01 21 59.9 | 2 | 2.0 | 1.1eeFields where overdensities are measured with a magnitude limit of m*+1. | |||||||
| COBRA232345.9+002925 | 23 23 45.90 | +00 29 25.0 | 3 | 2.2 | 1.7eeFields where overdensities are measured with a magnitude limit of m*+1. | 0.8 | ||||||
| “ ” | 23 23 45.51 | +00 29 21.5 | 3 | 2.2 | 1.7eeFields where overdensities are measured with a magnitude limit of m*+1. | |||||||
| COBRA232457.8+005529 | 23 24 57.80 | +00 55 29.0 | 0ffFields where the background has an overwhelming majority of background regions with zero red sequence sources and thus we do not report a significance of the measurement. | 11 | 1.2 | 0.3 | 0.3 | |||||
| “ ” | 23 25 06.12 | +00 55 44.2 | 1ffFields where the background has an overwhelming majority of background regions with zero red sequence sources and thus we do not report a significance of the measurement. | |||||||||
| “ ” | 23 24 52.65 | +00 55 35.3 | 10 | 0.2 | 0.1 | |||||||
| COBRA233820.5005555 | 23 38 20.50 | 00 55 55.0 | 2 | 2.0 | 1.7 | 1.1 | ||||||
| “ ” | 23 38 18.18 | 00 56 18.5 | 1 | 1.0 | 0.8 | |||||||
| Field | Apparent Magnitude | Redshifts | ||||
|---|---|---|---|---|---|---|
| mr | mi | m | m | Photometric | Spectroscopic | |
| COBRA003447.7002137 | 20.19 | 20.00 | 1.75ccPhotometric redshift from color | |||
| COBRA005837.2+011326 | 21.36 | 19.95 | 18.02 | 18.56 | 0.71aaPhotometric redshift from colorbbPhotometric redshift from colorccPhotometric redshift from colorddPhotometric redshift from SDSS | |
| COBRA010329.5+004055 | 18.48 | 18.28 | 18.21 | 17.77 | 1.433 | |
| COBRA012058.9+002140 | 21.37 | 20.14 | 17.96 | 0.75aaPhotometric redshift from colorbbPhotometric redshift from colorddPhotometric redshift from SDSS | ||
| COBRA014147.2092812 | eeNo host found | |||||
| COBRA014741.6004706jjAll 1 3.6 m overdensity measurements are from Paterno-Mahler et al. (2017). We note that we are including these measurements as a comparison and that for some fields marked as clusters in Paterno-Mahler et al. (2017) in this table, the value listed is below 2.0. In this case, these fields are cluster candidates based on the 2 search region discussed in Paterno-Mahler et al. (2017). | 23.27 | 23.18 | 23.10 | 0.60ffNo match with the EzGal modelsiiThe redshift estimate is based on the red sequence histogram, not host color. | ||
| COBRA015313.0001018 | 24.11 | 18.13 | 0.44ddPhotometric redshift from SDSS | |||
| COBRA020823.8011536 | 25.98 | 19.52 | ffNo match with the EzGal models | |||
| COBRA025059.6+001241 | 20.19 | ggNo host identified in - or -band | ||||
| COBRA031807.2+002133 | 21.14 | 18.34 | 0.42ddPhotometric redshift from SDSS | |||
| COBRA072805.2+312857 | 24.40 | 19.20 | 18.98 | 1.75bbPhotometric redshift from colorccPhotometric redshift from color | ||
| COBRA073320.4+272103 | 19.57 | 19.55 | 19.21 | 19.11 | 2.943 | |
| COBRA073406.1+293316 | 19.36 | 19.03 | ggNo host identified in - or -band | |||
| COBRA074025.5+485124jjFields with new redshift estimates. | 22.98 | 21.81 | 18.31 | 1.10aaPhotometric redshift from colorbbPhotometric redshift from color | ||
| COBRA074410.9+274011jjFields with new redshift estimates. | 23.94 | 22.25 | 18.49 | 1.30aaPhotometric redshift from colorbbPhotometric redshift from color | ||
| COBRA074527.0+505317 | 21.04 | 18.63 | 0.71bbPhotometric redshift from colorddPhotometric redshift from SDSS | |||
| COBRA075516.6+171457 | 21.79 | 20.65 | 17.86 | 0.64aaPhotometric redshift from colorddPhotometric redshift from SDSS | ||
| COBRA082643.4+143427 | 17.77 | 17.71 | 17.55 | 17.42 | 2.312 | |
| COBRA090102.7+420746 | 20.36 | 20.00 | 19.26 | 18.89 | 1.621 | |
| COBRA090745.5+382740 | 18.11 | 17.87 | 17.75 | 17.45 | 1.743 | |
| COBRA092305.0+275832 | 23.06 | 21.85 | 19.30 | 0.45ddPhotometric redshift from SDSS | ||
| COBRA093726.6+365550jjFields with new redshift estimates. | 23.92 | 19.85 | 1.40bbPhotometric redshift from color | |||
| COBRA100745.5+580713 | 21.06 | 19.68 | 17.99 | 18.53 | 0.65aaPhotometric redshift from colorbbPhotometric redshift from colorccPhotometric redshift from color | 0.656 |
| COBRA100841.7+372513 | 23.19 | 19.60 | 19.62 | 1.20bbPhotometric redshift from color 1.35ccPhotometric redshift from color | ||
| COBRA103256.8+262335 | 19.98 | 20.08 | 19.32 | 19.33 | 2.18 | |
| COBRA103434.2+310352jjFields with new redshift estimates. | 23.95 | 22.53 | 18.85 | 1.20aaPhotometric redshift from colorbbPhotometric redshift from color | ||
| COBRA104254.8+290719 | 25.32 | 21.62 | 17.72 | 18.01 | 1.35bbPhotometric redshift from color 1.05ccPhotometric redshift from color | |
| COBRA104641.5+282028jjFields with new redshift estimates. | 24.25 | 19.38 | 1.75bbPhotometric redshift from color | |||
| COBRA110903.2002543 | 18.32 | 18.39 | 18.11 | 17.75 | 1.334 | |
| COBRA111707.3+305307 | 20.80 | 17.79 | 18.26 | 0.33ddPhotometric redshift from SDSS | ||
| COBRA113733.8+300010 | 23.84 | 21.98 | 18.75 | 19.14 | 0.98bbPhotometric redshift from colorccPhotometric redshift from color | 0.96 |
| COBRA120654.6+290742 | 21.52 | 18.77 | 19.15 | 0.85bbPhotometric redshift from colorccPhotometric redshift from colorddPhotometric redshift from SDSS | ||
| COBRA121128.5+505253 | 18.57 | 17.39 | 16.99 | 1.364 | ||
| COBRA121623.4+383822 | ggNo host identified in - or -band | |||||
| COBRA121712.2+241525 | 22.63 | 21.45 | 18.49 | 18.94 | 0.90aaPhotometric redshift from colorbbPhotometric redshift from colorccPhotometric redshift from colorddPhotometric redshift from SDSS | |
| COBRA122616.2+190626 | 21.04 | ggNo host identified in - or -band | ||||
| COBRA123347.0+354133jjFields with new redshift estimates. | 19.78 | 0.87ggNo host identified in - or -bandiiThe redshift estimate is based on the red sequence histogram, not host color. | ||||
| COBRA123940.7+280828 | 20.48 | 18.08 | 0.92bbPhotometric redshift from colorddPhotometric redshift from SDSS | |||
| COBRA125047.4+142355jjFields with new redshift estimates. | 21.78 | 19.04 | 0.90bbPhotometric redshift from color | |||
| COBRA125209.6001553 | 19.32 | 17.58 | 17.32 | 0.814 | ||
| COBRA130729.2+274659 | 18.35 | 17.00 | 16.75 | 1.144 | ||
| COBRA131854.0+231153jjFields with new redshift estimates. | 23.42 | 19.28 | 1.45bbPhotometric redshift from color | |||
| COBRA132903.2+253110 | 17.65 | 16.87 | 16.56 | 0.988 | ||
| COBRA133227.8+213507 | 20.28 | 19.99 | 18.59 | 18.47 | 2.739 | |
| COBRA133507.1+132329jjFields with new redshift estimates. | 23.34 | 19.62 | 1.25bbPhotometric redshift from color | |||
| COBRA134104.4+055841jjFields with new redshift estimates. | 22.02 | 19.23 | 0.90bbPhotometric redshift from color | |||
| COBRA135136.2+543955jjFields with new redshift estimates. | 20.79 | 19.67 | 18.30 | 0.55aaPhotometric redshift from colorbbPhotometric redshift from color | ||
| COBRA135450.6+251240 | 21.75 | 21.75 | ffNo match with the EzGal models | |||
| COBRA135838.1+384722 | 22.31 | 21.85 | 18.86 | 19.24 | 0.81bbPhotometric redshift from colorccPhotometric redshift from color | |
| COBRA140119.7+061204 | 20.16 | ggNo host identified in - or -band | ||||
| COBRA140935.3+210347jjFields with new redshift estimates. | 24.37 | 18.78 | 1.80bbPhotometric redshift from color | |||
| COBRA141155.2+341510 | 18.33 | 18.21 | 18.12 | 17.79 | 1.818 | |
| COBRA142238.1+251433jjFields with new redshift estimates. | 22.16 | 19.06 | 1.00bbPhotometric redshift from color | |||
| COBRA142242.5+041439 | 16.95 | 16.44 | 16.20 | 0.972 | ||
| COBRA143518.7+174217jjFields with new redshift estimates. | 22.68 | 18.74 | 1.35bbPhotometric redshift from color | |||
| COBRA143817.6+491233 | 20.94 | 19.43 | 19.10 | 1.358 | ||
| COBRA144207.1+562522 | 23.69 | 18.57 | 18.64 | 1.80bbPhotometric redshift from color 1.30ccPhotometric redshift from color | ||
| COBRA145023.3+340123jjFields with new redshift estimates. | 24.73 | 23.51 | 19.85 | 1.20aaPhotometric redshift from colorbbPhotometric redshift from color | ||
| COBRA145416.9+135201jjFields with new redshift estimates. | 24.56 | 19.47 | 1.70bbPhotometric redshift from color | |||
| COBRA145656.0+501748 | 22.27 | 20.85 | 17.85 | 18.25 | 0.88bbPhotometric redshift from colorccPhotometric redshift from color | |
| COBRA150238.1+170146jjFields with new redshift estimates. | 21.86 | 18.34 | 1.10bbPhotometric redshift from color | |||
| COBRA151458.0011749 | 21.24 | 19.00 | 0.80bbPhotometric redshift from colorddPhotometric redshift from SDSS | |||
| COBRA152647.5+554859 | 23.12 | 22.12 | 18.43 | 18.66 | 1.10bbPhotometric redshift from colorccPhotometric redshift from color | |
| COBRA152934.7+275416 | 18.65 | 17.98 | 1.37 | |||
| COBRA153317.4+391804 | 20.09 | 18.25 | 0.79 | |||
| COBRA154638.3+364420 | 18.32 | 18.56 | 16.57 | 16.17 | 0.939 | |
| COBRA155000.5+294953 | 20.03 | 19.83 | 18.58 | 18.44 | 2.346 | |
| COBRA155343.8+002513 | 22.56 | 20.51 | ffNo match with the EzGal models | |||
| COBRA160815.0003613jjFields with new redshift estimates. | 21.36 | 17.62 | 1.25bbPhotometric redshift from color | |||
| COBRA161531.3+234249jjFields with new redshift estimates. | 21.64 | 19.43 | 0.75bbPhotometric redshift from color | |||
| COBRA162955.5+451607jjFields with new redshift estimates. | 0.78eeNo host foundiiThe redshift estimate is based on the red sequence histogram, not host color. | |||||
| COBRA163745.9+521735 | 20.24 | ggNo host identified in - or -band | ||||
| COBRA164551.2+153230jjFields with new redshift estimates. | 23.25 | 22.02 | 0.65ffNo match with the EzGal modelsiiThe redshift estimate is based on the red sequence histogram, not host color. | |||
| COBRA164611.2+512915 | 19.09 | 18.44 | 17.70 | 17.70 | 0.35aaPhotometric redshift from colorbbPhotometric redshift from colorccPhotometric redshift from color | 0.351 |
| COBRA164951.6+310818 | 21.30 | 19.59 | 0.52bbPhotometric redshift from colorddPhotometric redshift from SDSS | |||
| COBRA170105.4+360958jjFields with new redshift estimates. | 20.25 | 17.94 | 0.80bbPhotometric redshift from color | |||
| COBRA170443.9+295246jjFields with new redshift estimates. | 23.40 | 19.72 | 1.25bbPhotometric redshift from color | |||
| COBRA170614.5+243707 | 19.98 | 17.80 | 18.33 | 0.71bbPhotometric redshift from colorccPhotometric redshift from colorddPhotometric redshift from SDSS | ||
| COBRA171231.4+243528 | 20.35 | ggNo host identified in - or -band | ||||
| COBRA171330.9+423502 | 19.37 | 17.71 | 0.61bbPhotometric redshift from color | 0.698 | ||
| COBRA172248.2+542400 | 24.01 | 19.86 | 20.00 | 1.45bbPhotometric redshift from color 1.25ccPhotometric redshift from color | ||
| COBRA172655.5+281841 | 20.29 | ggNo host identified in - or -band | ||||
| COBRA220852.0002724jjFields with new redshift estimates. | 25.50 | 19.72 | 2.10bbPhotometric redshift from color | |||
| COBRA221605.1081335 | 21.89 | 20.61 | 18.31 | 0.70aaPhotometric redshift from colorbbPhotometric redshift from colorddPhotometric redshift from SDSS | ||
| COBRA222729.1+000522 | 18.79 | 18.57 | 17.59 | 17.41 | 1.513 | |
| COBRA223506.9094819 | 20.66 | ggNo host identified in - or -band | ||||
| COBRA223634.5012119jjFields with new redshift estimates. | 21.03 | 19.45 | 0.60bbPhotometric redshift from color | |||
| COBRA232345.9+002925 | 20.60 | 18.47 | 0.73bbPhotometric redshift from colorddPhotometric redshift from SDSS | |||
| COBRA232457.8+005529hhThe redshift estimate for this field in Paterno-Mahler et al. (2017) is for a nearby foreground galaxy, but not the host galaxy. | 24.52 | 19.52 | 19.44 | 1.50ccPhotometric redshift from color | ||
| COBRA233820.5005555 | 25.61 | 19.55 | 19.80 | 1.10ccPhotometric redshift from color | ||
| Field | ||||||||
|---|---|---|---|---|---|---|---|---|
| RS | Bluer | Redder | RS | Bluer | RS | Bluer | Redder | |
| COBRA003447.7002137 | 7.9 | 1.2 | 0.0 | 58.1 | 6.4 | |||
| COBRA005837.2+011326 | 48.3 | 18.3 | 16.9 | 36.1 | 20.7 | 17.6 | ||
| COBRA010329.5+004055 | 32.2 | 2.5 | 5.9 | 58.1 | 6.4 | |||
| COBRA012058.9+002140 | 47.8 | 19.1 | 12.2 | 50.8 | 14.7 | 30.2 | ||
| COBRA014147.2092812 | ||||||||
| COBRA014741.6004706 | 50.5 | 19.8 | 16.8 | 22.7 | 21.2 | 16.4 | ||
| COBRA015313.0001018 | 38.0 | 19.4 | 5.1 | |||||
| COBRA020823.8011536 | ||||||||
| COBRA025059.6+001241 | ||||||||
| COBRA031807.2+002133 | 44.7 | 20.7 | 8.1 | |||||
| COBRA072805.2+312857 | 7.0 | 2.3 | 0.0 | 58.1 | 6.4 | |||
| COBRA073320.4+272103 | 0.0 | 0.2 | 0.0 | 58.1 | 6.4 | |||
| COBRA073406.1+293316 | ||||||||
| COBRA074025.5+485124 | 39.7 | 8.8 | 23.8 | |||||
| COBRA074410.9+274011 | 31.6 | 8.1 | 26.8 | |||||
| COBRA074527.0+505317 | 30.3 | 25.0 | 5.8 | |||||
| COBRA075516.6+171457 | 47.1 | 23.1 | 8.5 | 28.0 | 18.1 | 19.6 | ||
| COBRA082643.4+143427 | 0.0 | 0.0 | 0.0 | 58.1 | 6.4 | |||
| COBRA090102.7+420746 | 15.8 | 3.1 | 3.6 | 58.1 | 6.4 | |||
| COBRA090745.5+382740 | 5.5 | 2.2 | 1.3 | 58.1 | 6.4 | |||
| COBRA092305.0+275832 | 42.2 | 20.9 | 5.8 | 30.5 | 17.6 | 6.0 | ||
| COBRA093726.6+365550 | 31.1 | 4.7 | 13.5 | |||||
| COBRA100745.5+580713 | 49.5 | 20.2 | 12.2 | 31.7 | 18.9 | 11.7 | ||
| COBRA100841.7+372513 | 45.1 | 10.1 | 23.0 | 58.1 | 6.4 | |||
| COBRA103256.8+262335 | 0.0 | 0.3 | 0.0 | 58.1 | 6.4 | |||
| COBRA103434.2+310352 | 44.2 | 8.9 | 21.1 | |||||
| COBRA104254.8+290719 | 30.9 | 6.3 | 22.1 | 58.1 | 6.4 | |||
| COBRA104641.5+282028 | 13.9 | 2.4 | 0.4 | |||||
| COBRA110903.2002543 | 33.2 | 6.8 | 19.7 | 58.1 | 6.4 | |||
| COBRA111707.3+305307 | 39.4 | 19.0 | 6.2 | 24.2 | 13.6 | 6.5 | ||
| COBRA113733.8+300010 | 35.0 | 15.2 | 16.0 | |||||
| COBRA120654.6+290742 | 39.6 | 21.0 | 12.2 | |||||
| COBRA121128.5+505253 | 30.2 | 5.6 | 18.0 | 58.1 | 6.4 | |||
| COBRA121623.4+383822 | ||||||||
| COBRA121712.2+241525 | 42.2 | 20.3 | 13.2 | 37.5 | 16.4 | 23.3 | ||
| COBRA122616.2+190626 | ||||||||
| COBRA123347.0+354133 | 42.6 | 16.5 | 16.7 | |||||
| COBRA123940.7+280828 | 42.5 | 10.7 | 26.4 | |||||
| COBRA125047.4+142355 | 45.0 | 19.8 | 17.1 | |||||
| COBRA125209.6001553 | 56.7 | 17.1 | 37.2 | |||||
| COBRA130729.2+274659 | 43.8 | 7.0 | 30.5 | |||||
| COBRA131854.0+231153 | 21.3 | 3.8 | 6.2 | |||||
| COBRA132903.2+253110 | 38.7 | 13.6 | 14.6 | |||||
| COBRA133227.8+213507 | 0.0 | 0.1 | 0.0 | 58.1 | 6.4 | |||
| COBRA133507.1+132329 | 41.2 | 7.2 | 24.6 | |||||
| COBRA134104.4+055841 | 50.4 | 15.5 | 30.8 | |||||
| COBRA135136.2+543955 | 49.1 | 20.8 | 11.4 | 17.6 | 22.4 | 12.0 | ||
| COBRA135450.6+251240 | ||||||||
| COBRA135838.1+384722 | 26.5 | 20.5 | 9.1 | 41.3 | 14.2 | 32.0 | ||
| COBRA140119.7+061204 | ||||||||
| COBRA140935.3+210347 | 18.0 | 2.0 | 0.0 | |||||
| COBRA141155.2+341510 | 0.0 | 0.4 | 0.0 | 58.1 | 6.4 | |||
| COBRA142238.1+251433 | 41.1 | 11.8 | 16.7 | |||||
| COBRA142242.5+041439 | 44.9 | 13.6 | 19.9 | |||||
| COBRA143518.7+174217 | 31.4 | 7.1 | 18.5 | |||||
| COBRA143817.6+491233 | 28.0 | 5.1 | 18.5 | 58.1 | 6.4 | |||
| COBRA144207.1+562522 | 0.0 | 5.3 | 0.0 | 58.1 | 6.4 | |||
| COBRA145023.3+340123 | 43.3 | 7.3 | 19.4 | |||||
| COBRA145416.9+135201 | 12.3 | 1.2 | 1.6 | |||||
| COBRA145656.0+501748 | 31.8 | 20.6 | 9.7 | 35.2 | 13.9 | 33.2 | ||
| COBRA150238.1+170146 | 32.9 | 9.4 | 16.6 | |||||
| COBRA151458.0011749 | 47.8 | 17.6 | 15.4 | |||||
| COBRA152647.5+554859 | 42.7 | 10.2 | 14.3 | |||||
| COBRA152934.7+275416 | 30.3 | 4.8 | 16.8 | |||||
| COBRA153317.4+391804 | 43.8 | 20.8 | 13.8 | |||||
| COBRA154638.3+364420 | 43.0 | 15.8 | 17.6 | 27.9 | 12.5 | 14.3 | ||
| COBRA155000.5+294953 | 0.0 | 0.7 | 0.5 | 58.1 | 6.4 | |||
| COBRA155343.8+002513 | ||||||||
| COBRA160815.0003613 | 43.8 | 6.4 | 21.8 | |||||
| COBRA161531.3+234249 | 46.2 | 20.3 | 11.1 | |||||
| COBRA162955.5+451607 | 41.9 | 17.8 | 13.5 | |||||
| COBRA163745.9+521735 | ||||||||
| COBRA164551.2+153230 | 49.2 | 21.8 | 14.9 | |||||
| COBRA164611.2+512915 | 40.5 | 18.4 | 8.2 | 34.0 | 14.7 | 12.6 | ||
| COBRA164951.6+310818 | 34.1 | 24.1 | 3.3 | |||||
| COBRA170105.4+360958 | 47.2 | 18.4 | 12.9 | |||||
| COBRA170443.9+295246 | 42.3 | 7.6 | 25.0 | |||||
| COBRA170614.5+243707 | 43.1 | 20.9 | 10.4 | |||||
| COBRA171231.4+243528 | ||||||||
| COBRA171330.9+423502 | 46.1 | 15.6 | 16.5 | |||||
| COBRA172248.2+542400 | 30.5 | 10.3 | 6.9 | 58.1 | 6.4 | |||
| COBRA172655.5+281841 | ||||||||
| COBRA220852.0002724 | 0.0 | 0.0 | 0.0 | |||||
| COBRA221605.1081335 | 48.8 | 21.4 | 12.0 | 38.2 | 19.0 | 21.9 | ||
| COBRA222729.1+000522 | 18.5 | 3.1 | 5.7 | 58.1 | 6.4 | |||
| COBRA223506.9094819 | ||||||||
| COBRA223634.5012119 | 49.6 | 22.8 | 9.7 | |||||
| COBRA232345.9+002925 | 46.2 | 19.7 | 11.6 | |||||
| COBRA232457.8+005529 | 14.8 | 1.9 | 1.4 | 58.1 | 6.4 | |||
| COBRA233820.5005555 | 41.5 | 9.2 | 23.7 | |||||
| Field | Central Coordinates | 3.6 miiFields where a two galaxy red sequence detection is mathematically above a 2 measurement and thus we do not report the measurement. | ||||||||||
|---|---|---|---|---|---|---|---|---|---|---|---|---|
| RA | DEC | NaaN The total number of galaxies (red sequence, redder, and bluer) in the 1 region. | NbbN = The excess of counts in the 1 region above the combined background adjusted by the red sequence completeness fraction. | cc = The significance calculated using Equation 3. | NaaN The total number of galaxies (red sequence, redder, and bluer) in the 1 region. | NbbN = The excess of counts in the 1 region above the combined background adjusted by the red sequence completeness fraction. | cc = The significance calculated using Equation 3. | NaaN The total number of galaxies (red sequence, redder, and bluer) in the 1 region. | NbbN = The excess of counts in the 1 region above the combined background adjusted by the red sequence completeness fraction. | cc = The significance calculated using Equation 3. | cc = The significance calculated using Equation 3. | |
| COBRA003447.7002137 | 00 34 47.70 | 00 21 37.0 | 16ffFields where the background has an overwhelming majority of background regions with zero red sequence sources and thus we do not report a significance of the measurement. | 22 | 0.1 | 0.0 | 0.3 | |||||
| “ ” | 00 34 47.70 | 00 21 37.0 | 16ffFields where the background has an overwhelming majority of background regions with zero red sequence sources and thus we do not report a significance of the measurement. | |||||||||
| “ ” | 00 34 46.45 | 00 23 33.3 | 29 | 3.1 | 1.4 | |||||||
| COBRA005837.2+011326hhFields that are cluster candidates according to either the 1 or 2 analysis in Paterno-Mahler et al. (2017). | 00 58 37.20 | +01 13 26.0 | 28 | 4.4 | 4.0eeFields where overdensities are measured with a magnitude limit of m*+1. | 39 | 3.1 | 1.9eeFields where overdensities are measured with a magnitude limit of m*+1. | 2.2 | |||
| “ ” | 00 58 36.47 | +01 13 26.4 | 27 | 4.9 | 4.4eeFields where overdensities are measured with a magnitude limit of m*+1. | |||||||
| “ ” | 00 58 35.45 | +01 13 15.7 | 39 | 3.2 | 2.0eeFields where overdensities are measured with a magnitude limit of m*+1. | |||||||
| COBRA010329.5+004055 | 01 03 29.50 | +00 40 55.0 | 16ffFields where the background has an overwhelming majority of background regions with zero red sequence sources and thus we do not report a significance of the measurement. | 22 | 1.4 | 0.7 | 0.0 | |||||
| “ ” | 01 03 27.18 | +00 42 16.0 | 23ffFields where the background has an overwhelming majority of background regions with zero red sequence sources and thus we do not report a significance of the measurement. | |||||||||
| “ ” | 01 03 28.15 | +00 39 30.7 | 23 | 1.2 | 0.5 | |||||||
| COBRA012058.9+002140hhFields that are cluster candidates according to either the 1 or 2 analysis in Paterno-Mahler et al. (2017). | 01 20 58.90 | +00 21 40.0 | 36 | 4.4 | 3.8eeFields where overdensities are measured with a magnitude limit of m*+1. | 68 | 9.6 | 5.0eeFields where overdensities are measured with a magnitude limit of m*+1. | 4.3 | |||
| “ ” | 01 20 58.17 | +00 21 46.8 | 33 | 3.6 | 3.1eeFields where overdensities are measured with a magnitude limit of m*+1. | |||||||
| “ ” | 01 20 57.87 | +00 21 49.8 | 68 | 8.9 | 4.6eeFields where overdensities are measured with a magnitude limit of m*+1. | |||||||
| COBRA014147.2092812ddFields with no redshift estimate. Because of this, we are unable to do a red sequence analysis and thus present no overdensity measurements. | 01 41 47.20 | 09 28 12.0 | 0.8 | |||||||||
| COBRA014741.6004706 | 01 47 41.60 | 00 47 06.0 | 23 | 3.5 | 2.8eeFields where overdensities are measured with a magnitude limit of m*+1. | 24 | 0.8 | 0.7eeFields where overdensities are measured with a magnitude limit of m*+1. | 1.6 | |||
| “ ” | 01 47 41.29 | 00 46 36.1 | 23 | 3.6 | 2.9eeFields where overdensities are measured with a magnitude limit of m*+1. | |||||||
| “ ” | 01 47 40.31 | 00 46 29.1 | 24 | 0.8 | 0.6eeFields where overdensities are measured with a magnitude limit of m*+1. | |||||||
| COBRA015313.0001018 | 01 53 13.00 | 00 10 18.0 | 6 | 0.1 | 0.1eeFields where overdensities are measured with a magnitude limit of m*+1. | 0.3 | ||||||
| “ ” | 01 53 19.46 | 00 10 22.1 | 12 | 1.6 | 2.3eeFields where overdensities are measured with a magnitude limit of m*+1. | |||||||
| COBRA020823.8011536ddFields with no redshift estimate. Because of this, we are unable to do a red sequence analysis and thus present no overdensity measurements. | 02 08 23.80 | 01 15 36.0 | 1.1 | |||||||||
| COBRA025059.6+001241ddFields with no redshift estimate. Because of this, we are unable to do a red sequence analysis and thus present no overdensity measurements.hhFields that are cluster candidates according to either the 1 or 2 analysis in Paterno-Mahler et al. (2017). | 02 50 59.60 | +00 12 41.0 | 4.0 | |||||||||
| COBRA031807.2+002133 | 03 18 07.20 | +00 21 33.0 | 14 | 1.1 | 1.3eeFields where overdensities are measured with a magnitude limit of m*+1. | 0.2 | ||||||
| “ ” | 03 18 00.31 | +00 22 47.6 | 14 | 1.6 | 1.9eeFields where overdensities are measured with a magnitude limit of m*+1. | |||||||
| COBRA072805.2+312857hhFields that are cluster candidates according to either the 1 or 2 analysis in Paterno-Mahler et al. (2017). | 07 28 05.20 | +31 28 57.0 | 36ffFields where the background has an overwhelming majority of background regions with zero red sequence sources and thus we do not report a significance of the measurement. | 47 | 7.9 | 3.6 | 3.5 | |||||
| “ ” | 07 28 05.20 | +31 28 58.7 | 37ffFields where the background has an overwhelming majority of background regions with zero red sequence sources and thus we do not report a significance of the measurement. | |||||||||
| “ ” | 07 28 06.26 | +31 28 52.1 | 46 | 6.3 | 2.9 | |||||||
| COBRA073320.4+272103hhFields that are cluster candidates according to either the 1 or 2 analysis in Paterno-Mahler et al. (2017). | 07 33 20.40 | +27 21 03.0 | 45ffFields where the background has an overwhelming majority of background regions with zero red sequence sources and thus we do not report a significance of the measurement. | 42 | 3.4 | 1.6 | 3.6 | |||||
| “ ” | 07 33 20.40 | +27 21 03.0 | 45ffFields where the background has an overwhelming majority of background regions with zero red sequence sources and thus we do not report a significance of the measurement. | |||||||||
| “ ” | 07 33 20.70 | +27 21 41.0 | 39 | 2.7 | 1.2 | |||||||
| COBRA073406.1+293316hhFields that are cluster candidates according to either the 1 or 2 analysis in Paterno-Mahler et al. (2017).ggFields where the host galaxy is fainter than our magnitude limit, and thus why we don’t detect at least one galaxy of the expected color. | 07 34 06.10 | +29 33 16.0 | 4.0 | |||||||||
| COBRA074025.5+485124hhFields that are cluster candidates according to either the 1 or 2 analysis in Paterno-Mahler et al. (2017). | 07 40 25.50 | +48 51 24.0 | 33 | 2.6 | 3.8 | 2.5 | ||||||
| “ ” | 07 40 24.24 | +48 51 08.3 | 29 | 1.9 | 2.9 | |||||||
| COBRA074410.9+274011hhFields that are cluster candidates according to either the 1 or 2 analysis in Paterno-Mahler et al. (2017). | 07 44 10.90 | +27 40 11.0 | 41 | 2.6 | 4.3 | 3.6 | ||||||
| “ ” | 07 44 09.15 | +27 41 03.0 | 45 | 4.0 | 6.7 | |||||||
| COBRA074527.0+505317 | 07 45 27.00 | +50 53 17.0 | 12 | 0.2 | 0.2eeFields where overdensities are measured with a magnitude limit of m*+1. | 1.6 | ||||||
| “ ” | 07 45 25.67 | +50 54 13.6 | 14 | 0.1 | 0.1eeFields where overdensities are measured with a magnitude limit of m*+1. | |||||||
| COBRA075516.6+171457hhFields that are cluster candidates according to either the 1 or 2 analysis in Paterno-Mahler et al. (2017). | 07 55 16.60 | +17 14 57.0 | 29 | 2.7 | 2.4eeFields where overdensities are measured with a magnitude limit of m*+1. | 46 | 5.4 | 4.4eeFields where overdensities are measured with a magnitude limit of m*+1. | 3.3 | |||
| “ ” | 07 55 16.8 | +17 16 41.2 | 39 | 6.4 | 5.6eeFields where overdensities are measured with a magnitude limit of m*+1. | |||||||
| “ ” | 07 55 17.54 | +17 14 59.9 | 52 | 6.3 | 5.1eeFields where overdensities are measured with a magnitude limit of m*+1. | |||||||
| COBRA082643.4+143427 | 08 26 43.40 | +14 34 27.0 | 23ffFields where the background has an overwhelming majority of background regions with zero red sequence sources and thus we do not report a significance of the measurement. | 19 | 3.3 | 1.5 | 0.1 | |||||
| “ ” | 08 26 43.40 | +14 34 27.0 | 23ffFields where the background has an overwhelming majority of background regions with zero red sequence sources and thus we do not report a significance of the measurement. | |||||||||
| “ ” | 08 26 47.77 | +14 35 05.0 | 24 | 0.8 | 0.4 | |||||||
| COBRA090102.7+420746hhFields that are cluster candidates according to either the 1 or 2 analysis in Paterno-Mahler et al. (2017). | 09 01 02.70 | +42 07 46.0 | 21ffFields where the background has an overwhelming majority of background regions with zero red sequence sources and thus we do not report a significance of the measurement. | 20 | 0.6 | 0.3 | 0.3 | |||||
| “ ” | 09 01 22.5 | +42 09 59.9 | 21ffFields where the background has an overwhelming majority of background regions with zero red sequence sources and thus we do not report a significance of the measurement. | |||||||||
| “ ” | 09 01 00.36 | +42 07 41.9 | 25 | 1.3 | 0.6 | |||||||
| COBRA090745.5+382740hhFields that are cluster candidates according to either the 1 or 2 analysis in Paterno-Mahler et al. (2017). | 09 07 45.50 | +38 27 40.0 | 26ffFields where the background has an overwhelming majority of background regions with zero red sequence sources and thus we do not report a significance of the measurement. | 32 | 0.3 | 0.2 | 1.0 | |||||
| “ ” | 09 07 32.56 | +38 27 48.1 | 26ffFields where the background has an overwhelming majority of background regions with zero red sequence sources and thus we do not report a significance of the measurement. | |||||||||
| “ ” | 09 07 44.18 | +38 27 38.2 | 26 | 1.2 | 0.6 | |||||||
| COBRA092305.0+275832hhFields that are cluster candidates according to either the 1 or 2 analysis in Paterno-Mahler et al. (2017). | 09 23 04.78 | +27 58 38.2 | 21 | 0.7 | 1.0eeFields where overdensities are measured with a magnitude limit of m*+1. | 9 | 0.4 | 0.5eeFields where overdensities are measured with a magnitude limit of m*+1. | 3.2 | |||
| “ ” | 09 23 04.10 | +27 58 46.3 | 22 | 0.7 | 1.1eeFields where overdensities are measured with a magnitude limit of m*+1. | |||||||
| “ ” | 09 23 11.46 | +27 57 42.2 | 16 | 0.8 | 1.0eeFields where overdensities are measured with a magnitude limit of m*+1. | |||||||
| COBRA093726.6+365550hhFields that are cluster candidates according to either the 1 or 2 analysis in Paterno-Mahler et al. (2017). | 09 37 26.60 | +36 55 50.02 | 32iiFields where a two galaxy red sequence detection is mathematically above a 2 measurement and thus we do not report the measurement. | 1.8 | ||||||||
| “ ” | 09 37 25.46 | +36 56 01.4 | 32iiFields where a two galaxy red sequence detection is mathematically above a 2 measurement and thus we do not report the measurement. | |||||||||
| COBRA100745.5+580713hhFields that are cluster candidates according to either the 1 or 2 analysis in Paterno-Mahler et al. (2017). | 10 07 45.50 | +58 07 13.0 | 24 | 3.2 | 2.6eeFields where overdensities are measured with a magnitude limit of m*+1. | 40 | 4.4 | 3.4eeFields where overdensities are measured with a magnitude limit of m*+1. | 3.3 | |||
| “ ” | 10 07 45.60 | +58 07 27.6 | 25 | 2.9 | 2.4eeFields where overdensities are measured with a magnitude limit of m*+1. | |||||||
| “ ” | 10 07 45.09 | +58 07 29.8 | 41 | 4.6 | 3.6eeFields where overdensities are measured with a magnitude limit of m*+1. | |||||||
| COBRA100841.7+372513hhFields that are cluster candidates according to either the 1 or 2 analysis in Paterno-Mahler et al. (2017). | 10 08 41.70 | +37 25 13.0 | 35 | 3.7 | 5.0 | 39 | 6.8 | 3.1 | 3.3 | |||
| “ ” | 10 08 43.08 | +37 25 23.7 | 34 | 3.4 | 4.5 | |||||||
| “ ” | 10 08 41.53 | +37 25 32.3 | 40 | 9.0 | 4.1 | |||||||
| COBRA103256.8+262335hhFields that are cluster candidates according to either the 1 or 2 analysis in Paterno-Mahler et al. (2017). | 10 32 56.80 | +26 23 35.0 | 31ffFields where the background has an overwhelming majority of background regions with zero red sequence sources and thus we do not report a significance of the measurement. | 34 | 5.0 | 2.3 | 2.1 | |||||
| “ ” | 10 32 56.80 | +26 23 35.0 | 31ffFields where the background has an overwhelming majority of background regions with zero red sequence sources and thus we do not report a significance of the measurement. | |||||||||
| “ ” | 10 32 54.49 | +26 23 33.3 | 31 | 4.3 | 2.0 | |||||||
| COBRA103434.2+310352hhFields that are cluster candidates according to either the 1 or 2 analysis in Paterno-Mahler et al. (2017). | 10 34 34.20 | +31 03 52.0 | 40 | 4.0 | 5.8 | 2.9 | ||||||
| “ ” | 10 34 33.55 | +31 03 53.0 | 42 | 4.2 | 6.1 | |||||||
| COBRA104254.8+290719hhFields that are cluster candidates according to either the 1 or 2 analysis in Paterno-Mahler et al. (2017). | 10 42 54.80 | +29 07 19.0 | 32 | 1.7 | 3.4eeFields where overdensities are measured with a magnitude limit of m*+1. | 41 | 7.0 | 3.2 | 3.5 | |||
| “ ” | 10 42 53.41 | +29 07 25.2 | 36 | 2.4 | 4.9eeFields where overdensities are measured with a magnitude limit of m*+1. | |||||||
| “ ” | 10 42 55.45 | +29 07 22.7 | 44 | 7.7 | 3.5 | |||||||
| COBRA104641.5+282028hhFields that are cluster candidates according to either the 1 or 2 analysis in Paterno-Mahler et al. (2017). | 10 46 41.00 | +28 20 28.0 | 46ffFields where the background has an overwhelming majority of background regions with zero red sequence sources and thus we do not report a significance of the measurement. | 4.0 | ||||||||
| “ ” | 10 46 41.52 | +28 20 25.8 | 46ffFields where the background has an overwhelming majority of background regions with zero red sequence sources and thus we do not report a significance of the measurement. | |||||||||
| COBRA110903.2002543hhFields that are cluster candidates according to either the 1 or 2 analysis in Paterno-Mahler et al. (2017). | 11 09 03.20 | 00 26 43.0 | 18iiFields where a two galaxy red sequence detection is mathematically above a 2 measurement and thus we do not report the measurement. | 24 | 0.2 | 0.1 | 0.0 | |||||
| “ ” | 11 08 58.85 | 00 24 46.5 | 42iiFields where a two galaxy red sequence detection is mathematically above a 2 measurement and thus we do not report the measurement. | |||||||||
| “ ” | 11 09 02.06 | 00 27 10.4 | 22 | 2.7 | 1.2 | |||||||
| COBRA111707.3+305307hhFields that are cluster candidates according to either the 1 or 2 analysis in Paterno-Mahler et al. (2017). | 11 17 07.30 | +30 53 07.0 | 13iiFields where a two galaxy red sequence detection is mathematically above a 2 measurement and thus we do not report the measurement. | 2.2 | ||||||||
| “ ” | 11 17 05.78 | +30 53 02.9 | 15iiFields where a two galaxy red sequence detection is mathematically above a 2 measurement and thus we do not report the measurement. | |||||||||
| COBRA113733.8+300010hhFields that are cluster candidates according to either the 1 or 2 analysis in Paterno-Mahler et al. (2017). | 11 37 33.80 | +30 00 10.0 | 36 | 4.2 | 4.1eeFields where overdensities are measured with a magnitude limit of m*+1. | 55 | 0.1 | 0.0eeFields where overdensities are measured with a magnitude limit of m*+1. | 3.0 | |||
| “ ” | 11 37 33.36 | +30 00 07.8 | 36 | 4.0 | 3.9eeFields where overdensities are measured with a magnitude limit of m*+1. | |||||||
| “ ” | 11 37 30.82 | +30 00 01.2 | 59 | 0.4 | 0.2eeFields where overdensities are measured with a magnitude limit of m*+1. | |||||||
| COBRA120654.6+290742 | 12 06 54.60 | +29 07 42.0 | 30iiFields where a two galaxy red sequence detection is mathematically above a 2 measurement and thus we do not report the measurement. | 1.6 | ||||||||
| “ ” | 12 06 53.94 | +29 07 44.3 | 30 | 3.1 | 2.4eeFields where overdensities are measured with a magnitude limit of m*+1. | |||||||
| COBRA121128.5+505253hhFields that are cluster candidates according to either the 1 or 2 analysis in Paterno-Mahler et al. (2017). | 12 11 28.50 | +50 52 53.0 | 36iiFields where a two galaxy red sequence detection is mathematically above a 2 measurement and thus we do not report the measurement. | 41 | 3.9 | 1.8 | 3.2 | |||||
| “ ” | 12 11 22.79 | +50 54 23.7 | 30iiFields where a two galaxy red sequence detection is mathematically above a 2 measurement and thus we do not report the measurement. | |||||||||
| “ ” | 12 11 25.79 | +50 52 16.0 | 45 | 6.7 | 3.1 | |||||||
| COBRA121623.4+383822ddFields with no redshift estimate. Because of this, we are unable to do a red sequence analysis and thus present no overdensity measurements. | 12 16 23.40 | +38 38 22.0 | 0.7 | |||||||||
| COBRA121712.2+241525hhFields that are cluster candidates according to either the 1 or 2 analysis in Paterno-Mahler et al. (2017). | 12 17 12.20 | +24 15 25.0 | 46 | 7.2 | 6.2eeFields where overdensities are measured with a magnitude limit of m*+1. | 78 | 6.8 | 3.2eeFields where overdensities are measured with a magnitude limit of m*+1. | 4.4 | |||
| “ ” | 12 17 10.69 | +24 15 31.83 | 45 | 7.0 | 6.1eeFields where overdensities are measured with a magnitude limit of m*+1. | |||||||
| “ ” | 12 17 11.99 | +24 15 22.6 | 79 | 6.8 | 3.1eeFields where overdensities are measured with a magnitude limit of m*+1. | |||||||
| COBRA122616.2+190626ddFields with no redshift estimate. Because of this, we are unable to do a red sequence analysis and thus present no overdensity measurements. | 12 26 16.2 | +19 06 26.0 | 0.3 | |||||||||
| COBRA123347.0+354133 | 12 33 47.00 | +35 41 33.0 | 19 | 0.6 | 0.5eeFields where overdensities are measured with a magnitude limit of m*+1. | 1.4 | ||||||
| “ ” | 12 33 49.84 | +35 41 10.3 | 18 | 0.4 | 0.3eeFields where overdensities are measured with a magnitude limit of m*+1. | |||||||
| COBRA123940.7+280828hhFields that are cluster candidates according to either the 1 or 2 analysis in Paterno-Mahler et al. (2017). | 12 39 40.70 | +28 08 28.0 | 37 | 3.5 | 2.9eeFields where overdensities are measured with a magnitude limit of m*+1. | 2.7 | ||||||
| “ ” | 12 39 39.68 | +28 08 32.2 | 38 | 3.8 | 3.1eeFields where overdensities are measured with a magnitude limit of m*+1. | |||||||
| COBRA125047.4+142355hhFields that are cluster candidates according to either the 1 or 2 analysis in Paterno-Mahler et al. (2017). | 12 50 47.40 | +14 23 55.0 | 32 | 3.8 | 2.9eeFields where overdensities are measured with a magnitude limit of m*+1. | 3.0 | ||||||
| “ ” | 12 50 47.39 | +14 24 07.6 | 36 | 4.6 | 3.5eeFields where overdensities are measured with a magnitude limit of m*+1. | |||||||
| COBRA125209.6001553 | 12 52 09.60 | 00 15 53.0 | 12 | 0.7 | 0.8eeFields where overdensities are measured with a magnitude limit of m*+1. | 1.8 | ||||||
| “ ” | 12 52 06.03 | 00 16 08.1 | 13 | 1.1 | 1.2eeFields where overdensities are measured with a magnitude limit of m*+1. | |||||||
| COBRA130729.2+274659 | 13 07 29.20 | +27 46 59.0 | 19 | 0.4 | 0.7 | 0.4 | ||||||
| “ ” | 13 07 37.96 | +27 48 33.2 | 25 | 2.9 | 4.5 | |||||||
| COBRA131854.0+231153hhFields that are cluster candidates according to either the 1 or 2 analysis in Paterno-Mahler et al. (2017). | 13 18 54.00 | +23 11 53.0 | 30ffFields where the background has an overwhelming majority of background regions with zero red sequence sources and thus we do not report a significance of the measurement. | 2.1 | ||||||||
| “ ” | 13 18 54.04 | +23 11 51.5 | 30ffFields where the background has an overwhelming majority of background regions with zero red sequence sources and thus we do not report a significance of the measurement. | |||||||||
| COBRA132903.2+253110hhFields that are cluster candidates according to either the 1 or 2 analysis in Paterno-Mahler et al. (2017). | 13 29 03.20 | +25 31 10.0 | 22 | 0.7 | 0.7eeFields where overdensities are measured with a magnitude limit of m*+1. | 1.4 | ||||||
| “ ” | 13 29 02.34 | +25 30 09.1 | 22 | 0.7 | 0.8eeFields where overdensities are measured with a magnitude limit of m*+1. | |||||||
| COBRA133227.8+213507 | 13 32 27.80 | +21 35 07.0 | 22ffFields where the background has an overwhelming majority of background regions with zero red sequence sources and thus we do not report a significance of the measurement. | 26 | 0.2 | 0.1 | 0.5 | |||||
| “ ” | 13 32 27.80 | +21 35 07.0 | 22ffFields where the background has an overwhelming majority of background regions with zero red sequence sources and thus we do not report a significance of the measurement. | |||||||||
| “ ” | 13 32 25.89 | +21 34 13.1 | 26 | 0.8 | 0.4 | |||||||
| COBRA133507.1+132329 | 13 35 07.10 | +13 23 39.0 | 21 | 0.9 | 1.7 | 1.9 | ||||||
| “ ” | 13 35 08.01 | +13 23 20.1 | 22 | 1.3 | 2.5 | |||||||
| COBRA134104.4+055841hhFields that are cluster candidates according to either the 1 or 2 analysis in Paterno-Mahler et al. (2017). | 13 41 04.40 | +05 58 41.0 | 19 | 2.2 | 2.2eeFields where overdensities are measured with a magnitude limit of m*+1. | 3.3 | ||||||
| “ ” | 13 41 03.82 | +05 58 41.4 | 22 | 2.7 | 2.6eeFields where overdensities are measured with a magnitude limit of m*+1. | |||||||
| COBRA135136.2+543955hhFields that are cluster candidates according to either the 1 or 2 analysis in Paterno-Mahler et al. (2017). | 13 51 36.20 | +54 39 55.0 | 31 | 6.4 | 6.7eeFields where overdensities are measured with a magnitude limit of m*+1. | 36 | 3.4 | 3.0eeFields where overdensities are measured with a magnitude limit of m*+1. | 4.1 | |||
| “ ” | 13 51 35.45 | +54 39 43.8 | 32 | 7.0 | 7.3eeFields where overdensities are measured with a magnitude limit of m*+1. | |||||||
| “ ” | 13 51 34.70 | +54 39 46.3 | 38 | 3.8 | 3.3eeFields where overdensities are measured with a magnitude limit of m*+1. | |||||||
| COBRA135450.6+251240ddFields with no redshift estimate. Because of this, we are unable to do a red sequence analysis and thus present no overdensity measurements.hhFields that are cluster candidates according to either the 1 or 2 analysis in Paterno-Mahler et al. (2017). | 13 54 50.60 | +25 12 40.0 | 3.2 | |||||||||
| COBRA135838.1+384722hhFields that are cluster candidates according to either the 1 or 2 analysis in Paterno-Mahler et al. (2017). | 13 59 38.10 | +38 47 22.0 | 21 | 1.1 | 1.1eeFields where overdensities are measured with a magnitude limit of m*+1. | 44 | 0.0 | 0.0eeFields where overdensities are measured with a magnitude limit of m*+1. | 1.1 | |||
| “ ” | 13 58 30.31 | +38 47 36.6 | 28 | 2.7 | 2.6eeFields where overdensities are measured with a magnitude limit of m*+1. | |||||||
| “ ” | 13 58 41.84 | +38 48 40.7 | 68 | 5.4 | 3.1eeFields where overdensities are measured with a magnitude limit of m*+1. | |||||||
| COBRA140119.7+061204ddFields with no redshift estimate. Because of this, we are unable to do a red sequence analysis and thus present no overdensity measurements. | 14 01 19.27 | +06 12 04.0 | 1.9 | |||||||||
| COBRA140935.3+210347hhFields that are cluster candidates according to either the 1 or 2 analysis in Paterno-Mahler et al. (2017). | 14 09 35.30 | +21 03 47.0 | 29ffFields where the background has an overwhelming majority of background regions with zero red sequence sources and thus we do not report a significance of the measurement. | 2.5 | ||||||||
| “ ” | 14 09 35.34 | +21 03 44.2 | 28ffFields where the background has an overwhelming majority of background regions with zero red sequence sources and thus we do not report a significance of the measurement. | |||||||||
| COBRA141155.2+341510hhFields that are cluster candidates according to either the 1 or 2 analysis in Paterno-Mahler et al. (2017). | 14 11 55.20 | +34 15 10.0 | 32ffFields where the background has an overwhelming majority of background regions with zero red sequence sources and thus we do not report a significance of the measurement. | 39 | 2.2 | 1.0 | 2.7 | |||||
| “ ” | 14 11 55.20 | +34 15 10.0 | 32ffFields where the background has an overwhelming majority of background regions with zero red sequence sources and thus we do not report a significance of the measurement. | |||||||||
| “ ” | 14 11 46.31 | +34 14 35.5 | 37 | 5.2 | 2.4 | |||||||
| COBRA142238.1+251433hhFields that are cluster candidates according to either the 1 or 2 analysis in Paterno-Mahler et al. (2017). | 14 22 38.10 | +25 14 33.0 | 37 | 3.7 | 3.7eeFields where overdensities are measured with a magnitude limit of m*+1. | 2.9 | ||||||
| “ ” | 14 22 34.16 | +25 13 54.7 | 38 | 4.8 | 4.7eeFields where overdensities are measured with a magnitude limit of m*+1. | |||||||
| COBRA142242.5+041439 | 14 22 42.50 | +04 14 39.0 | 19 | 0.2 | 0.2eeFields where overdensities are measured with a magnitude limit of m*+1. | 0.1 | ||||||
| “ ” | 14 22 39.51 | +04 15 35.5 | 22 | 0.9 | 0.9eeFields where overdensities are measured with a magnitude limit of m*+1. | |||||||
| COBRA143518.7+174217 | 14 35 18.70 | +17 42 15.5 | 27 | 1.0 | 1.9 | 0.8 | ||||||
| “ ” | 14 35 14.80 | +17 42 41.0 | 25 | 0.8 | 1.6 | |||||||
| COBRA143817.6+491233hhFields that are cluster candidates according to either the 1 or 2 analysis in Paterno-Mahler et al. (2017). | 14 38 17.60 | +49 12 33.0 | 31 | 0.8 | 1.9 | 32 | 0.7 | 0.3 | 1.4 | |||
| “ ” | 14 38 11.70 | +49 12 29.5 | 35iiFields where a two galaxy red sequence detection is mathematically above a 2 measurement and thus we do not report the measurement. | |||||||||
| “ ” | 14 38 10.72 | +49 12 11.8 | 35 | 3.0 | 1.4 | |||||||
| COBRA144207.1+562522 | 14 42 07.10 | +56 25 22.0 | 17ffFields where the background has an overwhelming majority of background regions with zero red sequence sources and thus we do not report a significance of the measurement. | 32 | 3.8 | 1.7 | 1.1 | |||||
| “ ” | 14 42 06.80 | +56 25 21.8 | 17ffFields where the background has an overwhelming majority of background regions with zero red sequence sources and thus we do not report a significance of the measurement. | |||||||||
| “ ” | 14 42 06.51 | +56 25 40.5 | 31 | 3.2 | 1.5 | |||||||
| COBRA145023.3+340123hhFields that are cluster candidates according to either the 1 or 2 analysis in Paterno-Mahler et al. (2017). | 14 50 20.90 | +34 01 33.0 | 29iiFields where a two galaxy red sequence detection is mathematically above a 2 measurement and thus we do not report the measurement. | 3.6 | ||||||||
| “ ” | 14 50 23.34 | +34 01 29.5 | 38 | 2.6 | 5.2 | |||||||
| COBRA145416.9+135201hhFields that are cluster candidates according to either the 1 or 2 analysis in Paterno-Mahler et al. (2017).ggFields where the host galaxy is fainter than our magnitude limit, and thus why we don’t detect at least one galaxy of the expected color. | 14 54 16.90 | +13 52 01.0 | 30ffFields where the background has an overwhelming majority of background regions with zero red sequence sources and thus we do not report a significance of the measurement. | 2.2 | ||||||||
| “ ” | 14 54 16.90 | +13 52 01.0 | 30ffFields where the background has an overwhelming majority of background regions with zero red sequence sources and thus we do not report a significance of the measurement. | |||||||||
| COBRA145656.0+501748hhFields that are cluster candidates according to either the 1 or 2 analysis in Paterno-Mahler et al. (2017). | 14 56 56.00 | +50 17 48.0 | 24 | 1.4 | 1.2eeFields where overdensities are measured with a magnitude limit of m*+1. | 38 | 0.9 | 0.5eeFields where overdensities are measured with a magnitude limit of m*+1. | 1.4 | |||
| “ ” | 14 56 56.61 | +50 17 50.4 | 26 | 1.8 | 1.6eeFields where overdensities are measured with a magnitude limit of m*+1. | |||||||
| “ ” | 14 56 59.71 | +50 17 43.4 | 34 | 2.1 | 1.1eeFields where overdensities are measured with a magnitude limit of m*+1. | |||||||
| COBRA150238.1+170146hhFields that are cluster candidates according to either the 1 or 2 analysis in Paterno-Mahler et al. (2017). | 15 02 38.10 | +17 01 46.0 | 27 | 1.7 | 2.2 | 0.8 | ||||||
| “ ” | 15 02 38.33 | +17 01 51.9 | 26 | 1.6 | 2.1 | |||||||
| COBRA151458.0011749hhFields that are cluster candidates according to either the 1 or 2 analysis in Paterno-Mahler et al. (2017). | 15 14 58.00 | 01 17 50.0 | 36 | 4.8 | 4.5eeFields where overdensities are measured with a magnitude limit of m*+1. | 4.3 | ||||||
| “ ” | 15 14 56.97 | 01 17 57.0 | 36 | 4.8 | 4.5eeFields where overdensities are measured with a magnitude limit of m*+1. | |||||||
| COBRA152647.5+554859hhFields that are cluster candidates according to either the 1 or 2 analysis in Paterno-Mahler et al. (2017). | 15 26 47.50 | +55 48 59.0 | 29 | 2.1 | 3.3 | 1.6 | ||||||
| “ ” | 15 26 52.36 | +55 49 05.0 | 33 | 2.5 | 4.0 | |||||||
| COBRA152934.7+275416 | 15 29 34.96 | +27 54 16.0 | 33 | 0.7 | 1.8 | 1.8 | ||||||
| “ ” | 15 29 42.22 | +27 52 35.1 | 21 | 0.4 | 1.0 | |||||||
| COBRA153317.4+391804 | 15 33 17.40 | +39 18 04.0 | 16 | 0.3 | 0.2eeFields where overdensities are measured with a magnitude limit of m*+1. | 0.4 | ||||||
| “ ” | 15 33 17.29 | +39 17 18.6 | 22 | 1.5 | 1.2eeFields where overdensities are measured with a magnitude limit of m*+1. | |||||||
| COBRA154638.3+364420hhFields that are cluster candidates according to either the 1 or 2 analysis in Paterno-Mahler et al. (2017). | 15 46 38.30 | +36 44 20.0 | 23 | 1.2 | 1.2eeFields where overdensities are measured with a magnitude limit of m*+1. | 58 | 0.6 | 0.4eeFields where overdensities are measured with a magnitude limit of m*+1. | 1.3 | |||
| “ ” | 15 46 30.89 | +36 44 12.6 | 23 | 2.0 | 1.9eeFields where overdensities are measured with a magnitude limit of m*+1. | |||||||
| “ ” | 15 46 39.27 | +36 44 40.1 | 53 | 0.2 | 0.1eeFields where overdensities are measured with a magnitude limit of m*+1. | |||||||
| COBRA155000.5+294953 | 15 50 00.50 | +29 49 53.0 | 16ffFields where the background has an overwhelming majority of background regions with zero red sequence sources and thus we do not report a significance of the measurement. | 14 | 1.0 | 0.4 | 1.4 | |||||
| “ ” | 15 49 48.99 | +29 48 00.1 | 19ffFields where the background has an overwhelming majority of background regions with zero red sequence sources and thus we do not report a significance of the measurement. | |||||||||
| “ ” | 15 50 03.34 | +29 49 00.6 | 20 | 1.1 | 0.5 | |||||||
| COBRA155343.8+002513ddFields with no redshift estimate. Because of this, we are unable to do a red sequence analysis and thus present no overdensity measurements.hhFields that are cluster candidates according to either the 1 or 2 analysis in Paterno-Mahler et al. (2017). | 15 53 43.80 | +00 25 13.0 | 1.8 | |||||||||
| COBRA160815.0003613hhFields that are cluster candidates according to either the 1 or 2 analysis in Paterno-Mahler et al. (2017). | 16 08 15.00 | 00 36 13.0 | 40iiFields where a two galaxy red sequence detection is mathematically above a 2 measurement and thus we do not report the measurement. | 7.7 | ||||||||
| “ ” | 16 08 14.26 | 00 36 17.8 | 40iiFields where a two galaxy red sequence detection is mathematically above a 2 measurement and thus we do not report the measurement. | |||||||||
| COBRA161531.3+234249hhFields that are cluster candidates according to either the 1 or 2 analysis in Paterno-Mahler et al. (2017). | 16 15 31.30 | +23 42 49.0 | 24 | 1.6 | 1.4eeFields where overdensities are measured with a magnitude limit of m*+1. | 2.5 | ||||||
| “ ” | 16 15 29.99 | +23 42 45.5 | 26 | 2.0 | 1.8eeFields where overdensities are measured with a magnitude limit of m*+1. | |||||||
| COBRA162955.5+451607hhFields that are cluster candidates according to either the 1 or 2 analysis in Paterno-Mahler et al. (2017). | 16 29 55.50 | +45 16 07.0 | 31 | 3.4 | 3.0eeFields where overdensities are measured with a magnitude limit of m*+1. | 2.5 | ||||||
| “ ” | 16 29 55.56 | +45 15 07.2 | 39 | 4.8 | 4.1eeFields where overdensities are measured with a magnitude limit of m*+1. | |||||||
| COBRA163745.9+521735 | 16 37 45.90 | +52 17 35.0 | 1.8 | |||||||||
| COBRA164551.2+153230hhFields that are cluster candidates according to either the 1 or 2 analysis in Paterno-Mahler et al. (2017). | 16 45 51.20 | +15 32 30.0 | 17 | 1.5 | 1.4eeFields where overdensities are measured with a magnitude limit of m*+1. | 2.7 | ||||||
| “ ” | 16 45 49.24 | +15 31 58.8 | 18 | 2.1 | 2.0eeFields where overdensities are measured with a magnitude limit of m*+1. | |||||||
| COBRA164611.2+512915hhFields that are cluster candidates according to either the 1 or 2 analysis in Paterno-Mahler et al. (2017). | 16 46 11.20 | +51 29 15.0 | 26 | 5.3 | 8.5eeFields where overdensities are measured with a magnitude limit of m*+1. | 26 | 5.5 | 6.6eeFields where overdensities are measured with a magnitude limit of m*+1. | 2.2 | |||
| “ ” | 16 46 11.57 | +51 29 52.2 | 22 | 4.5 | 7.3eeFields where overdensities are measured with a magnitude limit of m*+1. | |||||||
| “ ” | 16 46 09.03 | +51 28 54.7 | 23 | 4.7 | 5.6eeFields where overdensities are measured with a magnitude limit of m*+1. | |||||||
| COBRA164951.6+310818hhFields that are cluster candidates according to either the 1 or 2 analysis in Paterno-Mahler et al. (2017). | 16 49 51.60 | +31 08 18.0 | 18 | 2.5 | 2.8eeFields where overdensities are measured with a magnitude limit of m*+1. | 2.5 | ||||||
| “ ” | 16 49 53.33 | +31 07 49.4 | 17 | 2.0 | 2.3eeFields where overdensities are measured with a magnitude limit of m*+1. | |||||||
| COBRA170105.4+360958hhFields that are cluster candidates according to either the 1 or 2 analysis in Paterno-Mahler et al. (2017). | 17 01 05.40 | +36 09 58.00 | 42 | 6.4 | 5.8eeFields where overdensities are measured with a magnitude limit of m*+1. | 4.1 | ||||||
| “ ” | 17 01 04.98 | +36 10 04.2 | 39 | 5.9 | 5.2eeFields where overdensities are measured with a magnitude limit of m*+1. | |||||||
| COBRA170443.9+295246hhFields that are cluster candidates according to either the 1 or 2 analysis in Paterno-Mahler et al. (2017). | 17 04 43.90 | +29 52 46.0 | 33 | 1.1 | 1.9 | 1.6 | ||||||
| “ ” | 17 04 43.71 | +29 52 43.4 | 32 | 1.1 | 1.8 | |||||||
| COBRA170614.5+243707hhFields that are cluster candidates according to either the 1 or 2 analysis in Paterno-Mahler et al. (2017). | 17 06 14.50 | +25 37 07.0 | 41 | 6.1 | 5.5eeFields where overdensities are measured with a magnitude limit of m*+1. | 4.6 | ||||||
| “ ” | 17 06 14.54 | +24 36 53.2 | 39 | 5.9 | 5.3eeFields where overdensities are measured with a magnitude limit of m*+1. | |||||||
| COBRA171231.4+243528ddFields with no redshift estimate. Because of this, we are unable to do a red sequence analysis and thus present no overdensity measurements.hhFields that are cluster candidates according to either the 1 or 2 analysis in Paterno-Mahler et al. (2017). | 17 12 31.40 | +24 35 28.0 | 1.8 | |||||||||
| COBRA171330.9+423502 | 17 13 30.90 | +42 35 02.0 | 19 | 1.9 | 1.5eeFields where overdensities are measured with a magnitude limit of m*+1. | 0.3 | ||||||
| “ ” | 17 13 29.85 | +42 35 18.9 | 17 | 1.0 | 0.8eeFields where overdensities are measured with a magnitude limit of m*+1. | |||||||
| COBRA172248.2+542400hhFields that are cluster candidates according to either the 1 or 2 analysis in Paterno-Mahler et al. (2017). | 17 22 48.20 | +54 24 00.0 | 29 | 1.5 | 2.2 | 32 | 2.8 | 1.3 | 2.4 | |||
| “ ” | 17 22 48.62 | +54 23 56.7 | 30 | 1.6 | 2.4 | |||||||
| “ ” | 17 22 49.89 | +54 23 37.3 | 43 | 4.0 | 1.8 | |||||||
| COBRA172655.5+281841ddFields with no redshift estimate. Because of this, we are unable to do a red sequence analysis and thus present no overdensity measurements.hhFields that are cluster candidates according to either the 1 or 2 analysis in Paterno-Mahler et al. (2017). | 17 26 55.50 | +28 18 41.0 | 2.2 | |||||||||
| COBRA220852.0002724ggFields where the host galaxy is fainter than our magnitude limit, and thus why we don’t detect at least one galaxy of the expected color. | 22 08 52.00 | 00 27 24.0 | 14ffFields where the background has an overwhelming majority of background regions with zero red sequence sources and thus we do not report a significance of the measurement. | 1.5 | ||||||||
| “ ” | 22 08 52.00 | 00 27 24.0 | 14ffFields where the background has an overwhelming majority of background regions with zero red sequence sources and thus we do not report a significance of the measurement. | |||||||||
| COBRA221605.1081335hhFields that are cluster candidates according to either the 1 or 2 analysis in Paterno-Mahler et al. (2017). | 22 16 05.10 | 08 13 35.0 | 23 | 2.7 | 2.3eeFields where overdensities are measured with a magnitude limit of m*+1. | 29 | 1.0 | 0.7eeFields where overdensities are measured with a magnitude limit of m*+1. | 2.4 | |||
| “ ” | 22 16 02.88 | 08 14 14.6 | 21 | 2.2 | 1.9eeFields where overdensities are measured with a magnitude limit of m*+1. | |||||||
| “ ” | 22 16 04.65 | 08 13 36.0 | 26 | 0.5 | 0.3eeFields where overdensities are measured with a magnitude limit of m*+1. | |||||||
| COBRA222729.1+000522hhFields that are cluster candidates according to either the 1 or 2 analysis in Paterno-Mahler et al. (2017). | 22 27 29.10 | +00 05 22.0 | 31ffFields where the background has an overwhelming majority of background regions with zero red sequence sources and thus we do not report a significance of the measurement. | 34 | 1.3 | 0.6 | 2.1 | |||||
| “ ” | 22 27 39.28 | +00 05 34.9 | 41ffFields where the background has an overwhelming majority of background regions with zero red sequence sources and thus we do not report a significance of the measurement. | |||||||||
| “ ” | 22 27 36.06 | +00 04 58.4 | 45 | 6.7 | 3.1 | |||||||
| COBRA223506.9094819ddFields with no redshift estimate. Because of this, we are unable to do a red sequence analysis and thus present no overdensity measurements. | 22 36 06.90 | 09 48 19.0 | 0.8 | |||||||||
| COBRA223634.5012119 | 22 36 34.50 | 01 21 19.0 | 13 | 0.2 | 0.2eeFields where overdensities are measured with a magnitude limit of m*+1. | 0.7 | ||||||
| “ ” | 22 36 30.02 | 01 21 59.9 | 15 | 1.3 | 1.1eeFields where overdensities are measured with a magnitude limit of m*+1. | |||||||
| COBRA232345.9+002925 | 23 23 45.90 | +00 29 25.0 | 22 | 2.2 | 2.1eeFields where overdensities are measured with a magnitude limit of m*+1. | 0.8 | ||||||
| “ ” | 23 23 45.51 | +00 29 21.5 | 26 | 2.4 | 2.3eeFields where overdensities are measured with a magnitude limit of m*+1. | |||||||
| COBRA232457.8+005529 | 23 24 57.80 | +00 55 29.0 | 16ffFields where the background has an overwhelming majority of background regions with zero red sequence sources and thus we do not report a significance of the measurement. | 21 | 0.5 | 0.2 | 0.3 | |||||
| “ ” | 23 25 06.12 | +00 55 44.2 | 16ffFields where the background has an overwhelming majority of background regions with zero red sequence sources and thus we do not report a significance of the measurement. | |||||||||
| “ ” | 23 24 52.65 | +00 55 35.3 | 28 | 0.4 | 0.2 | |||||||
| COBRA233820.5005555 | 23 38 20.50 | 00 55 55.0 | 21 | 1.1 | 1.5 | 1.1 | ||||||
| “ ” | 23 38 18.18 | 00 56 18.5 | 19 | 0.4 | 0.6 | |||||||