Diffuse X-ray emission around an ultraluminous X-ray pulsar
Abstract
Ultraluminous X-ray sources (ULXs) are extragalactic X-ray emitters located off-center of their host galaxy and with a luminosity in excess of a few , if emitted isotropically.[1, 2] The discovery of periodic modulation revealed that in some ULXs the accreting compact object is a neutron star,[3, 4, 9, 6, 7] indicating luminosities substantially above their Eddington limit. The most extreme object in this respect is NGC 5907 ULX-1 (ULX1), with a peak luminosity that is 500 times its Eddington limit. During a Chandra observation to probe a low state of ULX1, we detected diffuse X-ray emission at the position of ULX1. Its diameter is arcsec and contains 25 photons, none below 0.8 keV. We interpret this extended structure as an expanding nebula powered by the wind of ULX1. Its diameter of about , characteristic energy of , and luminosity of imply a mechanical power of and an age . This interpretation suggests that a genuinely super-Eddington regime can be sustained for time scales much longer than the spin-up time of the neutron star powering the system. As the mechanical power from a single ULX nebula can rival the injection rate of cosmic rays of an entire galaxy,[8] ULX nebulae could be important cosmic ray accelerators.[9]
INAF–Istituto di Astrofisica Spaziale e Fisica Cosmica di Milano, via A. Corti 12, 20133 Milano, Italy
Scuola Universitaria Superiore IUSS Pavia, piazza della Vittoria 15, 27100 Pavia, Italy
INFN–Istituto Nazionale di Fisica Nucleare, Sezione di Pavia, via A. Bassi 6, 27100 Pavia, Italy
ESAC–European Space Astronomy Centre, Science Operations Departement, 28692 Villanueva de la Cañada, Madrid, Spain
INAF–Osservatorio Astronomico di Roma, via Frascati 33, 00078 Monteporzio Catone, Italy
Universidad Pontificia Comillas Madrid–ICAI, Calle Alberto Aguilera 25, 28015 Madrid, Spain
Department of Physics G. Occhialini, University of Milano–Bicocca, piazza dell’Ateneo Nuovo 1, 20126, Milano, Italy
INAF–Osservatorio Astronomico di Brera, via Brera 28, 20121 Milano, Italy
Institute of Astronomy, University of Cambridge, Madingley Road, Cambridge CB3 0HA, UK
INAF–Osservatorio Astronomico di Padova, vicolo dell’Osservatorio 5, 35122 Padova, Italy
∗e-mail: andrea.belfiore@inaf.it
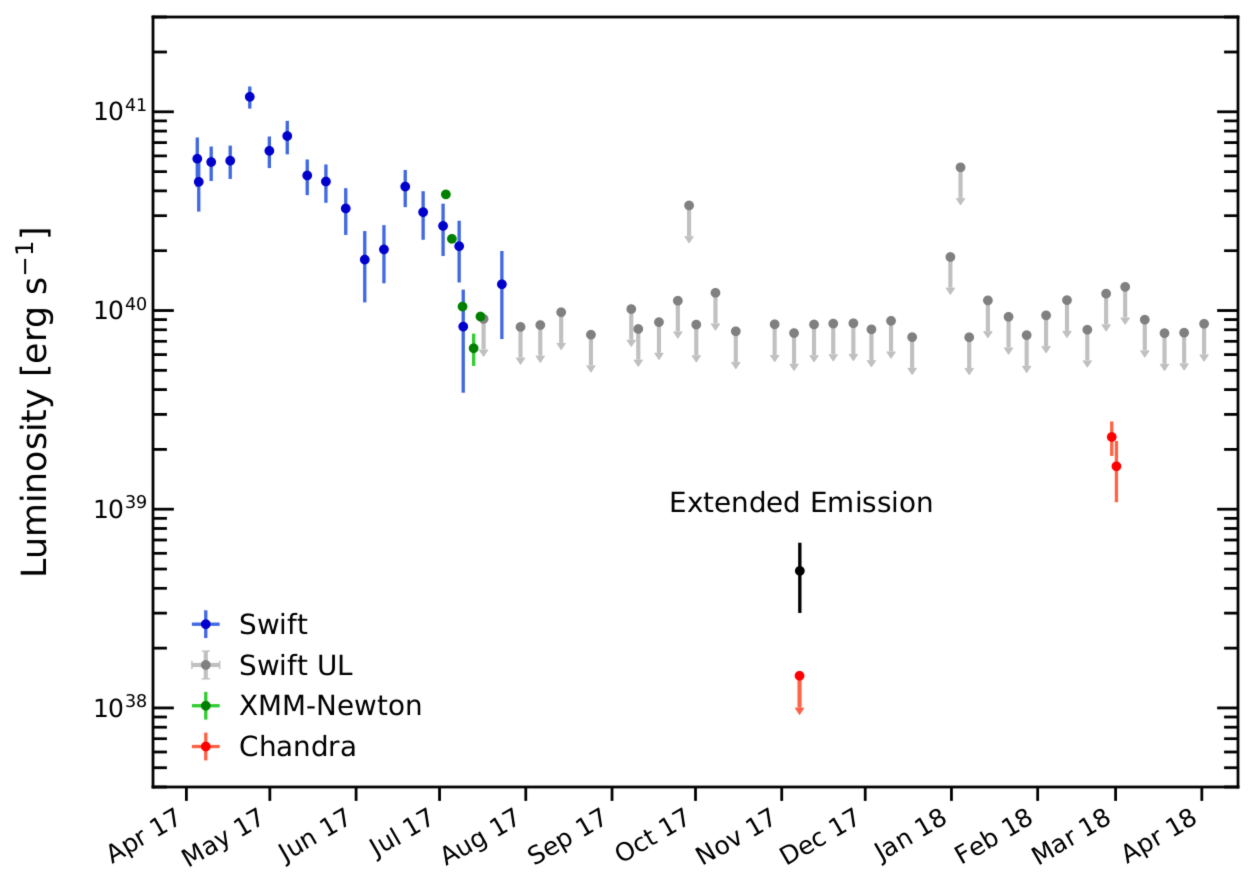
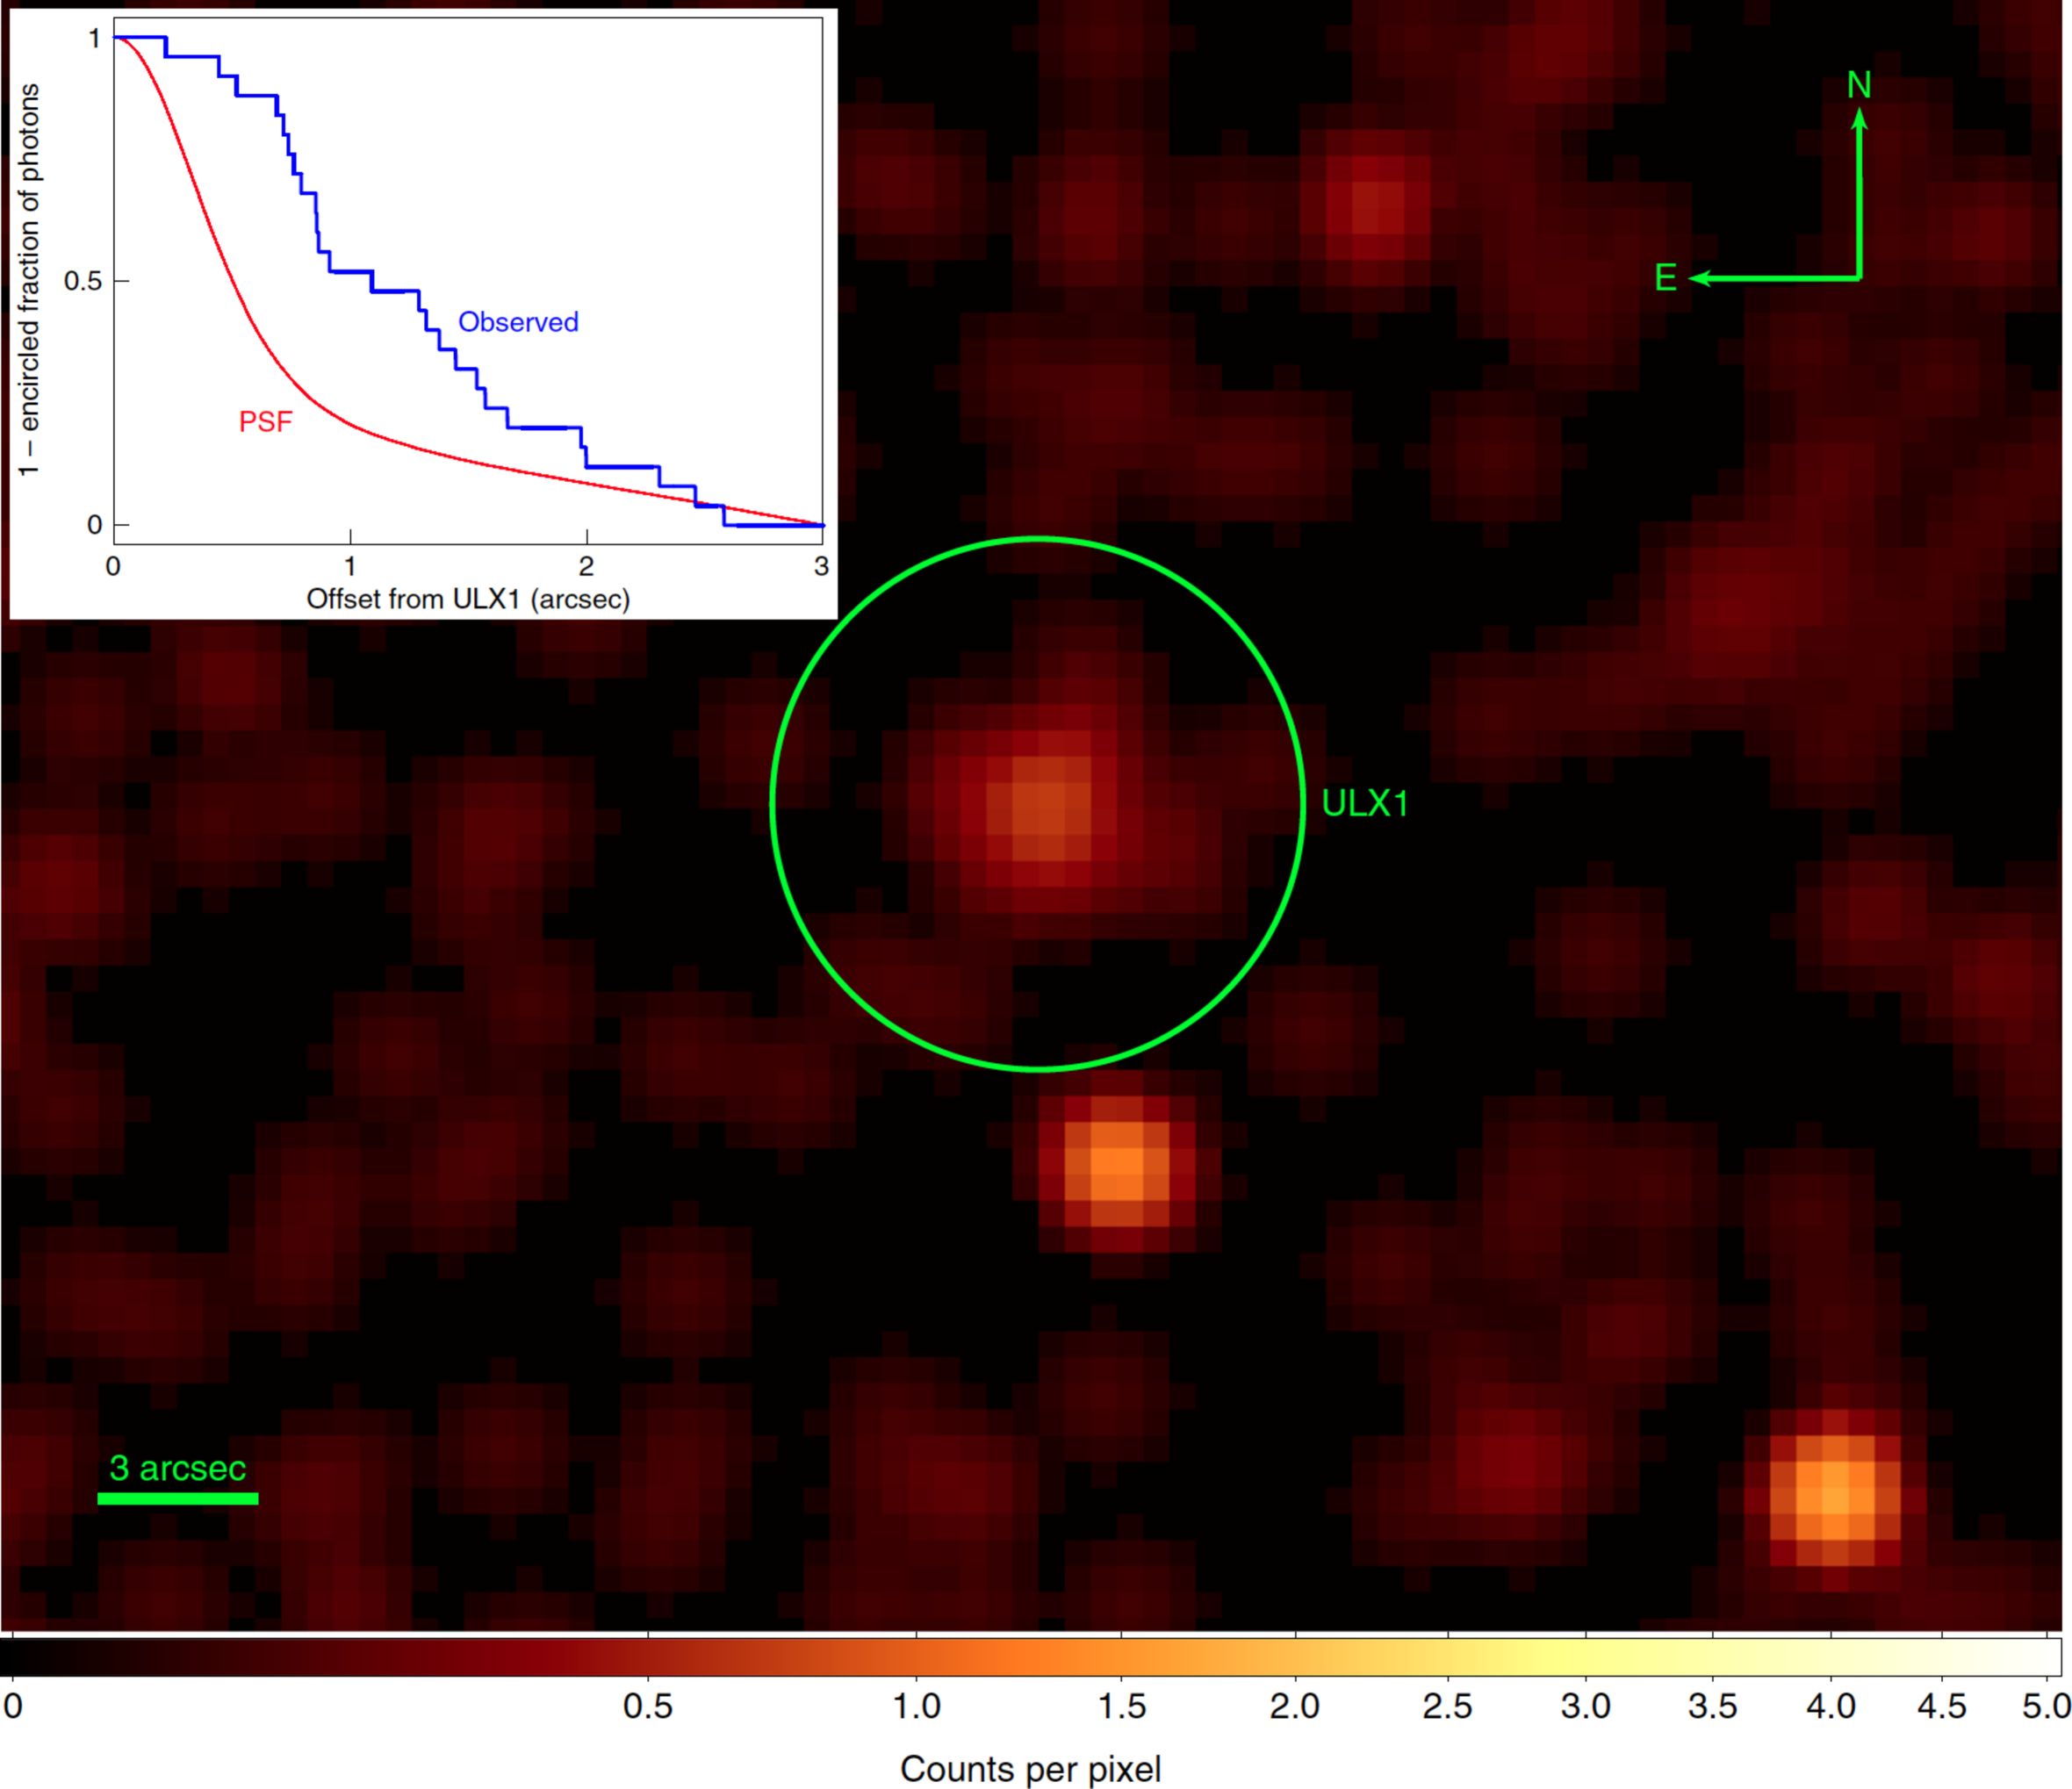
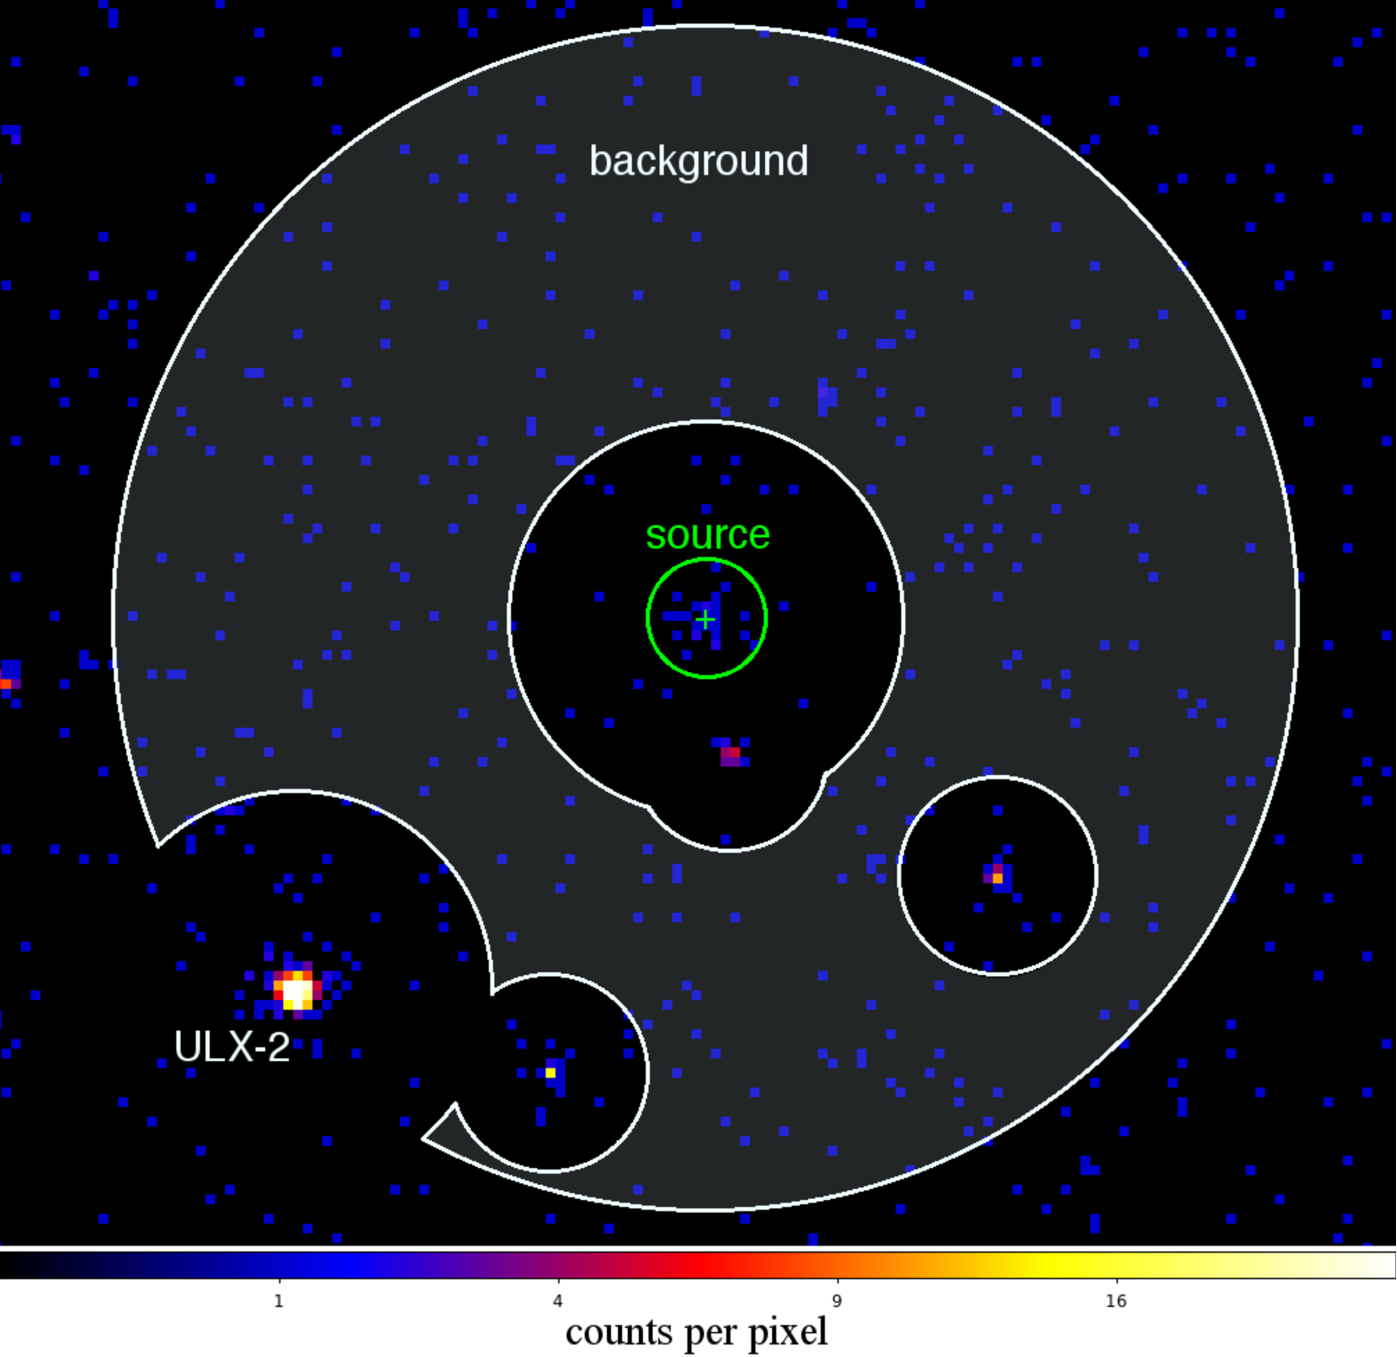
NGC 5907 is a nearly edge-on (inclination of 87∘ [ref.[10]]) spiral galaxy at a distance [ref.[11]]. Its source NGC 5907 ULX-1 (henceforth ULX1), with a peak X-ray luminosity , is driven by an accreting neutron star with a spin period of [ref.[9]]. During an X-ray multi-instrument campaign to study its behavior, ULX1 dimmed its flux by a factor (Fig. 1) and, on 7 November 2017, Chandra observed the field of ULX1 with its Advanced CCD Imaging Spectrometer for 52 ks. A source at the position of ULX1 was detected at a confidence level (Fig. 2). Since the number of collected photons is rather low, we made extensive use of simulations to assess the robustness of the findings and estimate the parameters characterizing the source. For our analysis, we considered the events between and falling within from the coordinates of ULX1, totalling 25 photons (3.6 of which are expected from background alone). The emission appears to be extended and indeed we verified that the photon distribution in the detector is not consistent with the point-spread function (PSF) of the telescope: we can reject a point-like nature of this source at the confidence level. We modelled the emission with a disk profile with uniform surface brightness and estimated the disk radius to be . We found no indication of an excess of brightness at the center of the source. To set an upper limit on the flux of ULX1 (the point-like component of the source), we selected the photons in the innermost part of the PSF, within , to compute a Poisson upper limit on the count rate. Assuming a power-law spectrum with photon index and an absorbing column (the value measured when the source was bright[9]), we obtained an upper limit on the point source unabsorbed flux in the energy range of erg cm-2 s-1 at the 90% confidence level. This corresponds to a limit on the isotropic X-ray luminosity erg s-1, lower than the Eddington luminosity ( erg s-1) for a 1.4- neutron star.
The diffuse emission at the position of ULX1 can be either an effect of the propagation of the high energy emission of the ULX through a thick dust layer in NGC 5907 or the intrinsic emission of an extended structure physically associated to ULX1. X-ray dust-scattering could produce a halo of the size we observe only if ULX1 were located at least 6 kpc behind the dominant scattering layer. However, in this case, given the high inclination and gas distribution of NGC 5907[13], standard assumptions imply an X-ray absorption along our line of sight much higher than the column density we derive from the X-ray spectrum of ULX1.[9] (see the Supplementary Information for a discussion and Fig. 6) We therefore concentrate on the hypothesis of nebular emission surrounding the ULX. At the distance of NGC 5907, the radius of the X-ray nebula is . For a collisionally ionized diffuse gas and absorption we estimate a temperature corresponding to keV (where is the Boltzmann constant), an unabsorbed flux and a luminosity . A diffuse flux consistent with may suggest that the Eddington-limited radiation from a neutron star is being Compton scattered by the wind. However, given that (where is the Thompson cross section), of the observed emission is unscattered. If this were the remnant of a supernova, its energy would be [ref.[13]], corresponding to a hypernova explosion. This is expected to produce a black hole[14] but, in exotic scenarios, it could leave behind a neutron star.[15]
Nebular emission has been observed around several ULXs at optical and radio wavelengths.[16, 17, 18, 1, 2, 19, 20] These nebulae (often referred to as bubbles) are generally attributed to shocks created by outflows from the binary system interacting with the surrounding medium and show some common traits: diameter of 200–400 pc, expansion speed of 100–200 km s-1, characteristic age (derived from the expansion velocity and the size of the nebula) of 1 Myr, and mechanical power . Here we explore whether a quasi-isotropic wind shocking the interstellar medium (ISM)[21, 16] can account for the extended X-ray emission around ULX1. As the bubble expands with a radius [ref.[21]], the ISM accumulates just behind this external shock. The wind, faster than the shock, also accumulates in another region closer to the source. Assuming that the X-ray emission comes from the outer region, pressure equilibrium at the shock boundary provides an estimate of the shock velocity (where comes from the spectral fit and is the proton mass), which entails an age of the bubble . This value is much larger than the spin-up timescale of the neutron star that powers the system, [ref.[9]]. We also derived an estimate of the ISM density (see Methods) as and of the mechanical power carried by the wind, , not far from the value of estimated for the bubble S26 in NGC 7793.[23, 24] If this mechanical power were sustained for , then, assuming a typical accretion efficiency onto a neutron star of 17%, should have been accreted to provide enough energy to sustain the nebula. Because the wind carries mechanical power to the nebula, if a large mass has been accreted onto the neutron star, and the mass lost by the system cannot exceed a few 10 , then we obtain a speed of the wind where is the speed of light. This value is consistent with the outflows observed from other ULXs.[25, 26, 27]
NGC 5907 has been observed in with the Kitt Peak National Observatory telescope in May 1995.[14] The high level of contamination from star forming regions and the limited angular resolution () hamper a detection of a counterpart in to the nebula around ULX1. NGC 5907 ULX-1 has been observed in radio at with the Very Large Array in May 2012,[15] detecting no point source down to a flux density of . The radio emission expected from the hot X-ray-emitting plasma is much fainter than this limit (see the Supplementary Information for a discussion). However, because efficient radiative cooling would have boosted the radio emission to [ref.[17, 21]], this limit confirms our adiabatic approximation and justifies the large ratio .
Observing an X-ray bubble around a ULX requires a number of favourable circumstances: a bubble with the right surface brightness and size to be detectable as extended; a ULX dim enough not to outshine the bubble; a sensitive observation carried out with an instrument with good angular resolution (see the Supplementary Information for a quantitative discussion and Fig. 5). This might explain why no similar structures are commonly observed in association with ULXs (with the notable exception of NGC 7793 S26,[23] which, however, has no associated ULX). Indeed, two follow-up observations with Chandra performed between 2018 February 27 and March 1 for a combined exposure of 50 ks failed to detect the bubble, as ULX1 raised its luminosity to erg s-1.
The recent discovery of TeV emission from the Galactic microquasar SS 433,[9] in many ways reminiscent of ULXs,[32] suggests that strong shocks associated to ULXs contribute to the cosmic ray acceleration. Indeed, the mechanical power of the bubble of ULX1 is comparable to the cosmic-ray injection rate for a whole galaxy.[8] Since the duty cycle, the lifespan and the population of similar objects are currently poorly known, it is not possible at this stage to quantify their contribution.
References
References
- [1] Feng, H. & Soria, R. Ultraluminous X-ray sources in the Chandra and XMM-Newton era. New A Rev. 55, 166–183 (2011).
- [2] Kaaret, P., Feng, H. & Roberts, T. P. Ultraluminous X-Ray Sources. ARA&A 55, 303–341 (2017).
- [3] Bachetti, M. et al. An ultraluminous X-ray source powered by an accreting neutron star. Nature 514, 202–204 (2014).
- [4] Fürst, F. et al. Discovery of Coherent Pulsations from the Ultraluminous X-Ray Source NGC 7793 P13. ApJ 831, L14 (2016).
- [5] Israel, G. L. et al. An accreting pulsar with extreme properties drives an ultraluminous x-ray source in NGC 5907. Science 355, 817–819 (2017).
- [6] Israel, G. L. et al. Discovery of a 0.42-s pulsar in the ultraluminous X-ray source NGC 7793 P13. MNRAS 466, L48–L52 (2017).
- [7] Carpano, S., Haberl, F., Maitra, C. & Vasilopoulos, G. Discovery of pulsations from NGC 300 ULX1 and its fast period evolution. MNRAS 476, L45–L49 (2018).
- [8] Drury, L. O. . Origin of cosmic rays. Astroparticle Physics 39, 52–60 (2012).
- [9] Abeysekara, A. U. et al. Very-high-energy particle acceleration powered by the jets of the microquasar SS 433. Nature 562, 82–85 (2018).
- [10] Xilouris, E. M., Byun, Y. I., Kylafis, N. D., Paleologou, E. V. & Papamastorakis, J. Are spiral galaxies optically thin or thick? A&A 344, 868–878 (1999).
- [11] Tully, R. B. et al. Cosmicflows-2: The Data. AJ 146, 86 (2013).
- [12] Just, A., Möllenhoff, C. & Borch, A. An evolutionary disc model of the edge-on galaxy NGC 5907. A&A 459, 703–716 (2006).
- [13] Blondin, J. M., Wright, E. B., Borkowski, K. J. & Reynolds, S. P. Transition to the Radiative Phase in Supernova Remnants. ApJ 500, 342–354 (1998).
- [14] Fryer, C. L. et al. Compact Remnant Mass Function: Dependence on the Explosion Mechanism and Metallicity. ApJ 749, 91 (2012).
- [15] Barkov, M. V. & Komissarov, S. S. Recycling of neutron stars in common envelopes and hypernova explosions. MNRAS 415, 944–958 (2011). 1012.4565.
- [16] Pakull, M. W. & Mirioni, L. Optical Counterparts of Ultraluminous X-Ray Sources. In New Visions of the X-ray Universe in the XMM-Newton and Chandra Era, 26-30 November 2001, ESTEC, The Netherlands, ArXiv Astrophysics e-prints: astro-ph/0202488 (2002).
- [17] Pakull, M. W. & Mirioni, L. Bubble Nebulae around Ultraluminous X-Ray Sources. In Arthur, J. & Henney, W. J. (eds.) Revista Mexicana de Astronomia y Astrofisica Conference Series, vol. 15 of Revista Mexicana de Astronomia y Astrofisica, vol. 27, 197–199 (2003).
- [18] Pakull, M. W. & Grisé, F. Ultraluminous X-ray Sources: Beambags and Optical Counterparts. In Bandyopadhyay, R. M., Wachter, S., Gelino, D. & Gelino, C. R. (eds.) A Population Explosion: The Nature & Evolution of X-ray Binaries in Diverse Environments, vol. 1010 of American Institute of Physics Conference Series, 303–307 (2008).
- [19] Lang, C. C., Kaaret, P., Corbel, S. & Mercer, A. A Radio Nebula Surrounding the Ultraluminous X-Ray Source in NGC 5408. ApJ 666, 79–85 (2007).
- [20] Kaaret, P., Corbel, S., Prestwich, A. H. & Zezas, A. Radio Emission from an Ultraluminous X-ray Source. Science 299, 365–368 (2003).
- [21] Castor, J., McCray, R. & Weaver, R. Interstellar bubbles. ApJ 200, L107–L110 (1975).
- [22] Weaver, R., McCray, R., Castor, J., Shapiro, P. & Moore, R. Interstellar bubbles. II - Structure and evolution. ApJ 218, 377–395 (1977).
- [23] Pakull, M. W., Soria, R. & Motch, C. A 300-parsec-long jet-inflated bubble around a powerful microquasar in the galaxy NGC 7793. Nature 466, 209–212 (2010).
- [24] Dopita, M. A., Payne, J. L., Filipović, M. D. & Pannuti, T. G. The physical parameters of the microquasar S26 in the Sculptor Group galaxy NGC 7793. MNRAS 427, 956–967 (2012).
- [25] Pinto, C., Middleton, M. J. & Fabian, A. C. Resolved atomic lines reveal outflows in two ultraluminous X-ray sources. Nature 533, 64–67 (2016).
- [26] Kosec, P. et al. Evidence for a variable Ultrafast Outflow in the newly discovered Ultraluminous Pulsar NGC 300 ULX-1. MNRAS 479, 3978–3986 (2018).
- [27] Walton, D. J. et al. An Iron K Component to the Ultrafast Outflow in NGC 1313 X-1. ApJ 826, L26 (2016).
- [28] Rand, R. J. Diffuse Ionized Gas in Nine Edge-on Galaxies. ApJ 462, 712 (1996).
- [29] Mezcua, M., Roberts, T. P., Sutton, A. D. & Lobanov, A. P. Radio observations of extreme ULXs: revealing the most powerful ULX radio nebula ever or the jet of an intermediate-mass black hole? MNRAS 436, 3128–3134 (2013).
- [30] Dopita, M. A. & Sutherland, R. S. Spectral Signatures of Fast Shocks. I. Low-Density Model Grid. ApJS 102, 161 (1996).
- [31] Caplan, J. & Deharveng, L. Extinction and reddening of H II regions in the Large Magellanic Cloud. A&A 155, 297–313 (1986).
- [32] Begelman, M. C., King, A. R. & Pringle, J. E. The nature of SS433 and the ultraluminous X-ray sources. MNRAS 370, 399–404 (2006).
- [33] Walton, D. J. et al. A 78 Day X-Ray Period Detected from NGC 5907 ULX1 by Swift. ApJ 827, L13 (2016).
Methods
X-ray observations and long-term light curve
We consider in this work X-ray observations taken with Chandra, XMM–Newton, and the
Neil Gehrels Swift Observatory (see Table 1).
Particular care is dedicated to the Chandra observation 20830, taken on 2017
November 6, in which we detected diffuse emission.
We used the other data sets to build the long-term light curve of
Fig. 1 and/or to improve the astrometry of observation 20830.
| # | Mission | Obs.ID | Instrument | Start Date | Total Exposure |
|---|---|---|---|---|---|
| (YYYY-MM-DD) | (ks) | ||||
| 1 | Chandra | 12987 | ACIS-S | 2012-02-11 | 16.0 |
| 2 | XMM–Newton | 0804090301 | EPIC | 2017-07-02 | 43.0 (28.0) |
| 3 | XMM–Newton | 0804090401 | EPIC | 2017-07-05 | 39.0 (31.3) |
| 4 | XMM–Newton | 0804090501 | EPIC | 2017-07-08 | 43.0 (34.8) |
| 5 | XMM–Newton | 0804090701 | EPIC | 2017-07-12 | 43.0 (32.5) |
| 6 | XMM–Newton | 0804090601 | EPIC | 2017-07-15 | 40.5 (24.8) |
| 7 | Chandra | 20830 | ACIS-S | 2017-11-07 | 51.3 |
| 8 | Chandra | 20994 | ACIS-S | 2018-02-27 | 32.6 |
| 9 | Chandra | 20995 | ACIS-S | 2018-03-01 | 16.0 |
Chandra
All Chandra observations we used were carried out with the Advanced
CCD Imaging Spectrometer[2] (Spectroscopic array, ACIS-S) in
full-imaging mode.
We used the Chandra Interactive Analysis of Observation (CIAO,
v4.10)[3] software package and CALDB (v4.7.8).
We selected photons in the energy range 0.3–7 keV, and followed the standard
analysis threads for data reprocessing, source detection, and flux estimation.
We determined the energy boundaries based on the spectral distribution
of the ACIS background, which increases significantly outside this band.
We defined a circular source region that includes all photons within
from the direction of ULX1.
This radius, which contains 98.5% of the PSF, limits the contamination
from background and other sources, but is large enough to make it possible
to appreciate the main features of the X-ray source.
We defined an annular background region centered at the location of ULX1,
with radii and .
We removed from this region circles with radii of
around each other source, and a circle with radius of
around NGC 5907 ULX-2, being particularly bright at the time.
For observation 20830, these criteria leave 25 photons in the source region
and 277 photons in the background region, corresponding to 3.6 background
photons expected in the source region (see Fig. 3).
XMM–Newton
In the XMM–Newton observations, the positive–negative
junction[4] (pn) and the two metal oxide
semi-conductor[5] (MOS) CCD cameras of the EPIC instrument were
all operated in Full Frame mode.
We used the XMM–Newton Science Analysis Software[6] (SAS) v14.5
for data reduction.
After removing intervals of high background, we selected the events setting
FLAG==0 and PATTERN4 and PATTERN12 for pn and MOS, respectively.
We extracted the source spectra and event lists from a circular region with
radius 30 arcsec around the best-fit Chandra source position,
and
(J2000), in the energy range 0.3–10 keV.
We estimated the background from a circular region with radius 65 arcsec,
close to ULX1 but free of sources, for each observation.
We excluded from our analysis the XMM–Newton observation 0795712601 as source
contamination, mainly from NGC 5907 ULX-2 but also from other sources
in NGC 5907, undermines a clear characterization of ULX1.[7]
We simultaneously analysed all XMM–Newton spectra in the energy range 0.3–10 keV and we fitted them with an absorbed broken power law model (bknpow in XSPEC[8]). The Tuebingen-Boulder ISM absorption model (tbabs) was adopted and the abundances were set to those of ref.[9]. We fixed the values of the break energy and the high-energy spectral index, to those obtained in ref. [9], ( and ), as they were better constrained including NuSTAR data and consistent with all the XMM–Newton observations of ULX1 in a high state. We also fixed the column density to the best-fit value in ref. [9], . We left free to vary the low-energy photon index and the normalization. We obtained an acceptable fit ( for 439 degrees of freedom), with low-energy photon indices of , , , , and for the five observations, in chronological order (the superscripts refer to the observation codes in Table 1). The resulting 0.3–10 keV unabsorbed fluxes are , , , , and (see Fig. 1). All these uncertainties are at the 90% confidence level. A careful spectral characterization, to be compared with other spectral analyses in the literature, goes beyond the scope of this paper.
Swift
The X-Ray Telescope[10] (XRT) on board Swift uses
a CCD detector sensitive to photons with energies between 0.2 and 10 keV.
All observations analyzed in this work were performed in imaging photon
counting (PC) mode.
We used FTOOLS[11] v6.15 for standard data processing.
We extracted the source events within a radius of
from the Chandra position of ULX1, and evaluated the background in a
source-free circular region of radius , avoiding
the plane of NGC 5907.
The ancillary response files generated with xrtmkarf account for different
extraction regions, vignetting and point-spread function corrections.
We used the latest available spectral redistribution matrix (v014).
We converted the source rate to 0.2–10 keV luminosity by assuming
a distance and an absorbed broken power-law spectral
model with indices 1.57 and 2.87, and break energy .
These are the best-fit parameters obtained in the high state of
ULX1,[9] consistent with, but more constrained, than the values
obtained in the spectral analysis described in the previous section.
As the region around ULX1 is rich of X-ray sources from NGC 5907, which Chandra can resolve but Swift cannot, XRT observations are likely affected by source contamination. A dedicated analysis that addresses this issue is not straightforward and goes beyond the scope of this paper.
Analysis of the Chandra observation of diffuse emission around
ULX1
Relative astrometry
We considered Chandra observations 12987 and 20994, besides observation 20830.
We reprocessed the data, extracted images, and run the CIAO task wavdetect,
following the indications in the Chandra analysis threads.
We selected the sources within 1 arcmin from the nominal position of ULX1,
excluding ULX1 itself.
We found the translations that best map the coordinates of the sources
in observations 12987 and 20994 to those in observation 20830, using the CIAO
task wcs_match.
We applied these corrections (measuring 0.13 arcsec and 0.30 arcsec,
respectively) to the images and aspect solutions of observations
12987 and 20994 and launched again the task wavdetect.
The localization of ULX1 in the two observations is now compatible within
in RA
() and Dec
(), in the
relative frame of observation 20830.
Therefore, we take the barycenter of these two positions as the (J2000)
nominal position of ULX1: and
(or
,
).
The best fit coordinates of the closest source to ULX1 in observation 20830
are: and
(J2000).
These two positions are compatible within , being offset by
, with a uncertainty of
.
Therefore, we identify the source in observation 20830 with ULX1 and adopt
the nominal position of ULX1 in the analysis that follows.
Extension
A first indication of source extension comes from the output of the CIAO tool
wavdetect.
We tested for and measured the extension of our source, by studying its
radial brightness profile.
We used a Kolmogorov–Smirnov test, which quantifies the goodness of fit by
measuring the maximum absolute difference between the cumulative distribution
of observed events and the model.
To take into account the complex shape of the PSF and other effects due to
the spacecraft dithering, we simulated with MARX[12] (v5.3.3) a
large number of events associated to a point source with characteristics
similar to ULX1 in observation 20830, including its position on the detector.
In order to avoid photon pileup, which alters the PSF, we generated 50
realizations of a source with 1000 events and combined them.
We assumed an absorbed ( cm-2,
the value measured for ULX1 in the high state[9]), power-law
() spectrum and a direction consistent with those of ULX1.
We obtain consistent results assuming the best-fit thermal bremsstrahlung
spectral model described in the next section.
We generated a number of simulated background events, drawing from
a two-dimensional uniform distribution.
We extracted the observed cumulative distribution of events within a radius from the source center. We used the nominal direction of ULX1 obtained through astrometric analysis (see the previous section), but using the observed centroid does not alter our results. For the simulated point source, we included the expected uniform background contribution. We applied the same selection criteria to the simulated data set and considered only photons in the source region (with radius 3 arcsec): 25 observed photons compared against simulated photons.
A Kolmogorov–Smirnov test finds a maximum difference between the two cumulative radial distributions, (see Fig 2). This implies that the source associated to ULX1 is not pointlike with a confidence level of (). We repeated the same analysis simulating extended sources with a disk profile of uniform surface brightness. We can reject at the confidence level all values of the disk radius outside the range . We repeated the same analysis assuming a smooth halo shape[7] with a hole, as described in the section of the Supplementary Material where we apply a dust scattering model. We constrained the values of the distance between the source and a dust layer to . In the spirit of reproducible results, we provide the code of the MARX plugin (Draine_halo.c) that we used to simulate such a dust halo at https://github.com/andrea-belfiore/MARX-plugins.git.
Spectral analysis
We analysed the spectrum of the extended source with XSPEC, adopting
a collisional plasma model (apec), absorbed according to the Tübingen-Boulder
absorption model (tbabs) and set the abundances to those of ref.[9].
As the number of events is very low, we used C-statistics[14] and
verified through Monte Carlo simulations similar to those described above,
that we obtain identical estimates and error bars.
All the uncertainties are stated at 90% CL.
The absorption column is poorly constrained by the data (see
Fig. 4), but physical constraints are given by the absorption
level of our Galaxy in the direction of ULX1,
, and the absorption measured
in the high state of ULX1,
(that includes internal absorption by the ULX itself).
We repeated the same analysis adopting the best-fit value
, that provided us with the
best-fit estimates for all parameters, and for the two extreme values
and that determine our uncertainties (that cover the
90% CL error bars for all allowed values of ).
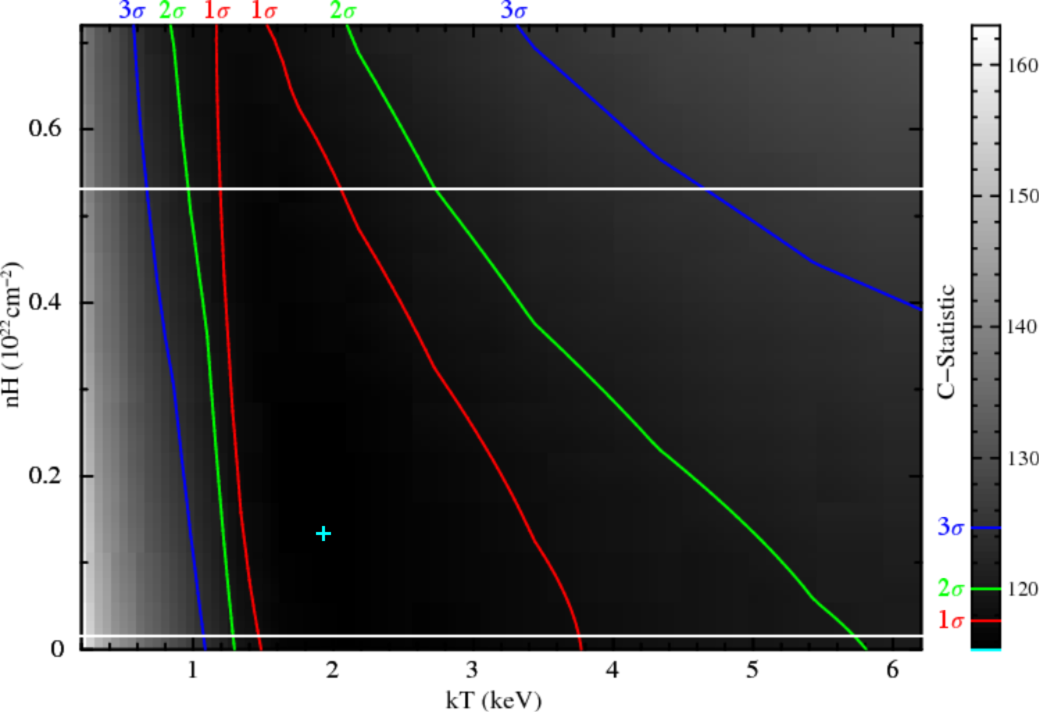
We estimate a characteristic energy , a normalisation , and an unabsorbed 0.3-7.0 keV flux , corresponding to an isotropic 0.3-7.0 keV luminosity .
We also tested through Monte Carlo simulations a dust-scattering spectrum expected from the model outlined in a following section. This model is acceptable at the level (the spectrum changes so slightly with the tuning parameters that we cannot constrain them in this way).
We try to estimate the flux of a point-like component associated to ULX1. To this aim, we consider only the innermost photons, within from the location of ULX1, determined as described in the astrometry section. We assume for the point source a power-law spectrum with and the absorption column measured for ULX1 in its high state. We used the CIAO tool srcflux, that applies an aperture photometry, taking into account the response of the instrument, the encircled fraction (fraction of the PSF within each region), statistical uncertainties, position on the detector, and other effects. It provides an upper limit on the flux (at the 90% confidence level) of . This corresponds to a luminosity , where is the Eddington limit for a 1.4- neutron star.
Physical modeling of the expanding nebula
We assume that an isotropic wind with constant power
is emitted from the ULX system, shocks the external medium (ISM) and expands
according to a self-similar solution.[21, 16]
After a short free expansion period, the wind forms a shock that starts as
adiabatic but becomes more and more radiatively efficient.
In this phase, the expanding nebula (bubble) is radially structured in 4
regions:
-
1.
Close to the source is the low-density left-over of the swept up ISM, where the wind expands freely (free wind region);
-
2.
Starting at a radius the wind, faster than the shock, accumulates, increasing density and temperature (shocked wind region);
-
3.
Starting at a radius the swept up ISM accumulates, increasing density and temperature (shocked ISM region);
-
4.
Beyond a radius the ISM is still unperturbed by the shock (ISM region).
In this model, there are two shocked regions where X-rays could be emitted: the shocked wind region and the shocked ISM region. The first scenario was considered in a set of simulations[15] of expanding nebulae, and, with the boundary conditions set in these simulations, it cannot reach an X-ray luminosity larger than . Either this scenario is missing some dominant effect, or it can be ruled out in the context of ULX1; we explore here the other scenario.
If we assume that the X-rays are produced in the shocked ISM region, then the observed disk radius coincides with at a distance , where is the current age of the bubble. Strong shock conditions for the temperature of the shocked ISM provide a direct estimate of the current speed of the shock :
| (1) |
Because observations of other nebulae show that the shock speed is somewhat overestimated with this approximation, we introduce a factor that accounts for this discrepancy: . A standard bubble model, with a constant injection of mechanical power in a uniform ISM with density , predicts a time dependence of the bubble size:
| (2) |
where is a numerical constant.[16]
Under these assumptions, as , we can estimate the age of the bubble:
| (3) |
As largely exceeds the sound speed in the ISM, the Rankine–Hugoniot conditions at the shock front grant that the plasma density just inside the shocked region is , with a compression factor . However, as a high radiative efficiency strongly increases this value, we maintain it as a free parameter. According to the standard bubble model, decreases down to 0 as the radial distance approaches a contact discontinuity at . Because the bremsstrahlung emissivity , we assume that most emission is produced close to . We estimate the size of this emitting region by assuming that it contains most of the swept up material from the ISM:
| (4) |
We can now extract from the normalisation of the apec model an estimate of the shocked plasma density as
| (5) |
This value is broadly consistent with those observed in optical/radio ULX bubbles.[23]
We use eq. (2) to provide an estimate of the mechanical power of the wind :
| (6) |
where we used eqq. (3) and (1) and our estimates for , , and , leading to large uncertainties. This value is in the same order of magnitude as the X-ray luminosity observed from ULX1 at its peak, if emitted isotropically.[9] Although is weakly constrained from our results, we deem it extremely unlikely that it can be much higher.
Indeed, if we suppose that ULX1 sustained this value of for the age of the nebula , its wind would have carried an energy . As the wind, and therefore the bubble, is powered by accretion onto a neutron star, the accreted mass must be at least:
| (7) |
where is the accretion efficiency of a neutron star with mass and radius . The best-fit value of might be too large for a neutron star, as it would have probably already collapsed into a black hole, but a value of is more plausible. As the accretion power is not all channelled into the wind, but must also sustain the luminosity of ULX1, it seems likely that our simple model might need some revision.
We can relate the total mass ejected by the wind, to and, indirectly, to :
| (8) |
where is the speed of the wind. If we assume , then, to keep as expected for an X-ray binary system, . This value of agrees with the velocity measured in outflows from various ULXs.[25, 26, 27]
References
References
- [1]
- [2] Garmire, G. P., Bautz, M. W., Ford, P. G., Nousek, J. A. & Ricker, G. R., Jr. Advanced CCD imaging spectrometer (ACIS) instrument on the Chandra X-ray Observatory. In Truemper, J. E. & Tananbaum, H. D. (eds.) X-Ray and Gamma-Ray Telescopes and Instruments for Astronomy., vol. 4851 of Proceedings of the SPIE., 28–44 (SPIE, Bellingham, 2003).
- [3] Fruscione, A. et al. CIAO: Chandra’s data analysis system. In Silva, D. R. & Doxsey, R. E. (eds.) Observatory Operations: Strategies, Processes, and Systems, vol. 6270 of SPIE Conference Series, 62701V (SPIE, Bellingham, 2006).
- [4] Strüder, L. et al. The European Photon Imaging Camera on XMM-Newton: The pn-CCD camera. A&A 365, L18–L26 (2001).
- [5] Turner, M. J. L. et al. The European Photon Imaging Camera on XMM-Newton: The MOS cameras. A&A 365, L27–L35 (2001).
- [6] Gabriel, C. et al. The XMM-Newton SAS - Distributed Development and Maintenance of a Large Science Analysis System: A Critical Analysis. In Ochsenbein, F., Allen, M. G. & Egret, D. (eds.) Astronomical Data Analysis Software and Systems (ADASS) XIII, vol. 314 of ASP Conf. Ser. (San Francisco, CA: ASP), 759 (2004).
- [7] Pintore, F. et al. A new ultraluminous X-ray source in the galaxy NGC 5907. MNRAS 477, L90–L95 (2018).
- [8] Arnaud, K. A. XSPEC: The First Ten Years. In Jacoby, G. H. & Barnes, J. (eds.) Astronomical Data Analysis Software and Systems V, vol. 101 of Astron. Soc. Pac. Conf. Series, 17–20 (1996).
- [9] Wilms, J., Allen, A. & McCray, R. On the Absorption of X-Rays in the Interstellar Medium. ApJ 542, 914–924 (2000).
- [10] Burrows, D. N. et al. The Swift X-Ray Telescope. Space Science Reviews 120, 165–195 (2005).
- [11] Blackburn, J. K. FTOOLS: A FITS Data Processing and Analysis Software Package. In Shaw, R. A. and Payne, H. E. and Hayes, J. J. E., eds., Astronomical Data Analysis Software and Systems IV., vol. 77 of Astron. Soc. Pac. Conf. Series, 367 (1995).
- [12] Davis, J. E. et al. Raytracing with MARX: x-ray observatory design, calibration, and support. In Space Telescopes and Instrumentation 2012: Ultraviolet to Gamma Ray, vol. 8443 of Proc. SPIE, 84431A (SPIE, Bellingham, 2012).
- [13] Draine, B. T. Scattering by Interstellar Dust Grains. II. X-Rays. ApJ 598, 1026–1037 (2003).
- [14] Cash, W. Parameter estimation in astronomy through application of the likelihood ratio. ApJ 228, 939–947 (1979).
- [15] Siwek, M., Sa̧dowski, A., Narayan, R., Roberts, T. P. & Soria, R. Optical and X-ray luminosities of expanding nebulae around ultraluminous X-ray sources. MNRAS 470, 361–371 (2017).
Supplementary Information
Detectability of similar features
We explore the conditions under which an extended feature associated to
a point source, particularly a ULX, is detectable.
Due to the small angular scale of such a feature, we restrict our scope
to Chandra, which provides the best angular resolution among the currently
operating X-ray observatories.
We simulate with MARX a large number of extended sources overlapping a point
source and a uniform background, scanning a broad range for each parameter:
the size (disk radius ) and the fluence of the extended source, the
fluence of the point source () and that of the background.
We assume for the extended source a uniform disk shape and a bremsstrahlung
spectrum with , and for the point source a power-law
spectrum with index .
By scanning over the fluence of the extended source, we determine for each configuration of the other parameters the number of photons that are needed from the extended source to detect it as extended with a 90% probability. We consider a source detected as extended if we can reject at the confidence level the hypothesis that the source is point-like, if we apply a procedure identical to the one we applied to the source associated to ULX1. It turns out that the background level has an appreciable impact only in those cases where the number of events from the two source components (one point-like, the other extended) combined is very small. Therefore, we fix the number of expected background photons within to , close to the value we estimate in the field of ULX1. We also find that fixing and increasing , decreases down to a minimum value for .
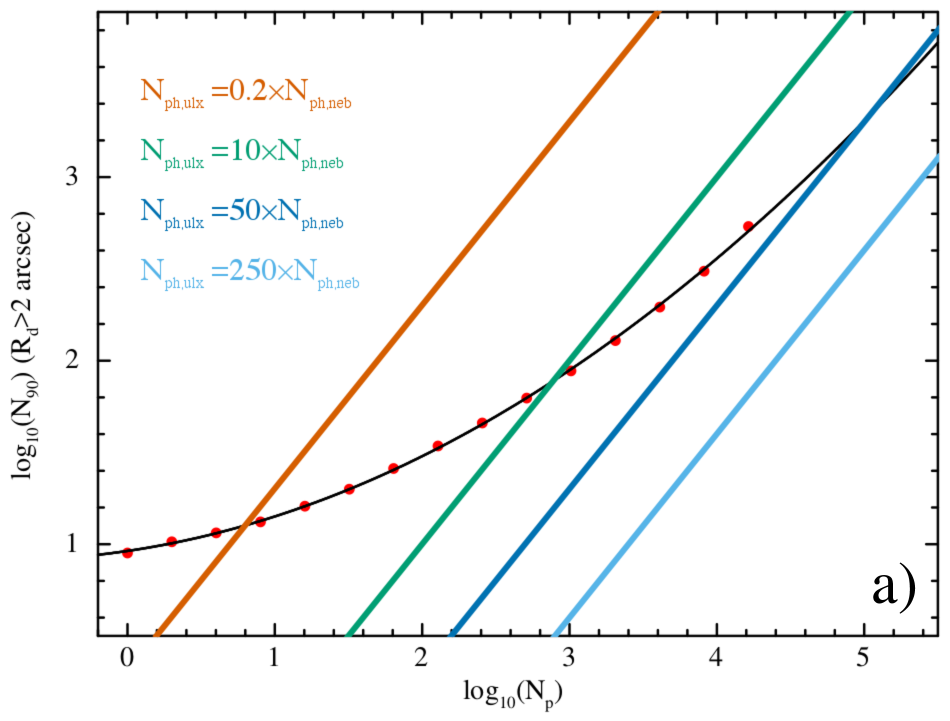
The left hand panel of Suppl. Fig. 5 shows as a function of for a relatively large source, with . For a feature similar in physical size as the one we detect around ULX1, this corresponds to a distance of the host galaxy . We overplot a few lines indicating fixed count ratios between the point source and the extended source. If we assume that the brightness of the extended feature is constant, the blue and cyan lines correspond to the counts ratios that we expect when ULX1 is in its high state, the green line the counts ratio in the intermediate state, and the red line the counts ratio in the low state. The left hand panel of Suppl. Fig. 5 shows that a ULX must be in a low state for us to be able to detect a dim extended feature associated to it, even if the source is not too far from us.
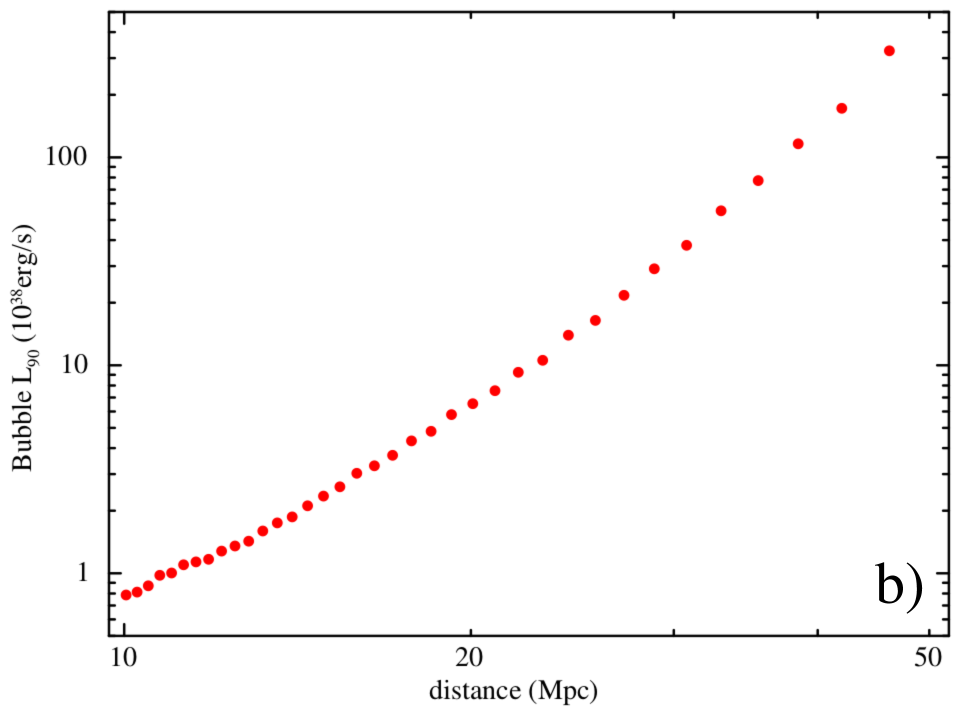
Then, we assume that the extended source is 5 times more luminous than the point source (reproducing the off state of a transient ULX) and check its detectability at larger distance . We consider a Chandra observation and the same physical size for the extended feature as the one we detect around ULX1. The right hand panel of Suppl. Fig. 5 shows the luminosity of the extended feature () corresponding to as a function of the distance of the host galaxy. If we assume that the X-ray luminosity of the nebula should be lower than a few , then we can only appreciate the extension of sources within (and only when the point source is in a very low state). Very few currently known ULXs are eligible,[2] and they should be closely monitored, because only when they are in a low state Chandra could probe with a long stare if they share a feature similar to the one we observe in ULX1 in this paper.
Application of a dust scattering model
We investigated the possibility that the extended emission around ULX1 is due
to X-ray dust-scattering, as sometimes it is observed for X-ray sources whose
emission passes through clouds of dust (e.g.
refs. [3, 4, 5]).
The observed angular deviation is related[6]
to the scattering angle and to the source and dust distances
( and , respectively) by ,
where . For dust located in our Galaxy and not too
close to the X-ray source (since the X-ray scattering cross section
rapidly drops with the scattering angle), we can see scattering
halos around X-ray sources up to dozens of arcmin.
An extended X-ray scattering halo by extragalactic dust, instead, has never
been detected because for , the uncertainty in the PSF
hampers a measure of the tiny extent of these halos.
However, the favourable combination of the Chandra PSF, the edge-on
orientation of NGC 5907, the extreme luminosity of ULX1, and its abrupt
switch-off, might have given us the opportunity to resolve
spatially—for the first time—the X-ray emission from an extragalactic
compact object that was scattered by the dust in its host galaxy.
In fact, we can interpret the halo we saw as due to the photons emitted during the high state of ULX1 and scattered in our direction by the interstellar dust in its host-galaxy, the difference between the two optical paths causing a delay. Indeed, dust in NGC 5907 prevents us to see any optical counterpart to ULX1, even with the high sensitivity of the Hubble Space Telescope. In the following section, we apply the X-ray scattering model to our system and check its consistency.
As a first approximation, we assume that the dust is uniformly distributed in a thin wall at a distance from ULX1, where is the distance of NGC 5907. The difference in optical path with respect to a photon reaching us directly causes a delay:
| (9) |
The brightness profile of the halo can be expressed[6] as:
| (10) |
where is the dust (scattering centers) column density, is the X-ray luminosity of the source, is the spectral energy distribution of the source normalized to 1, and is the differential scattering cross-section.
If switches on at an epoch , then, according to eqq. (10) and (9), a halo forms up to a radius:
| (11) |
If has kept constant over a long time, then fades out at large because drops at large . Therefore, while shapes the radial brightness profile of the halo, (or , if is known) fully determines the halo size. Although a precise expression for depends on the dust properties, we can approximate its 90% containment angle[7] as where is the photon energy. Since the lowest energy photons determine the size of the halo and 21 out of the 25 photons we used for our extension analysis have an energy , we assume that . After a time the halo saturates to an angular size:
| (12) |
As with the activation of the source, if abruptly drops to 0 at an epoch , then with:
| (13) |
In this simple model we expect a sharp hole expanding in the halo starting from its center, without altering the profile of the halo for . In a more realistic case, in which the source takes some time to switch off and light scatters in a smooth distribution of dust at various , we expect a more complex halo profile and evolution.
As Swift monitoring shows that ULX1 remained in a high state () for 4 years[8, 9], before switching off, we expect that the halo is complete, for any reasonable value of (up to 90 kpc). We observed ULX1 switching off on 2017 July 10 (our ) and Chandra observation 20830 took place on 2017 November 7, 120 d later. Therefore, we expect a hole in the halo profile with a radius . As described in the extension analysis section, our fit to a halo profile estimates at the 90% confidence level that .
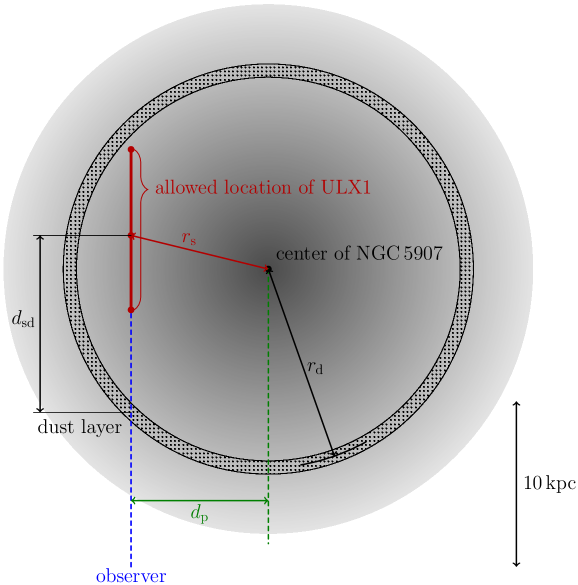
We consider now the structure and geometry of NGC 5907 to constrain the location of ULX1 within its host galaxy. A model that accounts for optical emission and extinction[10] estimates the inclination of the galaxy plane as . A double exponential spatial model sets the scale length for dust and stars as , and , respectively. The dust radial profile shows a steep decrease at 16 kpc, while the gas extends much further out[11]. We approximate NGC 5907 to a perfectly thin edge-on galaxy and apply a simple geometrical model sketched, face-on, in Suppl. Fig. 6. The distance between ULX1 and a dust layer is , where is the distance of the dust cloud from the center of NGC 5907, is the distance of ULX1 from the center of NGC 5907, and is its sky projection. Given the constraints above, the optical depth is minimal when and .
We follow a standard approach that assumes that the dust distribution, and therefore optical absorption, is a good proxy to track the metals that cause the X-ray absorption.[12] The numerical integration of a model describing the optical absorption in NGC 5907[13], along the line of sight up to ULX1, leads to . Assuming Solar abundances, we convert[12] these values into an estimate of the hydrogen column density: . This estimate is not consistent with the value of we see from ULX1 in its high state[9] (which includes absorption internal to the source). Uncertainties in the distribution and properties of the dust prevent us from drawing firm conclusions but, since the dust-scattering hypothesis seems to require some degree of fine tuning in the dust and galaxy parameters to reproduce the data, we do not further explore this scenario.
Multi-wavelength Coverage
The region around ULX1 has been observed in with the 0.9 m
telescope at the Kitt Peak National Observatory[14] and in radio
at 5 GHz with the Very Large Array in configuration B[15].
The image of NGC 5907 shows a large number of excesses on
the order of a few , that follow the profile
of the galaxy.
One of them, with a flux ,
is consistent with the direction of ULX1.
However, the poor angular resolution () hampers a firm
association with the X-ray nebula, or any further characterisation
of the feature.
The radio observation reveals no point source down to a flux density of
within 10 arcsec around the direction of ULX1.
For a fully radiative strong collisional shock we expect that the flux in the Balmer lines is proportional to the mechanical power[16] and depends on the shock speed.[17, 18] Most of the recombination happens in the photoionized pre-shock region, or in the post-shock region where the plasma has already cooled. Because the age of the nebula is smaller than the cooling time of the plasma, we expect this contribution to be negligible.
The MAPPINGS III shock model library tables (http://cdsweb.u-strasbg.fr/~allen/mappings_page1.html) including both the pre- and post-shock regions, lead to an expected unabsorbed flux in :
and an expected unabsorbed flux in :
This value, obtained under the assumption of a fully radiative strong shock, is in slight tension with the excess observed by the Kitt Peak National Observatory, if we adopt the estimate of obtained in the adiabatic assumption, eq.6 in the main text. However, the strong optical absorption in the direction of ULX1[19] might reduce this tension.
The bremsstrahlung emissivity of a hot plasma at radio frequencies can be written[20] as:
where is the exponential Euler-Mascheroni constant. For pure hydrogen, with a compression factor , we expect a radio flux density:
We expect no detectable radio emission from the hot X-ray-emitting plasma. Instead, under the assumption of a fully radiative strong shock, we expect some detectable radio emission from other regions.
If we combine the above estimate for to the relation between the and the emissivities[21] for a plasma with , we obtain:
VLA did observe at 5GHz NGC 5907 ULX-1 for 3h on May 30 2012, in the B configuration,[15] reporting an upper limit of . Because the beam width at half power for VLA at 5GHz in configuration B measures , we expect that the bubble may be covered by a few beams, depending on the size of the radio nebula. Deriving a limit on the brightness of extended sources with an aperture synthesis array is a non-trivial task,[22] that goes beyond the scope of this paper.
The tension between our estimates and the reported upper limit indicates that a fully radiative shock approximation might not apply to our case. Indeed, such an approximation implies that all the mechanical power is radiated, while, according to our model of the nebula, . Dropping the assumption of a fully radiative shock requires a more sophisticated and complete model of the nebula, that accounts for multiple plasma phases.
References
References
- [1]
- [2] Walton, D. J., Roberts, T. P., Mateos, S. & Heard, V. 2XMM ultraluminous X-ray source candidates in nearby galaxies. MNRAS 416, 1844–1861 (2011).
- [3] Predehl, P. & Schmitt, J. H. M. M. X-raying the interstellar medium: ROSAT observations of dust scattering halos. A&A 293, 889–905 (1995).
- [4] Vaughan, S. et al. The Discovery of an Evolving Dust-scattered X-Ray Halo around GRB 031203. ApJ 603, L5–L8 (2004).
- [5] Vasilopoulos, G. & Petropoulou, M. The X-ray dust-scattered rings of the black hole low-mass binary V404 Cyg. MNRAS 455, 4426–4441 (2016).
- [6] Mathis, J. S. & Lee, C.-W. X-ray halos as diagnostics of interstellar grains. ApJ 376, 490–499 (1991).
- [7] Draine, B. T. Scattering by Interstellar Dust Grains. II. X-Rays. ApJ 598, 1026–1037 (2003).
- [8] Walton, D. J. et al. A 78 Day X-Ray Period Detected from NGC 5907 ULX1 by Swift. ApJ 827, L13 (2016).
- [9] Israel, G. L. et al. An accreting pulsar with extreme properties drives an ultraluminous x-ray source in NGC 5907. Science 355, 817–819 (2017).
- [10] Xilouris, E. M., Byun, Y. I., Kylafis, N. D., Paleologou, E. V. & Papamastorakis, J. Are spiral galaxies optically thin or thick? A&A 344, 868–878 (1999).
- [11] Alton, P. B., Xilouris, E. M., Misiriotis, A., Dasyra, K. M. & Dumke, M. The emissivity of dust grains in spiral galaxies. A&A 425, 109–120 (2004).
- [12] Watson, D. The Galactic dust-to-metals ratio and metallicity using gamma-ray bursts. A&A 533, A16 (2011).
- [13] Just, A., Möllenhoff, C. & Borch, A. An evolutionary disc model of the edge-on galaxy NGC 5907. A&A 459, 703–716 (2006).
- [14] Rand, R. J. Diffuse Ionized Gas in Nine Edge-on Galaxies. ApJ 462, 712 (1996).
- [15] Mezcua, M., Roberts, T. P., Sutton, A. D. & Lobanov, A. P. Radio observations of extreme ULXs: revealing the most powerful ULX radio nebula ever or the jet of an intermediate-mass black hole? MNRAS 436, 3128–3134 (2013). 1309.5721.
- [16] Weaver, R., McCray, R., Castor, J., Shapiro, P. & Moore, R. Interstellar bubbles. II - Structure and evolution. ApJ 218, 377–395 (1977).
- [17] Dopita, M. A. & Sutherland, R. S. Spectral Signatures of Fast Shocks. I. Low-Density Model Grid. ApJS 102, 161 (1996).
- [18] Allen, M. G., Groves, B. A., Dopita, M. A., Sutherland, R. S. & Kewley, L. J. The MAPPINGS III Library of Fast Radiative Shock Models. ApJS 178, 20–55 (2008).
- [19] Heida, M. et al. Searching for the Donor Stars of ULX Pulsars. ApJ 871, 231 (2019).
- [20] Rybicki, G. B. & Lightman, A. P. Radiative Processes in Astrophysics (John Wiley & sons, Inc., 1986).
- [21] Caplan, J. & Deharveng, L. Extinction and reddening of H II regions in the Large Magellanic Cloud. A&A 155, 297–313 (1986).
- [22] Crane, P. C. & Napier, P. J. Sensitivity. In Perley, R. A., Schwab, F. R. & Bridle, A. H. (eds.) Synthesis Imaging in Radio Astronomy, Astron. Soc. Pac. Conf. Series (1989).
This research is based on observations made with the Chandra X-ray Observatory and has made use of software provided by the Chandra X-ray Center (CXC) in the application packages CIAO, ChIPS, and Sherpa. This research also made use of data obtained with the Neil Gehrels Swift Observatory and XMM–Newton. Swift is a NASA mission with participation of the Italian Space Agency and the UK Space Agency. XMM–Newton is an ESA science mission with instruments and contributions directly funded by ESA Member States and NASA. A.B. is grateful to A. Fabian for an interesting discussion and to S. Covino for help in optical data reduction. A.B. and G.N. are supported by EXTraS, a project funded by the European Union’s (EU) Seventh Framework Programme under grant agreement no. 607452. We acknowledge funding in the framework of the project ULTraS (ASI–INAF contract N. 2017-14-H.0). M.M. acknowledges funding from ASI–INAF contract N. 2015-023-R.0. D.J.W. acknowledges financial support from an STFC Ernest Rutherford Fellowship.