Polarimetry of relativistic tidal disruption event Swift J2058+0516
Abstract
A small fraction of candidate tidal disruption events (TDEs) show evidence of powerful relativistic jets, which are particularly pronounced at radio wavelengths, and likely contribute non-thermal emission at a wide range of wavelengths. A non-thermal emission component can be diagnosed using linear polarimetry, even when the total received light is dominated by emission from an accretion disk or disk outflow. In this paper we present Very Large Telescope (VLT) measurements of the linear polarisation of the optical light of jetted TDE Swift J2058+0516. This is the second jetted TDE studied in this manner, after Swift J1644+57. We find evidence of non-zero optical linear polarisation, , a level very similar to the near-infrared polarimetry of Swift J1644+57. These detections provide an independent test of the emission mechanisms of the multiwavelength emission of jetted tidal disruption events.
keywords:
techniques: polarimetric – galaxies: jets1 Introduction
In recent years, a multitude of tidal disruption event candidates have been found in UV and optical widefield surveys, some of which also showing bright X-ray emission (e.g. Komossa 2015). Generally, the optical and UV emission seems to follow a thermal spectrum, with temperatures in the region of K. A rare subset of TDEs have been shown to produce powerful relativistic jets. To date, there are three firmly established relativistic tidal disruption events, Swift J164457 (e.g. Bloom et al. 2011; Burrows et al. 2011; Levan et al. 2011); Swift J20580516 (e.g. Cenko et al. 2012; Pasham et al. 2015) and Swift J1112.28238 (Brown et al. 2015, 2017). In all three cases, the sources showed bright, rapidly variable and long lasting X-ray emission (brighter than commonly seen in thermal spectrum TDEs), and a bright radio counterpart. All three sources were first identified in data from the Burst Alert Telescope (BAT), a -ray instrument on board the Neil Gehrels Swift Observatory (hereafter Swift). Two of these sources have particularly good observational coverage: Swift J164457 and Swift J20580516. In both these cases, broadband spectral energy distributions (SEDs) were obtained, spanning from low frequency radio wavelengths all the way to high energy -rays. The two sources differ somewhat in their optical and infrared behaviour: Swift J164457 shows high levels of extinction (e.g. Levan et al. 2011; Bloom et al. 2011; Burrows et al. 2011; Levan et al. 2016), making its optical and UV emission difficult to detect (Levan et al. 2016). Swift J20580516 suffers much less from extinction, resides in a fainter host,and is at far higher redshift ( vs ) enabling the optical and rest frame UV emission from the transient to be studied in greater detail. Pasham et al. (2015) show that the optical and infrared SED of Swift J20580516 can be described by a cooling blackbody-like spectrum in the rest frame, with a relatively constant radius, qualitatively similar to a large number of TDEs that are not seen to have relativistic jets, although significantly more luminous. The X-ray lightcurves of Swift J20580516 and Swift J164457 both show rapid variability at early times (e.g. Pasham et al. 2015; Krolik & Piran 2011; Saxton et al. 2012), and a very steep and sudden brightness drop half a year after the TDE -ray trigger (Pasham et al., 2015; Levan et al., 2016). The fast variability may provide a way to measure black hole masses, if the steep drop-off is associated with a transition from super-Eddington to sub-Eddington accretion regimes.
The detection rate of relativistic TDEs is low compared to the number of TDEs whose emission is generally thermal in the optical part of the spectrum (e.g. Saxton et al. 2019), and for which there is no relativistic jet component readily visible in the SED (see e.g. Auchettl, Guillochon & Ramirez-Ruiz 2017). To date, searches for non-thermal emission in thermal TDEs have largely focussed on deep radio and X-ray searches (e.g. van Velzen et al. 2013), with a detection of a radio jet in at least one thermal TDE (van Velzen et al. 2016; Alexander et al. 2016). Similar to black hole X-ray binaries, a weak jet component may also be found through linear polarimetry at optical and near-infrared wavelengths (see Russell 2018 and references therein), which makes polarimetry an important additional diagnostic tool, independent of SED and lightcurve models. Linear polarimetry has so far been limited to one jetted TDE (Swift J1644+57, Wiersema et al. 2012) and one TDE without jet detection (OGLE16aaa, Higgins et al. 2018). The infrared ( band) imaging polarimetry of Swift J1644+57 showed a sizeable degree of linear polarisation ( , measured after the initial steep decay phase and just prior a shallow decay phase, days after trigger; see lightcurve in Fig. 3 of Wiersema et al. (2012)), which motivated the polarimetric observations of Swift J2058+0516 presented in this paper.
In section 2 we discuss the data reduction and calibration of our optical imaging polarimetry of Swift J2058+0516, and in section 3 we compare our findings with those for Swift J1644+57 and recent numerical models.
2 Observations and data analysis
2.1 VLT polarimetry
We observed Swift J2058+0516 using the FOcal Reducer/low dispersion Spectrograph 2 (FORS2) on the Very Large Telescope (VLT) of the European Southern Observatory (ESO), using its imaging polarimetry observing mode. Observations were obtained in Service mode. We acquired data at three epochs (Table 1), with each epoch consisting of a series of three or four individual waveplate angle sequences. Each sequence consisted of four exposures that were taken with a Wollaston element and a half-wave plate in the beam. The half-wave plate was rotated at angles of , , and within one sequence. The Wollaston element splits the incoming light into two, the ordinary and extraordinary beams, which are orthogonally polarised. A strip mask is used to prevent overlap of the ordinary and extraordinary beam images. All polarimetric observations used the ESO filter, and a binning of the detector. We calculated the weighted average of all sequences per epoch to optimise our measurement signal to noise ratio. The midtimes of the three epochs, the number of sequences, exposure times and seeing conditions are listed in Table 1. The data quality of the second and third epoch are not optimal: there was poor seeing in epoch 2, and a high sky background (because of proximity to the Moon) in epoch 3.
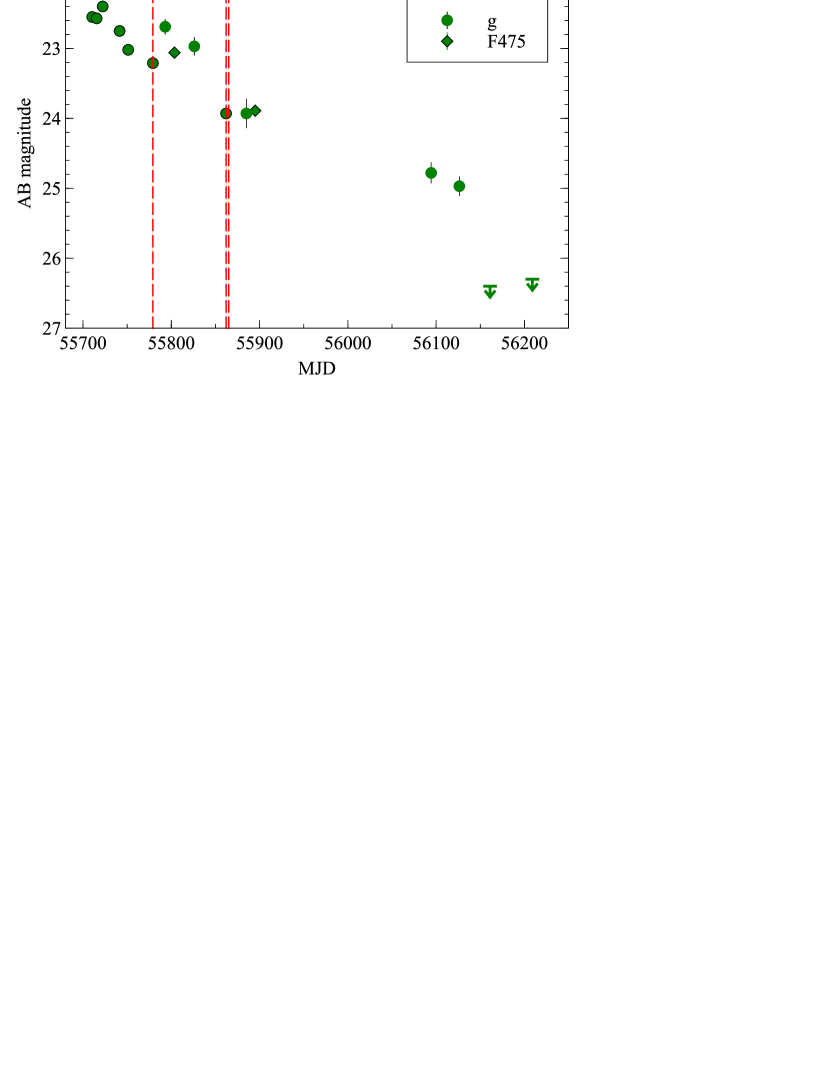
Acquisition images were obtained as part of the target acquisition procedure for the polarimetry observations, used to place the target into the strip mask. All acquisition images used the filter . After data reduction, the acquisition images belonging to a single polarimetry epoch were combined, the source was well detected in epoch 1 and epoch 2 acquisition data, but only marginally in epoch 3 (due to the poor observing conditions). We used aperture photometry to extract fluxes, and calibrated these directly onto Pan-STARRS111https://panstarrs.stsci.edu band values for field stars (ignoring colour terms). The lightcurve, including the acquisition image photometry and the photometry from Cenko et al. (2012) and Pasham et al. (2015), is shown in Figure 1, with vertical dashed lines indicating the epochs of polarimetry. The lightcurve appears to show some degree of variability on top of a steady decline, with a steep drop at late times (Pasham et al. 2015). Note that a wide range of instruments (and calibrations) were used, and one should be cautious in interpretation of apparent features in this lightcurve.
The polarimetric data were reduced using routines in IRAF222IRAF (Image Reduction and Analysis Facility) is distributed by the National Optical Astronomy Observatories, which are operated by the Association of Universities for Research in Astronomy, Inc., under cooperative agreement with the National Science Foundation., following the procedures outlined in Wiersema et al. (2014), using imaging flatfields and bias frames taken as close in time to the science data as possible. Fluxes for the TDE and field stars were extracted using aperture photometry in the same manner as in Wiersema et al. (2014). We calculated the normalized Stokes parameters and using a Python3333www.python.org script following the method described in Patat & Romaniello (2006). These were then converted into the degree of linear polarisation and the polarisation angle, and respectively, using the following relations
| (1) | ||||
| (2) | ||||
| (3) | ||||
where is an offset angle determined by the measured values of and (see Wiersema et al. 2012b). Note that we assume there is no polarimetric evolution within one epoch (i.e. we combine the sequences for each epoch together).
The measured linear polarisation has to be corrected for polarisation bias. The bias arises as linear polarisation is derived from the addition of and in quadrature (see Equation 1 or Serkowski 1958). There are a number of estimators that can correct for this bias, dependent on the signal to noise ratio (SNR; in flux as well as polarisation) of the source (e.g. Simmons & Stewart 1985). We use the modified asymptotic (MAS) estimator described in Plaszczynski et al. (2014) to correct for the polarisation bias. The generalised estimator is defined as follows
| (4) |
where is the estimation of the true polarisation and is the standard error on . The variance on can be found using the following relation
| (5) |
where and are the standard errors on and , respectively. Equation 5 assumes that and are independent.
For epochs where we have a positive detection of polarisation (i.e. ) the distribution of is approximately Gaussian. Therefore, for our second epoch we can simply quote the errors. As the signal to noise ratio decreases, the distribution of no longer follows a Gaussian distribution but instead follows a Rice distribution (Rice 1944; see also Patat & Romaniello 2006 for a numerical demonstration). This transition results in more complex confidence intervals for lower signal to noise ratios. We can calculate an upper limit on using the following analytical relation from Plaszczynski et al. (2014)
| (6) |
where , , and for a upper limit - which we quote for our first and third epochs. The measurements for all three epochs are shown in Table 1.
| MJD Date | Sequencesa | Exp. timeb | TDE magnitudec | Seeing | (x) | (x) | (x) | |
|---|---|---|---|---|---|---|---|---|
| (s) | (AB) | (arcsec) | (∘) | |||||
| 55779.14848 | 3 | 300 | 0.8 | 2.20() | -1.36() | - | ||
| 55862.07378 | 4 | 335 | 1.5 | 7.26() | 4.40() | 8.12() | 15.6() | |
| 55865.07486 | 4 | 335 | 0.9 | 1.26() | -5.68() | - |
2.2 Off axis instrumental polarisation/ line-of-sight Galactic dust contribution
The intrinsic polarisation of Swift J2058+0516 is not the only contributor to our measured polarisation. Dust particles residing on our line-of-sight can induce a significant polarisation signature through scattering. We attempted to quantify the Galactic dust contribution using field stars within the VLT field-of-view, assuming that the average intrinsic polarisation of field stars is zero.
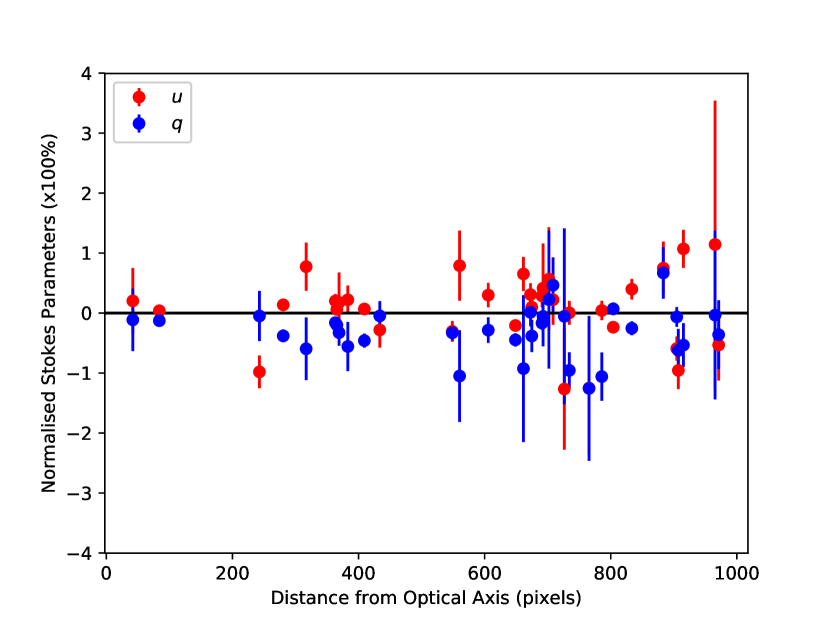
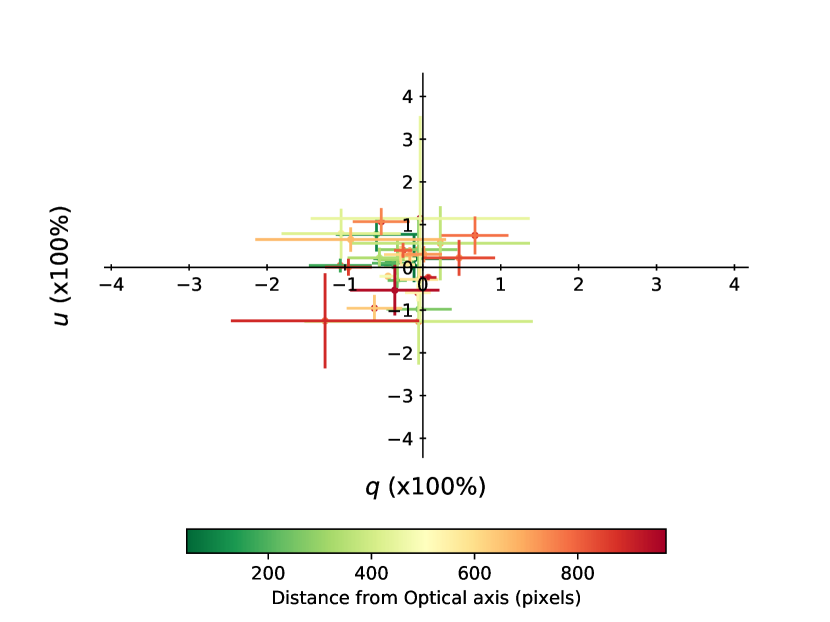
Our analysis included a total of 34 field stars at varying radial distances from the optical axis (where the TDE is placed). We calculated the and values utilising the weighted average from all 11 observations over the three epochs epoch to optimise our signal to noise ratio - as the stars are intrinsically unpolarised the polarisation signature in each epoch should be identical. The field stars are homogeneously distributed spatially around the optical axis and so we are confident that the summation of the contribution of instrumental polarisation from all of these sources is negligible (the instrumental polarisation likely has a weak radial pattern, increasing with radial distance from the optical axis, see e.g. Patat & Romaniello 2006 and González et al. in prep.). The field stars chosen covered a range of magnitudes from mag in the AB system. We opted for brighter sources to reduce the uncertainties on individual source measurements. Any measured offset in the centre of the Stokes and distribution should therefore come from the Galactic dust contribution. We calculated the polarisation signature using the same method described in section 2.1, Figures 2 and 3 show the field star distribution. The resulting estimate for the Galactic line of sight contribution of the polarisation is displayed in table 2: we find a low value of , in line with expectations from the low line of sight Galactic dust extinction, mag (Schlafly & Finkbeiner, 2011).
| (x) | (x) | (x) |
|---|---|---|
| -0.29() | 0.11() | <0.48 |
3 Discussion
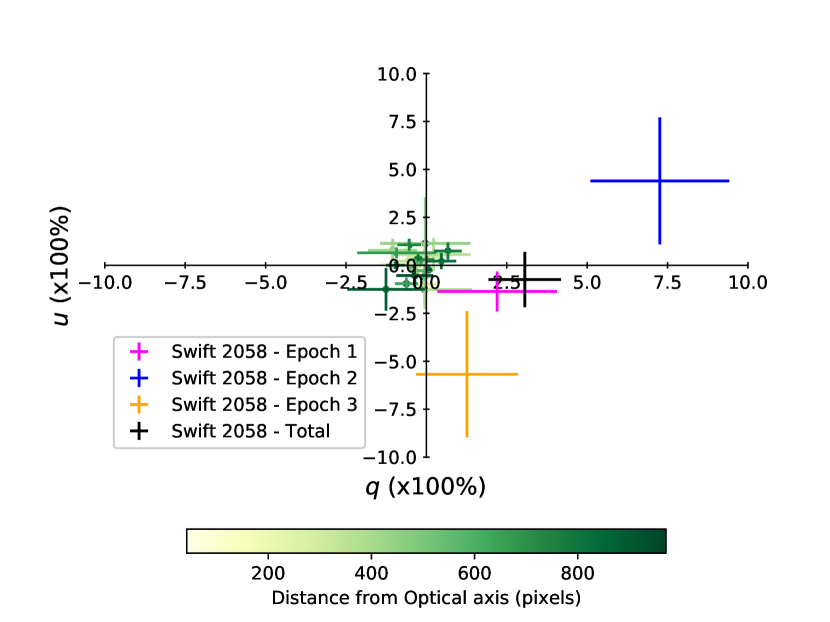
The measurements shown in Table 1 show a non-detection at epoch 1, a detection at epoch 2 (), and a non-detection at epoch 3. Epochs 2 and 3 are taken very close to each other, but conditions at epoch 3 were considerably poorer, and the 2 limit for epoch 3 is consistent with the detected level in epoch 2. At epoch 1 we see a non-detection, with a 2 limit of 5.3%. This may imply some variation in between epochs 1 and 2, which is more clearly seen in the plane (Figure 4), where epoch 2 and 3 appear more distinct. However, given the relatively large uncertainties, a constant level of of (the level detected in epoch 2) can not be confidently ruled out. We further note that we assumed there is no polarisation variations at timescales of a single observation epoch. If the polarisation angle changes rotates fast compared to the duration of an observing epoch, the polarisation would be smeared out and variation difficult to measure.
3.1 Comparison with Swift J1644+57
The only other jetted TDE with linear polarimetry measurements is Swift J1644+57. This source showed a non-zero linear polarisation in the band, of , measured using the William Herschel Telescope (Wiersema et al. 2012). At first glance, the measured linear polarisation of Swift J1644+57 and Swift J2058+0516 are remarkably similar, however there are some caveats to this comparison. First of all, the very high levels of dust extinction in the case of Swift J1644+57 likely imply a non-negligible contribution by dust scattering to the observed linear polarisation, though it is very unlikely that all the polarisation is caused by dust scattering in the host (Wiersema et al. 2012). Secondly, the observations of Swift J1644+57 were done in the near-infrared band and the source redshift is (Levan et al. 2011), the observations of Swift J2058+0516 were done in the filter and the source redshift is (Cenko et al. 2012). This means that for Swift J1644+57 the polarimetry was done in the rest-frame near-infrared, whereas for Swift J2058+0516 these were done in the rest-frame near-ultraviolet. These wavelength regimes may have somewhat different origins (Curd & Narayan 2018; see section 3.3). Thirdly, the observations of Swift J1644+57 are obtained when the source showed a plateau-like lightcurve evolution (Figure 3 in Wiersema et al. 2012), whereas Swift J2058+0516 showed a somewhat more steady decline (Pasham et al. 2015).
3.2 Radio polarimetry
The relativistic jet physics of TDEs is arguably easiest to study at radio wavelengths, where the forward shock from the jet is bright. Indeed a rich phenomenology is seen that can be followed from just hours after the jet launch to years after. Abundant radio observations over a wide radio spectrum were obtained for Swift J164457 (Zauderer et al. 2011; Berger et al. 2012; Wiersema et al. 2012; Zauderer et al. 2013; Cendes et al. 2014; Yang et al. 2016; Eftekhari et al. 2018). For Swift J20580516, the data-set at radio wavelengths is considerably smaller (Cenko et al. 2012; Pasham et al. 2015) in terms of lightcurve and spectral coverage. In Wiersema et al. (2012) we derived deep limits on the polarisation of the radio emisison of Swift J1644+57 (most sensitive 3 limits as deep as 2.1%), using deep observations with the Westerbork Synthesis Radio Telescope, at a range of wavelengths and timescales. To date, this remains the only published radio polarimetry data of a TDE. A small number of flux values at radio wavelengths for Swift J2058+0516 have been reported in the literature (Cenko et al. 2012; Pasham et al. 2015), using the Very Large Array (VLA) and the Very Long Baseline Array (VLBA), but we are unable to derive sensitive polarisation measurements or limits for these observations, as insufficient polarisation calibrator observations were obtained.
3.3 Comparison with models
It appears likely that the diversity in TDE emission is related to the dynamics and geometry of the accretion flow (with as key parameters the strength of the magnetic field around the black hole, the black hole mass and the black hole spin parameter), the accretion rate, and the viewing angle. Optical emission may originate from a variety of mechanisms, e.g. from the accretion disk, the jet, reprocessed X-ray emission, or from shocks generated by stellar debris self-crossing (Piran et al., 2015).
Dai et al. (2018) and Curd & Narayan (2018) present a set of 3 dimensional general relativistic magneto-hydrodynamic simulations to explore the impact of the various parameters on the resulting TDE spectra and lightcurves. Both groups find a relativistic jet is generated in some of their models. In particular, Curd & Narayan (2018) find that one of their models has a clear collimated relativistic outflow, with properties broadly consistent with those seen in jetted TDEs. The spectra computed by Curd & Narayan (2018) for the cases that do not produce a jet, match fairly well with observations of non-jetted TDEs, in particular reproducing the thermal components and properties of the X-ray emission. There are some discrepancies with observations and with the work from Dai et al. (2018) regarding the X-ray and optical emission for sources at different inclination angles. Curd & Narayan (2018) compare their simulation with data of Swift J1644+57, finding reasonable agreement with X-ray observations and jet structure, but the large, and uncertain, extinction in the line of sight of Swift J1644+57 precludes a comparison in the UV and optical range. Their model predictions indicate the presence of strong, beamed, X-ray and -ray emission from the jet. In the ultraviolet a thermal peak is predicted arising from the torus, with in the far infrared a thermal synchrotron peak. In the optical domain the received light comes in part from the torus and in part from the outflow in the models of Curd & Narayan (2018), in proportions depending on the viewing angle.
An alternative model of TDE accretion and emission is presented by Coughlin & Begelman (2014). They argue that angular momentum of the infalling matter is too small to produce an accretion disk. Instead, the accretion energy is trapped and inflates the infalling gas to form a quasi-spherical “ZEro-BeRnoulli Accretion" flow, or ZEBRA. ZEBRAs radiate as blackbodies, but can only do so up to the Eddington limit. Any additional accretion energy, injected into the inner regions of the ZEBRA by the black hole, is also unable to be efficiently advected to the surface inhibiting wind formation. Instead, this excess energy must escape as polar jets where the surface of the ZEBRA envelope can be exited. This model therefore accounts for both jetted and non-jetted TDEs as dependent on the observation angle, similarly to the unified model proposed by Dai et al. (2018). Swift J164457, Swift J1112.28238 and Swift J20580516 have all previously been examined in relation to the ZEBRA model (Coughlin & Begelman 2014; Wu, Coughlin & Nixon 2018). In particular, the ZEBRA model demonstrates a good agreement with the X-ray data for all three events, specifically the time scale at which the X-ray flux drops as the accretion rate falls to sub-Eddington levels and the jet turns off, while the power law spectrum and luminosity of Swift J164457’s jet is consistent with the predictions from the ZEBRA model. During the jetted phase of Swift J20580516, the temperature of the thermal-like spectrum observed in the optical and UV is also consistent with the ZEBRA model, particularly with a black hole mass of solar masses, within the constraints found by Cenko et al. (2012). Comparing the ZEBRA model to non-jetted TDEs, Wu, Coughlin & Nixon (2018) find that the temperatures of a few K generally predicted are also more consistent with observations. In particular, there is a strong agreement with the SEDs of iPTF16axa (Hung et al. 2017) and PS1-10jh (Gezari et al. 2012).
We may expect significant linear polarisation for (optical) emission from the jet and for (inverse) Compton scattered emission, but much less so for the thermal torus emission. The forward shock emission (the interaction of the jet with external medium, not analysed in e.g. Curd & Narayan 2018) will be linearly polarised as well, with the amount depending on the jet structure (which is likely not homogeneous for at least Swift J1644+57, see e.g. Mimica et al. 2015), the viewing angle and the jet opening angle, and the detailed properties of the magnetic field in the shock, i.e. is all the field random and confined to the shock, or is there an ordered component perpendicular to the shock - this is a well studied problem in gamma-ray burst afterglows (e.g. Gill & Granot 2018). At longer wavelengths, plasma propagation effects can give rise to significant depolarisation of the forward shock radio emission (e.g. Toma et al. 2008). In addition to these internal effects, we are also likely to see the effect of dust scattering on the received polarisation (see discussion in Wiersema et al. 2012), which can polarise intrinsically unpolarised emission, convert linear to circular polarisation (see discussion in Wiersema et al. 2014), and alter the linear polarisation properties of intrisically polarised light. In the case of Swift J1644+57 there is clear evidence of a large dust column, based on the very red colours of the transient light, whereas for Swift J2058+0516 the inferred amount of dust in the line of sight is far lower: Pasham et al. (2015) place a limit of mag (assuming a Milky Way like extinction law). This limit indicates that dust scattering along the line of sight is unlikely to contribute more than polarisation at the observed wavelength (a more exact limit requires a better understanding of the dust grain size distribution). Our detection of linear polarisation in Swift J2058+0516 at rest-frame blue optical/near-UV range indicates that some non-thermal emission is present in the received flux. The polarisation is moderate, and may be in agreement with the predicted flux origins by Curd & Narayan (2018), though a more quantitative comparison would require polarisation measurements of a larger number of sources, at a larger number of wavelengths, and with smaller uncertainties.
3.4 Future TDE polarimetric follow-up
The sample of polarimetrically studied TDEs is very small. The predicted future TDE yield of large (optical) surveys like ZTF and LSST is large (Hung et al. 2018; LSST Science Collaboration 2009), and will allow a more systematic approach to TDE polarimetry in both optical and longer wavelengths. In Higgins et al. (2018) we trialled a linear polarimetry programme (the Snapshot survey for Polarised Light in Optical Transients, SPLOT) that obtained snapshot optical linear polarimetry of a large sample of randomly selected optical transients, which included a thermal TDE. A similar approach, using high-volume optical transient streams like the ZTF transient stream, and pre-selecting on nuclear transients, may greatly increase the yield of TDE polarimetry. It would simultaneously probe the effect of dust scattering in a statistical manner. A targeted optical polarimetric survey of TDE candidates with a high likelihood of having a relativistic jet, i.e. ones triggered by space based X-ray or -ray detectors, or found in wide-field radio surveys (e.g. by MeerKAT; Booth et al. 2009), can further elucidate the origin of the different spectral components of TDEs. Optical and near-infrared spectro-polarimetry would be a key extension to the imaging polarimetry presented in this paper and in Wiersema et al. (2012). At the same time, a sample of thermal TDEs could remain valuable as a comparison, and has yet to be obtained. Since thermal TDEs are more common, and hence often at lower redshift, such observations can be obtained more readily. While limited to the brightest subsample (Swift J2058+0516 was too faint for optical spectro-polarimetry throughout its evolution), the effects of dust scattering and the origin of the non-thermal emission have different wavelength dependency, so spectro-polarimetry would easily allow breaking of degeneracies, in a manner similar to spectro-polarimetric studies of (core-collapse) supernovae.
In the X-ray regime, TDEs are an important component of the science cases for future X-ray polarimetry-capable missions such as IXPE and eXTP (e.g. in ‘t Zand et al. 2019). The jetted TDEs are very bright at X-ray wavelengths, giving X-ray polarimetry with small statistical errors even at relatively short exposure times (in ‘t Zand et al. 2019), allowing tests for jet precession, the formation of globally ordered fields, and variations of the magnetic field over short timescales (in ‘t Zand et al. 2019). At radio wavelengths, the advent of large, wide-field surveys (e.g. with the WSRT Apertif, Oosterloo, Verheijen & van Capellen 2010) will provide a way to select jetted TDEs via their non-thermal radio emission, and collect polarisation information for a large sample (Apertif will survey the northern sky in polarised continuum). Deep circular radio polarimetry will similarly help test models for Faraday conversion in the jet, or in the intervening medium. Ultimately, the success of polarimetry for jetted-TDEs will depend both the availabilty of suitable resources, and on the detection of candidates, which to date, have been rare.
4 Conclusions
In this paper, we present optical ( band) imaging polarimetry of Swift J2058+0516 using the VLT. This is only the second jet-driving, relativistic, tidal disruption event studied using polarimetry, after Swift J1644+57. We obtained three epochs of data, in which we find evidence of linear polarsation in the second epoch, at a level , the other two epochs provide upper limits. There is weak evidence for polarisation variation between the epochs. We compare the polarisation information to current basic models, and find that these can accomodate small levels of linear polarisation as measured. Our measurements of two relativistic TDEs show the value of linear polarimetry as a tool to better understand the contributions of disk, jet and winds to the received spectrum. Polarimetry over a wider wavelength range will help to break existing degeneracies in comparison of models with lightcurve and broadband spectral energy distributions.
Acknowledgements
We thank the anonymous referee for their constructive comments that improved this paper. Based on observations collected at the European Organisation for Astronomical Research in the Southern Hemisphere under ESO programme 288.B-5011(A), PI A. Levan. KW, AJL & NRT acknowledge that this project has received funding from the European Research Council (ERC) under the European Unions Horizon 2020 research and innovation programme (grant agreement no 725246). NRT, RLCS, ABH and RAJE thank the STFC for support. RLCS acknowledges support from Royal Society Research Grant RG170230. KW thanks S. Covino for insightful discussion.
References
- Alexander et al. (2016) Alexander, K. D., Berger, E., Guillochon, J., Zauderer, B. A., Williams, P. K. G. 2016, ApJ 819, L25
- Auchettl, Guillochon & Ramirez-Ruiz (2017) Auchettl, K., Guillochon, J. & Ramirez-Ruiz, E. 2017, ApJ 838, 149
- Berger et al. (2012) Berger, E., Zauderer, A., Pooley, G. G., et al. 2012, ApJ, 748, 36
- Bloom et al. (2011) Bloom, J. S. et al. 2011, Science, 333, 203
- Booth et al. (2009) Booth, R. S., de Blok, W. J. G., Jonas, J. L. & Fanaroff, B. 2009, arXiv:0910.2935
- Brown et al. (2015) Brown, G. C., Levan, A. J., Stanway, E. R., Tanvir, N. R., Cenko, S. B., Berger, E., Chornock, R., Cucchiara, A. 2015, MNRAS 452, 4297
- Brown et al. (2017) Brown G. C., et al., 2017, MNRAS, 472, 4469
- Burrows et al. (2011) Burrows, D. N. et al. 2011, Nature, 476, 421
- Cao & Wang (2018) Cao, X. & Wang, T. 2018, arXiv:1810.06358
- Cendes et al. (2014) Cendes, Y. et al. 2014, arXiv:1412.3986
- Cenko et al. (2012) Cenko, S. B. et al. 2012, ApJ 753, 77
- Coughlin & Begelman (2014) Coughlin, E. R. & Begelman M. C. 2014, ApJ 781, 82
- Curd & Narayan (2018) Curd, B. & Narayan, R. 2018, arXiv:1811.06971
- Dai et al. (2018) Dai, L., McKinney, J. C., Roth, N., Ramirez-Ruiz, E., Miller, M. C. 2018, ApJ, 859, 20
- Eftekhari et al. (2018) Eftekhari, T., Berger, E., Zauderer, B. A., Margutti, R., Alexander, K. D. 2018, ApJ 854, 86
- Flewelling et al. (2016) Flewelling H. A., et al., 2016, arXiv:1612.05243
- Gezari et al. (2012) Gezari, S. et al. 2012, Nature 485, 217
- Gill & Granot (2018) Gill, R. & Granot, J. 2018, MNRAS 478, 4128
- Higgins et al. (2018) Higgins, A. B. et al. 2019, MNRAS 482, 5023
- Hung et al. (2017) Hung, T. et al. 2017, ApJ 842, 29
- Hung et al. (2018) Hung, T. et al. 2018, ApJS 238, 15
- Komossa (2015) Komossa, S. 2015, J. High Energy Astrophys. 7, 148
- Krolik & Piran (2011) Krolik, J. H. & Piran, T. 2011, ApJ 743, 134
- Levan et al. (2011) Levan, A. J. et al. 2011, Science 333, 199
- Levan et al. (2016) Levan, A. J. et al. 2016, ApJ 819, L51
- LSST Science Collaboration (2009) LSST Science Collaboration, 2009, arXiv:0912.0201
- Lu & Kumar (2016) Lu, W. & Kumar, P. 2016, MNRAS 458, 1071
- Lu et al. (2017) Lu, W., Krolik, J., Crumley, P., Kumar, P. 2017, arXiv:1706.09414
- Mimica et al. (2015) Mimica, P., Giannios, D., Metzger, B. D., Aloy, M. A. 2015, MNRAS 450, 2824
- Oosterloo, Verheijen & van Capellen (2010) Oosterloo T., Verheijen M., van Cappellen W. 2010, in ISKAF2010 Science Meeting. p. 43 (arXiv:1007.5141)
- Pasham et al. (2015) Pasham, D. R. et al. 2015, ApJ 805, 68
- Patat & Romaniello (2006) Patat, F & Romaniello, M. 2006, PASP, 118, 839
- Piran et al. (2015) Piran, T., Svirski, G., Krolik, J., Cheng, R. M. & Shiokawa, H. 2015, ApJ 806, 164
- Plaszczynski et al. (2014) Plaszczynski, S., Montier, L., Levrier, F., Tristram, M., 2014, MNRAS, 439, 4048
- Rice (1944) Rice, S. O., 1944, Bell Systems Tech, J, 23, 282
- Russell (2018) Russell, D. 2018, Galaxies 6, 3
- Saxton et al. (2012) Saxton, C. J., Soria, R., Wu, K., Kuin, N. P. M. 2012, MNRAS 422, 1625
- Saxton et al. (2019) Saxton, R. et al. 2019, AN 340, 351
- Schlafly & Finkbeiner (2011) Schlafly, E. F., & Finkbeiner, D. P. 2011, ApJ, 737, 103
- Seifina, Titarchuk & Virgilli (2017) Seifina, E., Titarchuk, L. & Virgilli, E. 2017, A&A 607, 38
- Serkowski (1958) Serkowski, K., 1958, Acta Astron,8, 135
- Simmons & Stewart (1985) Simmons, J. F. L., Stewart, B. G., 1985, A&A, 142, 100
- Toma et al. (2008) Toma, K., Ioka, K. & Nakamura, T. 2008, ApJ 673, L123
- van Velzen et al. (2013) van Velzen, S., Frail, D. A., Körding, E., Falcke, H. 2013, A&A 552, 5
- van Velzen et al. (2016) van Velzen, S. et al. 2016, Science 351, 62
- Wardle & Kronberg (1974) Wardle, J. F. C., Kronberg, P. P., 1974, ApJ, 194, 249
- Wiersema et al. (2012) Wiersema, K. et al. 2012, MNRAS 421, 1942
- Wiersema et al. (2012b) Wiersema, K. et al. 2012b, MNRAS 426, 2
- Wiersema et al. (2014) Wiersema, K. et al. 2014, Nature 509, 201
- Wu, Coughlin & Nixon (2018) Wu, S. Coughlin, E. R., Nixon C. 2018, MNRAS 478, 3016
- Yang et al. (2016) Yang, J., Paragi, Z., van der Horst, A. J. et al. 2016, MNRAS 462, 66
- Zauderer et al. (2011) Zauderer, B. A., Berger, E., Soderberg, A. M., et al. 2011, Nature, 476, 425
- Zauderer et al. (2013) Zauderer, B. A., Berger, E., Margutti, R., et al. 2013, ApJ, 767, 152
- in ‘t Zand et al. (2019) in ‘t Zand, J. J. M. et al. (eXTP) 2019, Sci. China Phys. Mech. Astron. 62, 029506