Galaxy And Mass Assembly (GAMA): Properties and evolution of red spiral galaxies
Abstract
We use multi-wavelength data from the Galaxy and Mass Assembly (GAMA) survey to explore the cause of red optical colours in nearby () spiral galaxies. We show that the colours of red spiral galaxies are a direct consequence of some environment-related mechanism(s) which has removed dust and gas, leading to a lower star formation rate. We conclude that this process acts on long timescales (several Gyr) due to a lack of morphological transformation associated with the transition in optical colour. The sSFR and dust-to-stellar mass ratio of red spiral galaxies is found to be statistically lower than blue spiral galaxies. On the other hand, red spirals are on average dex more massive, and reside in environments 2.6 times denser than their blue counterparts. We find no evidence of excessive nuclear activity, or higher inclination angles to support these as the major causes for the red optical colours seen in 47% of all spirals in our sample. Furthermore, for a small subsample of our spiral galaxies which are detected in HI, we find that the SFR of gas-rich red spiral galaxies is lower by dex than their blue counterparts.
keywords:
galaxies: evolution; galaxies: fundamental parameters; galaxies: structure; galaxies: star formation; galaxies: stellar content1 Introduction
Conventional wisdom suggests that most spiral galaxies are vigorously forming stars leading to blue optical colours, and are younger relative to their elliptical counterparts. Spiral galaxies also preferentially inhabit less dense environments (e.g. Dressler, 1980) relative to passively evolving elliptical galaxies. Large datasets from all-sky surveys have however challenged this view by establishing the existence of red spiral galaxies. Red spiral galaxies may result from attenuation due to dust (e.g. Valentijn, 1990; Driver et al., 2007; Koyama et al., 2011), high metallicity (e.g. Mahajan & Raychaudhury, 2009), low star formation rate (SFR) (e.g. Moran et al., 2006; Masters et al., 2010b; Cortese, 2012b; Tojeiro et al., 2013) or no detectable star formation (Fraser-McKelvie et al., 2016).
Red optical colours of a significant fraction of spiral galaxies in the nearby Universe is a debatable issue in the literature. Mahajan & Raychaudhury (2009) showed that for a sample of galaxies found in low redshift () clusters, only of the red star-forming galaxies are dust-reddened. Mahajan & Raychaudhury (2009) found statistical evidence favouring high metallicity as the cause of optical red colours in the remaining half of the star-forming galaxies in and around clusters. On the other hand, a recent study (Bremer et al., 2018) of nearby galaxies, found in the green valley of the optical colour-magnitude space showed that the change in colours from blue to red is primarily due to the change in the colour of the disc. Bremer et al. (2018) also showed that most of the green valley galaxies have significant bulges, suggesting that a strong bulge is present prior to decline in the star formation of galaxies.
Several other studies made use of multi-wavelength data to show that the star formation activity of optically-red spiral galaxies is not different from their blue counterparts (e.g. Cortese et al., 2012a; Bonne et al., 2015). But Tojeiro et al. (2013) found that star formation in the red spirals is reduced by a factor of three relative to their blue counterparts in the last Myr. These authors also found that the star formation history of red and blue spirals is similar at earlier times, and that red spirals are still forming stars times faster than red ellipticals over the same period of time. These observations are also in broad agreement with the recent findings from submillimeter surveys which have discovered populations of optically-red, massive star-forming galaxies, likely to be the recent progenitors of red, passive galaxies at (e.g. Eales et al., 2018a, b).
Large inclination angles cause large optical depth, which may result in the unexpected red colours of spiral galaxies (e.g. Valentijn, 1990; Driver et al., 2007). Furthermore, the total extinction in spirals in the -band is found to increase from face-on to edge-on spirals by 0.5 mag (Masters et al., 2010a). Koyama et al. (2011) found many dusty red H emitters around Abell 851 () associated with groups of galaxies (also see Santos et al., 2013). This discovery supports the scenario where pre-processing in groups involves dusty star formation activity, which eventually truncates star formation in infalling galaxies (Koyama et al., 2011; Mahajan, Raychaudhury, & Pimbblet, 2012; Mahajan, 2013). But other authors (e.g. Masters et al., 2010b) found no correlation between optical colours and the environment of face-on disks, which led them to conclude that environment alone can not transform the optical colour of a galaxy.
It has also been suggested that the red optical colours of some spirals could result from the presence of nebular emission in these galaxies (Masters et al., 2010b; Kaviraj et al., 2015). In an independent analysis of HI-detected, passive galaxies, Parkash et al. (2019) find that the integral field unit spectra of 20 out of 28 galaxies in their sample have extended low-ionization emission-line regions (LIERs) and 1 has low-ionization nuclear emission-line regions (LINERs). Parkash et al. (2019) therefore concluded that 75% of HI galaxies with little or no star formation are LIERs or LINERs. On the contrary, in a pilot study of six passive spiral galaxies () using multi-band photometric and integral field spectroscopic data, Fraser-McKelvie et al. (2016) found that none of the galaxies in their sample showed signs of substantial nebular emission.
In this work we make use of data products obtained from a multi-wavelength dataset covering ultraviolet (UV) to 21 cm radio continuum observations available for a variety of galaxies in the nearby Universe, to address the cause of red optical colour of some spiral galaxies. Our goal is to (i) compare an unbiased sample of red spiral galaxies with their blue counterparts using various physical properties, in order to get an insight into the cause of red optical colours, and (ii) check if the optical colour of these spirals is reversible, i.e. if the red spirals have enough fuel to form new stars, which can push them back into the blue cloud in the colour-magnitude plane. We present the dataset and the derived properties of galaxies analysed in this work in the following section. In Sec. 3 we compare various properties of the red and blue spiral galaxies to establish how the two populations differ beyond optical colours. We then incorporate the 21 cm HI continuum data to get further insight into the properties of spiral galaxies, and explore the dust and gas content of red spiral galaxies in Sec. 4. Finally, we discuss our observations in the light of the existing literature in Sec. 5 and present our final conclusions in Sec. 6. Throughout this work we use concordance cold dark matter cosmological model with km s-1 Mpc-1, and to calculate distances and magnitudes.
2 data
In this paper we utilise the -band selected sample of galaxies from the Galaxy and Mass Assembly (GAMA) survey (Driver et al., 2011; Hopkins et al., 2013; Liske et al., 2015). GAMA is a multi-wavelength campaign based on the SDSS (Data Release 7) photometry, and has obtained spectra for million galaxies with the AAOmega spectrograph on the Australian Astronomical Telescope (AAT). This work is based on the data from the three equatorial regions (G09, G12 and G15) covering square degrees on the sky. GAMA is complete to mag (Driver et al., 2011).
The parent sample for this work was selected from the LocalFlowCorrection data management unit (DMU henceforth) version 14 (Baldry et al., 2012). We selected all galaxies with (Baldry et al., 2010) in the redshift range . The former criterion ensures a high quality redshift for the selected galaxies, while the latter is chosen to exclude Galactic stars and obtain Hubble type classification following Kelvin et al. (2014) from the VisualMorphology DMU. These criteria result in a master sample of 7,984 galaxies.
2.1 Spectroscopic and photometric data
The matched aperture photometry for all galaxies in 21 wavebands is obtained from the LambdarPhotometry DMU version 1 (Wright et al., 2016). The Lambda Adaptive Multi-Band Deblending Algorithm in R (LAMBDAR) calculates the matched aperture photometry across images that are neither matched in pixel-scale nor point spread function, using prior aperture definitions derived from high-resolution optical imaging. Specifically, we use the LambdarInputCatUVOptNIR v01, LambdarSDSSgv01 and LambdarSDSSrv01 catalogues from the LambdarPhotometry DMU. The magnitudes are then corrected to using the prescription of Chilingarian & Zolotukhin (2012). The median -correction for our sample is mag in the and bands. We have also made use of the WISE photometry from WISEcatv02 (Cluver et al., 2014) for our sample.
2.2 The spiral galaxies
Our sample of spiral galaxies is based on the classification provided in the VisualMorphology DMU (version 3). Specifically, we adopted the Hubble type classification and selected all galaxies which are classified as Sa, Sb or Sc type spirals (Table 1). Two authors (KKG and RR) further visualized the 5-colour SDSS images of all galaxies in our sample classified as Sd-Irr to find 55 Sd spirals and 3,276 irregular galaxies. Another 208 galaxies in this class remain unclassifiable into either of these two categories. Since the number of unclassified Sd-Irr galaxies is small, we decided to incorporate them in the following analysis along with the 55 Sd spirals. We also repeated our analysis by excluding the unclassifiable galaxies, and confirm that all the results presented here are statistically robust against exclusion of the unclassifiable galaxies in the final sample.
Therefore, our final sample of spirals comprises 2,512 galaxies (including a small fraction of irregular galaxies and lenticulars), which is henceforth referred to as ‘spirals’ for convenience and is used throughout this paper unless specified otherwise.
| Class | Description | Number of galaxies |
|---|---|---|
| S0-Sa | Lenticulars and spirals | 746 |
| SB0-SBa | Lenticulars and spirals | 80 |
| Sab-Scd | Spirals | 1,232 |
| SBab-SBcd | Spirals | 191 |
| Sd-Irr | Spiral and irregular galaxies | 3,539 |

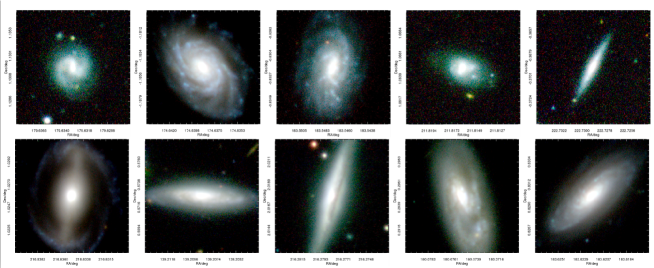
Figure 2 shows the bimodal colour distribution of all GAMA galaxies (). In order to divide our sample into red and blue, we fit the colour distribution with two gaussians with mean (standard deviation, ) at 0.41 (0.10) and 0.73 (0.08). Based on this exercise we adopt the colour value mag, which is from the mean of both the fitted gaussians, as the boundary between the red and blue spiral galaxies. This criteria results in 2,203 red galaxies () in the master sample, of which 1,049 are spirals. Some examples of spiral galaxies in the red and blue sub-samples are shown in Fig. 1. This is in broad agreement with the study of Bonne et al. (2015), who used the Two Micron All Sky Survey Extended Source Catalog to report the fraction of red spirals to be 20%–50% of all spirals with , and in excess of 50% for galaxies brighter than mag.
In the following, we compare the physical properties of red spirals with their blue counterparts, and the ensemble of all GAMA galaxies in our chosen redshift range.
2.3 Physical properties
Physical parameters for all GAMA galaxies in the three equatorial regions have been obtained by fitting the 21-band photometric data with the stellar energy distribution code Multi-wavelength Analysis of Galaxy Physical Properties (magphys; da Cunha, Charlot, & Elbaz, 2008). The magphys output includes star formation rate (SFR), specific star formation rate (SFR/; sSFR), stellar mass (), dust mass (), -band light weighted age and metallicity amongst others. We compile these properties for our sample from the Magphys DMU (version 6).
The SFR obtained by magphys is an integrated measure of its star formation. Therefore it represents the star formation activity of a galaxy averaged over a long time (specifically 0.1 Gyr for magphys). But at it is linearly correlated with the instantaneous measure of SFR obtained from the H emission line (see fig. 1 of Mahajan et al., 2018).
3 Red vs Blue
With a sample of red spiral galaxies defined, we now intend to explore the cause for the unusual optical colours for this subset of spiral galaxies in our sample.
3.1 Viewing angle of red and blue spirals
Inclination of galaxies is known to correlate with optical colours (e.g. Holmberg, 1958; Masters et al., 2010a). Using a sample of galaxies from the SDSS, Masters et al. (2010a) showed that not only is the effect of dust reddening significant on inclined spirals, but bulge-dominated early-type spirals are intrinsically red. In order to test the impact of inclination in our sample of spirals, we first analysed the distribution of the inclination angle of the red and blue spiral galaxies. If a spiral disk is represented by an oblate spheroid, the inclination of the plane of the galaxy to the line of sight is obtained by the relation
| (1) |
where is the observed ratio of minor to major diameters, and is the intrinsic axial ratio of the spheroid (Holmberg, 1958). In this work we use the values listed in table 1 of Masters et al. (2010a) for different morphological types of galaxies as following:
-
•
S0-Sa, SB0-SBa : 0.23
-
•
Sab-Scd, SBab-SBcd : 0.20
-
•
Sd, Unclassified : 0.103
Since typically , we note that the distributions does not change qualitatively even if we fix to this value.
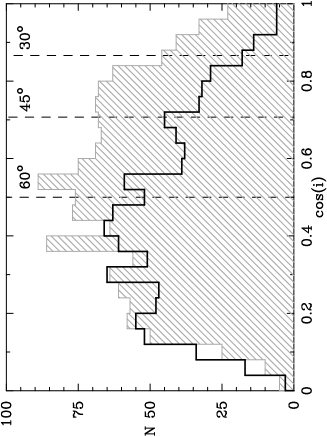
In this work we use the ratio in the -band to determine the inclination as defined above. If our sample is unbiased, it should have a flat distribution of signifying randomly oriented galaxies. Fig. 3 however shows that the truth is far from this assumption. Firstly, we notice that the distribution of red and blue spiral galaxies with is statistically similar, but at inclination angles below , the median of red galaxies is likely to be more than their blue counterparts. We confirm the difference between the inclination of red and blue spirals using the Kolmogorov-Smirnov (KS) statistic, which tests for the null hypothesis that the two distributions are drawn from the same parent sample. In this case the KS statistical probability is , thus rejecting the hypothesis that the inclination of red and blue galaxies is similar. Furthermore, while 51% of the blue spiral galaxies have , only 37% of the red spirals follow suit. These observations suggest that optical colours of at least some of the red spirals may be due to their inclination relative to the line of sight.
Figure 3 also shows that our sample has a deficit of galaxies with and . This is in broad agreement with the observations of Masters et al. (2010b) who found a similar deficit of galaxies with and . Moreover, we find the distribution of for the red and blue spiral galaxies to be relatively flat in the range and , respectively.
In order to test if there is any correlation between the colour and we use the Spearman’s rank correlation statistic, which tests for the strength and direction of the monotonic relation between two variables. We find the Spearman’s rank correlation and the corresponding probability () that the rank deviates from zero to be and for the blue and red spiral galaxies, respectively. This result confirms that there is no significant correlation between the colour and for the blue spiral galaxies, and only a marginal correlation for the red spiral galaxies. The latter is expected due to optical reddening of the edge-on spiral galaxies as discussed in detail by Masters et al. (2010a).
3.2 Dust content
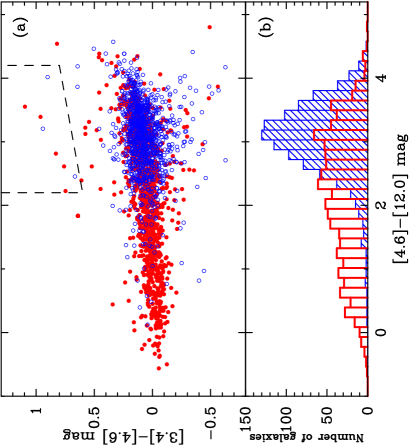
In this work we make use of the WISE photometry for all our galaxies to test if the red spirals are optically reddened due to dust. WISE infrared data are available for around 95% of the blue and 98% of the red spiral galaxies for our sample. The WISE colours are subtly different from those obtained from other infrared observatories such as Spitzer because of the 12.0 m (W3) band. The W3 band is sensitive to the poly-cyclic aromatic hydrocarbon (PAH) emission at 11.3 m from the nearby galaxies, as well as warm continuum emission from active galactic nuclei (AGN) at all redshifts (Jarrett et al., 2011). While stars and elliptical galaxies have WISE colours , spiral galaxies are red in [4.6]-[12], and ultra-luminous infrared galaxies (ULIRGs) tend to be red in the [3.4]-[4.6] colour as well.
In Fig. 4 we show the colour-colour distribution of the red and blue spiral galaxies, respectively. This figure can be directly compared to fig. 26 of Jarrett et al. (2011) or fig. 12 of Wright et al. (2010)111In order to make this comparison, Fig. 4 shows colours in Vega magnitude unlike all other colours and magnitudes discussed in this paper which are expressed as AB magnitude.. It is interesting to note that despite their optical colour, the red spirals occupy the region of the diagram expected for nearby spiral galaxies. On the other hand, blue galaxies are found in a cloud at [4.6]-[12] mag expected for spiral galaxies with high SFR, and a small fraction occupying colour space ([4.6]-[12] mag and [3.4]-[4.6] mag) expected for starburst galaxies. Since redder [4.6]-[12] colour implies higher dust content, Fig. 4 suggests that the blue spiral galaxies are more dusty than their red counterparts. Specifically, while 95% of the blue spiral galaxies have [4.6]-[12] mag, about 58% of the red spiral galaxies follow suit. In agreement with other such studies (Cluver et al., 2014), we find that irrespective of the optical colour, WISE colours of very few galaxies in our sample fall in the range expected for AGN.
Therefore in the light of the facts that (i) the blue and red spiral galaxies with redder WISE colours ([3.4]-[4.6] and [4.6]-[12] mag), have overlapping infrared properties and, (ii) all spiral galaxies irrespective of their optical colours show no tendency to be hosting an AGN, neither dust nor AGN activity can fully explain the cause for the optical colours of the red spiral galaxies.
3.3 Environment of red spirals
In this paper we quantify the environment of galaxies by the nearest neighbour surface density parameter, . For a galaxy G, is defined as the projected density of galaxies within a circle centred at G having radius equal to the distance to the fifth nearest neighbour to G. We use the estimates from the EnvironmentMeasures DMU v05 (Brough et al., 2013). Brough et al. (2013) estimated using projected comoving distance to the fifth nearest neighbour within km s-1. The density-defining population is also required to have the absolute SDSS petrosian magnitudes less than the limiting magnitude of mag. Galaxies where the nearest survey edge is closer than the fifth nearest neighbour are flagged, and have only the upper limits assigned to them.
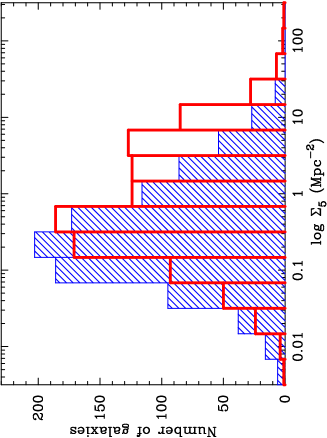
values were obtained for 1399/1463 (96%) blue and 1027/1034 (99%) red spiral galaxies, respectively and their distributions are shown in Fig. 5. As a comparison, only 5% of the blue spiral galaxies have Mpc-2 relative to 16% of the red spirals, clearly indicating that spirals found in high density environments are more likely to be red. We also confirm that the redshift distribution of the red and blue spiral galaxies are statistically similar, and hence do not effect the distribution of .
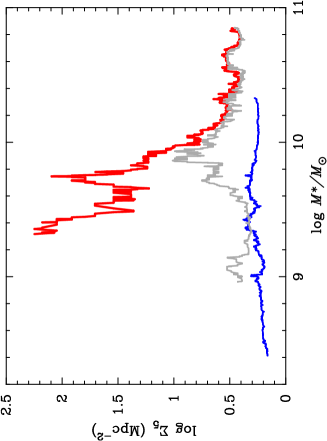
In Fig. 6 we show the median of log as a function of stellar mass in running bins for the two colour-selected populations of spiral galaxies. Despite the statistically distinct distributions of stellar mass for the red and blue spiral galaxies (see Fig. 7 and Table 2), it is evident that at fixed stellar mass, especially at log , the red spiral galaxies always reside in denser environments relative to their blue counterparts. It is also interesting to note that stellar mass of red spiral galaxies is anti-correlated with their environmental density, such that the more massive red spirals reside in lower density environments relative to their less massive counterparts. The blue spiral galaxies on the other hand are always found in low-density environments.
3.4 Physical properties of red and blue spiral galaxies
Physical properties like SFR, sSFR and of galaxies are known to correlate with their colour. In this section we explore these physical observables of red and blue spiral galaxies and test for their correlation with optical colour.
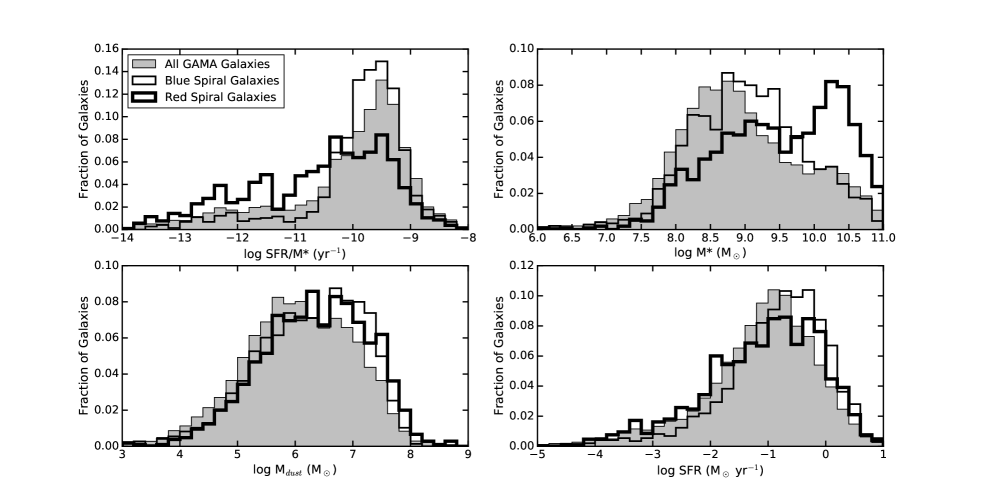
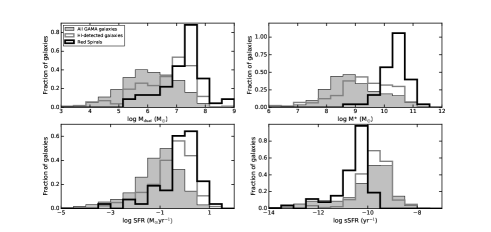
In Fig. 7 we show a comparison between various physical properties of the red and blue spiral galaxies, and Table 2 shows the KS statistical probability for the two distributions to be drawn from the same parent sample. The blue and red spirals have statistically significantly different , SFR and sSFR, viz. the red spirals are forming less stars and are more massive relative to their blue counterparts. These results are in agreement with the previously published literature based on morphologically-selected samples of spirals (e.g. Masters et al., 2010b).
Fig. 7 also shows that the distributions of dust mass among the red and blue spirals are similar. These observations can be explained using the SFR– relation from the literature. da Cunha et al. (2010) have quantified the SFR- relation for low redshift SDSS galaxies as . In a study of the - relation using a complimentary sample of galaxies also from the SDSS, Hjorth, Gall, & Michałowski (2014) discussed various probable causes of such an observation. Amongst others, Hjorth, Gall, & Michałowski (2014) proposed that in the initial stages of a starburst, SFR and dust mass increases together, giving rise to the SFR- correlation. Thereafter, if a galaxy is quenched through removal of cold gas and dust from the galaxy, both SFR and will decline together leading to a transition parallel to the SFR- relation. Therefore, it is plausible for a massive, red spiral galaxy to have the same amount of dust as a less evolved blue spiral galaxy. However, if the SFR in a galaxy declines, but dust is retained (e.g. Martig et al., 2009; Genzel et al., 2014), a galaxy will transit horizontally in the SFR- plane. On the other hand, mergers will cause a vertical upward transition, conceivably leading to a secondary burst of star formation (Hjorth, Gall, & Michałowski, 2014). Since many of our red spiral galaxies are massive (Fig. 7), and, at a given stellar mass redder compared to their blue counterparts, our data supports the former scenario. But we do not find disturbed morphology in a statistically significant fraction of red spiral galaxies to support the latter hypothesis.
| Distribution | KS statistical probability |
|---|---|
| SFR | 1.18 e-09 |
| sSFR | 1.96 e-64 |
| 1.10 e-35 | |
| 1.72 e-01 |
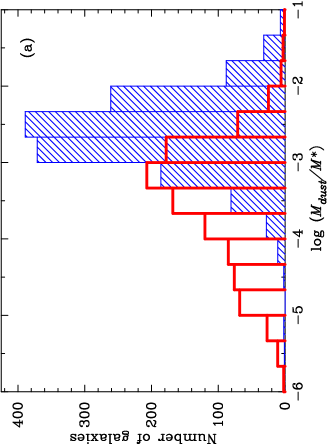
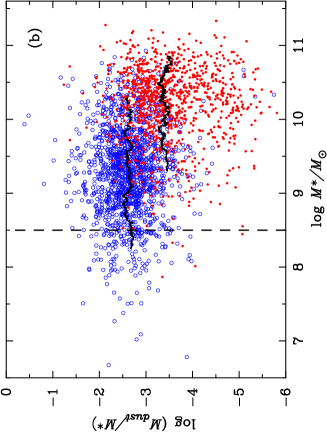
In Fig. 8 (a) we show the distribution of the dust-to-stellar mass (DTS) ratio for the red and blue spirals in our sample. The specific production of dust in the red spirals is notably lower than their blue counterparts as indicated by a shift in the mean of the DTS distribution. For different samples of spiral galaxies in literature, the DTS ratio is found to be anti-correlated with in different environments (Cortese et al., 2012a; Calura et al., 2017). This observation is considered as an indication of a scenario where the balance between dust production and destruction is dependent on the stellar mass of a galaxy. But as shown in Fig. 8 (b), we do not observe such a trend. On the contrary, we observe that within each colour-selected population of spiral galaxies, the DTS ratio remains constant with stellar mass of galaxies such that the median DTS ratio for the red spirals is lower by dex than their blue counterparts. This result is in broad agreement with the results of Rowlands et al. (2012), who found that the passive spiral galaxies detected in the Herschel-Astrophysical Terahertz Large Area Survey (H-ATLAS) data have lower DTS ratio, higher and older stellar population ages as compared to normal spiral galaxies.
4 Discussion
The aim of this paper is to examine red spiral galaxies found in the GAMA sample. We make use of several galaxy properties such as , SFR and dust mass to investigate the cause for the optical colours of red spiral galaxies. In the following we discuss the existing literature in the context of our findings, and list some of the major caveats in our analysis.
4.1 Star formation in red spiral galaxies
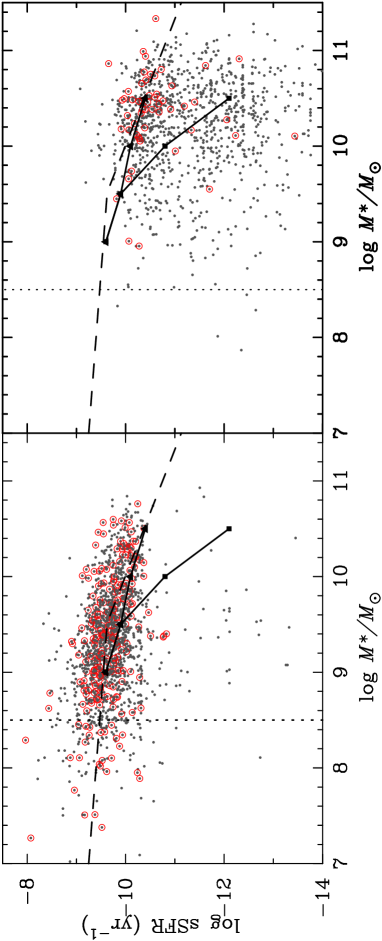
In the optical waveband, the sSFR- relation for a general population of galaxies shows a sharp decline, such that massive galaxies have lower sSFR (e.g. fig. 2 of Bauer et al., 2013). On similar footing, a sample selected from the submillimeter surveys shows that all galaxies lie on a single, curved sequence of galaxies without there being a need for a separate main galaxy sequence for star-forming galaxies (Eales et al., 2018a, b). In Fig. 9 we re-confirm this well established trend by showing the sSFR of blue and red spirals as a function of their . We also show the HI-detected222Only 11% of blue and 5% of red spiral galaxies are detected in HI by the ALFALFA survey. For further details see Appendix A. galaxies in both the colour-selected sub-samples. There are two subtle features in this figure. Firstly, the colour-selected samples of spirals are distributed very differently in the –sSFR plane. The blue galaxies span the entire range covered by this sample, and exhibit a linear anti-correlation with the sSFR. On the other hand, the red spiral galaxies are distributed randomly at the high mass end and almost always have sSFR yr-1, i.e. the sSFR of red spiral galaxies is typically below that of their blue counterparts, at a given .
The distribution for our blue spiral galaxies in the sSFR- plane agrees very well with the relation derived by Bauer et al. (2013) for star-forming (EW(H)Å and erg s-1 cm-2 Å-1) galaxies in their GAMA sample (), while the red spiral galaxies seem to follow the relation they derived for ‘all’ galaxies. Furthermore, Gavazzi et al. (2015) have compared the sSFR- relation for their sample of HI-detected local galaxies with the distributions derived by Bauer et al. (2013) and Huang et al. (2012), also shown in Fig. 9, and found them to agree well within uncertainties, just like the distributions shown here.
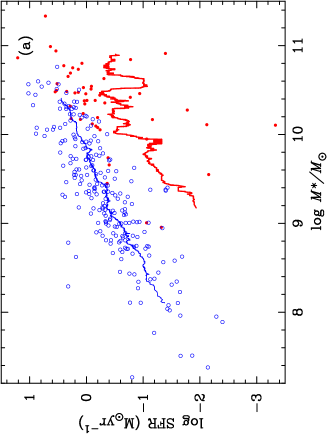
Even though only a small fraction of our spiral galaxies are detected in HI, it is insightful to explore the distribution of these galaxies in the SFR-plane, which is shown in Fig. 10. As observed by several other authors (Huang et al., 2012; Parkash et al., 2018; Zhou et al., 2018), we also find that the SFR is correlated with the stellar mass of galaxies, such that the SFR increases with increasing . The median SFR of the red spiral galaxies is lower by dex relative to their blue counterparts over almost two orders of magnitude in stellar mass. This result, together with Fig. 6 evidently shows the impact of mass quenching even among the massive gas-rich spiral galaxies. Fig. 10 also suggests that a significant fraction of the observed scatter in the star formation main sequence (Bauer et al., 2013; Grootes et al., 2013; Speagle, Steinhardt, Capak & Silverman, 2014; Parkash et al., 2018) may result from the treatment of passively-evolving or red disk galaxies in a sample. This observation supports the result of Parkash et al. (2018) who showed that the scatter in the -SFR relation is anti-correlated with the T-type of spiral galaxies in their HI-selected sample.
The results presented in this subsection, together with Fig. 6 suggest that the red spirals have gained their optical colour by losing their gas via some mechanism, which in turn lead to a reduction in the rate at which they were forming stars.
| GAMA ID | Right Ascension | Declination | Redshift | (g-r) | ALFALFA ID | |
|---|---|---|---|---|---|---|
| (J2000) | (J2000) | mag | () | |||
| 7623 | 178.509 | 0.785 | 0.053 | 0.445 | - | - |
| 7802 | 179.443 | 0.804 | 0.048 | 0.333 | - | - |
| 8217 | 181.052 | 0.803 | 0.012 | 0.396 | 223256 | 0.35E+09 |
| 8353 | 182.017 | 0.698 | 0.021 | 0.415 | 222071 | 0.19E+10 |
| 8706 | 183.689 | 0.744 | 0.022 | 0.582 | 7250 | 0.33E+10 |
| 9061 | 184.824 | 0.824 | 0.049 | 0.367 | - | - |
| 9064 | 184.817 | 0.648 | 0.023 | 0.535 | - | - |
| 9112 | 184.951 | 0.733 | 0.043 | 0.408 | - | - |
| 9115 | 184.965 | 0.810 | 0.035 | 0.480 | - | - |
| 9163 | 185.141 | 0.788 | 0.009 | 0.416 | 7396 | 0.11E+10 |
4.2 Red spirals in the literature
Passively-evolving spiral galaxies have traditionally been studied as a transitional galaxy population, particularly in dense environments (e.g. van den Bergh, 1976). But lately different selection criteria have resulted in mutually exclusive samples of optically-red spiral galaxies with distinguishable star formation properties. For instance, a morphologically-selected sample of disky red spiral galaxies in the optical waveband (Masters et al., 2010b), has almost no overlap with a sample of passive spiral galaxies selected in the band from the 2-micron all sky survey (2MASS) (Fraser-McKelvie et al., 2016, 2018). Due to the different sample selection criteria used by these authors, the sample of Masters et al. (2010b) includes dusty galaxies, but excludes the ones with high bulge-to-disk (BD) ratio, while Fraser et al.’s selection criteria based on WISE colours eliminated dusty galaxies from their sample, but the T-type selection criteria included spiral galaxies with high BD ratio.
It is therefore essential to understand that red disc galaxies are a collection of several individual populations which are a product of different formation mechanism(s) or effects. For instance, dust reddening is important for edge-on disc galaxies (Masters et al., 2010b), while low SFR will lead to red optical colours irrespective of orientation (e.g. Goto, et al., 2003; Mahajan & Raychaudhury, 2009). On the other hand, mass quenching becomes important for spiral galaxies with , and quenching due to environment will effect low mass spiral galaxies in dense environments (Fig. 6), especially if they are satellites of larger galaxies (Haines, et al., 2006). Hence, such differences in the selection criteria must be taken into account while making a comparison between different studies.
While in dense environments ‘dusty star-forming’ and ‘passively-evolving’ spiral galaxies appear to be the same phenomenon (Wolf et al., 2009), in a generic sample of galaxies the evolution is governed by the availability of gas reservoir to form stars. Using data from the SDSS and Galex, together with the morphological information from the Galaxy Zoo, Schawinski et al. (2014) suggested that passive spirals are a result of slow quenching of star formation (also see Cortese & Hughes, 2009; Wolf et al., 2009; Koyama et al., 2011; Haines et al., 2015). On the other hand, morphological transformation occurs when the star formation in a galaxy is truncated on a very short time-scale, perhaps as a result of a merger event. This is also in broad agreement with the results of Bremer et al. (2018) who studied the morphological transformation of the transitional green valley galaxies (; ) from the GAMA survey. Bremer et al. (2018) find that the transition time of galaxies through the green valley is Gyr, and is independent of environment. Their result is in agreement with the trend seen in Fig. 6, where the red spiral galaxies with log in the range in our sample do not show any significant change in the environmental density.
In their work exploring the colours and morphology of transitional galaxies, Bremer et al. (2018) also find that the green valley galaxies have significant bulge and disk components, but the transition from blue to red optical colour is driven by the colour change of the disk. Their results led these authors to suggest that star formation is quenched in the disk as the gas content is used up, or becomes less available in the period following growth of the bulge. Using data from the COSMOS survey, Bundy et al. (2010) also find that as much as 60% of galaxies moving to the red sequence undergo a passive-disk phase.
The BD ratio for a small sub-sample of our galaxies (5% red and 15% blue spiral galaxies) are available from the BDDecomp DMU (Robotham et al., 2017, 2018). Therefore, although we are unable to provide a complete analysis comparable to Bremer et al. (2018) for our sample, we do find indications suggesting that the BD ratio for the red spiral galaxies is statistically larger than their blue counterparts, with the median (standard deviation) BD ratio being 0.82 (5.05) for the red and 0.46 (8.13) for the blue spiral galaxies, respectively. But the existence of red spiral galaxies with small BD ratio in our colour-selected sample suggests that in agreement with the literature (Bundy et al., 2010), fading of the blue disk alone is insufficient at explaining the origin of passive disk galaxies.
In a recent work Evans, Parker, & Roberts (2018) studied a population of red star-forming galaxies (, ) in the local universe using the data from the SDSS (data release 7). In line with the literature (e.g. Mahajan & Raychaudhury, 2009), they found that of galaxies at all stellar masses are optically red, yet forming stars. Unlike the work presented here however, Evans, Parker, & Roberts (2018) find that the proportion of their ‘red misfit’ galaxies is independent of environment, where the latter is quantified by group-centric distance as well as the group halo mass. These authors, along with several others (Masters et al., 2010b; Salim, 2014; Gu et al., 2018) also find that emission-line ‘red disk’ galaxies are more likely to host an optically-identifiable AGN relative to their blue counterparts (but see, Fraser-McKelvie et al., 2016, for an alternate view). However, since we have only used WISE colours to identify AGN (Fig. 4) in this work, a direct comparison of our results with Evans, Parker, & Roberts (2018) is not feasible.
In a nutshell, although red disk galaxies comprise of different sub-populations, literature seems to indicate that at least in the nearby Universe () optically-red disk galaxies are more dusty, less star-forming and more massive than their blue counterparts. Most of the discrepancies among different papers seem to be a result of different selection criteria used to select the respective samples.
4.3 Causes of caveats in our analysis
-
•
Inclination of galaxies: In the analysis presented here we have included disk galaxies with a range of inclination (Fig. 3) because we believe this is essential for good statistics in a study like the one presented here.
-
•
Dust in spirals: While Masters et al. (2010b) excluded dusty galaxies in their analysis, other authors (e.g. Wolf et al., 2009; Koyama et al., 2011) have chosen differently. In this work we have included all spiral galaxies irrespective of their dust content, in order to avoid any biases in our sample. Fig. 4 and 8 validate our methodology of incorporating all galaxies irrespective of their dust content, because otherwise many of the differences observed in the dust properties of the colour-selected samples of spirals would not have been observed.
-
•
Poor resolution of optical images: The morphological classification used in this work comes from the GAMA DMU which employs the SDSS imaging data. It is therefore noteworthy that despite careful classification and multiple attempts it is likely that at least some spiral galaxies, especially the ones having low SFR may have been misclassified as an elliptical in the shallow seconds long exposure images (Bonne et al., 2015). We therefore suggest the reader to use the fractions and numbers quoted in this work cautiously.
-
•
Limited sensitivity of HI data: As discussed in Appendix A, since HI surveys are designed to detect galaxies rich in HI, they are unfair representatives of gas-poor galaxies. The correlation between atomic gas mass and stellar mass further implies that a high limiting will in turn reduce the effective sensitivity of the HI-detected sample relative to an optical selected one. The HI-analysis presented in this work is therefore only limited to massive, gas-rich spiral galaxies, which may not be a true representations of the entire population of spiral galaxies.
5 Summary
In this paper we examine various properties of morphologically-selected spiral galaxies to test for the origin of red colours of some of them. To accomplish this we used the optical data and its derivatives compiled for low-redshift () galaxies in the GAMA survey, and for a small sub-sample of those, HI data obtained from the ALFALFA survey. Specifically, we probed the viewing angle and physical properties: SFR, sSFR, and of the red and blue spiral galaxies. The main results of this work are:
-
•
The distribution of inclination angle of the red and blue spirals is different, yet do not correlate with optical colour or other physical properties suggesting that the red colours of spirals in our sample do not originate because of their viewing angle alone.
-
•
The WISE colours of all spiral galaxies in our sample comply with the range of colours expected for nearby star-forming galaxies, although optically blue spiral galaxies have redder WISE colours indicating high SFR. A small fraction of optically-red spiral galaxies also exhibit blue WISE colours suggesting that dust obscuration may have caused red colours in some of them.
-
•
The SFR, sSFR and distributions of red and blue spirals are statistically different, yet their distributions are similar.
-
•
Spiral galaxies in dense environments are more likely to be optically red. Furthermore, at fixed red spiral galaxies preferentially reside in high density environments relative to their blue counterparts.
-
•
The dust-to-stellar mass ratio for spiral galaxies is independent of within each colour-selected population. But the DTS ratio for the red spiral galaxies is lower by dex relative to their blue counterparts at all stellar masses.
To conclude, our results suggest that optical colour of red spiral galaxies are a resultant of several different effects and phenomenon. While the edge-on disc galaxies may appear red due to inclination effect, a small but appreciable fraction of spiral galaxies have acquired red colours due to dust. The remaining population of red spirals seems to be a product of environmental effects which lead to loss of gas and dust, and eventually low SFR. Observations supporting the impact of such environmental mechanisms on the transformation of galaxies in intermediate-density environments of galaxy groups (Rasmussen et al., 2012) and large-scale filaments (Mahajan, Raychaudhury, & Pimbblet, 2012; Mahajan et al., 2018) have been discussed in the literature. In particular, the results of Rasmussen et al. (2012) favour a quenching timescale of Gyr, which is in broad agreement with the suggested scenario for the creation of passively-evolving spirals by other studies (Wolf et al., 2009; Koyama et al., 2011; Schawinski et al., 2014), and the transition time of passive disc galaxies through the green valley (Cortese & Hughes, 2009; Bremer et al., 2018).
6 Acknowledgements
GAMA is a joint European-Australasian project based around a spectroscopic campaign using the Anglo-Australian Telescope. The GAMA input catalogue is based on data taken from the Sloan Digital Sky Survey and the UKIRT Infrared Deep Sky Survey. Complementary imaging of the GAMA regions is being obtained by a number of independent survey programmes including GALEX MIS, VST KiDS, VISTA VIKING, WISE, Herschel-ATLAS, GMRT and ASKAP providing UV to radio coverage. GAMA is funded by the STFC (UK), the ARC (Australia), the AAO, and the participating institutions. The GAMA website is http://www.gama-survey.org/ . This research made use of the “K-corrections calculator” service available at http://kcor.sai.msu.ru/ .
Mahajan is funded by the INSPIRE Faculty award (DST/INSPIRE/04/2015/002311), Department of Science and Technology (DST), Government of India. Gupta and Rana were supported by the INSPIRE scholarship for higher education for their BS-MS dual degree at IISER Mohali. Rana was also partially supported by the DST/INSPIRE/04/2015/002311 during the course of this project. The authors are grateful to the anonymous reviewer for their criticism which greatly improved the clarity of this manuscript.
References
- Baldry et al. (2010) Baldry I. K., et al., 2010, MNRAS, 404, 86
- Baldry et al. (2012) Baldry I. K., et al., 2012, MNRAS, 421, 621
- Bauer et al. (2013) Bauer A. E., et al., 2013, MNRAS, 434, 209
- Bonne et al. (2015) Bonne N. J., Brown M. J. I., Jones H., Pimbblet K. A., 2015, ApJ, 799, 160
- Bremer et al. (2018) Bremer M. N., et al., 2018, MNRAS, 476, 12
- Brough et al. (2013) Brough S., et al., 2013, MNRAS, 435, 2903
- Bundy et al. (2010) Bundy K., et al., 2010, ApJ, 719, 1969
- Calura et al. (2017) Calura F., et al., 2017, MNRAS, 465, 54
- Chilingarian & Zolotukhin (2012) Chilingarian I. V., Zolotukhin I. Y., 2012, MNRAS, 419, 1727
- Cluver et al. (2014) Cluver M. E., et al., 2014, ApJ, 782, 90
- Cortese & Hughes (2009) Cortese L., Hughes T. M., 2009, MNRAS, 400, 1225
- Cortese et al. (2012a) Cortese L., et al., 2012, A&A, 540, A52
- Cortese (2012b) Cortese L., 2012, A&A, 543, A132
- da Cunha, Charlot, & Elbaz (2008) da Cunha E., Charlot S., Elbaz D., 2008, MNRAS, 388, 1595
- da Cunha et al. (2010) da Cunha E., Eminian C., Charlot S., Blaizot J., 2010, MNRAS, 403, 1894
- Dressler (1980) Dressler A., 1980, ApJS, 42, 565
- Driver et al. (2007) Driver S. P., Popescu C. C., Tuffs R. J., Liske J., Graham A. W., Allen P. D., de Propris R., 2007, MNRAS, 379, 1022
- Driver et al. (2011) Driver S. P., et al., 2011, MNRAS, 413, 971
- Eales et al. (2018a) Eales S., et al., 2018a, MNRAS, 473, 3507
- Eales et al. (2018b) Eales S. A., et al., 2018b, MNRAS, 481, 1183
- Evans, Parker, & Roberts (2018) Evans F. A., Parker L. C., Roberts I. D., 2018, MNRAS, 476, 5284
- Fraser-McKelvie et al. (2016) Fraser-McKelvie A., Brown M. J. I., Pimbblet K. A., Dolley T., Crossett J. P., Bonne N. J., 2016, MNRAS, 462, L11
- Fraser-McKelvie et al. (2018) Fraser-McKelvie A., Brown M. J. I., Pimbblet K., Dolley T., Bonne N. J., 2018, MNRAS, 474, 1909
- Gavazzi et al. (2015) Gavazzi G., et al., 2015, A&A, 580, A116
- Genzel et al. (2014) Genzel R., et al., 2014, ApJ, 785, 75
- Giovanelli et al. (2005) Giovanelli R., et al., 2005, AJ, 130, 2598
- Goto, et al. (2003) Goto T., et al., 2003, PASJ, 55, 757
- Grootes et al. (2013) Grootes M. W., et al., 2013, ApJ, 766, 59
- Gu et al. (2018) Gu Y., Fang G., Yuan Q., Cai Z., Wang T., 2018, ApJ, 855, 10
- Haines, et al. (2006) Haines C. P., La Barbera F., Mercurio A., Merluzzi P., Busarello G., 2006, ApJL, 647, L21
- Haines et al. (2015) Haines C. P., et al., 2015, ApJ, 806, 101
- Haynes et al. (2011) Haynes M. P., et al., 2011, AJ, 142, 170
- Hjorth, Gall, & Michałowski (2014) Hjorth J., Gall C., Michałowski M. J., 2014, ApJ, 782, L23
- Holmberg (1958) Holmberg E., 1958, MeLuS, 136, 1
- Hopkins et al. (2013) Hopkins A. M., et al., 2013, MNRAS, 430, 2047
- Huang et al. (2012) Huang S., Haynes M. P., Giovanelli R., Brinchmann J., 2012, ApJ, 756, 113
- Jarrett et al. (2011) Jarrett T. H., et al., 2011, ApJ, 735, 112
- Kaviraj et al. (2015) Kaviraj S., Shabala S. S., Deller A. T., Middelberg E., 2015, MNRAS, 454, 1595
- Kelvin et al. (2014) Kelvin L. S., et al., 2014, MNRAS, 439, 1245
- Koyama et al. (2011) Koyama Y., Kodama T., Nakata F., Shimasaku K., Okamura S., 2011, ApJ, 734, 66
- Liske et al. (2015) Liske J., et al., 2015, MNRAS, 452, 2087
- Mahajan & Raychaudhury (2009) Mahajan S., Raychaudhury S., 2009, MNRAS, 400, 687
- Mahajan, Raychaudhury, & Pimbblet (2012) Mahajan S., Raychaudhury S., Pimbblet K. A., 2012, MNRAS, 427, 1252
- Mahajan (2013) Mahajan S., 2013, MNRAS, 431, L117
- Mahajan et al. (2018) Mahajan S., et al., 2018, MNRAS, 475, 788
- Martig et al. (2009) Martig M., Bournaud F., Teyssier R., Dekel A., 2009, ApJ, 707, 250
- Masters et al. (2010a) Masters K. L., et al., 2010a, MNRAS, 404, 792
- Masters et al. (2010b) Masters K. L., et al., 2010b, MNRAS, 405, 783
- Moran et al. (2006) Moran S. M., Ellis R. S., Treu T., Salim S., Rich R. M., Smith G. P., Kneib J.-P., 2006, ApJ, 641, L97
- Oemler et al. (2017) Oemler A., Jr., Abramson L. E., Gladders M. D., Dressler A., Poggianti B. M., Vulcani B., 2017, ApJ, 844, 45
- Parkash et al. (2018) Parkash V., Brown M. J. I., Jarrett T. H., Bonne N. J., 2018, ApJ, 864, 40
- Parkash et al. (2019) Parkash V., Brown M. J. I., Jarrett T. H., Fraser-McKelvie A., Cluver M. E., 2019, MNRAS, 485, 3169
- Rasmussen et al. (2012) Rasmussen J., Mulchaey J. S., Bai L., Ponman T. J., Raychaudhury S., Dariush A., 2012, ApJ, 757, 122
- Robotham et al. (2017) Robotham A. S. G., Taranu D. S., Tobar R., Moffett A., Driver S. P., 2017, MNRAS, 466, 1513
- Robotham et al. (2018) Robotham A. S. G., Davies L. J. M., Driver S. P., Koushan S., Taranu D. S., Casura S., Liske J., 2018, MNRAS, 476, 3137
- Rowlands et al. (2012) Rowlands K., et al., 2012, MNRAS, 419, 2545
- Salim (2014) Salim S., 2014, SerAJ, 189, 1
- Santos et al. (2013) Santos J. S., et al., 2013, MNRAS, 433, 1287
- Schawinski et al. (2014) Schawinski K., et al., 2014, MNRAS, 440, 889
- Speagle, Steinhardt, Capak & Silverman (2014) Speagle J. S., Steinhardt C. L., Capak P. L., Silverman J. D., 2014, ApJS, 214, 15
- Tojeiro et al. (2013) Tojeiro R., et al., 2013, MNRAS, 432, 359
- Valentijn (1990) Valentijn E. A., 1990, Natur, 346, 153
- van den Bergh (1976) van den Bergh S., 1976, ApJ, 206, 883
- Wolf et al. (2009) Wolf C., et al., 2009, MNRAS, 393, 1302
- Wright et al. (2010) Wright E. L., et al., 2010, AJ, 140, 1868
- Wright et al. (2016) Wright A. H., et al., 2016, MNRAS, 460, 765
- Zhou et al. (2018) Zhou Z., Wu H., Zhou X., Ma J., 2018, arXiv, arXiv:1807.09955
Appendix A Atomic gas mass in spirals
Star-forming galaxies may turn red in the absence of fuel for star formation. In order to test what fraction of spirals in our sample have reddened by exhausting their hydrogen gas content, we utilised the 21-cm continuum data from the Arecibo Legacy Fast Arecibo L-band Feed Array survey (ALFALFA; Giovanelli et al., 2005). ALFALFA is a blind extragalactic HI survey done using the Arecibo telescope to conduct a census of HI in the local universe. Specifically, in this work we have used the catalogue (Haynes et al., 2011), which includes 70 per cent of the ALFALFA data333http://egg.astro.cornell.edu/alfalfa/index.php. We matched our GAMA source list against the list of most probable optical counterparts chosen from the SDSS database to check which galaxies are detected in HI. This exercise resulted in 361 sources matched within , of which 238 (66%) are matched within . Of the 361 matched galaxies, 287 (80%) are spirals of which 53 (15%) are red, which amounts to around 11% of blue and only 5% of red spiral galaxies in our sample. The ALFALFA ID and HI mass of all galaxies in our sample, along with the relevant information from the GAMA survey data are presented in Table 3.
To get further insight into the properties of the HI-detected spirals in Fig. 11 we compare some physical properties of all GAMA galaxies with the HI-detected galaxies and the red spirals among them. Table 4 shows the KS test statistical probability in favour of the hypothesis. Statistically, none but the SFR distributions for the blue and red HI-detected spirals are likely to have been drawn from the same parent sample. The stellar mass distribution of the HI-detected galaxies shows the impact of the lower effective sensitivity of the HI survey relative to the effective sensitivity of the optical data. As a result of this selection-bias in the HI survey, the HI-detected galaxies are mostly limited to massive, gas-rich systems, and not a fair representation of the gas-poor galaxies. We find that the HI-detected red spirals are on average more massive, have higher dust mass and lower star formation activity relative to their blue counterparts. However, due to the inherent biases discussed above, the authenticity of these trends remains to be tested.
| Samples | Physical property | KS statistical |
| probability | ||
| All GAMA , Red spirals | SFR | 3.66e-14 |
| HI-detected spirals, Red spirals | 0.42 | |
| All GAMA , Red spirals | sSFR | 1.88e-13 |
| HI-detected spirals, Red spirals | 1.25e-15 | |
| All GAMA , Red spirals | 1.01e-24 | |
| HI-detected spirals, Red spirals | 2.00e-13 | |
| All GAMA , Redspirals | 5.65e-19 | |
| HI-detected spirals, Red spirals | 9.94e-5 |