Reinterpreting the results of the LHC with MadAnalysis 5: uncertainties and higher-luminosity estimates
Abstract
The MadAnalysis 5 framework can be used to assess the potential of various LHC analyses for unraveling any specific new physics signal. We present an extension of the LHC reinterpretation capabilities of the programme allowing for the inclusion of theoretical and systematical uncertainties on the signal in the reinterpretation procedure. We have implemented extra methods dedicated to the extrapolation of the impact of a given analysis to higher luminosities, including various options for the treatment of the errors. As an application, we study three classes of new physics models. We first focus on a simplified model in which the Standard Model is supplemented by a gluino and a neutralino. We show that uncertainties could in particular degrade the bounds by several hundreds of GeV when considering 3000 fb-1 of future LHC data. We next investigate another supersymmetry-inspired simplified model, in which the Standard Model is extended by a first generation squark species and a neutralino. We reach similar conclusions. Finally, we study a class of -channel dark matter setups and compare the expectation for two types of scenarios differing in the details of the implementation of the mediation between the dark and Standard Model sectors.
1 Introduction
The discovery of the Higgs boson has accomplished one of the long awaited objectives of the LHC physics programme and confirmed our understanding of the fundamental laws of nature. However, the concrete realisation of the electroweak symmetry breaking mechanism remains unexplained and no evidence for physics beyond the Standard Model (SM), whose existence is motivated by the SM theoretical inconsistencies and limitations, has emerged from data. There are two classes of possible explanations as to why the associated new particles and/or interactions have escaped detection so far. The first one is that the new states are too heavy and/or the new interactions too feeble to be observed with present collider reaches. Alternatively, new particles may be hiding just around the corner, but lie in a specific configuration (like being organised in a compressed spectrum) that renders their discovery challenging. The possible observation of any new phenomena therefore is the foremost goal of the future LHC runs, including in particular the LHC Run 3, to be started in two years, and the high-luminosity operations planned to begin in half a decade.
In order to investigate whether new physics could be present in existing data, several groups have developed and maintained public software dedicated to the reinterpretation of the results at the LHC Kraml:2013mwa ; Drees:2013wra ; Dumont:2014tja ; Buckley:2010ar ; Balazs:2017moi . In practice, these tools rely on predictions detailing how the different signal regions of given LHC analyses are populated to derive the potential of these searches for its observation. However, signal uncertainties are in general ignored by users in this procedure, although they could sometimes lead to incorrect interpretations Arina:2016cqj . With the limits on the masses of any hypothetical particle being pushed to higher and higher scales, the theoretical uncertainties related with the new physics signals can moreover sometimes be quite severe, in particular if the associated scale and Bjorken- value lead to probing the parton densities in a regime in which they are poorly constrained Frixione:2019fxg .
On the other hand, it would be valuable to get estimates of the capabilities of the future runs of the LHC with respect to a given signal, possibly on the basis of the interpretation of the results of existing analyses of current data. Predictions in which the signal and the background are naively scaled up could hence be useful to obtain an initial guidance on the reach of future collider setups within new physics parameter spaces.
In this paper, we address the above mentioned issues by presenting an extension of the recasting capabilities of the MadAnalysis 5 platform Dumont:2014tja ; Conte:2018vmg so that signal theoretical and systematics uncertainties could be included in the recasting procedure. Moreover, we show how the reinterpretation results, with uncertainties included, could be correctly extrapolated to different luminosities to get insight on the sensitivity of the future LHC data on given signals.
As an illustration of these new features within concrete cases, we consider several classes of widely used simplified models. We first extract bounds on various model parameters from recent LHC results. Next, we study how those constraints are expected to evolve with the upcoming high-luminosity run of the LHC through a naive rescaling of the signal and background predictions. In practice, we make use of the recasting capabilities of MadAnalysis 5 and pay a special attention to the theoretical uncertainties.
We begin with a simplified model inspired by the Minimal Supersymmetric Standard Model (MSSM) in which the SM is complemented by a gluino and a neutralino, all other superpartners being assumed heavy and decoupled Alwall:2008ag ; Alves:2011wf . Such a particle spectrum leads to a signature comprised of jets and missing transverse energy originating from the gluino decays into an invisible neutralino and quarks. We reinterpret the results of corresponding ATLAS searches for the signal in 36 fb-1 Aaboud:2017vwy and 139 fb-1 ATLAS:2019vcq of LHC data. We investigate the impact of the theory errors on the derived bounds at the nominal luminosity of the search, and extrapolate the findings to estimate the outcome of similar searches analysing 300 and 3000 fb-1 of LHC data. Secondly, we make use of these recent LHC searches to perform an equivalent exercise in the context of a simplified model in which the SM is extended by a single species of first generation squarks and a neutralino Alwall:2008ag ; Alves:2011wf . Such a spectrum also leads to a new physics signature made of jets and missing transverse energy, although the squark colour triplet nature yields a signal featuring a smaller jet multiplicity. As the considered ATLAS study includes a large set of signal regions each dedicated to a different jet multiplicity, it is sensitive to this simplified model that has moreover not been covered the result interpretations performed in the experimental publication.
As a last example, we study the phenomenology of a simplified dark matter model in which a Dirac fermion dark matter candidate couples to the SM via interactions with an -channel spin-1 mediator Backovic:2015soa ; Abercrombie:2015wmb . This model is known to be reachable via standard LHC monojet and multijet plus missing transverse energy searches for dark matter. We extract up-to-date bounds on the model by reinterpreting the results of the ATLAS search of ref. ATLAS:2019vcq that analyses the full Run 2 ATLAS dataset. This search includes signal regions dedicated to both the monojet and the multijet plus missing energy signatures, so that it consists in an excellent probe for dark matter models. We focus on two specific configurations of our generic simplified models in which the mediator couples with the same strength to the dark and SM sectors. In the first case, we consider mediator couplings of a vector nature, whilst in the second case, we focus on axial-vector mediator couplings. We investigate how the bounds evolve with the luminosity for various dark matter and mediator masses and the nature of the new physics couplings.
The rest of this paper is organised as follows. We discuss the details of the recasting capabilities of MadAnalysis 5 in section 2, focusing not only on the new features that have been implemented in the context of this work, but also on how the code should be used for LHC recasting. We then apply it to extracting gluino and neutralino mass limits in section 3 for various luminosities of LHC data. We analyse the squark/neutralino simplified model in section 4 and perform our dark matter analysis in section 5. We summarise our work and conclude in section 6.
2 LHC recasting with MadAnalysis 5
The MadAnalysis 5 package Conte:2012fm ; Conte:2014zja is a framework dedicated to new physics phenomenology. Whilst the first aim of the programme was to facilitate the design and the implementation of analyses targeting a given collider signal of physics beyond the Standard Model, and how to unravel it from the background, more recently it has been extended by LHC reinterpretation capabilities Dumont:2014tja ; Conte:2018vmg . This feature allows the user to derive the sensitivity of the LHC to any collider signal obtained by matching hard-scattering matrix elements with parton showers, based on the ensemble of analyses that have implemented in the MadAnalysis 5 public analysis database (PAD) Dumont:2014tja 111See the webpage https://madanalysis.irmp.ucl.ac.be/wiki/PublicAnalysisDatabase.. For each of these analyses, the code simulates the experimental strategies (which includes both the simulation of the detector response and the selection) to predict the number of signal events that should populate the analysis signal regions. It then compares the results with both data and the SM expectation, so that conclusive statements could be drawn. As in all recasting codes relying on the same method Drees:2013wra ; Buckley:2010ar ; Balazs:2017moi , the uncertainty on the signal is ignored although it could be relevant Frixione:2019fxg .
With the release of MadAnalysis 5 version v1.8, the user has now the possibility to deal with various classes of signal uncertainties and to extrapolate any reinterpretation result to higher luminosities. This section documents all these new functionalities. Section 2.1 briefly summarises how to install MadAnalysis 5, get the code running and download a local copy of its public analysis database. Section 2.2 details how the code can be used to reinterpret the results of a specific LHC analysis. A more extensive and longer version of this information on MadAnalysis 5 installation and running procedures can be found in ref. Conte:2018vmg . Section 2.3 is dedicated to the new methods that have been developed in the context of this work, and which are available from MadAnalysis 5 version v1.8 onwards. We also introduce in this section several new optional features that can be used for the design of the analysis .info files. One such file accompanies each analysis of the database and contains information on the observation and the SM expectation of the different analysis signal regions. In section 2.4, we describe the corresponding modifications of the output format relevant for a recasting run of MadAnalysis 5.
2.1 Prerequisites and installation
MadAnalysis 5 is compatible with most recent Unix-based operating systems, and requires the GNU G++ or CLang compiler, a Python 2.7 installation (or more recent, but not a Python 3 one) and GMake. In order for the recasting functionalities to be enabled, the user must ensure that the SciPy library is present, as it allows for limit computations, and that the Delphes 3 package deFavereau:2013fsa is locally available within the MadAnalysis 5 installation. The latter, which requires the Root framework Brun:1997pa and the FastJet programme Cacciari:2011ma , is internally called by MadAnalysis 5 to deal with the simulation of the response of the LHC detectors and to reconstruct the events. Moreover, reading compressed event files can only be performed if the Zlib library is available.
The latest version of MadAnalysis 5 can be downloaded from LaunchPad222See the webpage https://launchpad.net/madanalysis5., where it is provided as a tarball named ma5_v<xxx>.tgz, that contains all MadAnalysis 5 source files (<xxx> standing for the version number). After unpacking the tarball, the code can be started by issuing in a shell
./bin/ma5 -R
where the -R options enforces the reco mode of MadAnalysis 5, that is relevant for LHC recasting. The programme begins with checking the presence of all mandatory packages and determining which of the optional packages are available. The MadAnalysis 5 command-line interface is then initialised and the user is prompted to type in commands.
In the case where any of the Zlib or Delphes 3 package would not be found by MadAnalysis 5, they can be installed locally by typing, directly in the MadAnalysis 5 interpreter,
  install zlib
  install delphes
Whilst Root can in principle be installed similarly, we recommend the user to handle this manually, following the instructions available on the Root website333See the webpage https://root.cern.ch. Furthermore, all existing and validated recast LHC analyses in the MadAnalysis 5 framework can be locally downloaded by typing in,
  install PAD
  install PADForMA5tune
The second command triggers the installation of older implemented analyses, that requires a (now disfavoured) MA5tune version of Delphes 3. The latter can be installed by typing, in the MadAnalysis 5 shell,
install delphesForMA5tune
2.2 Recasting LHC analyses with MadAnalysis 5
In this section, we rely on a generic example in which a user aims to estimate
the sensitivity of a specific LHC analysis to a given signal with MadAnalysis 5.
The analysis consists of one of the analyses available from the PAD and the
signal is described by simulated events collected into a file that we call
events.hepmc.gz. Such an event file includes the simulation of the
considered hard-scattering process matched with parton showers, as well as the
hadronisation of the final-state partons present in each of the showered events.
As mentioned above, MadAnalysis 5 has to be started in the reco mode,
./bin/ma5 -R
In a first step, the recasting mode of the programme has to be enabled and the
event file, physically located at <path-to-events.hepmc.gz> on the user
system, has to be imported. This is achieved by issuing the commands
  set main.recast = on
  import <path-to-events.hepmc.gz> as <label>
The second command defines a dataset identified by the label
<label> that here solely includes the imported sample. Several event
files can be imported and collected either under a unique dataset (by using the
same <label> for each call to the import command) or split into
different datasets (by employing different labels). When studying the signal
under consideration, MadAnalysis 5 will run over all defined datasets and
imported event files.
In addition, the user can activate the storage of the Root file(s) generated by Delphes 3 by issuing the command,
set main.recast.store_root = <status>
where <status> can take the True or False value, and
directly provide a predefined recasting card (available on the system at <path-to-a-card>), through
set main.recast.card_path = <path-to-a-card>
In the case where no card is provided, MadAnalysis 5 creates a consistent new card with one entry for each of the available analyses. Such an entry is of the form
<tag> <type> <switch> <detector> # <comment>
The <tag> label corresponds to the filename of the C++ code associated
with the considered analysis (located in the
Build/SampleAnalyzer/User/Analyzer subdirectory of the PAD installation
in tools/PAD), the <type> label indicates whether the
PADForMA5tune (v1.1) or PAD (v1.2) recasting infrastructure should
be used and the <switch> tag (to be set to on or off)
drives whether the analysis has to be recast. The name of the Delphes 3 card to use (see the Input/Cards subdirectory of the PAD installation)
is passed as <detector>, and <comment> consists of an optional
comment (usually briefly describing the analysis).
The run is finally started by typing in the interpreter,
submit
Firstly, MadAnalysis 5 simulates the detector impact on the input events,
for each of the necessary Delphes 3 cards according to the analyses that have
been switched on in the recasting card. Next, the code derives how the different
signal regions are populated by the signal events and finally computes, by means
of the CLs prescriptionRead:2002hq , the corresponding exclusion
limits, signal region by signal region. This is achieved by a comparison of the
results with the information on the SM background and data available from
the different info files shipped with the PAD.
The output information is collected into a folder named ANALYSIS_X, where
X stands for the next available positive integer (in terms of
non-existing directories). On top of basic details about the run itself, this
folder contains the recasting results that are located in the
ANALYSIS_X/Output
folder. The latter includes the CLs_output_summary.dat file that
concisely summarises all the results of the run. A more extensive version of
these results can be found in the set of subfolders named after the labels of
the imported datasets. The CLs_output_summary.dat file contains one line
for each signal region of each reinterpreted analysis, and this for each of the
datasets under consideration. Each of these lines follows the format
<set> <tag> <SR> <exp> <obs> || <eff> <stat>
where the <set> and <tag> elements respectively consist in the
names of the dataset and analysis relevant for the considered line of the output
file. The <SR> entry relates to one of the analysis signal regions, the
exact name being the one defined in the analysis C++ source code. The
<exp> and <obs> quantities are the expected and observed
cross-section values for which the signal modelled by the events stored within
the dataset <set> is excluded by the signal region <SR> of the
analysis <tag> at the 95% confidence level. In the former case, the code
makes use of the SM expectation to predict the number of events populating the
signal region <SR>, whilst in the latter case, data is used. Finally, the
<eff> and <stat> entries respectively refer to the corresponding
selection efficiency and the associated statistical error.
The user has the option to specify the cross section corresponding to the investigated signal by issuing, in the MadAnalysis 5 interpreter,
set <label>.xsection = <value>
prior to the call to the submit command.
Following this syntax, <label> stands for one of the labels of the
considered datasets and <value> for the associated cross-section value,
in pb. In this case, the confidence level at which the analysed signal is
excluded is included in the output summary file (before the double vertical
line).
The Output folder additionally contains a specific subfolder for each of
the defined datasets. Such a directory contains a file named
CLs_output.dat that includes the same information as in the
CLs_output_summary.dat file, following the same syntax, but restricted to
a specific dataset. A second file encoded into the SAF
format Conte:2012fm and named <label>.saf (<label>
being the dataset name) contains general information on the dataset organised
according to an XML-like structure. The latter relies on three classes of
elements, namely
<SampleGlobalInfo>, <FileInfo> and <SampleDetailedInfo>.
The first of these contains global information on the dataset, such as its
cross section (xsec), the associated error (xsec_err), the number
of events (nev) or the sum of the positive and negative event weights
(sum_w+ and sum_w-). The corresponding entry in the output file
would read
 <SampleGlobalInfo>
    # xsec  xsec_error  nev    sum_w+  sum_w-
      ...      ...      ...    ...     ...
 </SampleGlobalInfo>
where the numerical values have been omitted for clarity. The <FileInfo>
element sequentially provides the paths to the different event files included in
the dataset, while detailed information on each file is provided within the
<SampleDetailedInfo> XML root element, in a similar manner as for the
sample global information (with one line for each file).
Furthermore, the dataset output directory includes a RecoEvents
folder dedicated to the storage of Delphes 3 output files (one file for each
considered detector parameterisation), provided that the corresponding option
has been turned on (see above), as well as one folder for each of the recast
analyses. Each of these folders contains one SAF file listing all signal regions
implemented in the associated analysis, as well as two subfolders
Cutflows and Histograms. The former includes one SAF file for each
signal region, and the latter a single file named
histos.saf.
A cutflow is organised through XML-like elements, <InitialCounter> and
<Counter> being used for the initial number of events and the results of
each selection cut respectively. As depicted by the example below, in which all
numbers have been omitted for clarity,
  <Counter>
  "my_cut_name"   # 1st cut
  ....    ....    # nentries
  ....    ....    # sum of weights
  ....    ....    # sum of weights^2
  </Counter>
any of such elements includes a cut name as defined in the analysis C++ file (first line), the number of events passing the cut (second line), the weighted number of events passing the cut (third line) and the sum of the squared weights of all events passing the cut (last line). Moreover, the first (second) column refers to the positively-weighted (negatively-weighted) events only.
Histograms are all collected into the file histos.saf, that is also
organised according to an XML-like structure relying on several <Histo>
elements. Each of these corresponds to one of the histograms implemented in the
analysis. A <Histo> element includes the definition of the histogram
(provided within the <Description> element), general statistics (as part
of the <Statistics> element) and the histogram data itself (within the
<Data> element). The description of a histogram schematically reads
  <Description>
    "name"
    # nbins   xmin           xmax
      ..      ...            ...
    # Defined regions
      ...   # Region nr. 1
      ...   # Region nr. 2
  </Description>
and is self-explanatory, all numbers having been replaced by dots. This moreover shows that a given histogram can be associated with several signal regions, provided they are indistinguishable at the moment the histogram is filled. Statistics are typically given as
 <Statistics>
  ...  ...  # nevents
  ...  ...  # sum of event-weights over events
  ...  ...  # nentries
  ...  ...  # sum of event-weights over entries
  ...  ...  # sum weights^2
  ...  ...  # sum value*weight
  ...  ...  # sum value^2*weight
 </Statistics>
which include information about the number of entries, the weighted number of
entries, the variance, etc. Moreover, the contributions of the
positively-weighted and negatively-weighted events are again split and
provided within the first and second column respectively. The values of each
bin are finally available from the <Data> element,
  <Data>
    ...  ...    # underflow
    ...  ...    # bin 1 / 15
       .
       .
       .
    ...  ...    # bin 15 / 15
    ...  ...    # overflow
  </Data>
where all bin values are omitted and the two columns respectively refer to events with positive (first column) and negative (second column) weights. The underflow and overflow bins are also included.
To close this section, we detail below how limits on a given signal are derived
by MadAnalysis 5, using the CLs prescription. The output file generated by the
code contains three numbers associated with those limits, the expected and
observed cross sections excluded at the 95% confidence level,
and , as well as the confidence
level at which the input signal is excluded. Those numbers are extracted on the
basis of the information available from the .info file, shipped with each
recast analysis and that contains, for each signal region, the number of
expected SM events , the associated error and the observed
number of events populating the signal region . As said above,
starting from the input event file, MadAnalysis 5 simulates the response of the
LHC detector, applies the analysis selection, and estimates how the different
signal regions are populated. In this way, for each signal region, the number of
signal events is known.
This enables the computation of the background-only and signal-plus-background
probabilities and and to further derive the
related CLs exclusion. In practice, the code considers a number of toy
experiments (the default being 100000 that can be changed by issuing, in the
MadAnalysis 5 interpreter and before the call to the submit method,
set main.recast.CLs_numofexps = <value>
where <value> stands for the desired number of toy experiments. For each
toy experiment, the expected number of background events is randomly
chosen assuming that its distribution is Gaussian, with a mean and a
width . The corresponding probability density thus reads
| (1) |
Imposing , the actual number of background events is randomly generated from the Poisson distribution
| (2) |
Accounting for the observation of events, is defined as the percentile of score associated with , which consists in the probability for the background to fluctuate as low as .
The signal-plus-background probability is computed similarly, assuming that the actual number of signal-plus-background events follows a Poisson distribution of parameter (after imposing this time that ). The resulting CLs exclusion is then derived as
| (3) |
and is calculated as above in a case where the number of signal events is kept free. From the (derived) knowledge of the analysis selection efficiencies, MadAnalysis 5 can extract the upper allowed cross section value for which the signal is not excluded, i.e. . The expected cross section excluded at the 95% confidence level, , is obtained by replacing by in the above calculations.
2.3 Including signal uncertainties and extrapolation to higher luminosities
In the procedure described in the previous section, any error on the signal is ignored, both concerning the usual theory uncertainties (scale variations, parton densities) and the systematics, mostly stemming from more experimental aspects. In particular, with the constantly growing mass bounds on hypothetical new particles, the scale entering the relevant hard-scattering processes is larger and larger, so that theoretical errors could start to impact the derived limits in an important and non-negligible manner.
Starting from version v1.8 onwards, MadAnalysis 5 offers the user a way to account for both the theoretical and systematical errors on the signal when a limit calculation is performed. The scale and parton density (PDF) uncertainties can be entered, within the MadAnalysis 5 interpreter, similarly to the cross section associated with a given dataset (see section 2.2),
  set <label>.xsection        = <xsec_val>
  set <label>.scale_variation = <scale>
  set <label>.pdf_variation   = <pdf>
where <label> stands for the label defining the signal dataset. In this
case, the signal cross section is provided through the
xsection attribute of the dataset, as described in the previous section,
while the scale and parton density uncertainties and
are given through the scale_variation and
pdf_variation attributes. The errors are symmetric with respect to the
central value , and their value (given by <scale> and
<pdf> in the above example) must be inputted as the absolute values of
the relative errors on the cross section (i.e. as positive floating-point
numbers). Asymmetric errors can also be provided, the upper and lower
uncertainties being independently fixed by issuing, in the MadAnalysis 5 interpreter,
  set <label>.scale_up_variation   = <scale_up>
  set <label>.scale_down_variation = <scale_dn>
  set <label>.pdf_up_variation     = <pdf_up>
  set <label>.pdf_down_variation   = <pdf_dn>
Each error is again provided as a positive floating-point number and refers to the relative error on the cross section, in absolute value. On top of the computation of the confidence level at which the signal is excluded, MadAnalysis 5 additionally calculates the CLs variation band associated with the scale uncertainties, as well as with the total theory uncertainties where both the scale and PDF contributions to the total error are added linearly. Such a behaviour can however be modified by issuing, in the interpreter
set main.recast.THerror_combination = <value>
where <value> can be set either to quadratic (the theory errors
are added quadratically) or linear (default, the theory errors are added
linearly). The CLs band is then derived by allowing the signal cross section
to vary within its error band, deriving the associated spread on
.
The user can also specify one or more values for the level of systematics on the signal. This is achieved by issuing, in the command line interface,
set main.recast.add.systematics = <syst>
This command can be reissued as many times as needed, MadAnalysis 5 taking care
of the limit calculation for each entered value independently. The level of
systematics (<syst>) has to be given either as a floating-point number
lying in the range, or as a pair of floating-point numbers lying in the
same interval. In the former case, the error is symmetric with respect to the
central value , whilst in the latter case, it is asymmetric with the
first value being associated with the upper error and the second one with the
lower error.
In addition, we have also extended the code so that naive extrapolations for a different luminosity could be performed. This is achieved by typing, in the interpreter,
  set main.recast.add.extrapolated_luminosity \
    = <lumi>
Once again, the user has the possibility to reissue the command several times,
so that the extrapolation will be performed for each luminosity <lumi>
independently (where the value has to be provided in fb-1). Those
extrapolations assume that the signal and background selection efficiencies of a
given region in a specific analysis are identical to those corresponding to the
reference luminosity initially considered. In this framework, the
extrapolated number of background events is related to (the
number of background events expected for the reference luminosity ) as
| (4) |
that we assume equal to the extrapolated number of observed events,
| (5) |
On the other hand, the associated uncertainties, , are derived from the relation
| (6) |
where the statistics and systematics components are added in quadrature. The
systematics are extrapolated linearly, whilst the statistical uncertainties
assume that the event counts follow a Poisson distribution. Such an
extrapolation of the background error requires an access to the details of the
background uncertainties. This is however not achievable within the XML
info file format dedicated to the transfer of the background and data
information to MadAnalysis 5 Dumont:2014tja . We therefore introduce two
new XML elements to this format, namely deltanb_stat and
deltanb_syst. These offer the user the option to implement his/her
info file by either providing a unique combined value for the
uncertainties (via the standard deltanb XML element) or by splitting them
into their statistical and systematical components (via a joint use of the new
deltanb_stat and deltanb_syst XML elements). In this way, a region
element could be either implemented according to the old syntax, as in the
schematic example below (with all numbers omitted),
  <region type="signal" id="Region name">
    <nobs>    ... </nobs>
    <nb>      ... </nb>
    <deltanb> ... </deltanb>
  </region>
or following the new syntax, which would then read
  <region type="signal" id="Region name">
    <nobs>         ... </nobs>
    <nb>           ... </nb>
    <deltanb_stat> ... </deltanb_stat>
    <deltanb_syst> ... </deltanb_syst>
  </region>
Whilst the usage of the new syntax is encouraged, this new possibility for embedding the error information strongly depends on how the background uncertainties are provided in the experimental analysis notes. For this reason, as well as for backward-compatibility, MadAnalysis 5 supports both choices. If only a global error is provided, the user can freely choose how to scale the error (linearly or in a Poisson way), by typing in the interpreter,
set main.recast.error_extrapolation = <value>
where <value> has to be set either to linear or to sqrt.
The user has also the choice to use a single floating-point number
for the <value> parameter. In this case, the relative
error on the number of background events at the new luminosity,
, is taken equal to this number. Finally, the
user can provide a comma-separated pair of floating-point numbers and
, as in
set main.recast.error_extrapolation = <k1>,<k2>
The background error is here defined by
| (7) |
where the two values provided by the user respectively control the systematical
component of the uncertainties (<k1>, ) and the statistical one
(<k2>, ).
Finally, all extrapolations are based on expectations and not on observations,
so that will be effectively replaced by the corresponding SM
expectation .
2.4 Output format
MadAnalysis 5 propagates the information on the impact of the uncertainties all
through the output file, which is then written in a format slightly extending
the one presented in section 2.2. Starting with the summary file
CLs_output_summary.dat, each line (corresponding to a given signal region
of a given analysis) is now followed by information schematically written as
  Scale var. band                [..., ...]
  TH   error band                [..., ...]
  +<lvl_up>%, -<lvl_dn>% syst    [..., ...]
The uncertainties on the
exclusion stemming from scale variations are given in the first line, which is
trivially omitted if the corresponding information on the signal cross section
is not provided by the user. In the second line, MadAnalysis 5 adds either
quadratically or linearly (according to the choice of the user) all theory
errors, such a line being written only if at least one source of theory
uncertainties is provided by the user. Finally, if the user inputted one or more
options for the level of systematics, MadAnalysis 5 computes the band resulting
from the combination of all errors and writes it into the output file (one line
for each choice of level of systematics). In the above snippet, the user fixed
an asymmetric level of systematics (for the sake of the example) indicated by
the <lvl_up> and <lvl_dn> tags.
In cases where the band would have a vanishing size, the uncertainty information is not written to the output file. This could be due either to negligibly small uncertainties, to the fact that for the considered region, the signal is excluded regardless the level of systematics (at the 100% confidence level), or to the region not targeting the signal at all (the corresponding selection efficiency being close to zero).
The CLs_output.dat dataset-specific files present in the output
subdirectory associated with each imported dataset all contain similar
modifications. In case of extrapolations to different luminosities, copies of
this file named CLs_output_lumi_<lumi>.dat are provided for each desired
luminosity <lumi>.
3 Gluino and neutralino mass limits
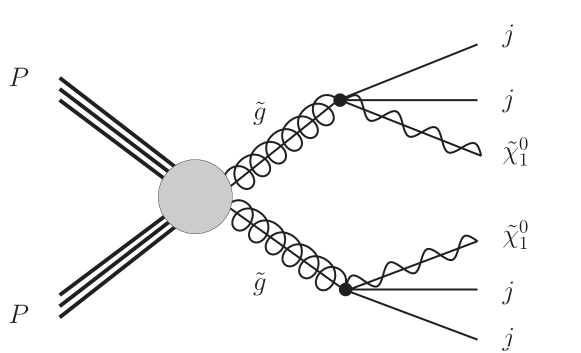
To illustrate the usage of the new functionalities of MadAnalysis 5 introduced in the previous section, we perform several calculations in the context of a simplified model inspired by the MSSM. In this framework, all superpartners are heavy and decoupled, with the exception of the gluino and the lightest neutralino , taken to be bino-like. Any given benchmark is thus defined by two parameters, namely the gluino and the neutralino masses and . Such a new physics setup can typically manifest itself at the LHC through a signature made of a large hadronic activity and missing transverse energy. As shown by the schematic Feynman diagram of figure 1, such a signature originates from the production of a pair of gluinos, each of them promptly decaying into two jets and a neutralino (via virtual squark contributions).
We study the sensitivity of the LHC and its higher-luminosity upgrades to this signal by analysing state-of-the-art Monte Carlo simulations achieved by means of the MG5_aMC framework (version 2.6.6) Alwall:2014hca , using the MSSM-NLO model implementation developed in ref. Frixione:2019fxg . Hard-scattering matrix elements are generated at the next-to-leading-order (NLO) accuracy in QCD and convoluted with the NLO set of NNPDF 3.0 parton densities Ball:2014uwa , as provided by the LHAPDF interface Buckley:2014ana . The gluino leading-order (LO) decays are handled with the MadSpin Artoisenet:2012st and MadWidth Alwall:2014bza packages. The resulting NLO matrix elements are then matched with Pythia parton showers and hadronisation (version 8.240) Sjostrand:2014zea , following the MC@NLO method Frixione:2002ik . Our predictions include theoretical uncertainties stemming from the independent variations of the renormalisation and factorisation scales by a factor of two up and down relatively to the central scale, taken as half the sum of the transverse masses of the final-state particles, as well as from the parton densities extracted following the recommendations of ref. Demartin:2010er .
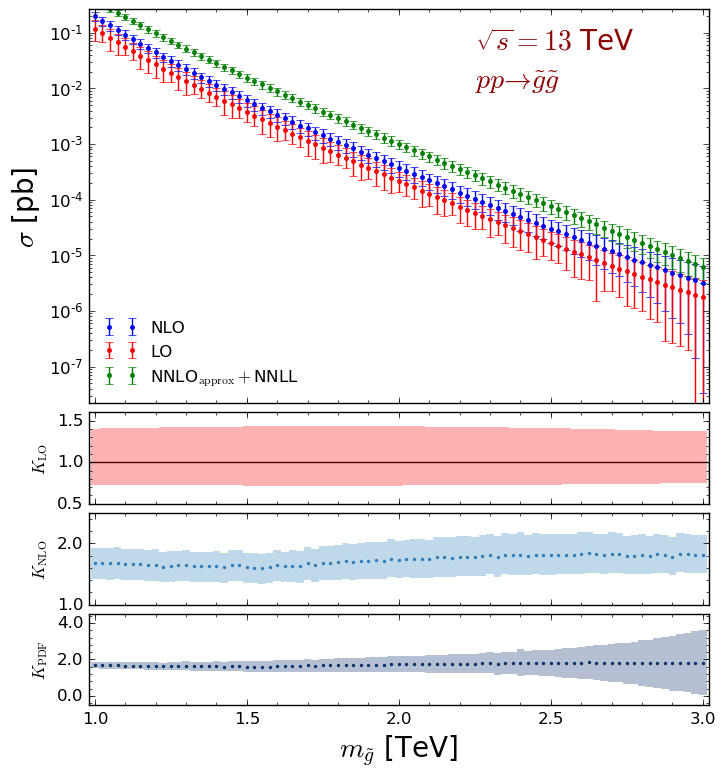
In the upper panel of figure 2, we present the total LO (red) and NLO (blue) gluino pair-production cross section for gluino masses ranging from 1 to 3 TeV, the error bars being associated with the quadratic sum of the scale and PDF uncertainties. The cross section central value is found to vary within the fb range when the gluino mass varies from 1 to 3 TeV, so that at least tens of gluino events could be expected even for a very heavy gluino benchmark at a high-luminosity upgrade of the LHC. We compare our predictions with the total rates traditionally employed by the ATLAS and CMS collaborations to extract gluino limits, as documented by the LHC Supersymmetry Cross Section Working Group Borschensky:2014cia . Hence we include, in the first panel of figure 2, total gluino-pair production cross sections matching approximate fixed-order results at next-to-next-to-leading order and threshold-resummed predictions at the next-to-next-to-leading logarithmic accuracy (NNLOapprox + NNLL, in green). Following the PDF4LHC recommendations, those more accurate NNLOapprox+NNLL predictions are obtained by convoluting the partonic cross section with a combination of NLO CTEQ6.6M Nadolsky:2008zw and MSTW2008 Martin:2009iq densities. This choice, together with the impact of the higher-order corrections, leads to NNLOapprox+NNLL results greater than our NLO predictions by a factor of about 2. While in the following we use NLO-accurate total rates (as the latter exist for any new physics model through a joint use of FeynRules Alloul:2013bka , NLOCT Degrande:2014vpa and MG5_aMC), we evaluate the impact of higher-order corrections whenever the relevant calculations exist, i.e. in this section and section 4.
With the second and third panels of the figure, we emphasise the significant reduction of the scale uncertainties at NLO by depicting the LO and NLO scale uncertainty bands respectively, the and quantities, presented in the two subfigures, these being the LO and NLO cross sections normalised to the LO central value. Such better control in the theoretical predictions is one of the main motivations for relying on NLO simulations instead of on LO ones. In the lower panel of figure 2, we focus on the PDF uncertainties associated with the total rates and present the quantity where the NLO result (with its PDF error band) is again shown relatively to the LO central result. We omit the corresponding LO curve, as it is similar to the NLO one, the same PDF set being used both at LO and NLO in order to avoid having to deal with the poor-quality LO NNPDF 3.0 fit Ball:2014uwa . Whilst the uncertainties are under good control over most of the probed mass range, the poor PDF constraints in the large Bjorken- regime lead to predictions plagued by sizeable uncertainties for gluino heavier than about TeV. Finally, our results show that the NLO -factor is of about , a typical value for a strong supersymmetric production process, and features a significant gluino mass dependence. The latter originates from the quark-antiquark contributions to the cross section that become relatively larger with respect to the gluon fusion ones with increasing Bjorken- values Beenakker:1996ch .
We then predict, for several configurations, how the signal events would populate the different signal regions of the ATLAS-SUSY-2016-07 search for supersymmetry Aaboud:2017vwy . In practice, we use the corresponding recast analysis as implemented in the MadAnalysis 5 public database Chalons:AtlasSusy1607 , together with the appropriate Delphes 3 configuration for the simulation of the detector response. In this analysis, the ATLAS collaboration investigates the potential of a signature featuring multiple jets and missing transverse energy through two approaches. The first one relies on the so-called effective mass , a variable defined as the scalar sum of the transverse momenta of the leading jets and the missing transverse energy. The second one is based on the recursive jigsaw reconstruction technique Jackson:2017gcy . Whilst all -based signal regions have been implemented in MadAnalysis 5, the recursive jigsaw reconstruction ones have been ignored due to the lack of information allowing for their proper recasting. They are thus ignored in the following study as well.
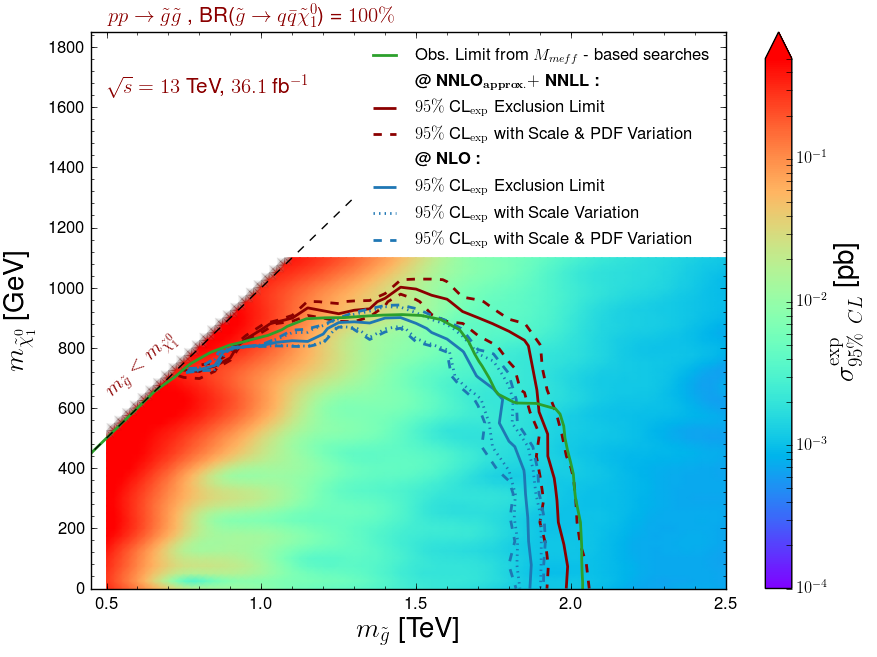
Our results are presented in figure 3 in the form of exclusion contours in the mass plane, to which we supplement the values of the signal cross section that are excluded at the 95% confidence level through a colour code. The exclusion contours and excluded cross sections at the 95% confidence level are extracted by means of Gaussian process regression with a conservative amount of data as implemented in the Excursion package lukas_heinrich_2018_1634428 .
We compare our predictions (the solid blue line), obtained with the setup described above, with the official ATLAS limits (the green line) as originating from the -based signal region yielding the best expectation. ATLAS simulations are based on calculations at the LO accuracy in which samples of events describing final states featuring up to two extra jets are merged Lonnblad:2011xx . Moreover, the ATLAS results are normalised to NLO cross sections matched with threshold resummation at the next-to-leading logarithmic accuracy (NLO+NLL) Borschensky:2014cia . The ATLAS setup therefore differs from ours both at the level of the differential distributions, as we model the properties of the second radiation jet solely at the level of the parton showers, and at the level of the total rates that are evaluated at the NLO matched with parton showers (NLO+PS) accuracy. This consequently results in MadAnalysis 5 limits slightly weaker than the ATLAS ones by about 10%, especially in the light neutralino mass regime.
With the goal of assessing the importance of the signal normalisation, we extract bounds on the model by making use of NNLOapprox+NNLL rates (red contour) instead of NLO ones (blue contour), NNLOapprox+NNLL predictions being the most precise estimates for gluino-pair production to date. While still different from what has been used in the ATLAS study, NLO-NLL and NNLOapprox+ NNLL predictions are known to be consistent with each other when theory error bands are accounted for. This has been documented, in the case of a gluino simplified model in which all squarks are decoupled, by the LHC Supersymmetry Cross Section Working Group444See the webpage https://twiki.cern.ch/LHCPhysics/SUSYCrossSections13TeVgluglu.. We observe a better agreement with the ATLAS results, showing the important role played by the new physics signal normalisation in the limit setting procedure. Large differences of about 5% on the mass limits are nevertheless still noticeable, showing that not only the normalisation but also the shape of the distributions are important ingredients. The ATLAS-SUSY-2016-07 analysis indeed relies on the variable that is particularly sensitive to the modelling of the second jet, as for all the analysis signal regions. In our setup in which NLO matrix elements are matched with parton shower, the second jet properties are described at the leading-logarithmic accuracy, the presence of this jet in the event final state solely originating from parton showering. This contrasts with ATLAS simulations in which LO matrix-element corrections are included as well, their final merged Monte Carlo signal samples including the contributions of LO matrix elements for gluino pair-production in association with two jets. This should motivate the usage of merged NLO samples matched with parton showers, so that predictions for observables sensitive to the sub-leading jet activity could be precisely achieved both for the shapes and the rates. The investigation of the actual impact of such an NLO multipartonic matrix element merging however goes beyond the scope of this work.
We also estimate in figure 3, the impact of the scale and PDF errors on the exclusion contours. For both MadAnalysis 5 predictions in which NLO (blue contour) and more precise NNLOapprox+NNLL (red contour) are used for the signal normalisation, we describe the effect of the scale uncertainties through dotted contours and the one of the combined scale and parton density uncertainties through dashed contour. It turns out that the uncertainties on the signal impacts the gluino mass limits by about 50 GeV in both cases, the effect being mostly dominated by scale variations. The reach of the considered ATLAS-SUSY-2016-07 analysis concerns gluino masses smaller than about 1.8 TeV. This corresponds to a mass range where the uncertainty on the predictions is dominated by the scale variations, as shown in figure 2. The latter indeed shows that the PDF errors (lower panel of the figure) are at the level of a few percents for TeV, the parton density fits being under a very good control for the corresponding Bjorken- values.
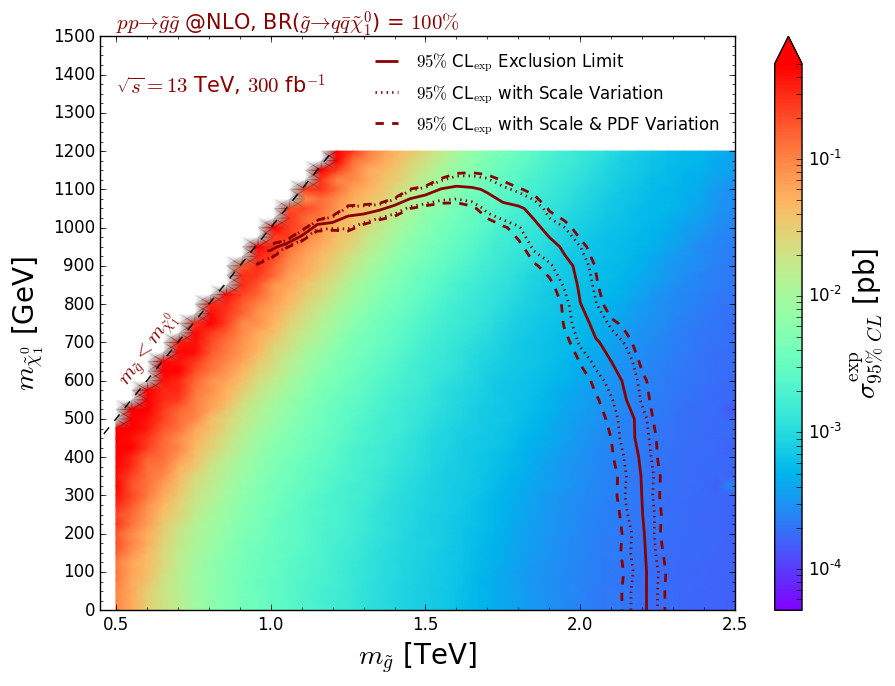
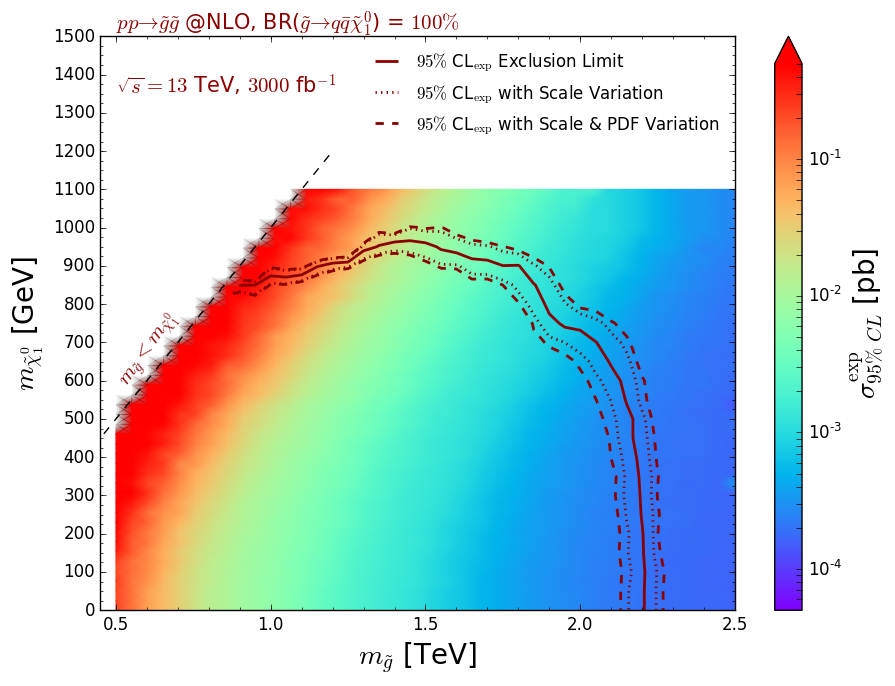
In order to estimate the reach of this ATLAS supersymmetry search in the context of the future runs of the LHC, we make use of the framework detailed in section 2.3 to extrapolate the results to 300 fb-1 and 3000 fb-1. As the ATLAS note of ref. Aaboud:2017vwy does not include detailed and separate information on the systematical and statistical components of the uncertainties associated with the SM expectation in each signal region, we consider the two implemented options for their extrapolation to higher luminosities. More conservative, a linear extrapolation assumes that the error on the SM background is mostly dominated by its systematical component and scales proportionally to the luminosity (see the first term in eq. (6)). More aggressive, an extrapolation in which the error scales proportionally to the square root of the luminosity (second term of eq. (6)) considers that the background uncertainties are mainly of a statistical origin. The second option hence naively leads to a more important gain in sensitivity for higher luminosities, by definition. For all our predictions, we normalise the signal rates to NLO.
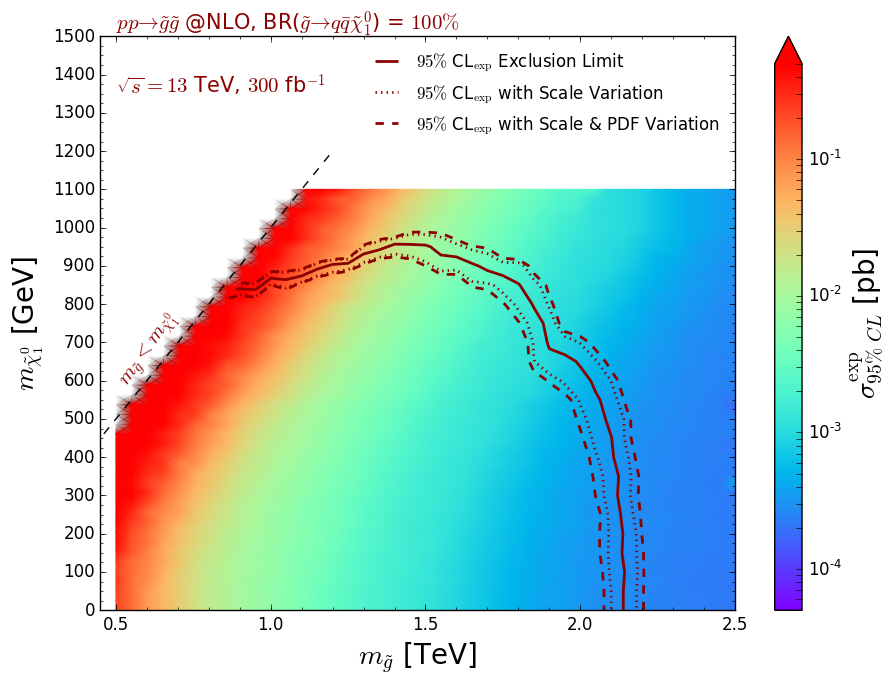
The results are presented in figure 4, first, by scaling the background uncertainties linearly to the luminosity (left panel, assuming that the background errors are dominated by the systematics), and second, by scaling them proportionally to the square root of the luminosity (right panel, assuming that the background errors are dominated by the statistical uncertainties). In all cases, we moreover assess the impact of the theory errors, the scale and PDF uncertainties being combined quadratically.
For an extrapolation to 300 fb-1 (upper subfigures), the gluino mass limits are pushed to TeV for a light bino-like neutralino with GeV. The 36 fb-1 exclusion is then found to be improved by about % (or GeV). For such a mass range, the error on the theoretical predictions is still dominated by the scale variations (see figure 2) and only mildly impacts the exclusion, the effects reaching a level of about 5%. Such a small effect on a mass limit is related to the behaviour of the cross section with the increasing gluino mass, that is only reduced by a factor of a few. Comparing the left and right upper figures, one can assess the impact of the different treatment for the extrapolation of the background uncertainties. In the parameter space region under discussion, the impact is mild, reaching roughly a level of about 5% on the gluino mass limit. Such a small effect originates from the small resulting difference on the background error, that is 3 times smaller in the more aggressive case. Correspondingly, this allows us to gain a factor of a 3 in cross section, or equivalently a few hundreds of GeV in terms of a mass reach.
For more compressed scenarios in which the neutralino is heavier ( GeV) and the gluino lighter ( TeV), the treatment of the background extrapolation has a quite severe impact on the bounds on the neutralino mass. A more conservative linear extrapolation of the background error does not yield any significant change comparatively to the 36 fb-1 case, neutralinos lighter than about 800 GeV being excluded. However, treating more aggressively the background uncertainties as being purely statistical, leads to an important increase in the bounds, neutralino masses ranging up to about 1 TeV becoming reachable. In those configurations, the spectra are more compressed and therefore more complicated to probe than for split configurations, consequently to the fact that the signal regions are less populated by the supersymmetry signals. A more precisely known background (with a relatively smaller uncertainty) is therefore crucial for being able to draw conclusive statements. As found in our results, any improvement, as little it is, can have a large impact.
In the lower subfigures, we present the results of an extrapolation to 3000 fb-1. All above-described effects are emphasised to a larger extent. The differences in the treatment of the background uncertainties corresponding to knowing the background more accurately indeed now involve a factor of 10 in precision. A more interesting aspect concerns the theoretical predictions themselves that turn out to be known less and less precisely consequently to large parton density uncertainties. The limits indeed enter a regime in which large Bjorken- are probed, which corresponds to PDF uncertainties contributing significantly to the total theory error. A better knowledge of the parton densities at large and large scale is thus mandatory to keep our capacity to probe new physics in this regime.
We have verified that the obtained bounds were compatible with the naive extrapolations performed by the Collider Reach555See the webpage http://collider-reach.web.cern.ch. platform that extracts naive limits of a given collider setup with respect to the reach of a second collider setup, rescaling the results of the later by ratio of partonic luminosities. For instance, an 1.8 TeV gluino excluded with 36 fb-1 of LHC collisions would correspond to a TeV exclusion at 300 fb-1. This is in fair agreement with our findings, after accounting for the fact that Collider Reach uses the NNPDF 2.3 set of parton densities Ball:2012cx , a set of parton distribution functions whose fit only includes 2010 and 2011 LHC data, so that important differences are expected, particularly for large -values.
Whilst our extrapolations rely on the reinterpretation of an ATLAS analysis of 36 fb-1 of LHC collisions, they are quite robust despite the small luminosity under consideration. Multijet plus missing transverse energy studies targeting a monojet-like topology (i.e. with a hard selection on the leading jet) are indeed limited by systematics Banerjee:2017wxi , so that only mild improvements could be expected with a higher luminosity. This is what has been found in the results of figure 4, the bounds being improved by at most 20% in mass when going from 300 to 3000 fb-1. This subsequently also implies that the expected sensitivity should be rather independent of the initially-analysed luminosity. We further demonstrate those considerations in figure 5.
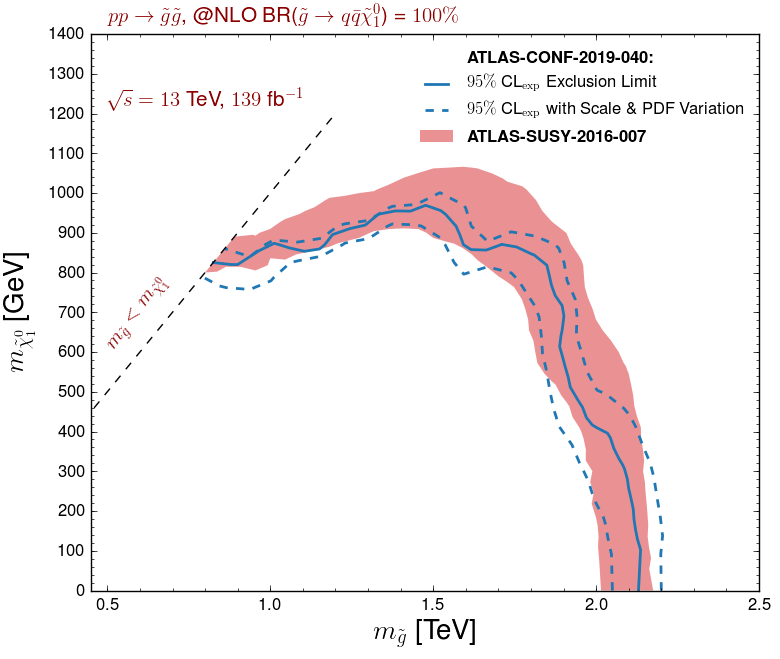
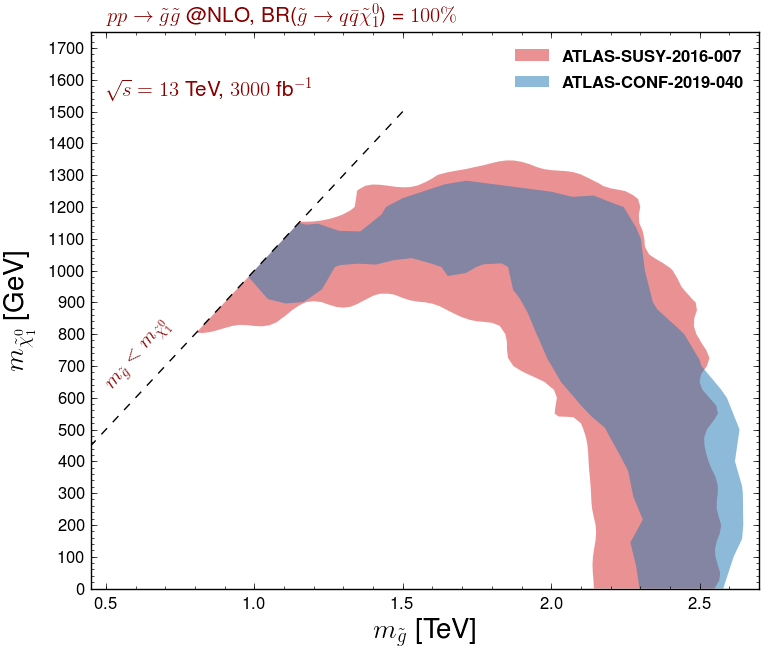
In the left panel of the figure, we extrapolate the results of the ATLAS-SUSY-2016-07 analysis to the full Run 2 luminosity of 139 fb-1, the theory errors being combined quadratically. In our extrapolation procedure, we have considered both that the background uncertainties are dominated by the systematics (linear scaling) and by the statistics (scaling proportional to the square root of the luminosity). The two set of results have been merged and presented as the unique envelope of the exclusion bands derived from the two extrapolation procedures. They could hence be seen as a conservative theory estimate for the LHC sensitivity at 139 fb-1, when estimated from official 36 fb-1 results.
The ATLAS-SUSY-2016-07 analysis has been updated last summer as the ATLAS-CONF-2019-040 analysis ATLAS:2019vcq , so that the most recent and stringent ATLAS limits on the considered gluino simplified model now encompass the analysis of the full LHC Run 2 dataset. On the other hand, the updated analysis has been recently added to the PAD atlas_conf_2019_040_ma5 , so that it can be used within the MadAnalysis 5 framework for reinterpretation studies. The corresponding 95% confidence level contour is shown on the left panel of figure 5 (solid blue line), together with the uncertainty band stemming from combining the scale and PDF uncertainties in quadrature. In addition, we also present predictions for the bounds as obtained from an extrapolations of early Run 2 results focusing on 36 fb-1 of LHC data. After accounting for the error bands, the two sets of constraints are found in good agreement, as expected.
On the right panel of figure 5, we consider the two ATLAS multijet plus missing transverse energy analyses that have been above-mentioned, namely the early LHC Run 2 ATLAS-SUSY-2016-07 analysis (36 fb-1, red) and the full Run 2 ATLAS-CONF-2019-040 analysis (139 fb-1, blue). We reinterpret their results with MadAnalysis 5, and extrapolate the predictions that have been obtained for the nominal luminosities of the two analyses to 3000 fb-1. The contours shown on the figure are obtained as before, i.e. by considering independent scalings of the background assuming that it is either dominated by the systematical or by the statistical uncertainties. The envelopes of the two exclusion bands (including the theory errors) are then reported in the figure. The two solid areas presented on the figure are found to largely overlap and be consistent with each other.
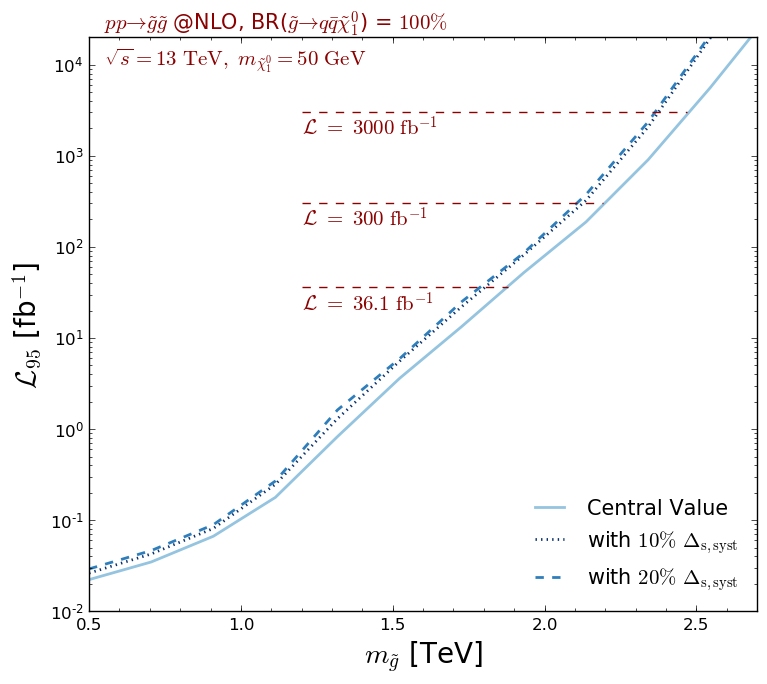
In figure 6, we make use of the MadAnalysis 5 infrastructure to estimate, for various benchmark points, the luminosity that is required to exclude the scenario at the 95% confidence level. We still consider the ATLAS-SUS-2016-07 analysis, fix the neutralino mass to 50 GeV and let the gluino mass vary. We compute for two choices of systematics on the signal (combined in both cases with the theory errors quadratically), namely 10% (dotted line) and 20% (dashed line), and compare the predictions with the central value where the signal is perfectly known (solid line). In those calculations, we scale the error on the background proportionally to the square root of the luminosity, as if it was mainly dominated by its statistical component. Our analysis first shows that light gluinos with masses smaller than about 1.5 TeV can be excluded with a luminosity of a few fb-1, as confirmed by the early Run 2 ATLAS search of ref. Aaboud:2016zdn that consists of the 3.2 fb-1 version of the ATLAS-SUSY-2016-07 analysis. The steep fall of the cross section with an increasing gluino mass moreover implies that the high-luminosity LHC reach of the analysis under consideration will be limited to gluinos of about 2.5 TeV, a bound that could be reduced by about 10% if the systematics on the signal are of about %. This order of magnitude has been found to agree with older ATLAS estimates ATLAS:2019vcq .
4 Squark and neutralino mass limits
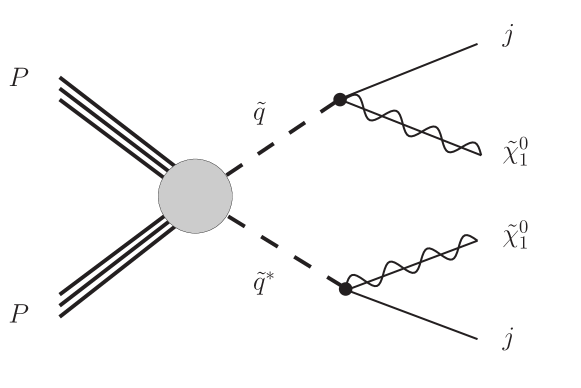
In this section, we consider a second class of simplified models inspired by the MSSM that is widely studied in the context of the LHC searches for new physics. As in section 3, all superpartners, except for two under investigation, are decoupled. This time, these are taken to be a squark and the lightest neutralino. In practice, we hence supplement the SM field content by one species of first generation squark and the lightest neutralino , assumed to be bino-like. In this configuration, squarks can be pair-produced through standard QCD interactions, and then each decays into the lightest neutralino and an up quark, as illustrated by the generic Feynman diagram of figure 7. Such a parton-level final state comprised of two quarks and two invisible neutralinos therefore manifests itself, after parton showering and hadronisation, as a multijet plus missing transverse energy topology.
The ATLAS analyses considered in section 3, targeting multijet plus missing energy signs of new physics, are therefore appropriate to put constraints on the model under consideration. Those analyses indeed include not only signal regions dedicated to probe final state featuring a large jet multiplicity (that are thus ideal to target the previously considered gluino simplified model), but also include signal regions targeting signals exhibiting a smaller jet multiplicity (that are thus excellent probes for the present squark simplified model). In the following, we only make use of the most recent search, ATLAS-CONF-2019-140 ATLAS:2019vcq .
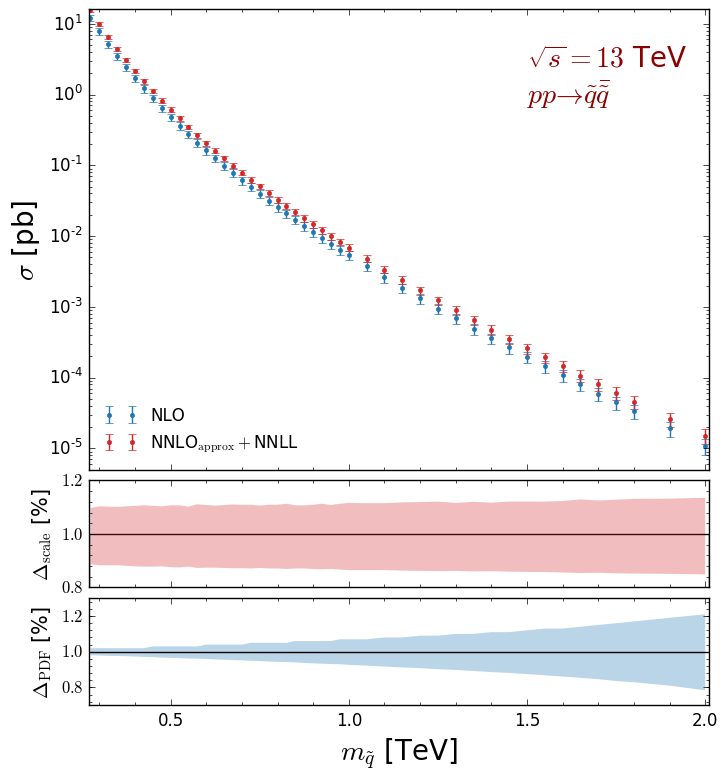
Making use of the same simulation setup as in section 3, we study the LHC sensitivity to this model after the full Run 2 and present the expectation of its high-luminosity operation run. Our results are derived from simulations at the NLO+PS accuracy, so that our signal samples are normalised at the NLO accuracy. The rates that we employ in the following are depicted in the upper panel of figure 8, where we show total NLO-accurate squark-pair production cross sections as returned by MG5_aMC when using the MSSM implementation developed in ref. Frixione:2019fxg and the NLO set of NNPDF 3.0 parton densities Ball:2014uwa (blue). Predictions are given for squark masses ranging from 250 GeV to 2 TeV and include theory errors that we estimate by adding scale and PDF uncertainties in quadrature. Those uncertainties are further described more precisely in the middle and lower panels of the figure, where they are given after normalising the results to the central NLO cross section value for each mass point.
We obtain cross sections that vary from 10 pb for GeV to 0.01 fb for 2 TeV squarks. They are two orders of magnitude lower than in the gluino case for a specific mass value, as expected from the fact that squarks are scalars and are colour triplets and not octets. Scale uncertainties are found to be independent of the squark mass for the considered range, and are of about 15% (middle panel of the figure). In contrast, the PDF errors strongly depend on the squark mass (lower panel of the figure), as they are correlated with the associated Bjorken- regime. They are of a few percents and thus subleading for small values, and grow for increasing squark masses, eventually reaching 20% for TeV. For larger and larger -values (and thus larger and larger ), the quark-antiquark contributions to the cross section play a bigger and bigger role. Simultaneously, the impact of the Bjorken- regime in which the PDF sets are more poorly constrained by data gets more important.
As in section 3, we compare our predictions to the cross section values usually employed by the LHC collaborations (red curve), as reported by the LHC Supersymmetry Cross Section Working Group Borschensky:2014cia . The latter are however only provided for a simplified model in which all squarks except the two stop squarks are mass-degenerate. We therefore normalise the NNLOapprox+NNLL results by an extra factor of 1/10, which should be a fair enough approximation for small squark masses. Nevertheless, as both NLO and NNLOapprox+NNLL predictions are consistent, we consider (exact) NLO rates in the following.
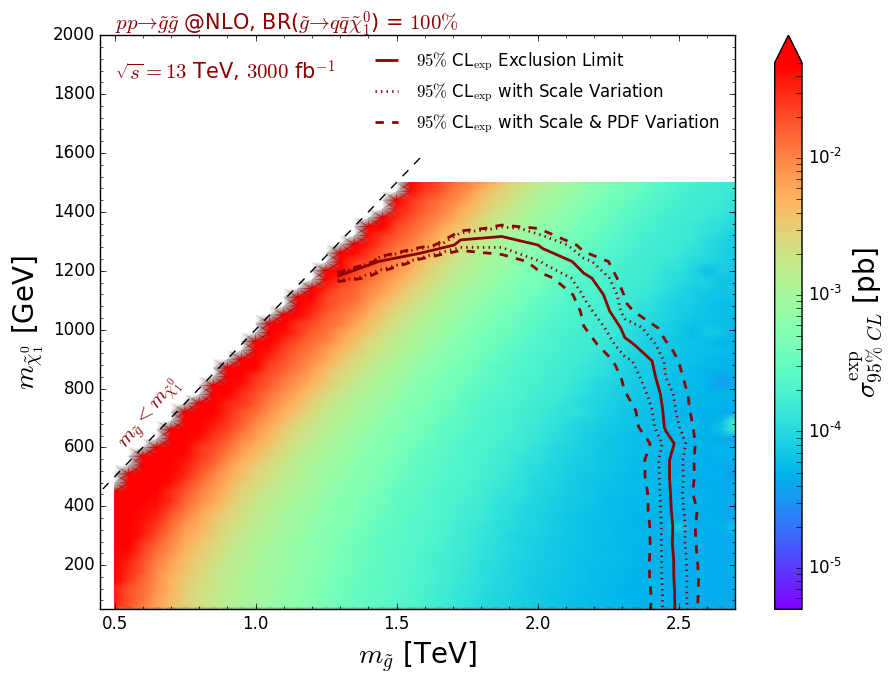
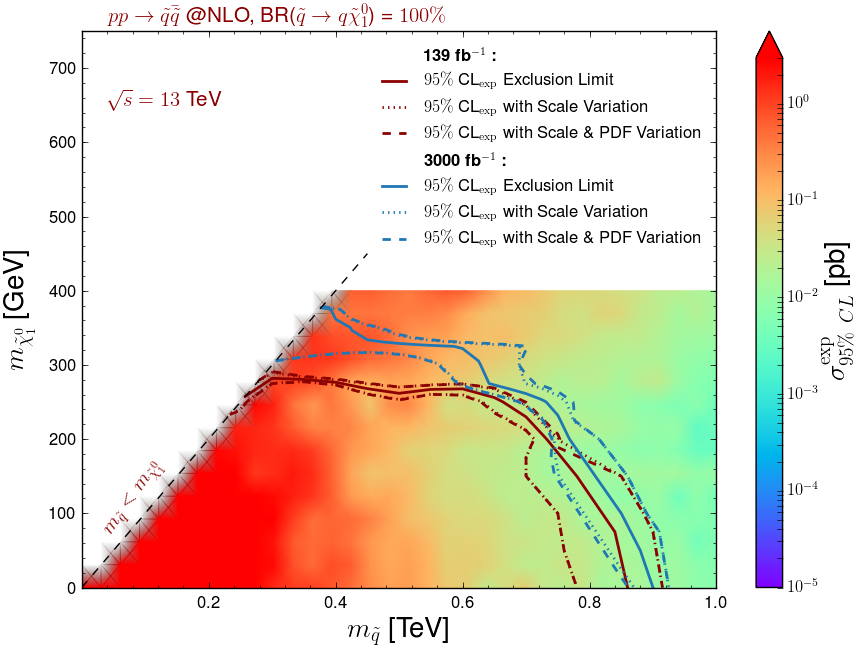
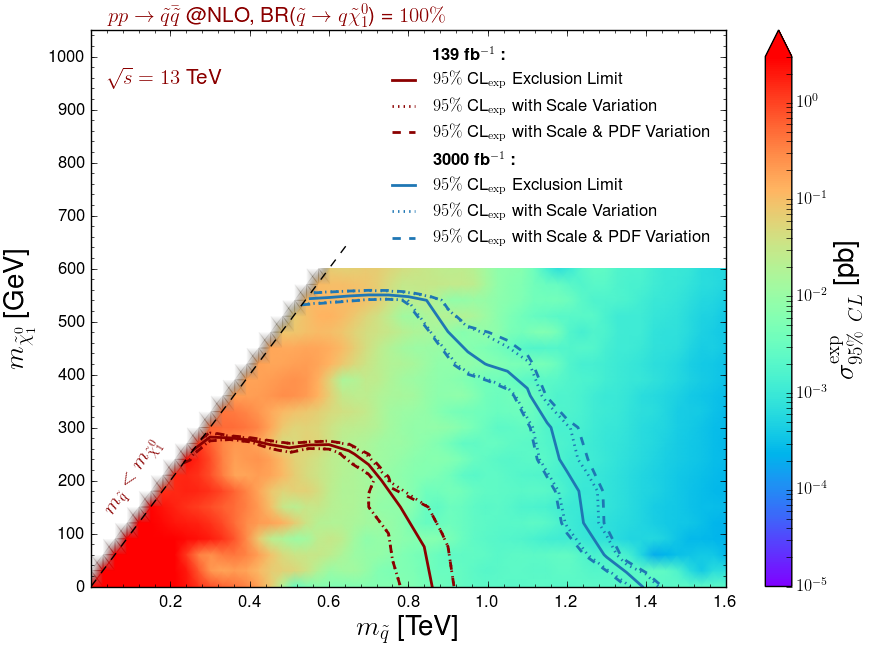
In figure 9, we reinterpret the results of the ATLAS-CONF-2019-040 analysis with MadAnalysis 5 and present the expected exclusion contours both at the nominal luminosity of 139 fb-1, after extrapolating the findings to 3000 fb-1, using for each point the region yielding the best expected sensitivity. Neutralino masses below about 300 GeV are currently (i.e. for a luminosity of 139 fb-1) excluded, for squark masses ranging up to about 900 GeV. This may seem to contrast by a factor of about 2 with the current bounds on this class of simplified model set by the ATLAS collaboration ATLAS:2019vcq . This is however not surprising as the collaboration only interprets its results for a simplified model in which the superpartner spectrum exhibits 10 mass-denegerate left-handed and right-handed squarks (i.e. all squarks except the two stop squarks are degenerate). The corresponding signal cross sections are therefore about 10 times larger, so that much stronger limits could be extracted. In comparison with final Run 2 CMS results Sirunyan:2019xwh ; Sirunyan:2019ctn for which result interpretations both for eight mass-degenerate squarks and a single squark species are provided, we obtain more conservative bounds that are roughly 20% weaker in terms of excluded masses. When accounting for the uncertainty bands, our predictions agree with the experimental findings, as the uncertainty bands overlap.
Extrapolating the results to a luminosity of 3000 fb-1, i.e. expected luminosity of the high-luminosity phase of the LHC, we obtain expected bounds which are improved quite a bit. The magnitude of the improvement is found strongly related to how the background uncertainties will be controlled, as visible by comparing the curves corresponding to 3000 fb-1 (blue) in the two panels of the figure. Assuming that the background is dominated by the systematics or the statistics change the results by more than 40%.
5 Sensitivity to simplified -channel dark matter models
In this section, we investigate the sensitivity of the LHC to a simplified dark matter (DM) model. We assume that DM is described by a massive Dirac fermionic particle that communicates with the Standard Model through the exchange of a spin-1 mediator . Motivated by models with an extended gauge group, we consider that the mediator couples only either to a pair of DM particles, or to a pair of SM fermions. Such a configuration is typical from the so-called -channel dark matter models Backovic:2015soa ; Abercrombie:2015wmb . In this class of scenarios, DM can only be pair-produced at colliders, from the scattering of a pair of SM quarks and through the -channel exchange of the mediator.
The corresponding Lagrangian can generically be written as
| (8) |
where refers to the SM Lagrangian and contains gauge-invariant kinetic and mass terms for all new fields. The next term includes the vector and axial-vector interactions of the mediator with DM, their strength being denoted by and respectively, and the last term focus on the mediator interactions with the SM quarks. The latter are assumed universal and flavour-independent, their strength being and in the vector and axial-vector case respectively, regardless of the quark flavour.
In our analysis, we focus on two further simplified scenarios originating from that model. In a first case (that we label S1), the mediator couplings are taken as of a vectorial nature, whilst in the second case (that we label S2), they are taken as of an axial-vectorial nature. In other words, the two scenarios are defined as
| (9) |
In order to study the sensitivity of the LHC to these two classes of scenarios, we make use of the publicly available666See the webpage http://feynrules.irmp.ucl.ac.be/wiki/DMsimp. implementation of the model in the FeynRules package Alloul:2013bka introduced in ref. Backovic:2015soa , as well as of the corresponding public UFO Degrande:2011ua library. As in the previous sections, hard scattering events are generated at the NLO accuracy in QCD with MG5_aMC Alwall:2014hca and then matched with parton showering and hadronisation as performed by Pythia Sjostrand:2014zea . In our simulations, the matrix elements are convoluted with the NLO set of NNPDF 3.0 parton densities Ball:2014uwa . We derive the LHC sensitivity to the model by considering the associated production of a pair of dark matter particles with jets, a signature targeted by the ATLAS-CONF-2019-040 analysis ATLAS:2019vcq introduced in the previous sections. This ATLAS study searches for new phenomena in a luminosity of 139 fb-1 of LHC data at a centre-of-mass energy of 13 TeV, investigating events featuring at least two hard jets and a potential subleading jet activity.

As the analysis selection requires at least two very hard jets, we consider as a hard-scattering process the production of a pair of DM particles with two hard jets, as sketched in figure 10. Moreover, we impose two conservative (with respect to the ATLAS analysis) generator-level selections. We constrain the transverse momentum of the hardest of the jets to satisfy GeV, and the parton-level missing transverse energy (i.e. the transverse energy of the vector sum of the transverse momenta of the two DM particles) to fulfil GeV. Moreover, the reference renormalisation and factorisation scales are set to the mass of the mediator , and we estimate the associated uncertainties as usual, by independently varying the two scales by a factor of 2 up and down around the central scale choice.
We begin with considering a series of scenarios featuring light dark matter, i.e. with a dark matter mass fixed to 100 GeV. The mediator mass is kept free to vary in the [0.3, 2] TeV range. In table 1, we present the sensitivity of the ATLAS-CONF-2019-040 analysis to those scenarios, both at the nominal luminosity of 139 fb-1 and for the high-luminosity LHC run (with 3000 fb-1). For each spectrum configuration, we show NLO signal cross sections (second and fifth columns for the S1 and S2 benchmarks respectively), as obtained following the simulation setup described above and for couplings obeying to eq. (9). Moreover, those predictions are obtained after fixing the remaining non-vanishing free parameters to the reference values
| (10) |
which consist in one of the benchmarks studied by the LHC dark matter working group Abercrombie:2015wmb .
| Vector couplings (S1) | Axial-vector couplings (S2) | |||||
|---|---|---|---|---|---|---|
| [TeV] | [pb] | [pb] | [pb] | [pb] | ||
We first assess the LHC sensitivity to each point for the two considered luminosities in terms of the signal cross section that is reachable at the LHC (third and sixth columns of table 1 for the S1 and S2 benchmarks respectively) by reinterpreting, with MadAnalysis 5, the results of the ATLAS-CONF-2019-040 analysis. Second, we translate the cross section limits that we have obtained into a bound on a universal new physics coupling strength that is defined for scenarios in which
| (11) |
Moreover, we provide the limits together with the theory uncertainty stemming from scale and PDF variations (fourth and seventh column of the table). The most stringent bounds on the model originate from a single signal region of the analysis in which, the effective mass is imposed to be larger than 2.2 TeV. Such a cut is applied together with looser cuts on the jet properties, as compared with other signal regions featuring smaller effective masses.
For fixed vector couplings (S1 scenarios), the NLO cross section decreases when the mediator mass increases and spans a range extending from about 450 fb for heavy mediators with a mass of about 2 TeV, to more than 10 pb for mediators lighter than 500 GeV. Those values and this steeply-falling behaviour are mainly driven by the heavy mass of the mediator as compared with the small dark matter mass. Larger cross sections are indeed obtained for smaller mediator masses as we lie closer to the resonant regime in which . The cross section that is expected to be excluded at the 95% confidence level also falls down with , although the slope is much flatter. Moreover, . Consequently, all scenarios defined by the coupling assumptions of eq. (9) and eq. (10) are excluded, already with the present full Run 2 luminosity.
Relaxing the coupling definitions of eq. (10) and replacing it by the universal coupling constraint of eq. (11), it turns out that couplings of 0.4–0.7 are excluded over the entire mass range, the best limits being obtained for scenarios featuring sub-TeV mediators and a spectrum such that one lies far enough from the resonant regime. In the latter case, the analysis is less sensitive as a consequence of the associated softer final state objects populating the signal events. The overall weak dependence of the excluded coupling on the mediator mass stems from various interplaying effects. First, the cross section has a quartic dependence on the couplings, so that a small coupling change leads to a large modification of the cross section. Second, there is a strong interplay between the mediator mass and the dark matter mass (i.e. if ones lies for enough from the resonant regime) and the kinematical configuration probed by the analysis cuts, especially for light mediators.
In the heavy-mediator regime, considering S2 scenarios featuring axial-vector mediator couplings leads to very similar results. In this limit, the relevant matrix elements are insensitive to the mediator nature. On the contrary, when one approaches the resonant regime, significant changes arise: The cross section turns out to be suppressed relatively to the vector S1 scenario. This originates from the impact of the threshold regime that plays a larger and larger role for smaller and smaller masses. At threshold, the pair of dark matter particles is organised into a state, and not into a configuration as in the S1 scenario. Consequently, signal cross sections are relatively suppressed. The small increase in cross section for low values in the S2 case hence stems from those threshold effects that are more and more tamed when one gets further from threshold, as well as from the cut on the leading jet of 150 GeV. As in the S1 scenario, the entire mass range is excluded by the ATLAS-CONF-2019-040 analysis, which translates in the exclusion of couplings in the 0.4–0.7 ballpark for the considered mediator mass range.
Finally, those bounds are expected to only be sightly improved, by about 4–9%, after including 3000 fb-1 of data for both scenarios. This is related to the systematical dominance of the uncertainties on the background, as we have chosen to scale it under that assumption, so that more luminosity will not bring much compared with the Run 2 results. Moreover, we observe that the results are plagued by quite modest theoretical uncertainties at the level (by virtue of the quartic dependence of the matrix element of the coupling).
| Vector coupling (S1) | Axial-vector coupling (S2) | |||||
|---|---|---|---|---|---|---|
| [GeV] | [pb] | [pb] | [pb] | [pb] | ||
In table 2, we consider a new class of scenarios. This time, the mediator mass is fixed to 1.5 TeV and we vary the dark matter mass from 200 to 900 GeV.
We first consider scenarios with couplings satisfying eqs. (9) and (10). We evaluate fiducial NLO cross sections for the different considered mass spectra (second and fifth columns of the table for the S1 and S2 cases respectively), after imposing the previously-mentioned cuts on the transverse momentum of the leading jet GeV and on the parton-level missing transverse energy GeV. For both the S1 and S2 scenarios, the NLO predictions are found to decrease with the dark matter mass, paying the price of a phase-space suppression. The falling behaviour is found steeper once the dark matter mass is greater than half the mediator mass, as it has to be produced off-shell (i.e. for ). Moreover, for given masses and couplings, S1 cross sections (i.e. in the case of mediator vector couplings) are larger. This originates from the -wave suppression of DM production through an axial-vector mediator (i.e. in the S2 scenario), as already mentioned earlier in this section.
We then evaluate the cross section value that is excuded at the 95% confidence level (third and sixth columns of the table) by reinterpreting the results of the ATLAS-CONF-2019-040 analysis. We observe that small dark matter masses are excluded already with the full Run 2 dataset, cross sections as small as 100 fb being excluded regardless of the DM mass. Moving on with a scenario in which the couplings satisfy eqs. (9) and (11), we translate the bounds that we have obtained into bounds on a universal coupling. The latter is found to be of at most in the 0.5–0.7 range once one lies in a configuration below threshold (), and is mostly unconstrained for larger DM mass values. As for the previous class of scenarios in which the DM mass was fixed and the mediator mass was varying, 3000 fb-1 will not improve the limits much, as the analysis being dominated by the systematics. We indeed expect an improvement on the bounds of at most 3-4%.
6 Conclusion
In this paper we showcased new features of the MadAnalysis 5 package that improve the recasting functionalities of the programme. These features focus on two aspects.
First, we have designed a way to include the uncertainties on the signal when the code is used to reinterpret given LHC results in different theoretical contexts. Theory errors on the total signal production cross section induced by scale and PDF variations can be propagated through the reinterpretation procedure. This results in an uncertainty band attached to the confidence level at which a given signal is excluded. In addition, the user has the option to provide information on the systematic uncertainties on the signal. With the existence of new physics masses being pushed to higher and higher scales, keeping track of error information on the signal becomes mandatory, especially for what concerns the theoretical uncertainties, which can be significant for beyond the Standard Model physics signals involving heavy particles.
Second, we have implemented a new option allowing the user to extrapolate the constraining power of any specific analysis to a different luminosity, assuming a naive scaling of the signal and background selection efficiencies. Several options are available for the treatment of the background uncertainties, depending on the information provided by the experimental collaborations for the analyses under consideration. If information on the statistical and systematical components of the uncertainties is available separately, signal region by signal region, MadAnalysis 5 can use it to scale them up accordingly, i.e. proportionally to the square root of the luminosity and linearly to the luminosity for the statistical and systematical uncertainties respectively. In contrast, if such a detailed information is absent, the user is offered the choice to treat the total error as being dominated either by statistics or by systematics, or in his/her preferred fashion.
We have illustrated the usage of these new MadAnalysis 5 features in the framework of three simplified models for new physics.
First, we consider a signal that originates from the production of a pair of gluinos that each decay into two jets and missing transverse momentum. As an example, we make predictions in the context of a simplified model inspired by the MSSM, in which only the gluino and the lightest neutralino are light enough to be reachable at the LHC. We have investigated the potential of two ATLAS searches for supersymmetry in 36 fb-1 and 139 fb-1 of LHC data. Those searches both rely on the effective mass variable and on the presence of a large amount of missing transverse energy, and include a large variety of signal regions featuring different jet multiplicity and hadronic activity. We have reproduced to a good approximation the ATLAS results at the nominal luminosity of the analysis and compared our extrapolations at higher luminosities with those obtained either through the more naive approach of the Collider Reach platform, or to publicly available ATLAS estimates for the high-luminosity runs of the LHC. Fair agreement has been found. We have moreover studied the differences in the expected sensitivity that arise when one considers, as a starting point, an analysis of 36 or 139 fb-1 of Run 2 LHC data. Our predictions are found fairly compatible, once theory errors are accounted for.
Second, we have focused on another MSSM-inspired simplified model in which the SM field content is supplemented by one species of first generation squark and one neutralino, all other supersymmetric states being decoupled. The spectrum configuration is therefore such that the squark is heavier than the neutralino and thus always decay into a light quark and a neutralino. This gives rise to a multijet plus missing transverse energy signatures stemming from squark pair production and decay. However, in contrast with the gluino case, a smaller signal jet multiplicity is expected. We have considered the same ATLAS supersymmetry search in 139 fb-1 of LHC data as above-mentioned, as it includes signal regions with a smaller jet multiplicity so that some sensitivity to the considered simplified model is expected. We have reinterpreted the results of the search and derived up-to-date constraints on the model. We have then extrapolated our findings to the high-luminosity LHC case.
Finally, we have considered an -channel dark matter simplified model in which one extends the Standard Model by a single dark matter candidate and one mediator that connects the dark sector (made of the dark matter state) to the SM sector. We have considered a fermionic dark matter state and a spin-1 mediator that couples to a pair of SM quarks and a pair of dark matter particles. Typical dark matter signals hence arise from the production of a pair of dark matter particles (through an -channel mediator exchange) in association with a hard visible object. The most common case involves the production of a jet with a pair of invisible dark matter particles, the signal being dubbed monojet in this case. As the above ATLAS search is sensitive to such a signature (by virtue of the properties of its low jet multiplicity signal regions), we reinterpret its results to constrain the simplified model under consideration. We focus on and compare two cases where the mediator couplings are of a vector and axial-vector nature respectively. We then extract the current limits on the model, and additionally project them at a higher-luminosity to get estimates for the LHC sensitivity to the two studied -channel dark matter setups.
In all the models investigated , our results emphasise the importance of embedding the uncertainties on the signal. In one considered example, this could degrade the expected bounds by about %, especially as a consequence of the large theory errors originating from the poor PDF fit constraints at large Bjorken-. Such a regime is indeed relevant for new physics configurations still allowed by current data and that involve the production of massive particles lying in the multi-TeV mass range.
7 Acknowledgements
JYA acknowledges the hospitality of the LPTHE (Sorbonne Université) and IPPP (Durham University) where parts of this work were completed. MF acknowledges the NSERC for partial financial support under grant number SAP105354. BF has been supported by the LABEX ILP (ANR-11-IDEX-0004-02, ANR-10-LABX-63).
References
- (1) S. Kraml, S. Kulkarni, U. Laa, A. Lessa, W. Magerl, D. Proschofsky-Spindler et al., SModelS: a tool for interpreting simplified-model results from the LHC and its application to supersymmetry, Eur. Phys. J. C74 (2014) 2868, [1312.4175].
- (2) M. Drees, H. Dreiner, D. Schmeier, J. Tattersall and J. S. Kim, CheckMATE: Confronting your Favourite New Physics Model with LHC Data, Comput. Phys. Commun. 187 (2015) 227–265, [1312.2591].
- (3) B. Dumont, B. Fuks, S. Kraml, S. Bein, G. Chalons, E. Conte et al., Toward a public analysis database for LHC new physics searches using MADANALYSIS 5, Eur. Phys. J. C75 (2015) 56, [1407.3278].
- (4) A. Buckley, J. Butterworth, L. Lonnblad, D. Grellscheid, H. Hoeth, J. Monk et al., Rivet user manual, Comput. Phys. Commun. 184 (2013) 2803–2819, [1003.0694].
- (5) GAMBIT collaboration, C. Balázs et al., ColliderBit: a GAMBIT module for the calculation of high-energy collider observables and likelihoods, Eur. Phys. J. C77 (2017) 795, [1705.07919].
- (6) C. Arina et al., A comprehensive approach to dark matter studies: exploration of simplified top-philic models, JHEP 11 (2016) 111, [1605.09242].
- (7) S. Frixione, B. Fuks, V. Hirschi, K. Mawatari, H.-S. Shao, P. Sunder et al., Automated simulations beyond the Standard Model: supersymmetry, JHEP 12 (2019) 008, [1907.04898].
- (8) E. Conte and B. Fuks, Confronting new physics theories to LHC data with MADANALYSIS 5, Int. J. Mod. Phys. A33 (2018) 1830027, [1808.00480].
- (9) J. Alwall, P. Schuster and N. Toro, Simplified Models for a First Characterization of New Physics at the LHC, Phys. Rev. D 79 (2009) 075020, [0810.3921].
- (10) LHC New Physics Working Group collaboration, D. Alves, Simplified Models for LHC New Physics Searches, J. Phys. G 39 (2012) 105005, [1105.2838].
- (11) ATLAS collaboration, M. Aaboud et al., Search for squarks and gluinos in final states with jets and missing transverse momentum using 36 fb-1 of TeV pp collision data with the ATLAS detector, Phys. Rev. D97 (2018) 112001, [1712.02332].
- (12) ATLAS collaboration, The ATLAS collaboration, Search for squarks and gluinos in final states with jets and missing transverse momentum using 139 fb-1 of =13 TeV collision data with the ATLAS detector, ATLAS-CONF-2019-040.
- (13) M. Backović, M. Krämer, F. Maltoni, A. Martini, K. Mawatari and M. Pellen, Higher-order QCD predictions for dark matter production at the LHC in simplified models with s-channel mediators, Eur. Phys. J. C 75 (2015) 482, [1508.05327].
- (14) D. Abercrombie et al., Dark Matter Benchmark Models for Early LHC Run-2 Searches: Report of the ATLAS/CMS Dark Matter Forum, Phys. Dark Univ. 27 (2020) 100371, [1507.00966].
- (15) E. Conte, B. Fuks and G. Serret, MadAnalysis 5, A User-Friendly Framework for Collider Phenomenology, Comput. Phys. Commun. 184 (2013) 222–256, [1206.1599].
- (16) E. Conte, B. Dumont, B. Fuks and C. Wymant, Designing and recasting LHC analyses with MadAnalysis 5, Eur. Phys. J. C74 (2014) 3103, [1405.3982].
- (17) DELPHES 3 collaboration, J. de Favereau, C. Delaere, P. Demin, A. Giammanco, V. Lemaître, A. Mertens et al., DELPHES 3, A modular framework for fast simulation of a generic collider experiment, JHEP 02 (2014) 057, [1307.6346].
- (18) R. Brun and F. Rademakers, ROOT: An object oriented data analysis framework, Nucl. Instrum. Meth. A389 (1997) 81–86.
- (19) M. Cacciari, G. P. Salam and G. Soyez, FastJet User Manual, Eur. Phys. J. C72 (2012) 1896, [1111.6097].
- (20) A. L. Read, Presentation of search results: The CL(s) technique, J. Phys. G28 (2002) 2693–2704.
- (21) D. Binosi, J. Collins, C. Kaufhold and L. Theussl, JaxoDraw: A Graphical user interface for drawing Feynman diagrams. Version 2.0 release notes, Comput. Phys. Commun. 180 (2009) 1709–1715, [0811.4113].
- (22) J. Alwall, R. Frederix, S. Frixione, V. Hirschi, F. Maltoni, O. Mattelaer et al., The automated computation of tree-level and next-to-leading order differential cross sections, and their matching to parton shower simulations, JHEP 07 (2014) 079, [1405.0301].
- (23) NNPDF collaboration, R. D. Ball et al., Parton distributions for the LHC Run II, JHEP 04 (2015) 040, [1410.8849].
- (24) A. Buckley, J. Ferrando, S. Lloyd, K. Nordström, B. Page, M. Rüfenacht et al., LHAPDF6: parton density access in the LHC precision era, Eur. Phys. J. C75 (2015) 132, [1412.7420].
- (25) P. Artoisenet, R. Frederix, O. Mattelaer and R. Rietkerk, Automatic spin-entangled decays of heavy resonances in Monte Carlo simulations, JHEP 03 (2013) 015, [1212.3460].
- (26) J. Alwall, C. Duhr, B. Fuks, O. Mattelaer, D. G. Öztürk and C.-H. Shen, Computing decay rates for new physics theories with FeynRules and MadGraph5_aMC@NLO, Comput. Phys. Commun. 197 (2015) 312–323, [1402.1178].
- (27) T. Sjöstrand, S. Ask, J. R. Christiansen, R. Corke, N. Desai, P. Ilten et al., An Introduction to PYTHIA 8.2, Comput. Phys. Commun. 191 (2015) 159–177, [1410.3012].
- (28) S. Frixione and B. R. Webber, Matching NLO QCD computations and parton shower simulations, JHEP 06 (2002) 029, [hep-ph/0204244].
- (29) F. Demartin, S. Forte, E. Mariani, J. Rojo and A. Vicini, The impact of PDF and alphas uncertainties on Higgs Production in gluon fusion at hadron colliders, Phys. Rev. D82 (2010) 014002, [1004.0962].
- (30) C. Borschensky, M. Krämer, A. Kulesza, M. Mangano, S. Padhi, T. Plehn et al., Squark and gluino production cross sections in pp collisions at = 13, 14, 33 and 100 TeV, Eur. Phys. J. C74 (2014) 3174, [1407.5066].
- (31) P. M. Nadolsky, H.-L. Lai, Q.-H. Cao, J. Huston, J. Pumplin, D. Stump et al., Implications of CTEQ global analysis for collider observables, Phys. Rev. D78 (2008) 013004, [0802.0007].
- (32) A. D. Martin, W. J. Stirling, R. S. Thorne and G. Watt, Parton distributions for the LHC, Eur. Phys. J. C63 (2009) 189–285, [0901.0002].
- (33) A. Alloul, N. D. Christensen, C. Degrande, C. Duhr and B. Fuks, FeynRules 2.0 - A complete toolbox for tree-level phenomenology, Comput. Phys. Commun. 185 (2014) 2250–2300, [1310.1921].
- (34) C. Degrande, Automatic evaluation of UV and R2 terms for beyond the Standard Model Lagrangians: a proof-of-principle, Comput. Phys. Commun. 197 (2015) 239–262, [1406.3030].
- (35) W. Beenakker, R. Hopker, M. Spira and P. M. Zerwas, Squark and gluino production at hadron colliders, Nucl. Phys. B492 (1997) 51–103, [hep-ph/9610490].
- (36) G. Chalons and H. Reyes-Gonzalez, MadAnalysis 5 implementation of ATLAS-SUSY-16-07 (arXiv:1712.02332), 10.7484/INSPIREHEP.DATA.56DC.PPE2.
- (37) P. Jackson and C. Rogan, Recursive Jigsaw Reconstruction: HEP event analysis in the presence of kinematic and combinatoric ambiguities, Phys. Rev. D96 (2017) 112007, [1705.10733].
- (38) L. Heinrich, G. Louppe and K. Cranmer, diana-hep/excursion: Initial zenodo release, 10.5281/zenodo.1634428.
- (39) L. Lonnblad and S. Prestel, Matching Tree-Level Matrix Elements with Interleaved Showers, JHEP 03 (2012) 019, [1109.4829].
- (40) R. D. Ball, V. Bertone, S. Carrazza, C. S. Deans, L. Del Debbio et al., Parton distributions with LHC data, Nucl.Phys. B867 (2013) 244–289, [1207.1303].
- (41) S. Banerjee, D. Barducci, G. Bélanger, B. Fuks, A. Goudelis and B. Zaldivar, Cornering pseudoscalar-mediated dark matter with the LHC and cosmology, JHEP 07 (2017) 080, [1705.02327].
- (42) F. Ambrogi, MadAnalysis 5 recast of ATLAS-CONF-2019-040, 10.7484/INSPIREHEP.DATA.45EF.23SB.
- (43) ATLAS collaboration, M. Aaboud et al., Search for squarks and gluinos in final states with jets and missing transverse momentum at 13 TeV with the ATLAS detector, Eur. Phys. J. C76 (2016) 392, [1605.03814].
- (44) CMS collaboration, A. M. Sirunyan et al., Searches for physics beyond the standard model with the variable in hadronic final states with and without disappearing tracks in proton-proton collisions at 13 TeV, Eur. Phys. J. C80 (2020) 3, [1909.03460].
- (45) CMS collaboration, A. M. Sirunyan et al., Search for supersymmetry in proton-proton collisions at 13 TeV in final states with jets and missing transverse momentum, JHEP 10 (2019) 244, [1908.04722].
- (46) C. Degrande, C. Duhr, B. Fuks, D. Grellscheid, O. Mattelaer and T. Reiter, UFO - The Universal FeynRules Output, Comput. Phys. Commun. 183 (2012) 1201–1214, [1108.2040].