Stellar Pulsation and the Production of Dust and Molecules in Galactic Carbon Stars
Abstract
New infrared spectra of 33 Galactic carbon stars from FORCAST on SOFIA reveal strong connections between stellar pulsations and the dust and molecular chemistry in their circumstellar shells. A sharp boundary in overall dust content, which predominantly measures the amount of amorphous carbon, separates the semi-regular and Mira variables, with the semi-regulars showing little dust in their spectra and the Miras showing more. In semi-regulars, the contribution from SiC dust increases rapidly as the overall dust content grows, but in Miras, the SiC dust feature grows weaker as more dust is added. A similar dichotomy is found with the absorption band from CS at 7.3 m, which is generally limited to semi-regular variables. Observationally, these differences make it straightforward to distinguish semi-regular and Mira variables spectroscopically without the need for long-term photometric observations or knowledge of their distances. The rapid onset of strong SiC emission in Galactic carbon stars in semi-regulars variables points to a different dust-condensation process before strong pulsations take over. The break in the production of amorphous carbon between semi-regulars and Miras seen in the Galactic sample is also evident in Magellanic carbon stars, linking strong pulsations in carbon stars to the strong mass-loss rates which will end their lives as stars across a wide range of metallicities.
1 Introduction
A fundamental problem in astrophysics is understanding how stars in the late stages of their evolution enrich galaxies with dust and freshly fused elements. It is currently uncertain what the relative contributions are from the most massive stars, which will explode as supernovae, creating new elements but likely destroying dust, compared to lower-mass stars (e.g., Micelotta et al., 2018; Dell’Agli et al., 2019; Nanni et al., 2019). Low- and intermediate-mass stars create dust grains in the cool outer layers of their atmospheres, and the radiation pressure on these grains then helps drive the mass-loss process (e.g., Höfner & Olofsson, 2018; Groenewegen & Sloan, 2018, and references therein). Dust serves as a readily observable tracer of the total mass loss, and it is easily measured in the outflows from evolved stars. Infrared surveys of the Large and Small Magellanic Clouds (LMC and SMC) have pointed to carbon stars as the dominant source of dust being pumped into the interstellar medium (ISM) by stars (e.g., Matsuura et al., 2009; Boyer et al., 2011).
A significant fraction of intermediate-mass stars may end their lives on the asymptotic giant branch (AGB) as carbon stars, due to the production of carbon in their interiors and its dredge-up to their surfaces. The AGB stars become carbon stars when their C/O ratios exceed unity. In these stars, free carbon remains after the formation of CO, leading to a carbon-rich, rather than oxygen-rich, gas and dust chemistry (e.g., Habing, 1996; Wallerstein & Knapp, 1998, and references therein). The Infrared Spectrograph (IRS; Houck et al., 2004) on the Spitzer Space Telescope (Werner et al., 2004) has been used to study carbon stars in the low-metallicity environments of the LMC (e.g., Zijlstra et al., 2006; Matsuura et al., 2006; Leisenring et al., 2008), the SMC (e.g., Sloan et al., 2006; Lagadec et al., 2007), and other Local Group galaxies (e.g., Matsuura et al., 2007; Sloan et al., 2012).
The key to those studies, particularly in the Magellanic Clouds, has been samples of sufficient size. The combined IRS programs used by Sloan et al. (2016) had 144 carbon stars in the LMC and 40 in the SMC. Their control sample for the much larger Milky Way, however, contained only 42 carbon stars. The Galactic sample was observed with the Short-Wavelength Spectrometer (SWS; de Graauw et al., 1996) on the Infrared Space Observatory (ISO; Kessler et al., 1996) and served as a valuable comparison sample for many of the studies of extragalactic carbon stars mentioned above. However, it is a selective and relatively small sample given the size of the Milky Way. While larger samples of infrared spectra were obtained with the Low-Resolution Spectrometer (LRS; Olnon et al., 1986) on the Infrared Astronomical Satellite (IRAS; Neugebauer et al., 1984), the shortest wavelength is 7.67 m, too red to measure important spectral diagnostics.
To improve the Galactic sample, we obtained 4.9–13.7 m spectra of Galactic carbon stars using the Faint Object infraRed CAmera for the SOFIA Telescope (FORCAST; Herter et al., 2012) on the Stratospheric Observatory for Infrared Astronomy (SOFIA; Young et al., 2012). Section 2 describes our source selection, observations, and data processing. The results are given in Section 3 and discussed in Section 4, including comparisons to the SWS sample and the Magellanic Cloud samples. Section 5 summarizes our findings. The Appendix details the changes to the procedures for extracting spectral features needed to avoid telluric contamination.
2 Source Selection and Observations
2.1 Source Selection
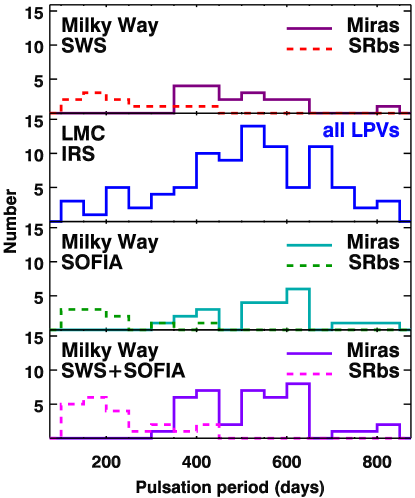
The Galactic sample from the SWS consists of observations from numerous individual projects and suffers from inevitable biases due to the various selection criteria used. In particular, the SWS sample has a deficit of semi-regular variables, which pulsate with weaker amplitudes than Miras. The SWS sample also selected against carbon stars with longer pulsation periods, especially 400 d, compared to the Magellanic samples (Fig. 1, top two panels). These sources are the most embedded objects with the most optically thick dust shells, and as noted above, they may dominate the dust returned to the ISM by stars.
To address the biases in the SWS data, we started with samples of Galactic carbon stars from Sloan et al. (1998), Jones et al. (1990), Nakashima et al. (2000), and Whitelock et al. (2006). Using their periods and the IRAS photometry, we selected sources in three groups. Group 1 has SRb variables with (12 m) 40 Jy; Group 2 contains Mira variables with 400 d 500 d and 60 Jy; and Group 3 consists of Miras with 550 d and Fν 150 Jy111The flux constraints were driven by the desire for short integration times and a reasonable sample size.. Our sample originally had 22 stars in Group 1, 8 in Group 2, and 13 in Group 3. Due to scheduling constraints that necessitated using back-up targets, as well as the nature of SOFIA Survey Programs, the observed sample consists of 11 Group 1 stars, 6 Group 2 stars, and 18 Group 3 stars, which yielded 33 usable spectra.
2.2 FORCAST Observations and Pipeline Processing
SOFIA observed the stars in service mode over the course of three cycles, Cycle 1 (2013, 4 stars, Plan ID=01_0041), Cycle 3 (2015, 10 stars, 03_0104), and Cycle 4 (2016, 21 stars, 04_0129). We used the two low-resolution grism settings in FORCAST, G063 and G111, to obtain spectra over the wavelength ranges 4.9–7.8 and 8.3–13.8 m, respectively Keller et al. (2010). The observations were made with the 47 slit, which results in a spectral resolution of R 120. The 31 stars from Cycles 3 and 4 were processed by the SOFIA Data Cycle System with pipeline version 1_2_0. Those from Cycle 1 were processed with pipeline version 1_0_0; they could not be re-processed due to changes in the observing configuration after Cycle 1. Two sources (CIT 6 and T Cnc) were discarded as their data were inconsistent both with previous observations and between the G063 and G111 spectra. Thus, our final sample consists of 33 stars. The bottom two panels in Figure 1 show our new SOFIA sample and the combined sample for the Milky Way.
| Star | RA | Dec | Obs. Date | Period | Period | ||
|---|---|---|---|---|---|---|---|
| Name | (J2000.0) | (yyyy-mm-dd) | (days) | (Jy) | Group | Ref. | |
| WZ Cas | 00 01 15.86 | +60 21 19.0 | 2016-09-21 | 186 | 44 | 1 | S98 |
| ST Cam | 04 51 13.35 | +68 10 07.6 | 2013-09-13 | 300 | 95 | 1 | S98 |
| Y Tau | 05 45 39.41 | +20 41 42.2 | 2016-09-22 | 242 | 144 | 1 | S98 |
| TU Gem | 06 10 53.10 | +26 00 53.4 | 2015-11-10 | 230 | 70 | 1 | S98 |
| UU Aur | 06 36 32.84 | +38 26 43.8 | 2013-09-13 | 234 | 232 | 1 | S98 |
| X Cnc | 08 55 22.88 | +17 13 52.6 | 2015-05-30 | 195 | 90 | 1 | S98 |
| T CncaaObservations problematic and not included in analysis. | 08 56 40.15 | +19 50 57.0 | 2015-06-05 | 482 | 61 | 1 | S98 |
| U Hya | 10 37 33.27 | 13 23 04.3 | 2015-06-03 | 450 | 206 | 1 | S98 |
| TW Oph | 17 29 43.66 | 19 28 22.9 | 2016-02-18 | 185 | 96 | 1 | S98 |
| RT Cap | 20 17 06.53 | 21 19 04.5 | 2016-07-14 | 393 | 73 | 1 | S98 |
| RV Cyg | 21 43 16.33 | +38 01 03.0 | 2015-05-30 | 263 | 103 | 1 | S98 |
| KY Cam | 03 27 59.03 | +60 44 55.2 | 2016-09-27 | 477: | 70 | 2 | N00 |
| V718 Tau | 04 31 21.93 | +17 39 10.3 | 2015-09-18 | 405 | 72 | 2 | S98 |
| R Lep | 04 59 36.35 | 14 48 22.5 | 2016-02-10 | 427 | 380 | 2 | S98 |
| CL Mon | 06 55 36.69 | +06 22 43.2 | 2015-11-06 | 497 | 113 | 2 | S98 |
| U Cyg | 20 19 36.59 | +47 53 39.1 | 2015-06-04 | 463 | 112 | 2 | S98 |
| AX Cep | 21 26 54.03 | +70 13 15.4 | 2016-09-21 | 395 | 72 | 2 | S98 |
| V668 Cas | 00 27 41.13 | +69 38 51.6 | 2016-09-20 | 650 | 306 | 3 | J90 |
| V370 Aur | 05 43 49.69 | +32 42 06.2 | 2016-02-05 | 780 | 196 | 3 | J90 |
| V1259 Ori | 06 04 00.05 | +07 25 52.0 | 2016-02-05 | 686 | 320 | 3 | J90 |
| CGCS 6276 | 08 09 20.26 | 36 24 26.8 | 2016-02-05 | 832 | 156 | 3 | W06 |
| V346 Pup | 08 10 48.89 | 32 52 05.6 | 2016-02-05 | 568 | 347 | 3 | W06 |
| CQ Pyx | 09 13 53.94 | 24 51 25.2 | 2016-02-05 | 659 | 737 | 3 | W06 |
| IRC +10216 | 09 47 57.41 | +13 16 43.6 | 2015-11-20 | 651 | 47530 | 3 | W06 |
| CGCS 2653 | 09 53 06.72 | 53 38 53.5 | 2016-07-12 | 630 | 157 | 3 | W06 |
| CIT 6aaObservations problematic and not included in analysis. | 10 16 02.28 | +30 34 19.0 | 2013-10-25 | 617 | 3319 | 3 | W06 |
| CGCS 2987 | 11 16 38.90 | 65 50 56.0 | 2016-07-18 | 623 | 181 | 3 | W06 |
| V1132 Cen | 12 42 09.58 | 43 55 02.9 | 2016-07-18 | 551 | 159 | 3 | W06 |
| CGCS 3311 | 12 57 15.79 | 69 01 51.5 | 2016-07-14 | 586 | 264 | 3 | W06 |
| V2548 Oph | 17 07 58.11 | 24 44 31.2 | 2016-02-18 | 747 | 793 | 3 | W06 |
| RAFGL 2154 | 18 26 39.48 | 06 54 03.6 | 2016-02-11 | 635 | 220 | 3 | W06 |
| CGCS 4014 | 18 27 34.22 | 08 37 23.4 | 2016-09-21 | 659 | 153 | 3 | W06 |
| V1420 Aql | 19 20 18.12 | 08 02 12.1 | 2013-09-19 | 694 | 384 | 3 | W06 |
| V1969 Cyg | 20 09 14.24 | +31 25 44.9 | 2015-11-20 | 550 | 173 | 3 | J90 |
| V384 Cep | 22 25 53.47 | +60 20 43.6 | 2016-09-21 | 698: | 182 | 3 | N00 |
2.3 Comparison Samples
The comparison sample for the Milky Way comes from the SWS archive of Sloan et al. (2003b), and carbon-rich sources were selected using the spectral classifications by Kraemer et al. (2002). We used the variability types and periods from the General Catalog of Variable Stars (GCVS; Samus’ et al., 2017) to assign 31 of the 42 sources to one of the three SOFIA-selection groups if possible222We dropped the flux criterion (Sec. 2.1). Also, periods for V Aql and Y CVn have been updated since Sloan et al. (2016) to 400 and 268 d, respectively.; two Miras with periods of 358 and 389 d were placed in Group 2. Of the 11 SWS sources that did not fit in these groups, 3 are SRa variables (2 of which have known periods), 4 were Lb variables (i.e., irregulars), and 4 have no variability type assigned in the GCVS.
We use the Magellanic Cloud sample from Sloan et al. (2016), who compiled and uniformly processed IRS observations of carbon stars from 11 Spitzer programs. Although the Magellanic sample does come from several separate programs, some of those projects were large surveys that attempted to sample a broad range of sources. Thus, the Magellanic sample, though not completely free of selection biases, is nonetheless less biased than the SWS sample.
As with the Galactic samples, we assign the Magellanic sources to one of the three groups, using variability types and periods from Soszyński et al. (2009, 2011) for the LMC and SMC, respectively. These are based on data from the Optical Gravitational Lensing Experiment (OGLE; Udalski et al., 1992). For the LMC, 55 of the 144 sources could be assigned a group, and for the SMC 32 of 40. We have left Magellanic Miras with periods below 395 d unassigned for better comparison with the Galactic sample. OGLE does not distinguish among different semi-regular categories. We have treated them as SRa or SRb depending on their position in period-luminosity space (see Sec. 4.4): 4 of the 13 SRs in the LMC sample are SRbs and 3 of the 12 SMC SRs are SRbs.
3 Results and Analysis
3.1 The Spectra
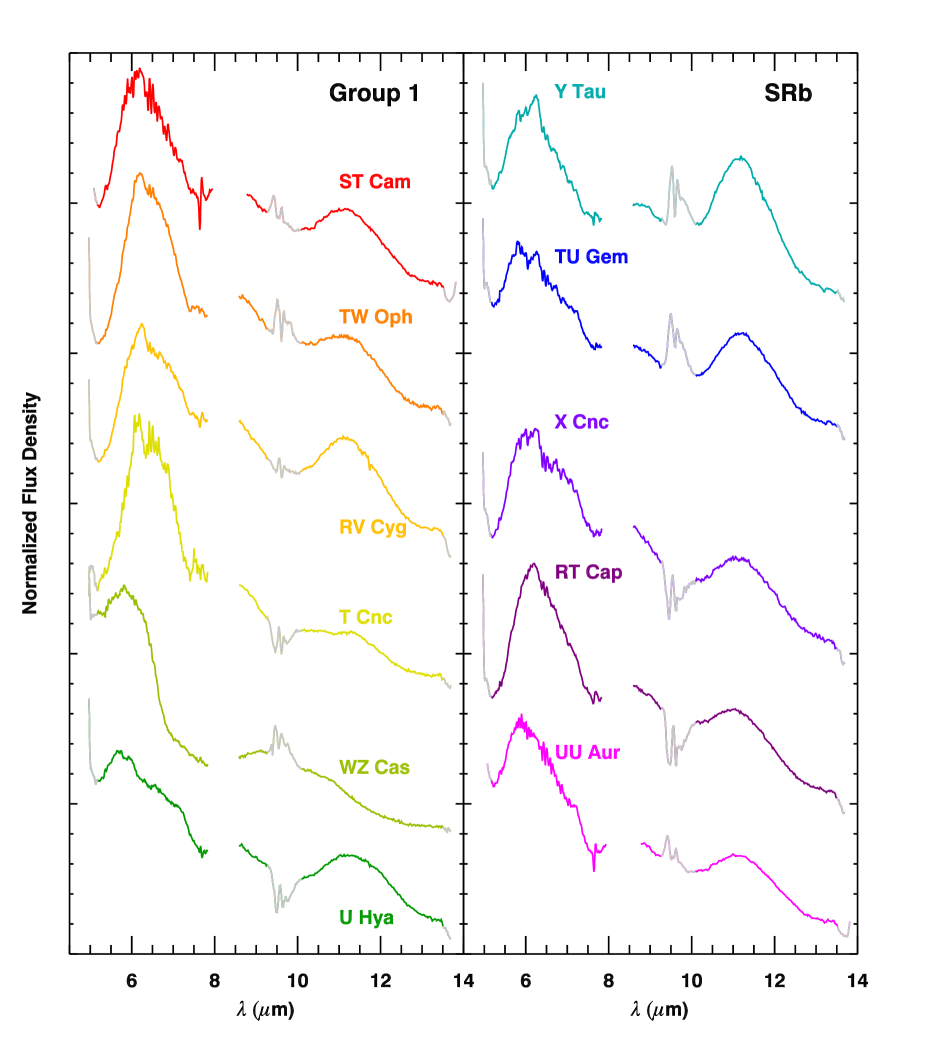
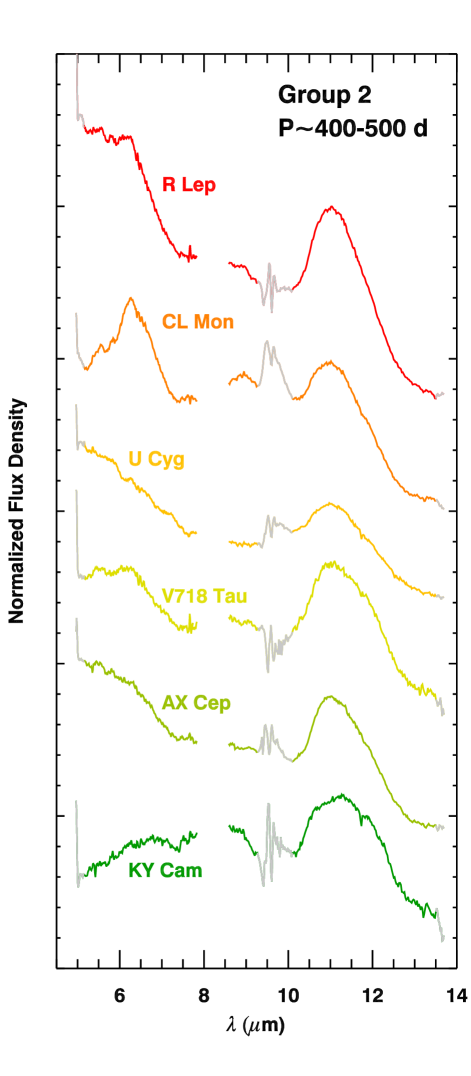
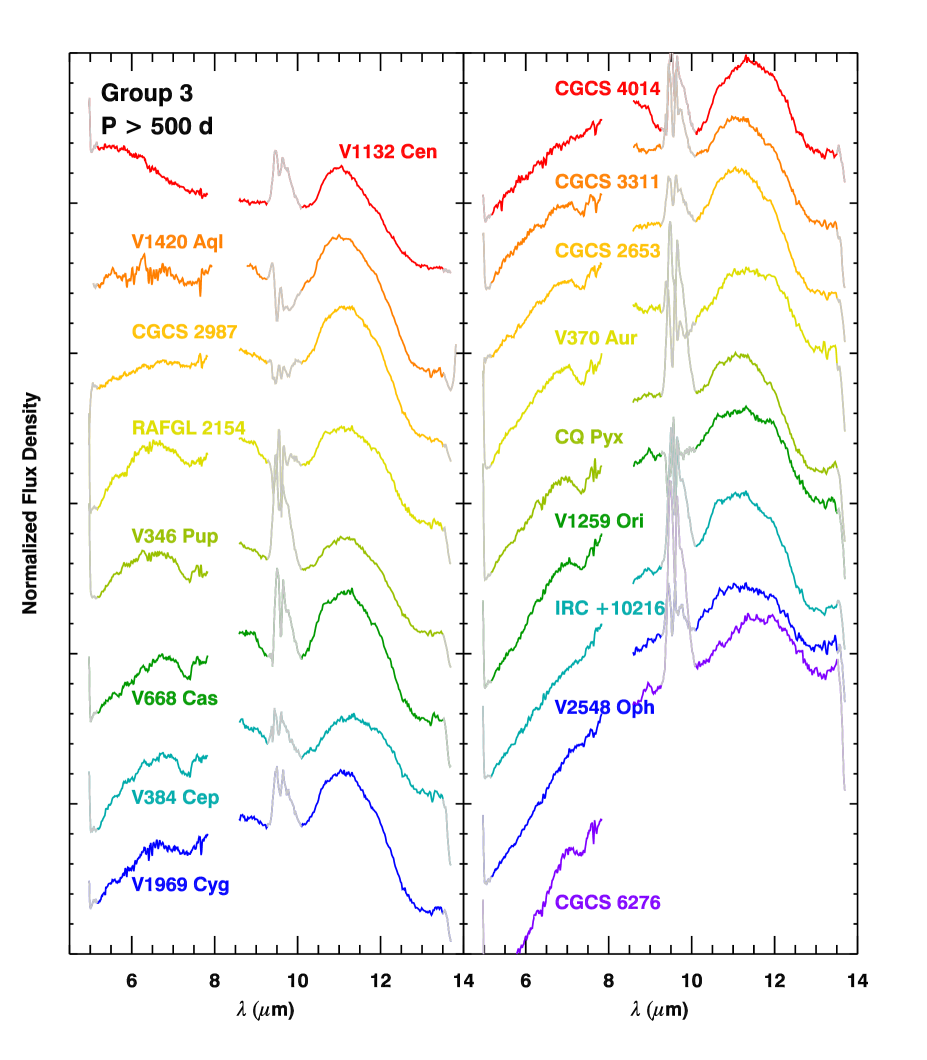
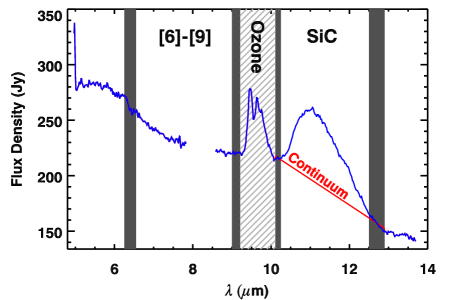
The new FORCAST spectra for most of the Galactic carbon stars are dominated by the SiC dust emission feature at 11 m in the G111 spectral range, while the G063 data show absorption features from carbonaceous molecules such as CO, C2H2 and CS. Figures 2–4 show the data for Groups 1–3, respectively. The wavelength range from 9.25 and 10.1 m, shown in gray, is contaminated by telluric ozone that was incompletely removed due to changes in the atmospheric absorption between observations of science and calibration targets. The range from 7.6 to 7.7 m can also show telluric contamination in some of the spectra (e.g., ST Cam). An instrumental artifact is present in some spectra, causing a spike below 5.2 m and a drop above 13.5 m333https://www.sofia.usra.edu/sites/default/files/Uspot_ DCS_DPS/Documents/Known_Issues_010518.pdf. These data are excluded from further analysis, so the C2H2 absorption feature at 13.7 m was not considered.
3.2 Spectral Feature Extraction
| Star | [6][9] | / | log | CE | |
|---|---|---|---|---|---|
| Name | (mag) | Continuum | (m) | (/yr) | Class |
| Group 1 | |||||
| WZ Cas | 0.069 0.015 | 0.021 0.005 | 11.98 0.18 | 8.79 | 1 |
| ST Cam | 0.180 0.010 | 0.187 0.009 | 11.30 0.07 | 8.61 | 1 |
| Y Tau | 0.287 0.014 | 0.368 0.004 | 11.25 0.01 | 8.44 | 1 |
| TU Gem | 0.281 0.010 | 0.266 0.004 | 11.29 0.02 | 8.45 | 1 |
| UU Aur | 0.228 0.008 | 0.153 0.010 | 11.29 0.09 | 8.54 | 1 |
| X Cnc | 0.269 0.012 | 0.192 0.003 | 11.28 0.02 | 8.47 | 1 |
| U Hya | 0.285 0.006 | 0.206 0.005 | 11.37 0.04 | 8.44 | 1 |
| TW Oph | 0.100 0.008 | 0.173 0.003 | 11.30 0.02 | 8.74 | 1 |
| RT Cap | 0.178 0.010 | 0.174 0.002 | 11.24 0.01 | 8.62 | 1 |
| RV Cyg | 0.252 0.010 | 0.233 0.003 | 11.28 0.02 | 8.50 | 1 |
| Group 2 | |||||
| KY Cam | 0.754 0.007 | 0.215 0.005 | 11.31 0.04 | 7.69 | 3 |
| V718 Tau | 0.500 0.007 | 0.363 0.007 | 11.27 0.03 | 8.10 | 2 |
| R Lep | 0.316 0.008 | 0.347 0.004 | 11.19 0.01 | 8.40 | 1 |
| CL Mon | 0.471 0.007 | 0.239 0.002 | 11.20 0.01 | 8.15 | 2 |
| U Cyg | 0.433 0.005 | 0.169 0.002 | 11.22 0.02 | 8.21 | 2 |
| AX Cep | 0.448 0.005 | 0.347 0.006 | 11.22 0.02 | 8.18 | 2 |
| Group 3 | |||||
| V668 Cas | 0.835 0.006 | 0.207 0.003 | 11.28 0.02 | 7.56 | 3 |
| V370 Aur | 1.054 0.003 | 0.115 0.004 | 11.42 0.06 | 7.21 | 4 |
| V1259 Ori | 1.263 0.006 | 0.104 0.003 | 11.37 0.05 | 6.88 | 5 |
| CGCS 6276 | 1.526 0.008 | 0.062 0.003 | 11.50 0.08 | 6.46 | 3 |
| V346 Pup | 0.765 0.004 | 0.161 0.003 | 11.34 0.03 | 7.68 | 3 |
| CQ Pyx | 1.139 0.004 | 0.130 0.003 | 11.33 0.03 | 7.08 | 4 |
| IRC +10216 | 1.265 0.006 | 0.146 0.003 | 11.31 0.03 | 6.88 | 5 |
| CGCS 2653 | 1.044 0.002 | 0.157 0.003 | 11.30 0.03 | 7.23 | 4 |
| CGCS 2987 | 0.794 0.002 | 0.200 0.004 | 11.31 0.03 | 7.63 | 3 |
| V1132 Cen | 0.577 0.005 | 0.200 0.002 | 11.21 0.02 | 7.98 | 2 |
| CGCS 3311 | 1.039 0.003 | 0.122 0.003 | 11.34 0.03 | 7.25 | 4 |
| V2548 Oph | 1.369 0.007 | 0.084 0.002 | 11.32 0.04 | 6.71 | 5 |
| RAFGL 2154 | 0.738 0.006 | 0.169 0.003 | 11.32 0.03 | 7.72 | 3 |
| CGCS 4014 | 0.916 0.006 | 0.177 0.004 | 11.36 0.04 | 7.43 | 3 |
| V1420 Aql | 0.740 0.007 | 0.212 0.011 | 11.30 0.08 | 7.72 | 3 |
| V1969 Cyg | 0.865 0.004 | 0.194 0.003 | 11.29 0.02 | 7.52 | 3 |
| V384 Cep | 0.871 0.004 | 0.116 0.003 | 11.40 0.04 | 7.51 | 3 |
Note. — Uncertainties are 1 and primarily reflect the observational noise in the spectra.
We use the Manchester system (Sloan et al., 2006; Zijlstra et al., 2006) to measure the [6][9] color and the strength of the silicon carbide dust feature (SiC) relative to the local continuum (Fig. 5). The [6][9] color measures the relative strengths of the star and the dominant dust component, amorphous carbon, which has an opacity that is a smooth function of wavelength with no known resonances (e.g., Jura, 1983, 1986; Martin & Rogers, 1987). The color serves as a proxy for the dust-production rate (Groenewegen et al., 2007) and is determined using two regions of the spectra which are free of molecular bands and solid-state features.
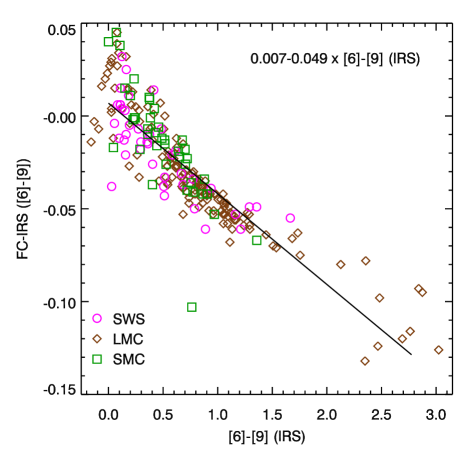
Due to residuals from the telluric ozone feature in the SOFIA spectra, the wavelengths used to define these features had to be adjusted compared to those used by Sloan et al. (2016). In order to compare apples to apples, we re-extracted the spectral features from the Magellanic (IRS) and Galactic (SWS) samples using the revised wavelength ranges. Appendix A gives the new values, along the updated wavelength ranges. Although the exact values for a given star have shifted slightly compared to Sloan et al. (2016), the overall characteristics of the samples remain the same. Thus, we will refer to the color as [6][9] for simplicity when comparing to values in the literature.
Table 2 gives the results for the [6][9] color and the relative SiC strength for the SOFIA sample. The parameter is the wavelength at which half of the flux in the SiC feature is to the red and half to the blue. The table includes the infrared spectral classification by Sloan et al. (2016), which is based on the [6][9] color and the dust production rate (DPR or ). is calculated from the [6][9] color, assuming an outflow velocity of 10 km s-1 according to the formula444Incorrect equations were given for the dust mass-loss rate by Sloan et al. (2008) and Sloan et al. (2012). The formula assumes optical constants from Rouleau & Martin (1991); using those from Zubko et al. (2004) would give different values.
| (1) |
We also can identify the presence of either C2H2 or CS absorption bands in many of the spectra between 7 and 7.6 m (rarely both at the same time). The C2H2 bands can be recognized by eye from the central peak of classic “W” shape at 7.5 m, while a “knee” in the spectra reveals the CS = 1 bandhead at 7.3 m. To characterize these absorption bands, we use a procedure similar to the Manchester method, with the blue end of the extraction set at 6.9 µm and the red end at 7.57 µm. These wavelengths cover only half of the C2H2 band, but they avoid the telluric residual at 7.6–7.7 µm and gap in coverage beyond 7.8 m. Thus, we determine a partial equivalent width, EWp, and the wavelength centroid for the partial band, . We stress that EWp and are used here only as diagnostics because they only cover part of the bands. We apply the same wavelength stops defined for the FORCAST data to the SWS data as well.
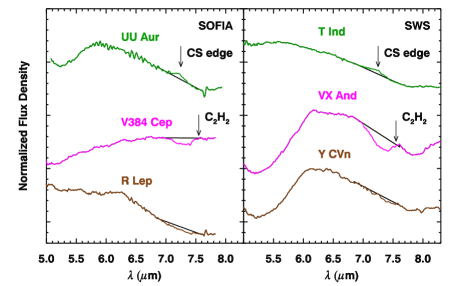
Figure 6 (left) shows examples of FORCAST spectra that have absorption either from CS or from C2H2, as well as a spectrum without a strong feature from either molecule (although absorption is clearly present in the general wavelength region). The right-hand panel shows similar spectra from the SWS sample, with the CS, and especially the C2H2 feature, more fully sampled. Many sources also show absorption below 6 µm, likely from CO and/or C3 (e.g., Jørgensen et al., 2000), but the limited wavelength coverage prevents further analysis with the FORCAST spectra here.
3.3 SiC Contrast and [6][9] Color
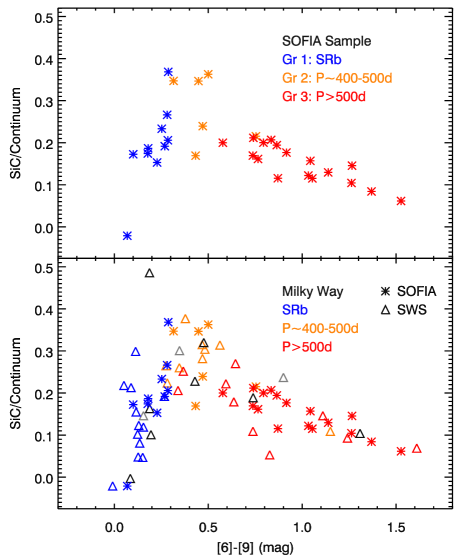
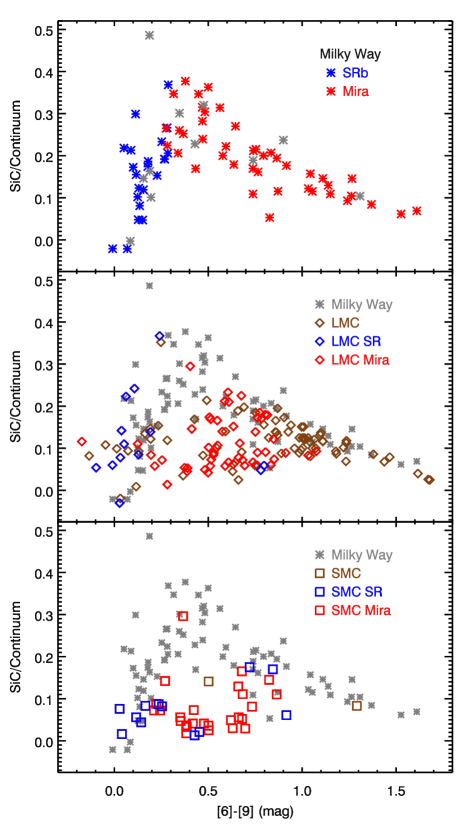
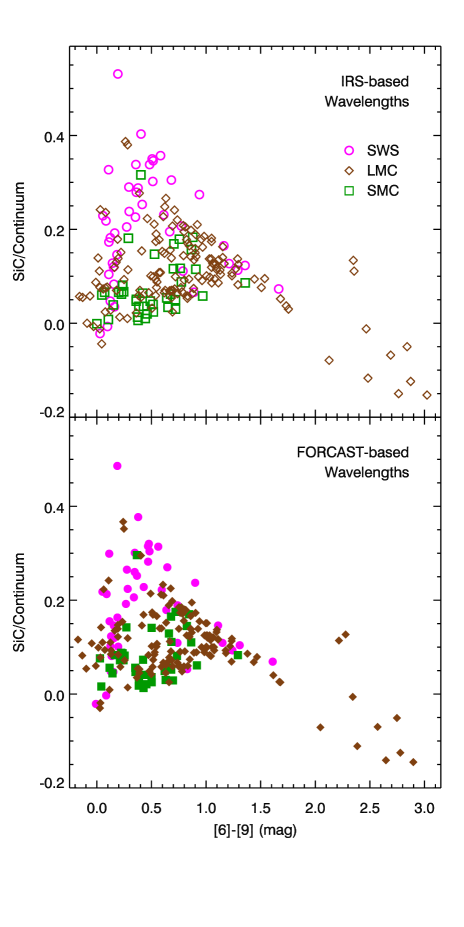
Figure 7 shows the ratio of the SiC dust feature to the continuum as a function of [6][9] color, which traces the amorphous carbon content, with the SOFIA sample in the top panel. A boundary at [6][9] 0.3 cleanly separates the SRb variables (Group 1) and Miras (Groups 2 and 3). In the SRbs to the blue of that boundary, the relative strength of the SiC dust feature rises steeply with increasing color, while in the Miras to the red, it decreases more gradually as the color grows redder, with the longer-period Miras associated with redder [6][9] colors.
The lower panel in Figure 7 adds the SWS sample of Galactic carbon stars, colored by group as with the SOFIA sample. The boundaries and differences in behavior of the SRbs and Miras remain unchanged.
Figure 8 compares the Galactic sample to those in the LMC and the SMC. In the lower two panels, sources not identified as semi-regular or Mira variables in the OGLE-III survey (Soszyński et al., 2009, 2011) appear as brown symbols, and the Galactic carbon stars are plotted in gray for comparison. (LMC sources with [6][9] 1.8 are omitted here for clarity but are included in the table in the appendix.)
For the LMC, all but two of the 13 semi-regulars in the OGLE catalogs are on the same steeply rising segment as the Galactic SRb variables. The LMC Miras are split between the segment with the Galactic Miras and a lower segment with weaker SiC/continuum ratios for the same [6][9] color. The two segments rejoin at [6][9] 1.1. The SMC sources generally follow the lower segment with weaker SiC/continuum ratios.
3.4 Molecular Gas Absorption
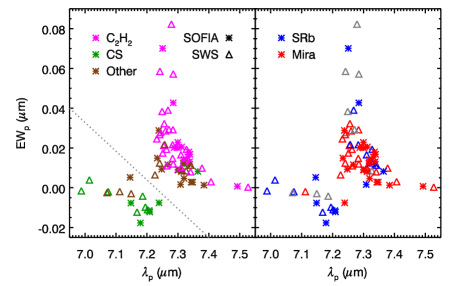
The G063 grism of FORCAST covers the 4.9–7.8 m range, which for carbon stars can include absorption bands from carbon-bearing molecules such as C2H2, HCN, CS, C3, and CO (e.g., Goebel et al., 1980, 1981; Aoki et al., 1998, 1999; Jørgensen et al., 2000; Speck et al., 2006, and references therein). The Galactic spectra typically show either C2H2 or CS absorption most prominently. Figure 9 plots the partial equivalent width of the absorption band (EWp) against the apparent centroid of that part of the band visible in the FORCAST spectra (). The figure also includes the SWS sample, with the spectra analyzed with the same wavelength stops as the FORCAST spectra. The majority of the CS sources are in the lower left quadrant, with 7.25 m and EWp 0.005. The C2H2 sources, in contrast, have 7.2 m and EWp 0, and generally lie in the upper right quadrant. As noted before by Zijlstra et al. (2006) and Matsuura et al. (2006), the Magellanic samples do not contain any sources with clear CS features. The vast majority would be in the upper right.
The right-hand panel of Figure 9 shows the same data but color-coded by the variability type. Almost all of the Miras are in the upper right region due to strong C2H2 bands. The SRbs are split between the CS and C2H2 regions. Table 3 summarizes the distribution of the bands between the Miras and SRbs for the Galactic sources.
| No. of Stars showing | |||
|---|---|---|---|
| C2H2 | CS | Other | |
| SRb | 6 (26%) | 12 (52%) | 5 (22%) |
| Mira | 27 (64%) | 1 (2%) | 14 (33%) |
4 Discussion
4.1 Molecular Gas
The Galactic carbon stars observed with the SWS and the FORCAST grisms show a distinct difference between Miras and semi-regular variables in their molecular gas features. While C2H2 dominates the molecular absorption in the Miras, CS dominates in about half of the SRb variables.
The Magellanic sample of carbon stars observed with the IRS do not show this dependence of molecular chemistry on variability type. Instead, C2H2 dominates the molecular absorption, with no CS bands apparent, no matter the variability type, as first noticed in the LMC by Zijlstra et al. (2006) and Matsuura et al. (2006).
Matsuura et al. (2006) suggested that the C2H2 band could mask the CS band in the Magellanic sample, but the bands occur at different wavelengths and the CS should be detectable if it were present. In addition, we would expect a continuous distribution of relative strengths in the two bands in the Galactic sample, but Figure 9 shows a bimodal distribution.
The lack of visible CS bands in the Magellanic spectra likely arises from differences in metallicity and lower abundances of sulfur. Metallicity differences can also explain the rising strength of the C2H2 bands from the Milky Way to the LMC to the SMC (e.g., van Loon et al., 1999; Matsuura et al., 2002; Sloan et al., 2006). The progressively lower oxygen abundances in the LMC and SMC lead to higher C/O ratios after dredge ups. This in turn produces stronger C2H2 bands, as noted previously for bands in the 5–8 m region and 14 m (e.g., Zijlstra et al., 2006; Sloan et al., 2006), and in the 3–4 m region (e.g., van Loon et al., 1999; Matsuura et al., 2002, 2005; van Loon et al., 2006).
The addition of the FORCAST spectra to the Galactic carbon star sample reveals that with a single exception555U Cyg, a Mira in Group 2, is the lone exception., CS only appears in the Galactic SRbs, and then only in some of them (Table 3). Thus, the presence of CS requires that the carbon star be (1) metal-rich and (2) pulsating as an SRb variable. However, only half of the semi-regular variables in the Galactic sample show CS bands, so these conditions are necessary, but not sufficient.
4.2 Dust and Metallicity
The differences in the behavior of the SiC dust emission as a function of [6][9] color between the Milky Way and Magellanic Clouds are readily apparent in Figure 8. Previous works, starting with Sloan et al. (2006) and Zijlstra et al. (2006), largely investigated these differences through the lens of metallicity. The metallicities in the Magellanic Clouds are typically in the range [Fe/H] 0.7 to 0.3 for the LMC (e.g., Piatti & Geisler, 2013) and [Fe/H] 1.5 to 0.5 in the SMC (e.g., Piatti, 2012; Rubele et al., 2015), and fall even lower for dwarf spheroidals in the Local Group (e.g., Sloan et al., 2012, and references therein). Differences in Si abundances could explain why the relative contribution of SiC dust builds only slowly as the dust increases in the SMC and other metal-poor galaxies in the Local Group, while in the Galaxy, it rises much more rapidly before the continued formation of amorphous carbon overwhelms it.
4.3 Dust and Variability Type
With the expanded Galactic sample, we can now revisit the dust properties in terms of the variability types. As already noted, a sharp color boundary separates the Galactic semi-regulars and Miras in Figure 7. The Magellanic samples observed with the IRS show a similar dichotomy, with only a handful of exceptions (Fig. 8).
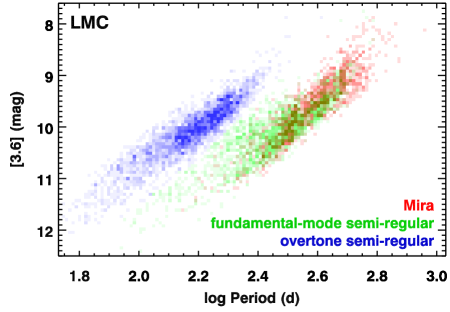
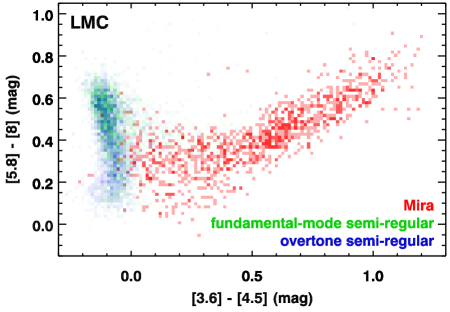
Figure 10 shows related behavior for a much larger photometric sample of carbon stars in the LMC from the OGLE-III survey (Soszyński et al., 2009). The top panel presents a period-luminosity diagram (P-L)666Pioneered by Leavitt & Pickering (1912). for the stars identified as carbon-rich Miras or semi-regular variables, with the semi-regulars color-coded according to whether they appear on the first overtone or the fundamental-mode sequence (e.g., Wood & Sebo, 1996; Wood et al., 1999; Fraser et al., 2005). The bottom panel uses the same color codes and maps the stars into color-color space using photometry from the Spitzer SAGE project (Meixner et al., 2006) and the WISE mission (Wright et al., 2010)777SAGE: Surveying Agents of Galaxy Evolution; WISE: Wide-field Infrared Survey Explorer.. The carbon stars in the SMC behave nearly identically (Sloan et al., 2015).
The color-color diagram reveals a clear dichotomy between the semi-regulars and Miras. The carbon stars identified in the OGLE-III survey as semi-regulars can pulsate in either an overtone or fundamental mode (Soszyński et al., 2009, 2013), and thus appear in two separate sequences in the P-L diagram. However, nearly all of them follow the same sequence in color-color space. The Mira variables follow a different sequence. Since amorphous carbon dominates the dust around carbon stars, adding more dust to a carbon star will redden it monotonically in all broadband near-infrared and mid-infrared colors, leading to a readily recognizable sequence in any color-color space (e.g., Sloan, 2017, Sloan et al. in press).
The [3.6][4.5] colors of the semi-regulars generally stay below 0, although they show a range of [5.8][8] colors. The relatively blue colors of the semi-regulars in all other infrared colors indicate that there is too little dust to explain their behavior in [5.8][8]. Sloan et al. (2015) argued that the C3 absorption band at 5 m is responsible for the observed behavior; other molecules, such as CO, should also affect the 5.8 m filter. In the dustier stars, the effect of any molecular absorption bands in this spectral region will diminish due to dust veiling.
The additional Galactic carbon stars observed with SOFIA have revealed a second dependence of dust characteristics on the variability type. The rapid rise of the relative strength of the SiC emission feature with increasing overall dust content is limited to the semi-regulars. Once a star begins pulsating in the fundamental mode as a Mira, the amorphous dust content climbs, pushing the [6][9] color beyond the boundary at 0.3. The relative strength of the SiC dust, however, turns over and diminishes.
4.4 Variability Type and Pulsation Mode
Comparison of the Galactic and Magellanic samples is hampered by differences in how their variability is classified. Pulsating giants in the Galaxy have been classified for several decades as Miras if their pulsation amplitude (peak to peak) exceeds 2.5 magnitudes at (e.g., Mattei et al., 1997; Samus’ et al., 2017)888Hoffmeister et al. (1984) noted that some observers use a limit of 2 magnitudes, and Payne-Gaposchkin & Gaposchkin (1938) quoted 1.5 magnitudes.. The semi-regular variables on the AGB have lower amplitudes. Those with fairly stable lightcurves are classified as SRa variables, while the SRbs are distinguished by more complex lightcurves that still show a discernible periodicity some of the time (e.g., Glasby, 1968; Hoffmeister et al., 1984).
The OGLE-III survey separated Miras from semi-regulars in the LMC at an amplitude of 0.8 magnitudes (Soszyński et al., 2009). Miras pulsate in the fundamental mode (Wood & Sebo, 1996). The OGLE-III survey did not subdivide the semi-regulars, though, unlike many studies of Galactic variables. Figure 10 shows that the dominant pulsation mode in semi-regulars can be either the fundamental mode or first overtone, as has been noted previously with shorter-wavelength data (e.g., Wood et al., 1999).
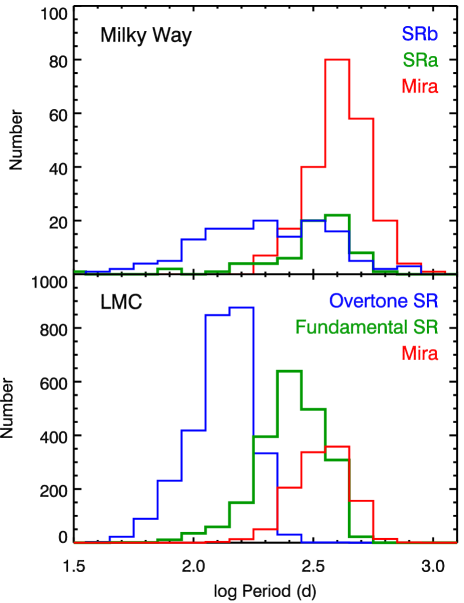
Thus, we have two groups of carbon-rich semi-regular variables in the LMC, and two in the Galaxy. The Galactic SRas have lightcurves with well-defined periodicities but weak amplitudes, making them the Galactic analogs of the fundamental-mode semi-regulars in the LMC. Similarly, Galactic SRbs are overtone pulsators. Using Gaia distances for carbon stars has proven challenging so far (e.g., McDonald et al., 2018), so placing the SRa and SRb variables on a P-L diagram is problematic.
We can still compare the periods, though. Figure 11 shows that the distribution of periods for the SRb, SRa, and Mira variables in the Galaxy behave very much like the overtone semi-regulars, fundamental-mode semi-regulars, and Miras in the LMC, respectively. For the Galactic sample, we cross-referenced the Catalog of Galactic Carbon Stars (3rd Ed.; Alksnis et al., 2001) with the General Catalog of Variable Stars (GCVS 5.1; Samus’ et al., 2017), matching sources within 10. The quantitative differences in the distributions likely arise from the differences in the initial mass limits for carbon stars in the LMC and Galaxy, which in turn limit the range of luminosities a star will show on the AGB999That is, the lowest mass carbon stars in the LMC remain oxygen-rich in the Galaxy.. The P-L relation ties these luminosities to the pulsation periods of the stars.
The qualitative conclusion remains clear: the first overtone dominates the pulsation of the SRb variables, while the fundamental mode has grown stronger in the SRa variables. Once the fundamental mode dominates all other modes and the amplitude grows strong enough, the star becomes a Mira variable.
4.5 Pulsation and Dust
We can now relate the differences in dust quantity and composition illustrated in Figures 7 and 8 with the pulsation mode of the central star. Stars with weak pulsations do not produce significant quantities of dust. Whether their pulsations are dominated by an overtone mode or the fundamental, if their amplitudes are less than 2.5 mag. in , their [6][9] colors remain below 0.3, always in the Galaxy and most of the time in the Magellanic Clouds. For most of the carbon-rich semi-regulars in the LMC and all in the Galaxy, a slight increase in total dust content is accompanied by a sharp increase in the amount of SiC dust. Once the fundamental pulsation mode dominates the star and its pulsation amplitude grows strong enough for it to be classified as a Mira, the total dust content takes off, and the relative strength of the SiC feature diminishes.
To rephrase, the key to significant dust production on the AGB is not just the pulsation mode, but also the pulsation amplitude of the central star (e.g., Mattsson et al., 2008; McDonald & Trabucchi, 2019). These strong pulsations are sufficient to push molecular gas far enough from the stellar photosphere so that amorphous carbon can condense in the quantities necessary for radiation pressure on the dust to drive significant mass loss (e.g., McDonald et al., 2018; McDonald & Trabucchi, 2019). The forming dust will incorporate much of the carbon-rich molecular gas in the outflows and veil the absorption from those that are left, which will weaken the molecular absorption as the dust content grows.
When overtone modes dominate the fundamental mode, the pulsation amplitude remains weak, and the star is unable to drive significant dust production or mass loss. In these cases, the [6][9] color is limited by the lack of overall dust, and the SiC dust emission feature is relatively strong.
The semi-regular variables on the fundamental-mode sequence may be of too low an initial mass to drive strong pulsations. Alternatively, they may have transitioned to this sequence too recently and have not yet had time for their pulsations to grow enough to trigger dust production. Thus, their dust properties often still look like the semi-regulars on the first overtone (SRbs) even though their pulsation periods and luminosities place them on the fundamental sequence with the Miras in the P-L diagrams.
4.6 Grain Scenarios
Lagadec et al. (2007) suggested that the two sequences of SiC versus total dust (Fig. 8) differ in part due to the metallicity dependence of the condensation temperatures of SiC and graphite. Building on this idea, Leisenring et al. (2008) proposed that carbon-rich dust grains could form in layers (e.g., Kozasa et al., 1996; Lorenz-Martins et al., 2001), and the upper sequence resulted from the initial condensation of SiC dust which forms first (e.g., McCabe, 1982; Ferrarotti & Gail, 2002; Dell’Agli et al., 2017; Nanni et al., 2019). These grains would then be covered by a layer of amorphous carbon, which progressively hides the SiC from the observer.
Another possibility should be considered. The SiC and amorphous carbon could form in separate populations of grains. In that case, the diminishing contribution of the SiC dust once stars start pulsating as Miras can be explained simply by the decreasing fraction of SiC dust as the condensation of amorphous carbon takes off. The relative abundances of carbon and silicon should make that result inevitable even without layering. As carbon is synthesized in the thermal pulses and silicon is not, the relative abundances become even more skewed as the star evolves and dredges up freshly fused carbon.
The infrared spectra provide no means of distinguishing whether the SiC and amorphous carbon grains are layered or form separately. In either scenario, the sharp boundary between the Miras and the semi-regulars at [6][9] 0.3 and the dramatic difference in the behavior of the relative strength of the SiC feature on either side of that boundary point to a clear difference in the dust-formation mechanism between the Miras and semi-regulars.
Croat et al. (2005) used isotopic abundances and the relative lack of s-process elements to show that SiC grains in meteorites condensed at an earlier stage in AGB evolution than other carbonaceous grains and under different conditions. Our finding that the SiC dust is produced predominantly by weakly pulsating carbon stars supports their conclusion. The different isotopic abundances in the SiC grains found by Croat et al. support the commonly assumed sequence of stars evolving from semi-regulars to Miras.
4.7 The Beginning of the End?
The end of a star’s life on the AGB must occur after it has lost a substantial fraction of its mass via a stellar wind driven by pulsation and radiation pressure on the condensing dust (e.g., Whitelock et al., 2003; McDonald et al., 2018; Bladh et al., 2019). The pulsations in the stellar interior can levitate material into the dust-formation zone, where the increased molecular and dust opacity allow the radiation to drive the wind (as first laid out by Jones et al., 1981, see also Höfner & Olofsson (2018) and references therein). What physical process triggers the pulsations which drive heavy mass loss, though, is still a matter of debate. For carbon stars, the C/O ratio is an important parameter in the wind properties, although a better description may be that the total amount of excess free carbon is the key property (e.g., Lagadec & Zijlstra, 2008; Sloan et al., 2012; Eriksson et al., 2014; Nanni et al., 2017; Bladh et al., 2019). That is, the trigger would be a dredge-up event that pushes the C/O ratio or the amount of free carbon over a critical threshold.
McDonald & Trabucchi (2019), though, found that a transition between segments of the first overtone sequence, indicated by a larger -band amplitude, was tied to significantly increased mass-loss. Here, the dramatic change we observe in dust and gas properties between the first-overtone semi-regulars and the fundamental-mode Miras suggest that the transition of a carbon star to a Mira variable also triggers a substantial increase in dust production and total mass loss. This increase will rapidly strip its envelope and end its life on the AGB (e.g., Mattsson et al., 2008; McDonald et al., 2018).
The relations between the pulsational behavior of carbon stars and the properties of the gas and dust around them raise questions about oxygen-rich AGB stars, where the dust is usually dominated by silicates. For these stars, an infrared spectroscopic study comparing the overall dust quantity between the Miras and semi-regulars analogous to what we have done in this paper has yet to be done. Differences in mineralogy have been found, though, and point to significantly different dust processing in the semi-regulars (e.g., Sloan et al., 1996, 2003a; Uttenthaler et al., 2019).
Recent radio observations have revealed details on molecular line profiles and expansion velocities in the outer shell around both carbon-rich and oxygen-rich stars (e.g., McDonald et al., 2018; Díaz-Luis et al., 2019; Massalkhi et al., 2019, McDonald et al. submitted). Díaz-Luis et al. (2019), for example, have recently found that some oxygen-rich semi-regulars have an unusual CO line profile inconsistent with spherical symmetry. This result needs to be confirmed in a larger sample, especially to confirm that it only appears in the oxygen-rich semi-regulars. Additional observations and archival studies in both the infrared and radio are needed to better understand the relation between the pulsation of the central star, its chemistry, and how it ejects its envelope, forms dust, and evolves off of the AGB.
5 Summary & Conclusions
We observed 33 Galactic carbon stars from 5 to 13.8 m with SOFIA’s FORCAST grisms. The sources were selected to expand the Galactic sample observed with the SWS on ISO and better align it with the Magellanic samples observed by the IRS on Spitzer. Using the Manchester system, we extracted the strengths of the dust features and equivalent widths for molecular gas absorption bands, with the wavelength ranges adjusted to avoid telluric features.
The new Galactic sample reveals multiple differences in the spectral properties between carbon-rich semi-regular and Mira variables. The semi-regulars in the sample include both SRb and SRa variables, in which the pulsations are dominated by the first overtone and fundamental mode, respectively. The Miras, also fundamental-mode pulsators, have much stronger pulsations than the SRas.
A [6][9] color of 0.3 cleanly separates the Miras from the semi-regulars. That color tracks the amount of amorphous carbon dust around the star and shows that the semi-regulars have little circumstellar dust compared to the Miras.
The strength of the SiC dust feature at 11.3 m rises sharply in the semi-regular variables. Once a star becomes a Mira, it begins to produce amorphous carbon dust in substantial quantities, and the SiC dust feature is masked as the overall dust content grows.
All of these differences between the semi-regulars and Miras support the argument that strong fundamental-mode pulsations are required for significant rates of dust-production in carbon stars. This statement holds for both the Galactic sample studied here and the Magellanic samples as well.
The 5–7.5 m portion of the spectra can show absorption bands from CS and C2H2, but the CS is nearly always absent among the Miras, while it is present in half of the semi-regulars. That is, CS only occurs in stars with weak pulsations, and then only in some of them. CS is not observed in Magellanic carbon stars regardless of their variability type; its presence must also require higher metallicity.
Lastly, for the Galactic sample, the clean separation of the Miras and semi-regulars in [6][9] color points to a simple means of distinguishing these types of carbon-rich variables. Single-epoch infrared photometry or spectra can quantify the amount of dust around these stars and that makes it possible to identify the Miras without measuring their pulsation amplitudes or periods, both of which require observations of long temporal baselines, or placing them on a period-luminosity diagram, which requires knowing their distances.
Appendix A Adjustments to Feature Extraction Wavelengths and Their Effects
The Manchester method works as follows. The continuum is determined at feature-free wavelengths by averaging the flux in small wavelength ranges. As noted in the main text, residuals from atmospheric ozone precludes the use of the same wavelength ranges that Sloan et al. (2016) used for their feature extraction for two of the four wavelengths. Specifically, the 9 m end of the [6][9] color has to be slightly bluer, and the short-wavelength end of the SiC feature has to be somewhat redder than the original set.
To determine the new locations, the ozone in the SOFIA data needs to be avoided, along with the SiC feature. We also ensure that the IRS data have enough data points to be valid, since those spectra are not as over-sampled as the SOFIA data are. The SWS data are at higher spectral resolution, and thus this is not an issue for them (the smallest number of data points in a given wavelength range is 71). This changes the color from [6.4][9.3] to [6.4][9.1]. The blue end of the SiC feature changes from 9.8 to 10.18 m. The [6.4] band and the red end of the SiC feature remain unchanged. Table 4 gives the original and new wavelengths ranges.
The features strengths for the SWS and IRS samples based on the new wavelength ranges are given in Tables 5 and 6, respectively. The values from the previous extractions (Sloan et al., 2016) are also given for comparison. Figure 12 shows the [6][9] vs. SiC/Continuum for the original ranges (top panel) and for the new ranges (bottom panel). It is evident that the two plots are qualitatively the same, even though some data points have shifted slightly. We conclude that the new ranges provide reliable results for the analysis in the main part of this work.
There are a few trends that should be noted. The [6][9] colors from the new range are slightly bluer than the original colors, and the magnitude of the difference is a function of the color. The strength of the SiC/Continuum is slightly smaller with the new ranges, although this difference is not nearly as tight a function of the strength as the color difference is. Figure 13 shows the differences as functions of the original values.
We fit a line to the difference in color as a function of color for (a) the SWS data, (b) the LMC IRS data, (c) the SMC IRS data, and (d) the full SWS + IRS dataset, the results of which are given in Table 7. These can be used to adjust the results for other datasets whose features were extracted using the original wavelength ranges.
| Range | ||
|---|---|---|
| Blue | Red | |
| [6][9] | ||
| Original | 6.25–6.55 µm | 9.10–9.50 µm |
| New | 6.25–6.55 µm | 9.00–9.21 µm |
| SiC/Continuum | ||
| Original | 9.50–10.10 µm | 12.50–12.90 µm |
| New | 10.11–10.25 µm | 12.50–12.90 µm |
| [6][9] (mag) | SiC/Continuum | |||
|---|---|---|---|---|
| Source | Revised | Original | Revised | Original |
| WZ Cas | -0.009 ±0.002 | 0.029 ±0.002 | -0.021 ±0.003 | -0.022 ±0.002 |
| VX And | 0.155 ±0.003 | 0.123 ±0.003 | 0.146 ±0.003 | 0.182 ±0.001 |
| HV Cas | 0.339 ±0.002 | 0.353 ±0.002 | 0.206 ±0.001 | 0.226 ±0.001 |
| R Scl | 0.266 ±0.002 | 0.273 ±0.002 | 0.192 ±0.001 | 0.205 ±0.001 |
Note. — This table is available in its entirety in machine-readable format. A portion is shown here for guidance regarding its form and content.
| [6][9] | SiC/Cont. | |||
|---|---|---|---|---|
| Source | Revised | Original | Revised | Original |
| MSX SMC 33 | 0.501 ±0.007 | 0.514 ±0.009 | 0.036 ±0.002 | 0.040 ±0.002 |
| MSX SMC 36 | 0.733 ±0.005 | 0.774 ±0.005 | 0.081 ±0.003 | 0.088 ±0.004 |
| MSX SMC 44 | 0.502 ±0.011 | 0.517 ±0.006 | 0.025 ±0.005 | 0.024 ±0.004 |
| MSX SMC 54 | 0.720 ±0.002 | 0.756 ±0.004 | 0.175 ±0.004 | 0.179 ±0.003 |
Note. — This table is available in its entirety in machine-readable format. A portion is shown here for guidance regarding its form and content.
| Sample | FORCAST IRS [6][9] | Nstars |
|---|---|---|
| SWS | = 0.003 (IRS [6][9]) | 42 |
| LMC | = 0.006 (IRS [6][9]) | 144 |
| SMC | = 0.025 (IRS [6][9]) | 40 |
| All | = 0.007 (IRS [6][9]) | 226 |
References
- Alksnis et al. (2001) Alksnis, A., Balklavs, A., Dzervitis, U., et al. 2001, Baltic Astronomy, 10, 1, doi: 10.1515/astro-2001-1-202
- Aoki et al. (1998) Aoki, W., Tsuji, T., & Ohnaka, K. 1998, A&A, 340, 222
- Aoki et al. (1999) —. 1999, A&A, 350, 945
- Bladh et al. (2019) Bladh, S., Eriksson, K., Marigo, P., Liljegren, S., & Aringer, B. 2019, A&A, 623, A119, doi: 10.1051/0004-6361/201834778
- Boyer et al. (2011) Boyer, M. L., Srinivasan, S., van Loon, J. T., et al. 2011, AJ, 142, 103, doi: 10.1088/0004-6256/142/4/103
- Croat et al. (2005) Croat, T. K., Stadermann, F. J., & Bernatowicz, T. J. 2005, The Astrophysical Journal, 631, 976, doi: 10.1086/432598
- de Graauw et al. (1996) de Graauw, T., Haser, L. N., Beintema, D. A., et al. 1996, A&A, 315, L49
- Dell’Agli et al. (2017) Dell’Agli, F., García-Hernández, D. A., Schneider, R., et al. 2017, Monthly Notices of the Royal Astronomical Society, 467, 4431, doi: 10.1093/mnras/stx387
- Dell’Agli et al. (2019) Dell’Agli, F., Valiante, R., Kamath, D., Ventura, P., & García-Hernández, D. A. 2019, MNRAS, 486, 4738, doi: 10.1093/mnras/stz1164
- Díaz-Luis et al. (2019) Díaz-Luis, J. J., Alcolea, J., Bujarrabal, V., et al. 2019, A&A, 629, A94, doi: 10.1051/0004-6361/201936087
- Eriksson et al. (2014) Eriksson, K., Nowotny, W., Höfner, S., Aringer, B., & Wachter, A. 2014, A&A, 566, A95, doi: 10.1051/0004-6361/201323241
- Ferrarotti & Gail (2002) Ferrarotti, A. S., & Gail, H. P. 2002, Astronomy and Astrophysics, 382, 256, doi: 10.1051/0004-6361:20011580
- Fraser et al. (2005) Fraser, O. J., Hawley, S. L., Cook, K. H., & Keller, S. C. 2005, AJ, 129, 768, doi: 10.1086/426749
- Glasby (1968) Glasby, J. S. 1968, Variable stars
- Goebel et al. (1981) Goebel, J. H., Bregman, J. D., Witteborn, F. C., Taylor, B. J., & Willner, S. P. 1981, ApJ, 246, 455, doi: 10.1086/158944
- Goebel et al. (1980) Goebel, J. H., Bregman, J. D., Goorvitch, D., et al. 1980, ApJ, 235, 104, doi: 10.1086/157615
- Groenewegen & Sloan (2018) Groenewegen, M. A. T., & Sloan, G. C. 2018, A&A, 609, A114, doi: 10.1051/0004-6361/201731089
- Groenewegen et al. (2007) Groenewegen, M. A. T., Wood, P. R., Sloan, G. C., et al. 2007, MNRAS, 376, 313, doi: 10.1111/j.1365-2966.2007.11428.x
- Habing (1996) Habing, H. J. 1996, A&A Rev., 7, 97, doi: 10.1007/PL00013287
- Herter et al. (2012) Herter, T. L., Adams, J. D., Buizer, J. M. D., et al. 2012, The Astrophysical Journal Letters, 749, L18. http://stacks.iop.org/2041-8205/749/i=2/a=L18
- Hoffmeister et al. (1984) Hoffmeister, C., Richter, G., & Wenzel, W. 1984, Veraenderliche Sterne
- Höfner & Olofsson (2018) Höfner, S., & Olofsson, H. 2018, A&A Rev., 26, 1, doi: 10.1007/s00159-017-0106-5
- Houck et al. (2004) Houck, J. R., Roellig, T. L., van Cleve, J., et al. 2004, ApJS, 154, 18, doi: 10.1086/423134
- Jones et al. (1990) Jones, T. J., Bryja, C. O., Gehrz, R. D., et al. 1990, ApJS, 74, 785, doi: 10.1086/191518
- Jones et al. (1981) Jones, T. W., Ney, E. P., & Stein, W. A. 1981, ApJ, 250, 324, doi: 10.1086/159378
- Jørgensen et al. (2000) Jørgensen, U. G., Hron, J., & Loidl, R. 2000, A&A, 356, 253
- Jura (1983) Jura, M. 1983, ApJ, 267, 647, doi: 10.1086/160901
- Jura (1986) —. 1986, ApJ, 303, 327, doi: 10.1086/164077
- Keller et al. (2010) Keller, L., Deen, C. P., Jaffe, D. T., et al. 2010, in Society of Photo-Optical Instrumentation Engineers (SPIE) Conference Series, Vol. 7735, Proc. SPIE, 77356N, doi: 10.1117/12.857127
- Kessler et al. (1996) Kessler, M. F., Steinz, J. A., Anderegg, M. E., et al. 1996, A&A, 315, L27
- Kholopov et al. (1992) Kholopov, P. N., Samus, N. N., Durlevich, O. V., et al. 1992, Bulletin d’Information du Centre de Donnees Stellaires, 40, 15
- Kozasa et al. (1996) Kozasa, T., Dorschner, J., Henning, T., & Stognienko, R. 1996, Astronomy and Astrophysics, 307, 551
- Kraemer et al. (2002) Kraemer, K. E., Sloan, G. C., Price, S. D., & Walker, H. J. 2002, ApJS, 140, 389, doi: 10.1086/339708
- Lagadec & Zijlstra (2008) Lagadec, E., & Zijlstra, A. A. 2008, MNRAS, 390, L59, doi: 10.1111/j.1745-3933.2008.00535.x
- Lagadec et al. (2007) Lagadec, E., Zijlstra, A. A., Sloan, G. C., et al. 2007, MNRAS, 376, 1270, doi: 10.1111/j.1365-2966.2007.11517.x
- Leavitt & Pickering (1912) Leavitt, H. S., & Pickering, E. C. 1912, Harvard College Observatory Circular, 173, 1
- Leisenring et al. (2008) Leisenring, J. M., Kemper, F., & Sloan, G. C. 2008, ApJ, 681, 1557, doi: 10.1086/588378
- Lorenz-Martins et al. (2001) Lorenz-Martins, S., de Araújo, F. X., Codina Land aberry, S. J., de Almeida, W. G., & de Nader, R. V. 2001, Astronomy and Astrophysics, 367, 189, doi: 10.1051/0004-6361:20000411
- Martin & Rogers (1987) Martin, P. G., & Rogers, C. 1987, The Astrophysical Journal, 322, 374, doi: 10.1086/165736
- Massalkhi et al. (2019) Massalkhi, S., Agúndez, M., & Cernicharo, J. 2019, A&A, 628, A62, doi: 10.1051/0004-6361/201935069
- Matsuura et al. (2002) Matsuura, M., Zijlstra, A. A., van Loon, J. T., et al. 2002, The Astrophysical Journal, 580, L133, doi: 10.1086/345680
- Matsuura et al. (2005) —. 2005, A&A, 434, 691, doi: 10.1051/0004-6361:20042305
- Matsuura et al. (2006) Matsuura, M., Wood, P. R., Sloan, G. C., et al. 2006, MNRAS, 371, 415, doi: 10.1111/j.1365-2966.2006.10664.x
- Matsuura et al. (2007) Matsuura, M., Zijlstra, A. A., Bernard-Salas, J., et al. 2007, MNRAS, 382, 1889, doi: 10.1111/j.1365-2966.2007.12501.x
- Matsuura et al. (2009) Matsuura, M., Barlow, M. J., Zijlstra, A. A., et al. 2009, MNRAS, 396, 918, doi: 10.1111/j.1365-2966.2009.14743.x
- Mattei et al. (1997) Mattei, J. A., Foster, G., Hurwitz, L. A., et al. 1997, in ESA Special Publication, Vol. 402, Hipparcos - Venice ’97, ed. R. M. Bonnet, E. Høg, P. L. Bernacca, L. Emiliani, A. Blaauw, C. Turon, J. Kovalevsky, L. Lindegren, H. Hassan, M. Bouffard, B. Strim, D. Heger, M. A. C. Perryman, & L. Woltjer, 269–274
- Mattsson et al. (2008) Mattsson, L., Wahlin, R., Höfner, S., & Eriksson, K. 2008, A&A, 484, L5, doi: 10.1051/0004-6361:200809689
- McCabe (1982) McCabe, E. M. 1982, Monthly Notices of the Royal Astronomical Society, 200, 71, doi: 10.1093/mnras/200.1.71
- McDonald et al. (2018) McDonald, I., De Beck, E., Zijlstra, A. A., & Lagadec, E. 2018, MNRAS, 481, 4984, doi: 10.1093/mnras/sty2607
- McDonald & Trabucchi (2019) McDonald, I., & Trabucchi, M. 2019, MNRAS, 484, 4678, doi: 10.1093/mnras/stz324
- Meixner et al. (2006) Meixner, M., Gordon, K. D., Indebetouw, R., et al. 2006, AJ, 132, 2268, doi: 10.1086/508185
- Micelotta et al. (2018) Micelotta, E. R., Matsuura, M., & Sarangi, A. 2018, Space Sci. Rev., 214, 53, doi: 10.1007/s11214-018-0484-7
- Nakashima et al. (2000) Nakashima, J.-i., Jiang, B. W., Deguchi, S., Sadakane, K., & Nakada, Y. 2000, Publications of the Astronomical Society of Japan, 52, 275, doi: 10.1093/pasj/52.2.275
- Nanni et al. (2019) Nanni, A., Groenewegen, M. A. T., Aringer, B., et al. 2019, MNRAS, 487, 502, doi: 10.1093/mnras/stz1255
- Nanni et al. (2017) Nanni, A., Marigo, P., Groenewegen, M. A. T., et al. 2017, Mem. Soc. Astron. Italiana, 88, 393
- Neugebauer et al. (1984) Neugebauer, G., Habing, H. J., van Duinen, R., et al. 1984, ApJ, 278, L1, doi: 10.1086/184209
- Olnon et al. (1986) Olnon, F. M., Raimond, E., Neugebauer, G., et al. 1986, A&AS, 65, 607
- Payne-Gaposchkin & Gaposchkin (1938) Payne-Gaposchkin, C., & Gaposchkin, S. 1938, Variable stars, Vol. 5
- Piatti (2012) Piatti, A. E. 2012, Monthly Notices of the Royal Astronomical Society, 422, 1109, doi: 10.1111/j.1365-2966.2012.20684.x
- Piatti & Geisler (2013) Piatti, A. E., & Geisler, D. 2013, The Astronomical Journal, 145, 17, doi: 10.1088/0004-6256/145/1/17
- Rouleau & Martin (1991) Rouleau, F., & Martin, P. G. 1991, ApJ, 377, 526, doi: 10.1086/170382
- Rubele et al. (2015) Rubele, S., Girardi, L., Kerber, L., et al. 2015, MNRAS, 449, 639, doi: 10.1093/mnras/stv141
- Samus’ et al. (2017) Samus’, N. N., Kazarovets, E. V., Durlevich, O. V., Kireeva, N. N., & Pastukhova, E. N. 2017, Astronomy Reports, 61, 80, doi: 10.1134/S1063772917010085
- Sloan (2017) Sloan, G. C. 2017, in IAU Symposium, Vol. 323, Planetary Nebulae: Multi-Wavelength Probes of Stellar and Galactic Evolution, ed. X. Liu, L. Stanghellini, & A. Karakas, 121–127, doi: 10.1017/S1743921317002034
- Sloan et al. (2003a) Sloan, G. C., Kraemer, K. E., Goebel, J. H., & Price, S. D. 2003a, ApJ, 594, 483, doi: 10.1086/376857
- Sloan et al. (2006) Sloan, G. C., Kraemer, K. E., Matsuura, M., et al. 2006, ApJ, 645, 1118, doi: 10.1086/504516
- Sloan et al. (2003b) Sloan, G. C., Kraemer, K. E., Price, S. D., & Shipman, R. F. 2003b, ApJS, 147, 379, doi: 10.1086/375443
- Sloan et al. (2008) Sloan, G. C., Kraemer, K. E., Wood, P. R., et al. 2008, ApJ, 686, 1056, doi: 10.1086/591437
- Sloan et al. (2015) Sloan, G. C., Lagadec, E., Kraemer, K. E., et al. 2015, in Astronomical Society of the Pacific Conference Series, Vol. 497, Why Galaxies Care about AGB Stars III: A Closer Look in Space and Time, ed. F. Kerschbaum, R. F. Wing, & J. Hron, 429. https://arxiv.org/abs/1412.1845
- Sloan et al. (1996) Sloan, G. C., Levan, P. D., & Little-Marenin, I. R. 1996, ApJ, 463, 310, doi: 10.1086/177243
- Sloan et al. (1998) Sloan, G. C., Little-Marenin, I. R., & Price, S. D. 1998, AJ, 115, 809, doi: 10.1086/300205
- Sloan et al. (2012) Sloan, G. C., Matsuura, M., Lagadec, E., et al. 2012, ApJ, 752, 140, doi: 10.1088/0004-637X/752/2/140
- Sloan et al. (2016) Sloan, G. C., Kraemer, K. E., McDonald, I., et al. 2016, ApJ, 826, 44, doi: 10.3847/0004-637X/826/1/44
- Soszyński et al. (2013) Soszyński, I., Wood, P. R., & Udalski, A. 2013, ApJ, 779, 167, doi: 10.1088/0004-637X/779/2/167
- Soszyński et al. (2009) Soszyński, I., Udalski, A., Szymański, M. K., et al. 2009, Acta Astron., 59, 239. https://arxiv.org/abs/0910.1354
- Soszyński et al. (2011) —. 2011, Acta Astron., 61, 217. https://arxiv.org/abs/1109.1143
- Speck et al. (2006) Speck, A. K., Cami, J., Markwick-Kemper, C., et al. 2006, ApJ, 650, 892, doi: 10.1086/507178
- Udalski et al. (1992) Udalski, A., Szymanski, M., Kaluzny, J., Kubiak, M., & Mateo, M. 1992, Acta Astron., 42, 253
- Uttenthaler et al. (2019) Uttenthaler, S., McDonald, I., Bernhard, K., Cristallo, S., & Gobrecht, D. 2019, A&A, 622, A120, doi: 10.1051/0004-6361/201833794
- van Loon et al. (2006) van Loon, J. T., Marshall, J. R., Cohen, M., et al. 2006, Astronomy and Astrophysics, 447, 971, doi: 10.1051/0004-6361:20054222
- van Loon et al. (1999) van Loon, J. T., Zijlstra, A. A., & Groenewegen, M. A. T. 1999, Astronomy and Astrophysics, 346, 805. https://arxiv.org/abs/astro-ph/9902284
- Wallerstein & Knapp (1998) Wallerstein, G., & Knapp, G. R. 1998, ARA&A, 36, 369, doi: 10.1146/annurev.astro.36.1.369
- Werner et al. (2004) Werner, M. W., Roellig, T. L., Low, F. J., et al. 2004, ApJS, 154, 1, doi: 10.1086/422992
- Whitelock et al. (2006) Whitelock, P. A., Feast, M. W., Marang, F., & Groenewegen, M. A. T. 2006, MNRAS, 369, 751, doi: 10.1111/j.1365-2966.2006.10322.x
- Whitelock et al. (2003) Whitelock, P. A., Feast, M. W., van Loon, J. T., & Zijlstra, A. A. 2003, MNRAS, 342, 86, doi: 10.1046/j.1365-8711.2003.06514.x
- Wood & Sebo (1996) Wood, P. R., & Sebo, K. M. 1996, MNRAS, 282, 958
- Wood et al. (1999) Wood, P. R., Alcock, C., Allsman, R. A., et al. 1999, in IAU Symposium, Vol. 191, Asymptotic Giant Branch Stars, ed. T. Le Bertre, A. Lebre, & C. Waelkens, 151
- Wright et al. (2010) Wright, E. L., Eisenhardt, P. R. M., Mainzer, A. K., et al. 2010, AJ, 140, 1868, doi: 10.1088/0004-6256/140/6/1868
- Young et al. (2012) Young, E. T., Becklin, E. E., Marcum, P. M., et al. 2012, The Astrophysical Journal Letters, 749, L17. http://stacks.iop.org/2041-8205/749/i=2/a=L17
- Zijlstra et al. (2006) Zijlstra, A. A., Matsuura, M., Wood, P. R., et al. 2006, MNRAS, 370, 1961, doi: 10.1111/j.1365-2966.2006.10623.x
- Zubko et al. (2004) Zubko, V., Dwek, E., & Arendt, R. G. 2004, ApJS, 152, 211, doi: 10.1086/382351