largesymbols"00 largesymbols"01
The Economics of Smart Contracts
Abstract.
Ethereum is a distributed blockchain that can execute smart contracts, which inter-communicate and perform transactions automatically. The execution of smart contracts is paid in the form of gas, which is a monetary unit used in the Ethereum blockchain. The Ethereum Virtual Machine (EVM) provides the metering capability for smart contract execution. Instruction costs vary depending on the instruction type and the approximate computational resources required to execute the instruction on the network. The cost of gas is adjusted using transaction fees to ensure adequate payment of the network.
In this work, we highlight the “real” economics of smart contracts. We show that the actual costs of executing smart contracts are disproportionate to the computational costs and that this gap is continuously widening. We show that the gas cost-model of the underlying EVM instruction-set is wrongly modeled. Specifically, the computational cost for the SLOAD instruction increases with the length of the blockchain. Our proposed performance model estimates gas usage and execution time of a smart contract at a given block-height. The new gas-cost model incorporates the block-height to eliminate irregularities in the Ethereum gas calculations. Our findings are based on extensive experiments over the entire history of the EVM blockchain.
1. Introduction
Ethereum is the largest blockchain with the ability to execute arbitrarily-expressive computations called smart contracts. A smart contract can capture complex business transactions involving various accounts by dispensing and accepting funds. Developers commonly write smart contracts in a high-level language (Various, 2019a, 2017, b) that is compiled to bytecode, deployed on the blockchain, and later executed on the distributed Ethereum Virtual Machine (EVM).
The business applications for smart contracts are manifold, including prediction markets, governance, investment organizations, crowdfunding, music distribution, and many others (Jack du Rose, 2017; Wieczner, 2017; CoinSchedule, 2019; Pilkington, 2016). Smart contracts have been receiving attention from economists, lawyers, the technology industry, and governments (Tapscott and Tapscott, 2016; R3 Consortium, 2019; Flood and Goodenough, 2015; United Kingdom Government Office for Science, 2016). Smart contracts perform transactions in Ethereum’s Ether cryptocurrency (ETH). In 2019, Ethereum has a market capitalization of (Etherscan, 2019b).
In Ethereum, a user issues transactions to a peer-to-peer (P2P) network of mutually distrusting nodes, which employ miners to collate submitted transactions into blocks. A consensus protocol determines the next block for execution on the network. Once a block is selected, each transaction in the block is processed. A transaction consists of smart contract executions, the possible transfer of Ether between accounts, and the writing of the side-effects to the shared global state on the blockchain. A miner in the P2P network is incentivized with (1) a block reward for producing the next block through the consensus protocol, and (2) transaction fees for executing the transactions of this block. Block rewards are minted and issued by the network as an incentive for miners to operate and secure the network. Transaction fees are paid by the users issuing transactions.
The Ethereum consensus protocol is currently in a transition-phase from proof-of-work (PoW (Jakobsson and Juels, 1999)) to proof-of-stake (PoS (Buterin and Griffith, 2017)), to eliminate the high computational cost incurred by PoW-mining (Stoll et al., 2019). With PoS, miners (then called validators111We use the term miner to refer to both PoW-miners and PoS-validators where the distinction is clear from context.) will deposit a minimum of to become partakers in the consensus mechanism. Miners are selected pseudo-randomly by the consensus protocol to produce blocks (2.0, 2019a). The block rewards from participation in the PoS consensus protocol resemble an annual interest rate on the staked deposit (Buterin et al., 2019). The projected PoS block rewards are considerably below current PoW rates, to cut the inflation from cryptocurrency minted to pay rewards (Ethereum, 2019a). In contrast, the transaction fees for block execution will carry over to the PoS consensus protocol. As with PoW, transaction fees will be paid to the miner who created the block (Buterin et al., 2019; 2.0, 2019b, a).
As soon as the much lighter PoS will have replaced Ethereum’s computationally intense PoW consensus protocol, the computations from smart contract execution will dominate the total runtime. Due to the reduced block rewards from PoS, transaction fees will become a significant source of income for miners. For the new PoS protocol, it will be critical whether
-
(1)
transaction fees are proportional to the computational costs (CPU costs, energy costs) that miners have to spend for executing smart contracts, and
-
(2)
the charged fees are adequate for the provided computational services from the users’ point of view.
In this paper, our focus is exclusively on transaction fees—the monetary value paid by Ethereum users to Ethereum miners for executing transactions on the blockchain. As outlined above, the cost model for transaction fees is oblivious to the consensus protocol, and our discussion thus applies to both the current (Pow) and upcoming (PoS) version of the Ethereum blockchain. Despite the value represented by block rewards, we argue that the cost model for transaction fees is important in itself, because (1) transactions constitute a major source of income in the upcoming PoS consensus protocol, and (2) an accurate cost model is crucial to secure the dependable and scalable operation of the Ethereum blockchain. In particular, the Ethereum blockchain already fell victim to denial-of-service (DoS) attacks that exploited under-priced operations in smart contracts to slow down the processing of blocks (Chen et al., 2017).
Computations on the Ethereum blockchain are metered in units of gas. Users specify upfront the GasLimit, which is the maximum amount of gas committed to the transaction. Transferring Ether between accounts consumes a minimum amount of units of gas. This amount increases with account creation and for the execution of a smart contract on the EVM. Each EVM instruction costs a certain amount of gas, as defined in the Ethereum Yellow Paper (Wood, 2014). During execution, the EVM meters the gas cost per executed instruction. If the gas usage exceeds the transaction’s GasLimit, the EVM will halt the transaction (but nevertheless charge the consumed gas to the user), which is a mechanism to prevent unbounded, potentially non-terminating computations and resource abuse over the network. The gas costs of transactions are charged to users in units of Ether. A transaction contains a GasPrice, which is the amount of Ether the user is willing to pay per unit of gas. The consumed units of gas times the GasPrice is the fee paid by the transaction. Users can set the GasPrice of a transaction deliberately higher to prioritize a transaction in the pool of submitted transactions. Because miners want to maximize revenue, transactions with a high GasPrice will be selected first for execution on the blockchain.
This work is an empirical investigation to find out the extent to which transaction fees match the costs spent by miners to execute transactions. For this purpose, we instrumented the Ethereum Parity client (Technologies, 2019) to obtain execution time and gas cost of each executed block. With the instrumented client, we processed the Ethereum blockchain from the genesis block up to Block (originally mined on 21/06/2019). This experiment was conducted on an Amazon AWS i3.2xlarge instance. The instance provides an NVMe SSD to facilitate low-latency database access and thus constitutes an obvious choice for a PoS-mining service on a rented Cloud node. To compare Ethereum and AWS fees, we converted transaction fees from Ether to USD based on historical Ethereum price data (Etherscan, 2019a).
The results of our investigation are depicted in Figure 1 (please note again that our focus is on transaction fees and thus neither PoW-mining hardware costs which will be eliminated with PoS, nor block rewards which will be diminished with PoS, are included in this diagram.) We observed a considerable disparity between the transaction fee paid by a user and the cost of the miner. From block to , the value of the Ether cryptocurrency was at its peak, and the sum of the transaction fees within this range was the equivalent of , whereas the actual cost of computation on AWS was less than . This huge gap would not close even if every single node in the entire Ethereum network would be paid transaction fees (e.g., on 09/30/2019 the Ethereum network contained nodes (Etherscan, 2019c), and the historically largest network-size the authors are aware of are nodes on 04/23/2018, as reported in (Kim et al., 2018)).
Another irregularity that surfaced in our experiments is the average execution time spent by a miner to earn one unit of gas throughout the entire blockchain. As depicted in Figure 2, the execution time per unit of gas has been steadily increasing after block . (The outliers between blocks and are due to the before-mentioned DoS attacks, which abused the gas pricing of certain EVM instructions to significantly slow down the processing of blocks (Chen et al., 2017).) The trend of increasing execution time per unit of gas puts miners at a disadvantage: to earn an equal amount of gas, miners need to use more computing power over time. Related findings have been recently reported in the Ethereum community, indicating that CPU resources are not properly aligned with gas costs (Swende, 2019).
We found that the Ethereum cost model does not accurately reflect the resource costs incurred by smart contracts. From an economic point of view, the cost per transaction should be proportional to the consumed gas. However, this is currently not the case. For certain EVM instructions, the cost model inaccurately predicts the resource consumption. In particular, we observed that the current cost model is unable to reflect fluctuations that are dependent on the block height (as suggested by Figure 2). Such inaccuracies make the Ethereum network susceptible to attacks that utilize a vast amount of resources for a small cost. A new wave of DoS attacks is one threat, as already voiced in the recent research literature (Perez and Livshits, 2019). Malicious compilers may exploit such inaccuracies in bytecode that disadvantages miners and other users who are unaware of the cost-model’s weakness. Computational costs that increase with the length of the blockchain will affect performance and scalability, as already articulated in the database community (Nathan et al., 2019; Amiri et al., 2019). Because a block reward in the PoW consensus protocol is significantly higher than the associated transaction fees, the cost model for transactions is currently less relevant to miners. However, once the PoW protocol and its associated block reward are replaced by the energy-efficient PoS protocol, transaction fees will become a more significant income source for miners. Hence, a transparent and accurate cost model is paramount for establishing a dependable, sustainable and secure economy in Ethereum. To establish such a cost model, this paper makes the following contributions:
-
(1)
We provide a measurement scheme to determine the key performance characteristics of smart contracts. Performance data is obtained and evaluated on both a macroscopic (functionality-based) and a microscopic (EVM instruction-level) view.
-
(2)
We obtain the performance profiling results from the Parity Ethereum client for the entire blocks of the Ethereum blockchain.
-
(3)
We provide evidence that the economics of the Ethereum gas cost model failed to reflect the actual computational costs.
-
(4)
We identify block-height as key for modeling the performance of smart contracts. We provide a performance model to estimate gas usage and execution time of a smart contract at a given block-height.
-
(5)
We propose a new gas cost model that fixes the main irregularity of the current Ethereum gas cost model, i.e., the ongoing inflation of execution time per unit of gas.
The rest of this paper is organized as follows. In Section 2, we present the software architecture and configuration options of the Parity Ethereum client. Our performance measurement scheme is introduced in Section 3. We discuss the data from our experimental evaluation in Section 4. In Section 5, we propose a new gas cost model based on our observations. We discuss the related work in Section 6 and draw our conclusions in Section 7.
2. Parity Software Architecture
Ethereum as a service has core responsibilities that clients are required to fulfill:
-
•
P2P networking: propagation of new transactions and blocks to other clients.
-
•
Block processing: checking the validity of a new block before executing the block’s transactions and committing changes to the database.
-
•
Shared global state (database) maintenance: storing the state trie which consists of all account balances, code that has been uploaded to the network (smart contracts), the current value of variables (storage slots) associated with each contract, and the blocks themselves.
Running an Ethereum client requires a connection to the Ethereum network to use Ethereum boot nodes and the Ethereum peer discovery mechanism. Processing of new blocks includes storing of balances, contract bytecode, contract variables, and the blocks themselves. For clients to maintain the state of the network, they must process every transaction starting from the genesis block, or otherwise download a previous state, i.e., a snapshot, and process every transaction after that point.
A range of clients have been developed for the Ethereum blockchain. The two most popular clients are Geth (Ethereum, 2019d) and Parity (Technologies, 2019), with a market share of % and %, respectively (Etherscan, 2019c). The Parity implementation employs the Rust programming language, whereas Geth is programmed in Go. Despite their different implementation languages, we found the software architecture of Parity and Geth to be virtually identical. We attribute this to the tight grip that the Ethereum specification exercises over client implementations. For this paper, we employ Parity, which has traditionally been known for its superior performance (Ethereum, 2018). In Section 4.4, we show that our measurement-method carries over one-to-one to the software architecture of Geth, modulo the renaming of functions.
2.1. Core Components of the Parity Ethereum Client
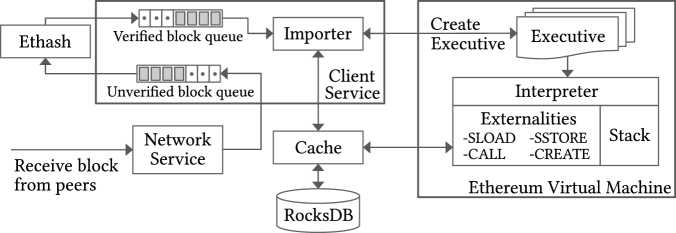
An overview of the software architecture of the Parity Ethereum client is depicted in Figure 3. Our analysis is based on Parity version 2.4.0 (page, 2019a).
Client Service
The Client Service is the core service and constitutes a major part of the system. It handles peer requests, processes new blocks received over the P2P network, and interacts with the database. The Client Service maintains an unverified and a verified block queue to process new blocks. The unverified block queue buffers new blocks as they are received over the network. After the check of signatures and block hashes, new blocks are moved to the verified block queue. Verified blocks are processed by the Importer, which will interact with the database and the EVM as required.
Ethash
Ethash verifies the block hashes and transaction signatures of the blocks from the Client Service’s unverified block queue. The block hash, a keccak256 hash (Bertoni et al., 2013), is verified against the difficulty set by the PoW consensus algorithm. Block verification requires the validation of ECSDA 256 bit transaction signatures. Valid blocks are queued for block-import in the verified block queue of the Client Service.
Ethereum Virtual Machine (EVM)
The purpose of the EVM is to facilitate smart contract execution on the Ethereum blockchain. Execution of a smart contract is often referred as state execution, because the computations of the smart contract represent a transition from the shared global state prior to contract execution to the shared global state after contract execution. Smart contracts are represented in the form of bytecode, which consists of opcodes such as ADD, POP, SLOAD, and operands222EVM bytecode is different from Java bytecode. A discussion on the differences is provided in (Grech et al., 2019).. Certain EVM opcodes require interaction with the database or other external resources, and these interactions are called externalities. The EVM uses volatile memory for its execution, including a stack and main memory. Each call to a smart contract will create a new EVM instance with its own stack/main memory and bytecode instructions, called an executive.
Database
Ethereum employs a state database to maintain states of accounts, transactions, and blocks. Clients are required to maintain a local copy of the shared global state. Parity uses RocksDB (Source, 2019) as its underlying key-value database backend.
The Ethereum state database employs key-value pairs in the format . Ethereum uses the recursive length prefix (RLP) encoding scheme (Ethereum, 2019c) to encode data of arbitrary length. Pairs are mapped to Merkel Patricia Tries (Ethereum, 2019b). Each node in a trie contains its value and the keys of its children (if child-nodes exist), i.e., . Lookups in the state-trie are not flat (unlike a key-value database): to look up the value of a given key, the byte-representation of the key is converted to a path (essentially the sequence of nibbles of the key’s byte-representation). To determine the trie’s value for a given path, the first element of the sequence is used as the index into the root of the trie (which determines the respective child-node). The second element indexes the child-node, also, until after lookups (in the general case) the value in the trie’s leaves is reached.
Trie nodes themselves are stored as tuples in the key-value database backend, i.e., RocksDB. The key of a node is the same as the node if its data-representation is less than wide, otherwise the hash value of the node becomes the key. Because hash values of nodes are used as references to the nodes, when there is a change in a node, its parent nodes must be updated to reflect the corrected hash values. This property guarantees deterministic hash values of root nodes, thus clients only need to know root hash values to validate or revert their state database.
Database Caches
There are three different types of caches used by the Parity client in addition to a memory overlay. (1) The database cache is the internal cache used by RocksDB and thus outside the control of the client. The default memory allocated is or 70% of the configured cache size. (2) The state cache is programmed by Parity to store details about information associated with an account address such as balance, contract bytecode, and storage slot values. The state cache is set to a default of or 20% of the configured cache size. (3) A blockchain cache is employed to store information about blocks such as the block header and transactions. The default size for the blockchain cache is or 10% of the configured cache size. The memory overlay is used by Parity around RocksDB to reduce the number of reads and writes. The memory overlay works by storing the values of a certain number of blocks (default: 64) or up to the given storage size (default: ) in memory.
Network Service
The Network Service propagates new blocks and transactions through the P2P network. The Network Service uses a discovery protocol to find new peers before establishing a TCP connection. Once a new block has been received, it is queued for verification in the unverified block queue of the Client Service.
2.2. Modes of Operations and Configurations
Modes
The purpose of a full node is to fulfill all the requirements of a client. A full node is required to process all new transactions and blocks. Subsequently, the full node propagates the new transactions to other nodes on the network. The role of a full node demands that it maintains the entirety of the shared global state. In contrast, a light node is a type of Ethereum client that does not store the entire state of the blockchain nor completely processes blocks/transactions. The purpose of a light client is to interact with full nodes on the network in order to push transactions or retrieve data only when required.
Pruning
The archive pruning mode stores the state of the blockchain at every block-height from genesis to present. It is generally not advisable for most users to run it as it dramatically increases space requirements. The typical users are blockchain explorers (websites that display information about the chain) and users wishing to do analysis on the state of the chain. OverlayRecent (fast) pruning separates blocks into ancient and recent with only a certain number of recent blocks being maintained. The difference is that recent blocks are stored in memory and flushed at the end of the recent period. This is the default setting for a client and the setting used in our analysis.
3. Measurement Methodology
We manually instrumented the Parity code with time measurement routines to measure the performance of particular sections of the code. Mutex locks were required in some components because of the multi-threaded nature of Parity. Attempts were made to ensure that the impact of the instrumentation on performance was kept to a minimum.
Parity Configuration
Unless otherwise specified, the Parity client was run with the default configuration, which includes a default cache of and further for pruning memory.
Importing Blocks from File
In our initial profiling runs, we configured Parity to use the P2P network for obtaining the block history (a profiling run essentially constitutes a re-play of the block history of a certain range of blocks). The obtained performance data showed variations of over 100% for the initial one million blocks (for otherwise identical profiling runs). These variances occurred due to bandwidth variations on the Internet, and from changes in the willingness of peers to send our client the history of blocks (exporting historical blocks to peers is a non-priority task with Ethereum clients). As a result, we stopped obtaining blocks from the P2P network in our experiments.
Instead, we obtained the entire history of blocks by running our own client from the genesis block until the head of the chain. From this client, we exported all blocks onto a local disk. Because of the potential bottleneck of disk I/O, we stored the exported blocks on a dedicated disk different from the disk that contained the Parity database, to minimize the performance impact of reading the blocks from disk.
Thus for all reported experimental results, block import was conducted from a local disk, to avoid network conditions to perturb the experiments.
Parallelism of Verification
As mentioned before, our profiling experiments were run post-facto on the block history, which implies that all blocks were available at all times. Although processing transactions is a serialized process, verifying blocks can be done in parallel. Parallel verification is less frequent for fully synced (online) clients, as one canonical block is produced approximately every . Hence, only one or a small number of blocks will be available for verification at any one time. The impact may increase the total number of blocks processed per second compared to if blocks were processed one at a time. However, because we aggregate time on a per-thread basis, the total amount of time spent verifying blocks and importing blocks is not affected by parallel block verification.
Limitations of Wall Clock Time
A limitation of the manual instrumentation is that it uses wall clock time to measure resource constraints. Wall clock time can be overstated as it does not account for threads being paused by the kernel nor time spent waiting for locks. Nevertheless, the hardware platform used for our experiments (see Table 1) contained a total number of cores to ensure that cores were not over-subscribed.
3.1. Macroscopic Instrumentation
Our macroscopic instrumentation examines Parity from a high-level view (on the level of functions and components) to determine where the bottlenecks occur with block processing.
Logging Infrastructure
The underlying logging infrastructure was implemented in C++ to minimize performance overhead from the instrumentation. Each log has a category, start time and stop time. Categories are used to segment the code into different functional parts such as EVM and Block Verification. The results of logs are stored as aggregate logs, which aggregate the duration (stop time - start time) for all logs in the same category. As some categories may run in parallel, a mutex lock was required to protect the aggregated values from race conditions. Each set of aggregate logs was archived every blocks. The aggregation window of blocks is large enough to minimize daily fluctuations without being too small to allow for granular analysis of trends.
Selection of Instrumentation Points
The logging infrastructure required start and stop functions to be called from within the Parity code. The points were chosen to analyze the main two categories of processing blocks, i.e., block verification and block import. Blocks can be verified in parallel. Importing, however is a serialized process because each transaction is dependent on the state of the previous transaction. As a result, there exists a mutex lock within Parity’s Importer. Within this lock, we inserted a range of timers to further dissect block imports.
Gas Analysis
The measurements of gas usage and general network statistics were taken by manually injecting code into the Parity client to aggregate metrics at a window-size of blocks. Performance data was obtained by exporting the initial 8 million blocks from our synced client. The blocks were then re-imported using the instrumented code. Measurements were only taken from blocks that were on Ethereum’s canonical chain.
3.2. Microscopic Instrumentation
Static and Dynamic Behavior of EVM
Our microscopic instrumentation of the Parity EVM interpreter was conducted to understand both static and dynamic behavior of smart contract execution. The static behavior of contract execution on EVM has to be identical for different invocations of contract code on the same state, whereas the dynamic behavior may differ across invocations. E.g., gas consumption and world state encoded as a trie are always identical across different client nodes on the network and are therefore considered as static behavior. The EVM consumes gas and it transitions between states by executing contracts. This state transition is the static behavior defined by the Ethereum consensus protocol. It guarantees the integrity of the smart contract execution over the network.
On the other hand, the performance of EVM and its underlying key-value database to store the state trie constitutes dynamic behavior. Dynamic behavior is expected to vary across machines, implementations, client modes and configurations. In the following section, we focus on gas (i.e., static behavior) and execution time (i.e., dynamic behavior).
Microscopic Instrumentation Granularity
We conducted the microscopic instrumentation on two levels of granularity: on the granularity of transactions and instructions. The Ethereum blockchain only encodes the GasLimit and the GasPrice (see Section 1) of a transaction. To obtain the gas usage of each transaction, we manually instrumented Parity. Gas usage and gas price of transactions are used in the calculation of the total amount of Ether paid for each transaction in Figure 1. With our measurement of gas usage of EVM instructions, we did not include the units of gas that Ethereum charges per transaction (the “intrinsic” gas). Rather, we measured the net gas usage of the EVM interpreter instructions. For instructions with non-constant gas cost functions, we measured all gas spent by the instructions except gas provided for message calls of CALL, CREATE, and their derivations. Gas and execution time of instructions are used in Section 5 to create our proposed gas cost model and to compare it to the existing gas cost model of Ethereum.
Low-level Synchronization Using Atomic Read-modify-write Operations
The microscopic and macroscopic instrumentations had to be deployed in separate profiling runs, because the logging infrastructure of the macroscopic instrumentation imposes a too high overhead for the fine-grained performance measurements of individual EVM instructions that we obtain from the microscopic instrumentation. For the aggregate counters of the microscopic instrumentation, we employed atomic read-modify-write operations (Boehm and Adve, 2008) to avoid the overhead of mutex locks. At transaction-level, the amount of consumed gas and the gas price of each transaction was measured and aggregated per block. At instruction-level, consumed gas, the execution time of each successful instruction, and instruction call counts were aggregated at a window-size of blocks.
4. Experimental Results
We perform large-scale experiments over the entire Ethereum blockchain in segments of one million blocks using both the macroscopic and the microscopic instrumentation. The macroscopic instrumentation is used to reveal the performance behavior of processing blocks, which has two major categories, i.e., verify and import. The microscopic instrumentation is used to analyze the fine-grained execution behavior of smart contracts. To validate the macroscopic and microscopic instrumentations, we compare their aggregated performance results against each other. For the experiment, we use the computer hardware depicted in Table 1.
| CPU | Model | Xeon E5-2699 v4 |
| Manufacturer | Intel | |
| Frequency | 2.2– | |
| Cores (sockets) | 44 (2) | |
| Disk | Type | SSD |
| Model | Optane 900P | |
| Manufacturer | Intel | |
| Interface | NVMe PCIe | |
| Size | ||
| RAM | Size | |
| Type | DDR4 | |
| Speed |
4.1. Block Processing
Block processing in the Parity client can be separated into two major categories, verify and import. The two key features of verification are the validation of transaction signatures and checking whether block hashes match the required difficulty. Block import involves the processing of all transactions within a block and updating the state trie of the database. For the block processing experiment, we measured the duration of the following tasks.
-
•
Total time: measured from the start of a segment until the end, with segment sizes of blocks.
-
•
Verify Block: verifying whether blocks are valid.
-
•
Import Blocks: the serialized part of importing blocks where all transactions are processed and the results written to the database.
-
•
Database commit (DB): a subset of Import Blocks; commits cached account changes to the database after executing a transaction.
-
•
Execute transaction (TX): a subset of Import Blocks that processes each transaction within the block.
-
•
EVM: a subset of Executing Transactions; a measure of time spent directly inside the interpreter excluding set-up time of an EVM instance.
Table 2 shows an aggregated overview of our experimental data. Values represent time in seconds and block ranges in millions.
| Blocks (M) | Total | Verify | Import | DB | TX | EVM |
|---|---|---|---|---|---|---|
| 0 – 1 | 708 | 4335 | 704 | 261 | 200 | 151 |
| 1 – 2 | 2453 | 6013 | 2448 | 1026 | 966 | 843 |
| 2 – 3 | 19535 | 6560 | 19529 | 4719 | 13651 | 10946 |
| 3 – 4 | 9518 | 10850 | 9512 | 4630 | 3558 | 2112 |
| 4 – 5 | 77038 | 36014 | 77032 | 28617 | 41453 | 25304 |
| 5 – 6 | 157658 | 38232 | 157650 | 54754 | 94014 | 65926 |
| 6 – 7 | 194231 | 30073 | 194224 | 61769 | 124277 | 96030 |
| 7 – 8 | 239668 | 35023 | 239662 | 72958 | 157525 | 127277 |
A significant trend to note is the relationship between total time and block-height, taking the time divided by the number of blocks processed yields time per block. The measurements in Figure 4 illustrate that the time per block increases as block-height increases, with outliers between blocks and . The outliers are due to the Shanghai DoS (Chen et al., 2017) attacks, which caused a substantial increase in execution time. Excluding the DoS attack period, the results loosely correlate the increasing time per block to gas per block ratio. As gas used per block increases, there is more strain on the client’s resources, including CPU time and disk I/O, thereby reducing block processing speeds. However, the fact that there is only a loose correlation hints at possible discrepancies between gas costs and execution times.
The verification time increases with block-height in a pattern almost identical to the number of transactions in a block as demonstrated in Figure 5. The cause of this relationship is heavily weighted on the number of ECDSA signatures that are processed in addition to verifying the block hash. Each transaction has a signature that is verified with elliptic curve multiplication operations in worst-case execution time. The validation of transaction signatures accounts for the majority of verification time. Hence, we see a tight coupling between the number of transactions and the verification time.
During the first blocks, the block-verify takes longer than block-import. However, the proportion of block-import increases at a far greater rate as the block-height increases. Figure 6 demonstrates the relationship between block-import and block-verify with respect to the block-height. As block-import is growing at a higher rate than block-verify, we analyzed block-import in more detail. The experiment for block-import is shown in Table 2, which implies that the proportion of block-import in total time is always almost 100%. Because block-import is a serialized process taking 100% of execution time, it can be concluded that it causes a performance bottleneck with block processing.
We further refined the analysis of block-import as shown in Figure 7. During the first blocks, there are large variations attributed to the immaturity of the network and the Shanghai DoS attack. As the network continues to mature, the block-import becomes more consistent with an increasing amount of time being spent inside the EVM, reaching over 50% at around block . This increase in EVM time justified the introduction of microscopic instrumentation for EVM instructions. However, there was still a significant amount of time spent in committing transactions to the database, which led to the performance analysis of caching.
The manual instrumentation was re-run with a cache-size set to . We cleared the cache every one million blocks. Table 3 represents the . The result of the enlarged cache shows that the total time is 81% faster. As the Parity client has caching at three levels, i.e., RocksDB, state, and blockchain, the results are relatively consistent between the categories of Import Blocks. The consistency between the categories implies there is a consistent portion of time spent on database operations.
| Blocks (M) | Total | Verify | Import | DB | TX | EVM |
|---|---|---|---|---|---|---|
| 0 – 1 | 105% | 100% | 106% | 108% | 118% | 123% |
| 1 – 2 | 112% | 99% | 112% | 122% | 121% | 120% |
| 2 – 3 | 241% | 101% | 241% | 142% | 413% | 597% |
| 3 – 4 | 130% | 108% | 130% | 118% | 215% | 182% |
| 4 – 5 | 185% | 100% | 185% | 165% | 250% | 214% |
| 5 – 6 | 230% | 97% | 230% | 237% | 267% | 231% |
| 6 – 7 | 177% | 97% | 177% | 204% | 179% | 163% |
| 7 – 8 | 162% | 100% | 162% | 192% | 160% | 150% |
| Overall | 181% | 99% | 181% | 195% | 193% | 175% |
4.2. Instruction-level Analysis of EVM Runtime
Figure 8 shows the percentage of execution time for the most time-consuming instructions. There was one irregularity when the Shanghai DoS attack occurred: For the Shanghai DoS attack, the execution time is dominated by EXTCODESIZE and SUICIDE instructions. Excluding that period, SLOAD appears as the most time-consuming instruction. More importantly, the proportion of time spent on SLOAD continues to increase after Block and exceeds 80% after Block .
| Blocks (M) | SLOAD | SSTORE | PUSH1 | MSTORE |
|---|---|---|---|---|
| 0 – 1 | 5738 | 3751 | 85.4 | 158.5 |
| 1 – 2 | 8367 | 5844 | 79.2 | 107.5 |
| 2 – 3 | 8254 | 7025 | 92.2 | 224.1 |
| 3 – 4 | 18893 | 9646 | 94.3 | 214.4 |
| 4 – 5 | 37951 | 8130 | 85.9 | 175.6 |
| 5 – 6 | 51847 | 11512 | 79.6 | 157.7 |
| 6 – 7 | 68499 | 18952 | 80.7 | 149.0 |
| 7 – 8 | 82265 | 21480 | 78.2 | 153.9 |
Table 4 illustrates the average execution times of four major instructions from Figure 8: SLOAD, SSTORE, PUSH1, and MSTORE. We observe that the average execution times of SLOAD and SSTORE significantly increase as the blockchain grows. Based on the fact that some instructions exhibit an increasing execution time as the block-height increases, we divided instructions into two groups: block-height dependent (BH-dependent) and block-height independent (BH-independent) instructions.
In this paper, we define an instruction as BH-dependent if it becomes slower when block-height increases, otherwise it is a BH-independent instruction. The correlation was calculated between block-height and average execution time of each instruction. The instructions SLOAD, SSTORE, and CALLCODE were found to be BH-dependent instructions due to their high positive correlation (larger than 0.7).
4.3. Correspondence Between Macroscopic and Microscopic Instrumentation
Although the instruction-level measurement is informative, the result may not match the measurements of the macroscopic instrumentation. There could be super- or sub-linear runtime dependencies between subsequent EVM instructions. In Figure 9, we calculated the relative difference between the time measurements of the microscopic and the macroscopic instrumentations. The relative difference is calculated as . In our experiment, the relative difference never exceeds 10%.
Differences are scattered in earlier blocks from 0 to , because these blocks contain only a minimal number of transactions. Hence, the total execution time is small and the measurement is impacted by measurement noise. After Block , the number of transactions drastically increases as shown in Figure 5, and the relative differences become smaller ranging between 2.5%.
By the central limit theorem (Billingsley, 2008), the measured relative differences should follow a normal distribution. We conducted a Chi-square goodness of fit test (Cochran, 1952) to check whether the data is normally distributed. The test resulted in with 17 degrees of freedom. Because the critical value is 27.59 when , the null hypothesis that the data follows a normal distribution is accepted and the measurement is valid.
4.4. Instrumentation Points in Parity and Geth
Parity and Geth are the most popular Ethereum clients, being employed by more than 90% of all Ethereum nodes in the world (Etherscan, 2019c).
| Parity v2.4.0 ethcore module | |
|---|---|
| Verify | verification::queue::VerificationQueue::verify |
| Import | client::Client::import_verified_blocks |
| DB | state::State::commit |
| TX | state::State::execute |
| EVM | evm::Interpreter::exec |
| Geth v1.9.6 core module | |
| Verify | BlockValidator.ValidateState |
| Import | BlockChain.insertChain |
| DB | state.StateDB.Finalise |
| TX | ApplyMessage |
| EVM | vm.run |
| Parity v2.4.0 ethcore module | |
|---|---|
| Message (CALL) | executive::Executive::call |
| Message (CREATE) | executive::Executive::create |
| EVM Execution | evm::Interpreter::exec |
| Instruction Verification | evm::Interpreter::step_inner |
| Instruction Execution | evm::Interpreter::exec_instruction |
| Geth v1.9.6 core module | |
| Message (CALL) | vm.EVM.Call |
| Message (CREATE) | vm.EVM.Create |
| EVM Execution | vm.run |
| Instruction Verification | vm.EVMInterpreter.Run |
| Instruction Execution | vm.operation.execute |
The software architecture of Geth is very similar to the software architecture of Parity. Tables 5 and 6 show the correspondence of functional blocks between the two clients. We believe that the strong overlap stems from the Ethereum specification that dictates the transition functions for verification and execution of blocks, transactions, and instructions in the EVM. Hence, our measurement methodology is not specialized for Parity, but can be applied to other Ethereum clients. We have very rudimentary data showing similar performance characteristics between Geth and Parity on the first five million blocks of the blockchain on the macroscopic level.
| 0– | 1– | 2– | 3– | 4– | |
|---|---|---|---|---|---|
| Parity (macro.) | 17 | 50 | 384 | 178 | 1500 |
| Geth (original) | 32 | 71 | 325 | 222 | 1381 |
5. A Sustainable EVM Gas Cost Model
In the previous section we showed that the execution time of block-import increases with the block-height, and that the EVM takes the largest proportion of block-import in terms of runtime. However, it is not possible to deduce the economics of gas costs from these experiments. In this section, we will introduce a model that analyzes execution time and gas cost of EVM instructions. With our experiment, we will show that the current gas metering in EVM is unsustainable. For this purpose, we define the notion of a “standard smart contract” in the cost model. A standard smart contract simulates the performance behavior of an averaged program execution at an arbitrary block-height.
5.1. Modeling Execution Time and Gas on the Blockchain
We introduce a model of execution for a “standard“ smart contract. For this purpose, we idealize the runtime computation of a smart contract. Node that the standard smart contract is a hypothetical smart-contract. It does not exist in the form of EVM bytecode; only in the cost model. It will reflect an average mix of instructions and an average execution length over the whole blockchain.
The idealized model is defined as follows:
| (1) |
where is a scalar that represents the average execution length (i.e. number of instructions) per smart contract invocation, time vector captures the runtime of EVM instructions at block-height , and frequency vector represents the normalized execution frequency for the standard smart-contract execution, i.e., .
The time vector and the execution frequency vector have for each possible EVM instruction an element. The time vector is independent of a smart contract, and reflect the execution time of a single instruction at a given block-height. For BH-independent instructions, we assume that the elements are constants. For BH-dependent instructions the corresponding elements will increase with a larger . The scalar and depends on the standard smart contract .
In this idealized model, the execution of instructions is simulated in an additive fashion, i.e., every executed EVM instruction will contribute to the total runtime. This model is a coarse approximation of instruction execution because it does not take sub- or super-linear effectives between EVM instruction executions into accounts (i.e. that two dependent instructions either make the execution time longer or shorter). Each instruction is considered in isolation.
For determining the parameters of the model, we can measure the time vector for each block/smart contract execution. The measurements can be later aggregated and normalized to deduce a time vector for the block chain. Similarly, and execution frequencies can be observed for each program execution and aggregated later. From these estimates, we can deduce the performance characteristics of a “standard” smart-contract.
Similarly, we define an idealized gas cost for smart-contracts:
| (2) |
where is a vector containing for each instruction in the EVM an element. There are some instructions with variant gas cost depending on the state of the program including block number, values of input/output operands and account storage. We used in order to approximate gas cost of instructions at different block-heights .
With the idealized execution time and gas model, we can define the ratio between the two models
| (3) |
which we refer to as the average time per unit gas.
5.2. Effects of Block-Height-Dependent Instructions
Figure 10 shows the execution time ratio between BH-dependent and BH-independent instructions under the assumption that the “standard” contract executes at this block-height. Note that the percentage of BH-dependent instructions steadily increases and exceeds 80% at block , while the instruction mix in the standard contract is constant - it is used as a yardstick.
We also extrapolated the curve after blocks. To predict average execution time of instructions after block , we used average time for BH-independent instruction and linear interpolation for BH-dependent ones. For BH-dependent instructions, we used polynomial regression with one input parameter, block-height, and one output, average execution time of the instruction. To avoid overfitting, we used randomly selected 80% of observations for training and the rest 20% for validation. In the validation we used Bayesian information criterion (BIC) (Schwarz, 1978) to evaluate polynomial models with different degrees. With cross-validation by BIC, quadratic, cubic, and linear model were selected as the best for SLOAD, SSTORE, and CALLCODE, respectively. The extrapolation is represented after blue dashed line in Figure 10. It shows that execution time ratio of BH-dependent instructions will keep increasing to over 90% at block .
5.3. New Gas Model for Constant Time-Per-Gas
For sustainable Ethereum ecosystem, gas model must reflect real cost of computational resource to the gas charged by smart contract execution. Red lines in Figure 11 and Figure 12 shows the average gas cost and time per unit gas of the standard contract. We observed that execution time of the standard contract increases but the gas cost remains the same. As a result, time per unit gas is increasing over time (Figure 12). This derives from the fact that BH-dependent instructions require more execution time in later blocks, while their gas costs do not change. EIP-150 (community, 2019a) was proposed to mitigate such irregularity between gas costs and execution time of SLOAD and SSTORE in past, and it was accepted after block on the main network by EIP-608. However, EIP-150 only proposed constant gas costs for SLOAD and SSTORE, thus the irregularity in BH-dependent instructions reappeared in later blocks.
We propose a new gas model to fix the increasing time per unit gas by scaling the gas costs of BH-dependent instructions based on predicted execution time. The goal of the new gas model is to stabilize time per unit gas to a constant . Let be predicted execution time of instruction where is block-height. For BH-dependent instruction will be a polynomial function, and for BH-independent one will be a constant. If is a gas function of instruction , the new gas model should result as follows:
| (4) |
To satisfy the equation above, we revised of each instructions as follows:
| (5) |
We defined with our time prediction model that used to predict after block in Figure 10. Thus, gas cost of BH-dependent instructions increases as blockchain grows, while gas cost of the BH-independent stays constant. We evaluated our new gas model with standard contract in Figure 11 and Figure 12. Red lines in Figure 11 shows that with current gas model, gas cost of standard contract stays constant over blockchain growth, which leads time per unit gas of standard contract depicted as red lines in Figure 12 increases. Blue lines in Figure 11 and Figure 12 represent the result of the new gas model. By increasing gas cost of BH-dependent instructions, total gas cost of standard contract with our new model increases in Figure 11. Increasing gas cost from Figure 11 results time per unit gas of standard contract stay constant in Figure 12. In this paper we chose because time per unit gas in earlier blocks stays around 5.
5.3.1. Discussion of Gas cost Model
The gas cost model was designed to equate the linearly increasing execution times of blockchain size dependent instructions to have a linearly increasing gas cost. Discrepancies between gas costs and execution times can lead to malicious users sending transactions which use less gas but have higher execution time, thereby allowing the attacker to abuse the resources of clients for minimal costs. The new gas model will aims to reduce this attack vector by equating real execution times with gas costs.
However, changing gas costs may cause some smart contracts, that rely on specific gas costs of EVM instructions, to no longer function as designed. Ethereum was designed for stability and immutability and the new gas model provides a one-off-change that goes against immutability. However, weighing the short term impact of making a certain number of contracts unusable against the longer impact of increasing difference between execution time and gas costs leading to potential DoS attacks and clients re-allocating their resources, it is argued that the longer term benefits outweigh the short term impacts.
Furthermore, while this gas cost model may add complexity to the calculations of gas costs, it will allow programmers to pre-determine the gas costs of instructions at certain block-heights. As a result, programmers will be able to design smart contracts knowing whether their contract will still be usable going into the future.
An alternate method for implementing protection against the DoS attacks would be to implement hard forks adjusting the cost of specific instructions. While this may temporarily reduce the gap between execution time and gas costs, execution time will continue to grow linearly and thus we will arrive back at the situation where gas costs and execution time are not equated.
6. Related Work
6.1. Bitcoin Mining Analysis
There has been a recent analysis directly on the costs of mining Bitcoin (Stoll et al., 2019). The paper shows an approximation to the amount of energy being spent on mining Bitcoin and relates these findings to the energy consumptions of small countries. While this research provides insight into the economy of mining in Bitcoin, it does not cover the gas model of Ethereum. As Ethereum has the ability for state execution which does not exist in Bitcoin it has its own economic model which is discussed in this paper.
6.2. Ethereum Technical Aspects
High level concepts about the Ethereum network can be found through looking at the Ethereum white paper, first release in 2013 (community, 2019b) by Vitalik Buterin. For core technical details about Ethereum the yellow paper (Wood, 2014) contains sufficient details to demonstrate the feasibility of the concept.
For technical information specifically related to the Parity client the Parity Ethereum Wiki (Technologies, 2019) gives a detailed overview of the client, which is written in Rust programming language. It covers aspects such as downloading a setting up a client, including package and dependency requirements, configuration options and specifications on the recommended hardware.
6.3. Contract Bytecode & Security
A smart contract is stored on Ethereum as bytecode. It is most commonly compiled from the Solidity programming language. Previous research into contract bytecode tends to concentrate on security. Work from Data61 (Amani et al., 2018) demonstrates the nature of conducting formal verification on Ethereum smart contracts by segmenting the bytecode into basic blocks to confirm all possible terminations of an execution. Static analysis tools such as Slither (page, 2019b) and SmartCheck (Tikhomirov et al., 2018) have been developed to ananlyze smart contracts for common flaws. Research generally in the form of blogs (Gupta, 2019) has been done into the best ways to optimize gas when writing smart contracts.
6.4. Cryptography
Cryptography plays a key role in the Ethereum ecosystem. There are two main uses of cryptography in the core blockchain and these are the hashing algorithm Keccak256 (Bertoni et al., 2013) and a digital signature algorithm ECDSA (Johnson et al., 2001). Keccak is used as part of the Ethash (page, 2018) PoW algorithm to restrict the production of blocks by enforcing the number of leading zero bits of the hash. Transactions employ a digital ECDSA signature to prove a transaction was authorized by the owner of the account. These cryptographic functions are not the focus of this paper, however, monitoring their usage is. Buterin (Buterin, 2019) suggests an alternative signature scheme that allows for the aggregation of signatures to significantly reduce verification times.
6.5. Ethereum Virtual Machine (EVM)
The EVM is an interpreter that takes parameters from a user’s transaction and runs the bytecode stored by the network. The technical specifications of the EVM can be found in the yellow paper (Wood, 2014). Currently there is research (team, 2019) being undertaken to compare the efficiency of the EVM against another common web interpreter called WASM. The results of that research may compliment the research undertaken in this paper as EVM may be constrained resource and the benchmarks may show the areas which need improving. The Ethereum network in the past has experience Denial Of Service attacks which exploited the under pricing of gas with respect to instructions in the EVM. It is important in understanding the efficiency of the client to understand what are the inefficient instructions and how they can be exploited. Information about the DoS attack and possible mitigation strategies are demonstrated in this paper (Chen et al., 2017).
6.6. Scaling & Bottlenecks
The issue of scalability is heavily talked about in the Ethereum community and is mentioned at inception in the yellow paper (Wood, 2014). The core issue with scalability is all nodes in the network are required to process all new blocks in order. The current maximum transactions per second is about 15. Grayblock (Grayblock, 2018) describes how varying the block-time or gas limit (block size) will not solve the issue, these variables may be able to increase the transactions per second slightly but they will not be able to make a significant difference. To make a significant difference two solutions can be applied, either make the system parallelized as is being done in Ethereum2.0 or increase the efficiency of the clients and block processing.
6.7. Performance Measurements with Geth
There exists measurement on instruction execution time on a virtual machine using Geth (Swende, 2019), which is measured on m5d.2xlarge instance of Amazon Web Services. It also reports that storage operations are taking more time in later blocks. Based on this observation, EIP-1884 (community, 2019a) proposes to increase gas of those instructions. However, the proposal is restricted that gas costs will be increased to some constants, while execution time of the instructions will keep growing by blockchain grows.
6.8. Gas Mechanism and Resource Usage in EVM
There are recent studies about irregularity of EVM gas mechanisms (Perez and Livshits, 2019; Yang et al., 2019). Yang et al. (Yang et al., 2019) vastly analyzed time-per-gas ratio of EVM instruction set on both commodity and dedicated server hardware. It presented that the ratio is not uniform among different instructions and some instructions have high variance in their own ratio due to state trie access. (Perez and Livshits, 2019) also reports varying gas for different instructions have low correlation with their resource usage. It further investigated a relation between gas consumption and resource usages of smart contracts, and concluded that storage usage is the most relevant and CPU usage is the least relevant to gas consumption of smart contracts. However, both studies focused only on the misprized gas cost itself and missed reasoning in which instructions exert most influence on current Ethereum gas model. Moreover, they did little work on variability of instructions over growing blockchain (e.g., SLOAD and SSTORE) and did not explore the effect from those instructions.
6.9. Blockchain Databases
Cohen, Rosenthal and Zohar (Cohen et al., 2019) explore the idea of using blockchains as a storage layer for databases. The paper discusses possible methods for querying a database that uses a blockchain for its storage layer. The article, however, does not explore efficient solutions to deal with the expanding database size or how to establish an effective cost model related to the size.
7. Conclusion
Ethereum is the largest blockchain with the ability to execute arbitrarily-expressive computations called smart contracts. Users compensate miners for the execution of smart contracts. We have shown that the costs of smart contract execution are disproportionally larger than the computational costs, and that the cost-model of the underlying EVM instruction-set is wrongly modeled. Our macroscopic instrumentation of the Parity Ethereum client shows that both overall time and time per unit gas increase with block height. Our microscopic instrumentation revealed that the execution time of three EVM instructions (SLOAD, SSTORE, and CALLCODE) are drastically increasing with block-height, which is not covered by the current Ethereum gas cost model. The Ethereum community is aware of the issue and has increased gas costs sporadically by hard forks, which can only temporarily fix this issue.
Based on our performance data that we collected for the Ethereum blockchain up to Block , we have devised a performance model to estimate gas usage and execution time of a smart contract at a given block-height. We have proposed a new gas cost model that fixes the main irregularity of the current Ethereum gas cost model. For the fix, we introduced the notion of a standard smart contract that simulates an average smart contract at an arbitrary block-height. Our new cost model stops the ongoing inflation of execution time per unit of gas.
Acknowledgements.
This work was supported by Sponsor Fantom Foundation https://fantom.foundation, by the Sponsor Australian Government through the ARC Discovery Project funding scheme (Grant #DP180104030), by the Sponsor General Research Program www.nrf.re.kr through the National Research Foundation of Korea (Grant #NRF-2019R1F1A1062576), and by the Sponsor Next-Generation Information Computing Development Program www.nrf.re.kr through the National Research Foundation of Korea, funded by the Ministry of Science, ICT & Future Planning under Grant No. Grant #NRF-2015M3C4A7065522.References
- (1)
- 2.0 (2019a) Ethereum 2.0. 2018–2019a. POS cost model. (2018–2019). https://docs.ethhub.io/ethereum-roadmap/ethereum-2.0/eth-2.0-economics/ (accessed 10/2019).
- 2.0 (2019b) Ethereum 2.0. 2018–2019b. POS transaction fees. (2018–2019). https://github.com/ethereum/eth2.0-specs/blob/master/specs/core/0_beacon-chain.md#transfers (accessed 10/2019).
- Amani et al. (2018) Sidney Amani, Myriam Bégel, Maksym Bortin, and Mark Staples. 2018. Towards verifying Ethereum smart contract bytecode in Isabelle/HOL. In Proceedings of the 7th ACM SIGPLAN International Conference on Certified Programs and Proofs. ACM, 66–77.
- Amiri et al. (2019) Mohammad Javad Amiri, Divyakant Agrawal, and Amr El Abbadi. 2019. CAPER: A Cross-application Permissioned Blockchain. Proc. VLDB Endow. 12, 11 (July 2019), 1385–1398. DOI:http://dx.doi.org/10.14778/3342263.3342275
- Bertoni et al. (2013) Guido Bertoni, Joan Daemen, Michaël Peeters, and Gilles Van Assche. 2013. Keccak. In Annual international conference on the theory and applications of cryptographic techniques. Springer, 313–314.
- Billingsley (2008) Patrick Billingsley. 2008. Probability and measure. John Wiley & Sons.
- Boehm and Adve (2008) Hans-J. Boehm and Sarita V. Adve. 2008. Foundations of the C++ Concurrency Memory Model. In Proceedings of the 29th ACM SIGPLAN Conference on Programming Language Design and Implementation (PLDI ’08). ACM, New York, NY, USA, 68–78. DOI:http://dx.doi.org/10.1145/1375581.1375591
- Buterin (2019) Vitalik Buterin. 2018–2019. On-chain scaling to potentially 500 tx/sec through mass tx validation. (2018–2019). https://ethresear.ch/t/on-chain-scaling-to-potentially-500-tx-sec-through-mass-tx-validation/3477 (accessed 08/2019).
- Buterin and Griffith (2017) Vitalik Buterin and Virgil Griffith. 2017. Casper the Friendly Finality Gadget. CoRR abs/1710.09437 (2017). http://arxiv.org/abs/1710.09437
- Buterin et al. (2019) Vitalik Buterin, Daniël Reijsbergen, Stefanos Leonardos, and Georgios Piliouras. 2019. Incentives in Ethereum’s Hybrid Casper Protocol. CoRR abs/1903.04205 (2019). arXiv:1903.04205 http://arxiv.org/abs/1903.04205
- Chen et al. (2017) Ting Chen, Xiaoqi Li, Ying Wang, Jiachi Chen, Zihao Li, Xiapu Luo, Man Ho Au, and Xiaosong Zhang. 2017. An adaptive gas cost mechanism for Ethereum to defend against under-priced DoS attacks. In International Conference on Information Security Practice and Experience. Springer, 3–24.
- Cochran (1952) William Gemmell Cochran. 1952. The test of goodness of fit. The Annals of Mathematical Statistics (1952), 315–345.
- Cohen et al. (2019) Sara Cohen, Adam Rosenthal, and Aviv Zohar. 2019. Reasoning about the Future in Blockchain Databases. In BCDL: Proceedings of the 1st workshop on blockchain and distributed ledger at VLDB’2019.
- CoinSchedule (2019) CoinSchedule. 2019. Crypto Token Sales Market Statistics. (2019). https://www.coinschedule.com/stats.php (accessed 10/2019).
- community (2019b) Ethereum community. 2013–2019b. Ethereum white paper. (2013–2019). https://github.com/ethereum/wiki/wiki/White-Paper (accessed 08/2019).
- community (2019a) Ethereum community. 2015–2019a. Ethereum Improvement Proposals. (2015–2019). https://eips.ethereum.org/ (accessed 09/2019).
- Ethereum (2019b) Ethereum. 2014–2019b. Patricia Tree. (2014–2019). https://github.com/ethereum/wiki/wiki/Patricia-Tree/ (accessed 10/2019).
- Ethereum (2019c) Ethereum. 2014–2019c. RLP. (2014–2019). http://github.com/ethereum/wiki/wiki/RLP/ (accessed 10/2019).
- Ethereum (2018) Ethereum. 2016–2018. Benchmarks. (2016–2018). https://github.com/ethereum/wiki/wiki/Benchmarks/ (accessed 10/2019).
- Ethereum (2019a) Ethereum. 2018–2019a. Monetary Policy. (2018–2019). https://docs.ethhub.io/ethereum-basics/monetary-policy/ (accessed 10/2019).
- Ethereum (2019d) Go Ethereum. 2013–2019d. Go Ethereum. (2013–2019). https://geth.ethereum.org/ (accessed 08/2019).
- Etherscan (2019a) Etherscan. 2019a. Ether Price History (USD). (2019). https://etherscan.io/chart/etherprice (accessed 10/2019).
- Etherscan (2019b) Etherscan. 2019b. Ethereum Market Capitalization. (2019). https://etherscan.io/chart/marketcap (accessed 15/10/2019).
- Etherscan (2019c) Etherscan. 2019c. Ethereum Node Tracker. (2019). https://etherscan.io/nodetracker (accessed 10/2019).
- Flood and Goodenough (2015) Mark D Flood and Oliver R Goodenough. 2015. Contract as automaton: the computational representation of financial agreements. https://dx.doi.org/10.2139/ssrn.2648460. (2015).
- Grayblock (2018) Grayblock. 2018. Blockchain Scaling. (2018). https://medium.com/coinmonks/blockchain-scaling-30c9e1b7db1b (accessed 08/2019).
- Grech et al. (2019) Neville Grech, Lexi Brent, Bernhard Scholz, and Yannis Smaragdakis. 2019. Gigahorse: thorough, declarative decompilation of smart contracts. In Proceedings of the 41st International Conference on Software Engineering, ICSE 2019, Montreal, QC, Canada, May 25-31, 2019, Joanne M. Atlee, Tevfik Bultan, and Jon Whittle (Eds.). IEEE / ACM, 1176–1186. DOI:http://dx.doi.org/10.1109/ICSE.2019.00120
- Gupta (2019) Gupta. 2019. Solidity tips and tricks to save gas and reduce bytecode size. (2019). https://blog.polymath.network/solidity-tips-and-tricks-to-save-gas-and-reduce-bytecode-size-c44580b218e6 (accessed 08/2019).
- Jack du Rose (2017) Jack du Rose. 2017. Ethereum startups don’t need Silicon Valley. (2017). https://venturebeat.com/2017/07/01/ethereum-startups-dont-need-silicon-valley/ (accessed 10/2019).
- Jakobsson and Juels (1999) Markus Jakobsson and Ari Juels. 1999. Proofs of work and bread pudding protocols. In Secure Information Networks. Springer, 258–272.
- Johnson et al. (2001) Don Johnson, Alfred Menezes, and Scott Vanstone. 2001. The elliptic curve digital signature algorithm (ECDSA). International journal of Information security 1, 1 (2001), 36–63.
- Kim et al. (2018) Seoung Kyun Kim, Zane Ma, Siddharth Murali, Joshua Mason, Andrew Miller, and Michael Bailey. 2018. Measuring Ethereum network peers. In Proceedings of the Internet Measurement Conference 2018. ACM, 91–104.
- Nathan et al. (2019) Senthil Nathan, Chander Govindarajan, Adarsh Saraf, Manish Sethi, and Praveen Jayachandran. 2019. Blockchain Meets Database: Design and Implementation of a Blockchain Relational Database. Proc. VLDB Endow. 12, 11 (July 2019), 1539–1552. DOI:http://dx.doi.org/10.14778/3342263.3342632
- page (2018) Ethash GitHub page. 2015–2018. Ethash. (2015–2018). https://github.com/ethereum/wiki/wiki/Ethash (accessed 08/2019).
- page (2019a) Parity GitHub page. 2015–2019a. Parity Ethereum 2.4.0. (2015–2019). https://github.com/paritytech/parity-ethereum/releases/tag/v2.4.0 (accessed 08/2019).
- page (2019b) Slither Github page. 2018–2019b. Slither, the Solidity source analyzer. (2018–2019). https://github.com/crytic/slither (accessed 08/2019).
- Perez and Livshits (2019) Daniel Perez and Benjamin Livshits. 2019. Broken Metre: Attacking Resource Metering in EVM. arXiv preprint arXiv:1909.07220 (2019).
- Pilkington (2016) Marc Pilkington. 2016. 11 Blockchain technology: principles and applications. Research handbook on digital transformations 225 (2016).
- R3 Consortium (2019) R3 Consortium. 2016–2019. Corda — an open-source distributed ledger platform. (2016–2019). https://www.corda.net/ (accessed 10/2019).
- Schwarz (1978) Gideon Schwarz. 1978. Estimating the dimension of a model. The annals of statistics 6, 2 (1978), 461–464.
- Source (2019) Facebook Open Source. 2012–2019. RocksDB. (2012–2019). https://rocksdb.org/ (accessed 10/2019).
- Stoll et al. (2019) Christian Stoll, Lena Klaaßen, and Ulrich Gallersdörfer. 2019. The Carbon Footprint of Bitcoin. Joule (2019).
- Swende (2019) Martin Holst Swende. 2019. VMstats. (2019). https://github.com/holiman/vmstats (accessed 08/2019).
- Tapscott and Tapscott (2016) Don Tapscott and Alex Tapscott. 2016. Blockchain Revolution: How the Technology Behind Bitcoin Is Changing Money, Business, and the World. Penguin, London : Portfolio Penguin, 2016.
- team (2019) Ewasm team. 2018–2019. Instructions for benchmarking Ewasm precompiles. (2018–2019). https://github.com/ewasm/benchmarking (accessed 08/2019).
- Technologies (2019) Parity Technologies. 2015–2019. Parity Ethereum Wiki. (2015–2019). https://wiki.parity.io/Parity-Ethereum (accessed 08/2019).
- Tikhomirov et al. (2018) Sergei Tikhomirov, Ekaterina Voskresenskaya, Ivan Ivanitskiy, Ramil Takhaviev, Evgeny Marchenko, and Yaroslav Alexandrov. 2018. Smartcheck: Static analysis of Ethereum smart contracts. In 2018 IEEE/ACM 1st International Workshop on Emerging Trends in Software Engineering for Blockchain (WETSEB). IEEE, 9–16.
- United Kingdom Government Office for Science (2016) United Kingdom Government Office for Science. 2016. Distributed ledger technology: beyond block chain. https://www.gov.uk/government/publications/distributed-ledger-technology-blackett-review. (2016).
- Various (2017) Various. 2014–2017. GitHub - ethereum/serpent: The Serpent Language. (2014–2017). https://github.com/ethereum/serpent (accessed 10/2019).
- Various (2019a) Various. 2015–2019a. GitHub - ethereum/solidity: The Solidity Contract-Oriented Programming Language. (2015–2019). https://github.com/ethereum/solidity (accessed: 10/2019).
- Various (2019b) Various. 2016–2019b. GitHub - ethereum/vyper: Pythonic Smart Contract Language for the EVM. (2016–2019). https://github.com/ethereum/vyper (accessed 10/2019).
- Wieczner (2017) Jen Wieczner. 2017. Cryptocurrency ICOs Are Making Bitcoin Startups Richer than VCs Ever Did. http://fortune.com/2017/07/28/bitcoin-cryptocurrency-ico/. (2017). (accessed 10/2019).
- Wood (2014) Gavin Wood. 2014. Ethereum: A secure decentralised generalised transaction ledger. Ethereum project yellow paper (2014), 1–32.
- Yang et al. (2019) Renlord Yang, Toby Murray, Paul Rimba, and Udaya Parampalli. 2019. Empirically Analyzing Ethereum’s Gas Mechanism. arXiv preprint arXiv:1905.00553 (2019).