Anomalously Narrow Linewidths of Compact Massive Star-Forming Galaxies at : A Possible Inclination Bias in the Size–Mass Plane
Abstract
Compact, massive star forming galaxies at are thought to be building the central regions of giant elliptical galaxies today. However, a significant fraction of these objects were previously shown to have much smaller H line widths than expected. A possible interpretation is that H emission from their central regions, where the highest velocities are expected, is typically obscured by dust. Here we present ALMA observations of the CO(3-2) emission line of three compact, massive galaxies with H line widths of FWHM(H)125-260 km s-1 to test this hypothesis. Surprisingly, in all three galaxies, the CO line width is similar to the H line width: we find FWHM(CO)165 km s-1 for all three galaxies whereas FWHM(CO)450-700 km s-1 was expected from a simple virial estimator. These results show that the narrow H linewidths of many compact massive star-forming galaxies are not due to preferential obscuration of the highest velocity gas. An alternative explanation for the narrow line widths is that the galaxies are disks that are viewed nearly face-on. We suggest that there may be an inclination bias in the size-mass plane, such that the apparent rest-frame optical sizes of face-on galaxies are smaller than those of edge-on galaxies. Although not conclusive, this hypothesis is supported by an observed anti-correlation between size and axis ratio of massive galaxies.
1 Introduction
The first “red and dead” quiescent galaxies appear in redshift surveys as early as (e.g., Glazebrook et al., 2017), and they became the dominant population among massive galaxies by (Brammer et al., 2011; Muzzin et al., 2013). Quiescent galaxies at are remarkably compact, with sizes a factor of smaller than galaxies of the same mass today (e.g., Daddi et al., 2005; van Dokkum & Brammer, 2010; van der Wel et al., 2014). Their densities match those of the centers of massive elliptical galaxies today, with velocity dispersions as high as km s-1 (FWHM km s-1) (Belli et al., 2014; van de Sande et al., 2011). They are thought to evolve into ellipticals by gradually acquiring outer envelopes through minor mergers (Bezanson et al., 2009; Naab et al., 2009; van Dokkum & Brammer, 2010).
The immediate progenitors of these compact quiescent galaxies are thought to be compact highly star-forming galaxies, which have been identified at similar redshifts of (Barro et al., 2014; Nelson et al., 2014; van Dokkum et al., 2015). Although most star forming galaxies at these redshifts are larger than the quiescent population, there is a significant tail of objects with stellar masses , star formation rates 100 /yr, and small half-light radii of 1 kpc (Wuyts et al., 2011; Barro et al., 2014, 2017a). Their ionized gas, as traced by the H line, has been found to be in rotating disks that appear to be more extended than the detected stellar light (e.g., van Dokkum et al., 2015; Wisnioski et al., 2018).
In this context two aspects of these compact massive star forming galaxies are puzzling. The first is that their axis ratio distribution is not consistent with thin disks viewed from random orientations: there are virtually no galaxies in this class with axis ratios (van Dokkum et al., 2015). The second is that a significant fraction of these galaxies have surprisingly narrow H line widths. In a compilation of H line widths of 14 compact massive star-forming galaxies with no X-ray detection in the CANDELS/3D-HST fields only one galaxy has FWHM km s-1 (Nelson et al., 2014), whereas nine have 120 FWHM 350 km s-1. (van Dokkum et al., 2015, hereafter vD15).
vD15 attributed the large axis ratios to intrinsically-thick disks and the small observed line widths to dust obscuration, in combination with falling rotation curves. As the central regions are most obscured the highest velocities may be heavily suppressed in the light of H (Nelson et al., 2016). This interpretation is supported by the high dust content of massive galaxies (Whitaker et al., 2017), the measured spatial extent of the H gas distributions (vD15,Wisnioski et al. (2018)), and independent dynamical evidence for thick disks and falling rotation curves in this mass and redshift range (e.g., Genzel et al., 2017; Lange et al., 2016; Übler et al., 2017).
In this Letter we test this hypothesis. Sub-mm observations do not suffer from dust obscuration, and can provide information on the (molecular) gas kinematics in the central regions (e.g., Tacconi et al., 2008; Tadaki et al., 2017a; Popping et al., 2017; Barro et al., 2017b). We used the Atacama Large Millimeter/submillimeter Array (ALMA) to observe three galaxies at from the vD15 sample that have very small H line widths, to determine whether their CO line widths are significantly larger. We assume a Chabrier initial mass function (IMF Chabrier, 2003) and adopt cosmological parameters of H0 70 km s-1/Mpc, 0.3, and 0.7.
2 Sample Selection
We describe three galaxies objectively selected from a sample of compact star-forming galaxies with H measurements presented in vD15. The parent sample was selected from catalogs of the 3D-HST survey (Skelton et al., 2014) which utilized photometric and grism spectroscopic information to measure redshifts, rest-frame colors and emission line strengths using the EAZY code (Brammer et al., 2011). Star formation rates were derived from Spitzer MIPS 24m data (Whitaker et al., 2012, 2014), structural parameters were measured from CANDELS imaging (van der Wel et al., 2012, 2014) and stellar masses were determined from fits of stellar population synthesis models to 0.3-8 m photometry using the FAST code (Kriek et al., 2009), with Chabrier IMF (Chabrier, 2003), Calzetti dust attenuation law (Calzetti et al., 2000) and exponentially declining star formation histories. The compact star-forming galaxies were selected by vD15 to have
| (1) |
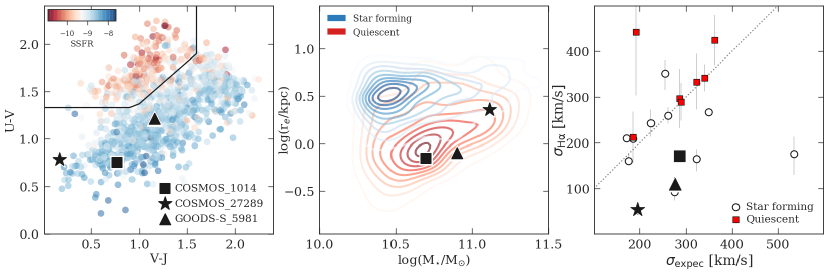
where is the circularized effective radius and is the stellar mass. K-band spectroscopy of 25 of these galaxies was obtained using the MOSFIRE and NIRSPEC spectrographs on Keck. Out of the 25, 14 galaxies have no X-ray counterparts and likely do not host an AGN. The measured velocity dispersions of the galaxies (H linewidths) compared to their expected velocity dispersions are shown in the right panel of Figure 1. The expected velocity dispersions are calculated using
| (2) |
where (n) 8.87 - 0.831 + 0.0241 . Here is the Sèrsic index and G 4.31 10-6 when is in , is in km s-1 and re is in kpc (see vD15). Among the 14 non-AGN galaxies, 9 galaxies have observed H linewidths lower than . For this , we selected galaxies with
| (3) |
and with axis-ratio , to ensure that inclination corrections are less than a factor of two. Five out of the nine objects match this criterion. Three of these objects were observable from Chile and formed our sample. These galaxies have stellar masses 1011 , star formation rates 200 /year and circularized half-light radii 1 kpc. The measured H FWHMs of the galaxies are 1.5–3.5 times smaller than the expected FWHMs. Properties of the galaxies are shown in Figure 1 and listed in Table 1.
| ID | SFR | () | LW(H)111All linewidths given as full width half maximums. | LW(pred) | LW(CO(3-2) ) | L’CO(3-2) | |||
|---|---|---|---|---|---|---|---|---|---|
| [/yr] | kpc | km s-1 | km s-1 | km s-1 | 1010 K km s-1 pc2 | ||||
| COSMOS-27289 | 2.23 | 400 | 11.0 | 2.3 | 0.81 | 12728 | 460 | 1677 | 2.39 |
| COSMOS-1014 | 2.10 | 150 | 10.7 | 0.7 | 0.79 | 40030 | 674 | 18122 | 0.56 |
| GOODSS-5981 | 2.25 | 210 | 10.8 | 0.8 | 0.85 | 26038 | 650 | 17726 | 0.84 |
3 ALMA observations and Results
3.1 Observations and processing
The three selected galaxies were observed with the Atacama Large Millimeter/submillimeter Array (ALMA) as part of ID: 2018.1.01841.S program. The observations were carried out in Band-3 using four spectral windows covering the rest-frame frequency range of GHz. The on-source integration times were minutes in array configuration C43-3 (shortest and longest baselines were 15 and 1240 m, respectively). The water vapor during the observations mm. Flux, phase, bandpass and WVR calibrators were also obtained for a total time of hr per object. The data were processed through the Common Astronomy Software Application package (CASA; McMullin et al., 2007). We use the tclean task with natural weighting to make channel maps and dirty continuum maps excluding the frequency range of the CO line. The spectral resolution of the data is km s-1; to search for lines and the continuum the data were binned to a velocity width of 50 km s-1. The continuum is undetected or negligible for all three objects. The synthesized beam sizes are and the rms levels are 0.20–0.25 mJy/beam over 50 km s-1 in the channel maps.
3.2 CO(3-2) Line Detection
We robustly detect the CO emission line in all three galaxies in the expected frequency range from their redshift. We measure the total flux densities of the three galaxies from moment zero maps created using CASA task immoment within the velocity range of -200 to 200 km s-1 centered on the CO line. The velocity range is chosen based of preliminary inspection of the data cube; we verified that our results do not change if we increase the velocity range. For C1 and G5 we use apertures of diameter 2”, while for C2 we use 3” aperture since it is spatially more extended, as determined from the growth curve. We estimate the line luminosity from the CO(3-2) line luminosity using
| (4) |
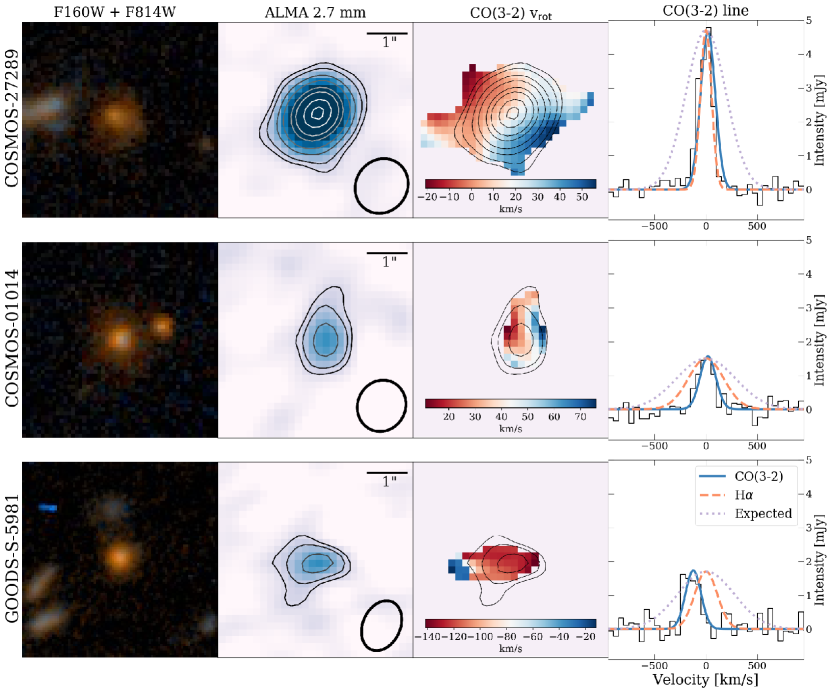
where is the line flux and is the luminosity distance. The resulting values are listed in Table 1. It should be be noted that for G5 the center of CO(3-2) line is -120 km s-1 offset from the H line. This may suggest that the H and CO(3-2) are tracing different components of the gas.
3.3 CO(3-2) linewidth
Due to their large masses and small sizes compact star forming galaxies should have large line widths. We measure the integrated line widths of the galaxies by fitting a single Gaussian to the spectra, extracted with a 15 diameter circular aperture (the results are not sensitive to the size of the aperture).
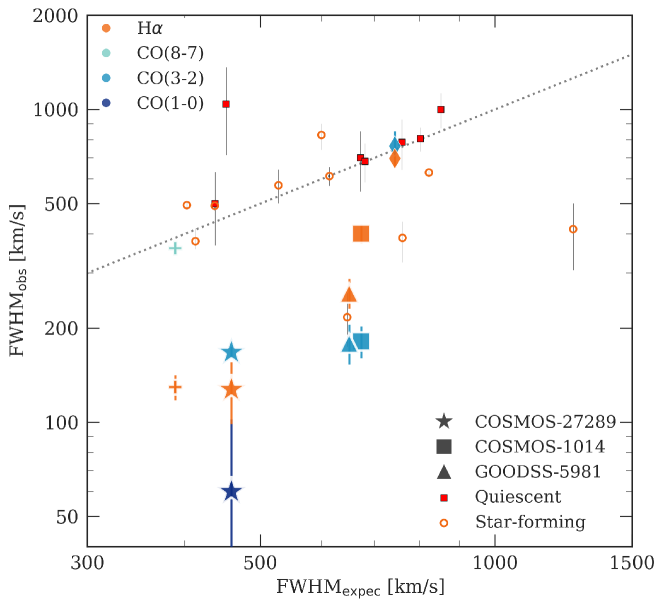
The expected linewidths for these galaxies based on their masses, sizes, and geometries are 450–670 km s-1 (see Eq. 2). Instead we observe 167 km s-1, 177 km s-1 and 179 km s-1 (for C2, C1, and G5 respectively). These values are three times smaller than the expected CO line widths and the linewidth of CO is even narrower than that of H in two of the three galaxies.
The fact that velocity dispersion of molecular gas is similar to (or even lower than) that of H emission rules out dust obscuration at high velocity gas being responsible for the low H linewidths. Instead it may indicate that these galaxies are nearly face-on disks; we explore this further by investigating their spatially resolved kinematics.
3.4 Spatially-resolved kinematics
Even though we have large beam sizes ( 12) compared to the galaxy sizes ( 01–027), we investigated the spatially-resolved kinematics of the galaxies. Figure 2 shows the observed rotation velocities for the three galaxies obtained by fitting the CO emission line at every spaxel with a single Gaussian. The velocity field of C2, which is our largest galaxy ( kpc), reveals a continuous shear consistent with the kinematics of a rotating disk. Nothing conclusive can be said about either C1 or G5 and extent of the gas. We derived the spatial extent of the molecular gas in C2 using CASA/uvmodelfit. We do a visibility fit of the emission in an averaged cube of width 200 km s-1 and find a half-light radius of 2.50.5 kpc by fitting a circular Gaussian disk. This is similar in size to the half-light radius of the galaxy (2.3 kpc; however this is measured from fitting a Sèrsic profile with n3.3). C1 and G5 are not spatially resolved in our data. However, G5 was observed by Barro et al. (2016) at a much higher resolution (FWHM 012-018) using ALMA 870 m dust continuum imaging. They find an effective radius of 1.14 kpc and a Sèrsic index of 0.7. A more detailed comparison between the spatial extent of stellar and dust disks will be performed in a future paper.
4 Discussion
In this Letter we tested the hypothesis that smaller-than-expected H line widths of compact massive star forming galaxies at are caused by dust obscuration of their central regions. If this were the case, we would have measured broad, potentially double-horned, ALMA CO (3-2) emission lines. However, the measured line widths are FWHM16515 km/s in CO (3-2) for all three galaxies. These linewidths are much smaller than the 450 - 700 km/s we were expecting and even smaller than the H line widths. We conclude that we can reject the hypothesis that the narrow H lines in these objects were the result of preferential attenuation of the gas with the highest velocities.
We consider several possible alternative explanations. First, our observations are in the CO(3-2) line, and it has been shown that different CO transitions (reflecting different excitation levels) can trace gas with different spatial and kinematic properties (e.g., Hodge et al., 2012; Bothwell et al., 2013; Casey et al., 2018). There is some evidence that this may be relevant in COSMOS-27289, as Spilker et al. (2016) find that the CO(1-0) line has a FWHM of only 60 km/s in this galaxy, almost a factor of three lower than our CO(3-2) measurement. However, other galaxies show similar kinematics for different tracers (e.g., Popping et al., 2017), and CO(3-2) should probe the denser and more turbulent gas. Nevertheless, it would be worthwhile to obtain higher transitions (such as CO(8-7); see Barro et al., 2017b).
Second, the central regions of these galaxies could be devoid of (molecular and ionized) gas. In that case the “missing” high velocity H-emitting gas would not be hiding behind dust but simply does not exist, as the dense centers have already quenched. This interpretation finds some support in the fact that we spatially-resolve the CO gas in at least one of the galaxies (COSMOS-27289) (see Spilker et al., 2019). However, it is difficult to reconcile with the rest-frame UV–optical morphology and spectral energy distributions of the galaxies. Their measured rest-frame optical sizes are small, and their rest-frame colors place them firmly in the “dusty star forming” region of the diagram (see vD15). It is difficult to imagine a scenario where the yr-1 star formation in these galaxies only takes place outside of the visible regions and the central regions are misclassified in the diagram and actually quiescent.
The third and perhaps most likely explanation is that the gas in these three galaxies is in rotation-dominated disks that we are viewing close to face-on. Our measured line widths are in good agreement with the intrinsic velocity dispersions estimated by Tadaki et al. (2017a) and Barro et al. (2017b) for similar galaxies and with the disk dispersions derived by Wisnioski et al. (2015) and Übler et al. (2017) for the general population of massive star forming galaxies at (see also Kassin et al., 2014). The narrow CO(1-0) line width of COSMOS-27289 measured by Spilker et al. (2016) is also consistent with this picture. Adopting the same excitation ratio between CO (3-2) and CO (1-0) and the same CO-to-H2 conversion factor, the molecular gas fractions and depletion times are also consistent with those of the general population of star forming galaxies in the PHIBBS survey (Tacconi et al., 2018) and the ASPECS program (Aravena et al., 2019). The issue with this explanation is that even though the axis ratios of the galaxies are high at , they are close to the median of the vD15 sample (see also Wisnioski et al., 2018). It is therefore unlikely that galaxies with are nearly face-on, unless the compact massive region of the size-mass plane is bid towards face-on galaxies.
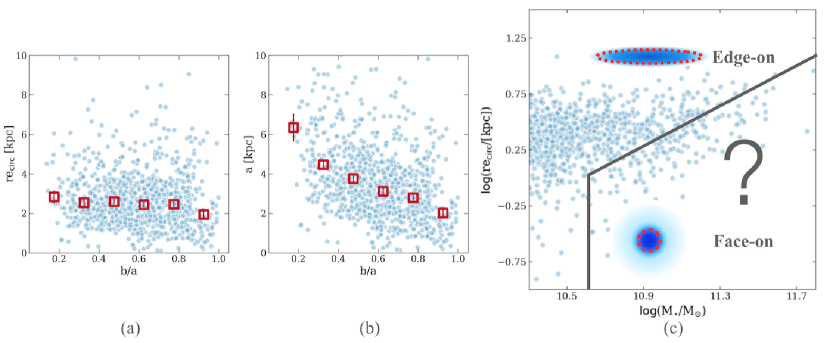
We explore this possibility in Fig. 4a, which shows the relation between circularized size and axis ratio for massive star forming galaxies. There is indeed a correlation, with a significance of 4, such that the smallest galaxies are on average rounder than the largest galaxies. The correlation is weak, but this is a reflection of the fact that we use the circularized size. If the galaxies are disks under random viewing angles, the relevant test is whether the major axis size, , correlates with the axis ratio. This relation is shown in Fig.4b. For an unbiased population of thin disks of different sizes there should be no correlation between these parameters: small and large disks would each show a uniform distribution of . There is, however, a very strong correlation, with galaxies with having a major axis that is a factor of larger than galaxies with . Although this relation could partially or entirely reflect differences in the morphology of large and small galaxies (see, e.g., Zhang et al., 2019), it is striking that there are no face-on counterparts to the large edge-on galaxies.
Such biases could have a variety of causes. Face-on disks have a lower stellar surface density than edge-on disks, whereas the stellar surface density of central bulge-like structures is less dependent on viewing angles. Combined with the generally low S/N ratio of the data and the use of single Sèrsic fits with a single axis ratio, this may lead to systematic underestimates of the sizes of face-on galaxies and overestimates of edge-on galaxies. Dust may also play a role. If there is significant dust in the disk, the central regions of edge-on galaxies will be more obscured than in face-on galaxies, and if the center is very dense this means face-on galaxies will appear to be more compact than edge-on galaxies (see also Graham & Worley, 2008; Gadotti et al., 2010; Price et al., 2017). Regardless of the cause, if there is an inclination bias in the size-mass plane it means that a significant fraction of apparently-compact star forming galaxies may in fact be face-on counterparts of galaxies with larger apparent sizes. This may be a common feature of samples that are selected to have small sizes, which would have important implications for the interpretation of the size-mass plane (Mowla et al., 2019).
We note that these three galaxies have differences among themselves. The most massive and bluest galaxy COSMOS-27289 is almost three times as large and has a lower inferred central density than the other two galaxies. While both COSMOS-27289 and COSMOS-10104 exhibit light in the outskirts, which can possibly be due to a disk, GOODS-S-5981 has extremely compact light profile. These suggest that these galaxies likely have different formation histories and may take different paths going forward.
To conclude, this study highlights the complexity of massive early star forming galaxies, and the need of dynamical information to understand their properties. It will be interesting to look for compact face-on quiescent disks at , as our results suggest these maybe fairly common. Further progress can also be made with high resolution dust continuum imaging: if the dust continuum sizes do not show a dependence on axis ratio it would be strong evidence that the rest-frame optical sizes are biased. Early results have already suggested that galaxies tend to be smaller in dust continuum than in the rest-frame optical (e.g., Tadaki et al., 2017b; Nelson et al., 2019), in apparent conflict with the idea that the centers may be devoid of gas (the second explanation for the small line widths offered above). Ultimately deep rest-frame m imaging with JWST will show the actual morphologies of the galaxies, largely free from the effects of young stars and dust. Based on the results presented here these mid-IR sizes and morphologies may be quite different from the rest-frame optical ones that we have worked with so far.
References
- Aravena et al. (2019) Aravena, M., Decarli, R., Gónzalez-López, J., et al. 2019, ApJ, 882, 136, doi: 10.3847/1538-4357/ab30df
- Barro et al. (2014) Barro, G., Faber, S. M., Pérez-González, P. G., et al. 2014, ApJ, 791, 52, doi: 10.1088/0004-637X/791/1/52
- Barro et al. (2016) Barro, G., Kriek, M., Pérez-González, P. G., et al. 2016, ApJ, 827, L32, doi: 10.3847/2041-8205/827/2/L32
- Barro et al. (2017a) Barro, G., Faber, S. M., Koo, D. C., et al. 2017a, ApJ, 840, 47, doi: 10.3847/1538-4357/aa6b05
- Barro et al. (2017b) Barro, G., Kriek, M., Pérez-González, P. G., et al. 2017b, ApJ, 851, L40, doi: 10.3847/2041-8213/aa9f0d
- Belli et al. (2014) Belli, S., Newman, A. B., & Ellis, R. S. 2014, ApJ, 783, 117, doi: 10.1088/0004-637X/783/2/117
- Bezanson et al. (2009) Bezanson, R., van Dokkum, P. G., Tal, T., et al. 2009, ApJ, 697, 1290, doi: 10.1088/0004-637X/697/2/1290
- Bothwell et al. (2013) Bothwell, M. S., Aguirre, J. E., Chapman, S. C., et al. 2013, ApJ, 779, 67, doi: 10.1088/0004-637X/779/1/67
- Brammer et al. (2011) Brammer, G. B., Whitaker, K. E., van Dokkum, P. G., et al. 2011, ApJ, 739, 24, doi: 10.1088/0004-637X/739/1/24
- Calzetti et al. (2000) Calzetti, D., Armus, L., Bohlin, R. C., et al. 2000, ApJ, 533, 682, doi: 10.1086/308692
- Casey et al. (2018) Casey, C. M., Hodge, J., Zavala, J. A., et al. 2018, ApJ, 862, 78, doi: 10.3847/1538-4357/aacd11
- Chabrier (2003) Chabrier, G. 2003, PASP, 115, 763, doi: 10.1086/376392
- Daddi et al. (2005) Daddi, E., Renzini, A., Pirzkal, N., et al. 2005, ApJ, 626, 680, doi: 10.1086/430104
- Gadotti et al. (2010) Gadotti, D. A., Baes, M., & Falony, S. 2010, MNRAS, 403, 2053, doi: 10.1111/j.1365-2966.2010.16243.x
- Genzel et al. (2017) Genzel, R., Schreiber, N. M. F., Übler, H., et al. 2017, Nature, 543, 397, doi: 10.1038/nature21685
- Glazebrook et al. (2017) Glazebrook, K., Schreiber, C., Labbé, I., et al. 2017, Nature, 544, 71, doi: 10.1038/nature21680
- Graham & Worley (2008) Graham, A. W., & Worley, C. C. 2008, MNRAS, 388, 1708, doi: 10.1111/j.1365-2966.2008.13506.x
- Hodge et al. (2012) Hodge, J. A., Carilli, C. L., Walter, F., et al. 2012, ApJ, 760, 11, doi: 10.1088/0004-637X/760/1/11
- Kassin et al. (2014) Kassin, S. A., Brooks, A., Governato, F., Weiner, B. J., & Gardner, J. P. 2014, ApJ, 790, 89, doi: 10.1088/0004-637X/790/2/89
- Kriek et al. (2009) Kriek, M., van Dokkum, P. G., Labbé, I., et al. 2009, ApJ, 700, 221, doi: 10.1088/0004-637X/700/1/221
- Lange et al. (2016) Lange, R., Moffett, A. J., Driver, S. P., et al. 2016, MNRAS, 462, 1470, doi: 10.1093/mnras/stw1495
- McMullin et al. (2007) McMullin, J. P., Waters, B., Schiebel, D., Young, W., & Golap, K. 2007, in Astronomical Society of the Pacific Conference Series, Vol. 376, Astronomical Data Analysis Software and Systems XVI, ed. R. A. Shaw, F. Hill, & D. J. Bell, 127
- Mowla et al. (2019) Mowla, L., van der Wel, A., van Dokkum, P., & Miller, T. B. 2019, ApJ, 872, L13, doi: 10.3847/2041-8213/ab0379
- Muzzin et al. (2013) Muzzin, A., Marchesini, D., Stefanon, M., et al. 2013, ApJ, 777, 18, doi: 10.1088/0004-637X/777/1/18
- Naab et al. (2009) Naab, T., Johansson, P. H., & Ostriker, J. P. 2009, ApJ, 699, L178, doi: 10.1088/0004-637X/699/2/L178
- Nelson et al. (2014) Nelson, E., van Dokkum, P., Franx, M., et al. 2014, Nature, 513, 394, doi: 10.1038/nature13616
- Nelson et al. (2016) Nelson, E. J., van Dokkum, P. G., Förster Schreiber, N. M., et al. 2016, ApJ, 828, 27, doi: 10.3847/0004-637X/828/1/27
- Nelson et al. (2019) Nelson, E. J., Tadaki, K.-i., Tacconi, L. J., et al. 2019, ApJ, 870, 130, doi: 10.3847/1538-4357/aaf38a
- Popping et al. (2017) Popping, G., Decarli, R., Man, A. W. S., et al. 2017, A&A, 602, A11, doi: 10.1051/0004-6361/201730391
- Price et al. (2017) Price, S. H., Kriek, M., Feldmann, R., et al. 2017, ApJ, 844, L6, doi: 10.3847/2041-8213/aa7d4b
- Skelton et al. (2014) Skelton, R. E., Whitaker, K. E., Momcheva, I. G., et al. 2014, ApJS, 214, 24, doi: 10.1088/0067-0049/214/2/24
- Spilker et al. (2016) Spilker, J. S., Bezanson, R., Marrone, D. P., et al. 2016, ApJ, 832, 19, doi: 10.3847/0004-637X/832/1/19
- Spilker et al. (2019) Spilker, J. S., Bezanson, R., Weiner, B. J., Whitaker, K. E., & Williams, C. C. 2019, arXiv e-prints, arXiv:1908.02294. https://arxiv.org/abs/1908.02294
- Tacconi et al. (2008) Tacconi, L. J., Genzel, R., Smail, I., et al. 2008, ApJ, 680, 246, doi: 10.1086/587168
- Tacconi et al. (2018) Tacconi, L. J., Genzel, R., Saintonge, A., et al. 2018, ApJ, 853, 179, doi: 10.3847/1538-4357/aaa4b4
- Tadaki et al. (2017a) Tadaki, K.-i., Kodama, T., Nelson, E. J., et al. 2017a, ApJ, 841, L25, doi: 10.3847/2041-8213/aa7338
- Tadaki et al. (2017b) Tadaki, K.-i., Genzel, R., Kodama, T., et al. 2017b, ApJ, 834, 135, doi: 10.3847/1538-4357/834/2/135
- Übler et al. (2017) Übler, H., Förster Schreiber, N. M., Genzel, R., et al. 2017, ApJ, 842, 121, doi: 10.3847/1538-4357/aa7558
- van de Sande et al. (2011) van de Sande, J., Kriek, M., Franx, M., et al. 2011, ApJ, 736, L9, doi: 10.1088/2041-8205/736/1/L9
- van der Wel et al. (2012) van der Wel, A., Bell, E. F., Häussler, B., et al. 2012, The Astrophysical Journal Supplement Series, 203, 24, doi: 10.1088/0067-0049/203/2/24
- van der Wel et al. (2014) van der Wel, A., Franx, M., van Dokkum, P. G., et al. 2014, ApJ, 788, 28, doi: 10.1088/0004-637X/788/1/28
- van Dokkum & Brammer (2010) van Dokkum, P. G., & Brammer, G. 2010, ApJ, 718, L73, doi: 10.1088/2041-8205/718/2/L73
- van Dokkum et al. (2015) van Dokkum, P. G., Nelson, E. J., Franx, M., et al. 2015, ApJ, 813, 23, doi: 10.1088/0004-637X/813/1/23
- Whitaker et al. (2017) Whitaker, K. E., Pope, A., Cybulski, R., et al. 2017, ApJ, 850, 208, doi: 10.3847/1538-4357/aa94ce
- Whitaker et al. (2012) Whitaker, K. E., van Dokkum, P. G., Brammer, G., & Franx, M. 2012, ApJ, 754, L29, doi: 10.1088/2041-8205/754/2/L29
- Whitaker et al. (2014) Whitaker, K. E., Franx, M., Leja, J., et al. 2014, ApJ, 795, 104, doi: 10.1088/0004-637X/795/2/104
- Wisnioski et al. (2015) Wisnioski, E., Förster Schreiber, N. M., Wuyts, S., et al. 2015, ApJ, 799, 209, doi: 10.1088/0004-637X/799/2/209
- Wisnioski et al. (2018) Wisnioski, E., Mendel, J. T., Förster Schreiber, N. M., et al. 2018, ApJ, 855, 97, doi: 10.3847/1538-4357/aab097
- Wuyts et al. (2011) Wuyts, S., Förster Schreiber, N. M., van der Wel, A., et al. 2011, ApJ, 742, 96, doi: 10.1088/0004-637X/742/2/96
- Zhang et al. (2019) Zhang, H., Primack, J. R., Faber, S. M., et al. 2019, MNRAS, 484, 5170, doi: 10.1093/mnras/stz339