Survival chances of a prey swarm:
how the cooperative interaction range affects the outcome
Abstract
A swarm of preys when attacked by a predator is known to rely on their cooperative interactions to escape. Understanding such interactions of collectively moving preys and the emerging patterns of their escape trajectories still remain elusive. In this paper, we investigate how the range of cooperative interactions within a prey group affects the survival chances of the group while chased by a predator. As observed in nature, the interaction range of preys may vary due to their vision, age, or even physical structure. Based on a simple theoretical prey-predator model, here, we show that an optimality criterion for the survival can be established on the interaction range of preys. Very short range or long range interactions are shown to be inefficient for the escape mechanism. Interestingly, for an intermediate range of interaction, survival probability of the prey group is found to be maximum. Our analysis also shows that the nature of the escape trajectories strongly depends on the range of interactions between preys and corroborates with the naturally observed escape patterns. Moreover, we find that the optimal survival regime depends on the prey group size and also on the predator strength.
pacs:
Valid PACS appear hereIntroduction
In nature, cohesive group formation has been observed in diverse species ranging from bacterial colony to flocking of birds, swarming of insects, schooling of fishes, huddling of penguins to name a few vicsekreview2012 ; cavagnareview2018 ; Kparrishscience ; krausebook2002 ; sumpterbook2010 ; ballerini2008 ; Arnoldplosone2012 ; jmichaelscience2009 ; abaid2010interface ; couzin2003id . Swarm behaviour arises due to variety of reasons as individual members gain mutual benefits from one another belonging in a group while searching for food, finding new nests, migrating from one place to another, or to overcome various environmental hurdles in general vicsekreview2012 ; cavagnareview2018 ; Arnoldplosone2012 ; traniello2003ARE . Another major factor of forming group is thought to be due to predation avoidance where survival chances in a group turns out to be better than solitary individuals Kparrishscience ; penzhornbook1984 ; pitcherbook1983 . Moving in a large group often dilute the encounter and increases the overall alertness since many eyes could keep a careful watch for a possible danger or a predator attack. It also confuses the predator by making it difficult to focus on any particular member among a large group of preys neilletal . However, cohesive movements could also be unfavourable for preys as the predator can then easily track the group and attack them. For example, fish schools are easily tracked and caught by marine predators parrishenvbio . Moreover, preys at the boundaries and the trailing ones are more vulnerable for predation, so preys compete within for the protected position. Competitions may also arise due to limited food resources or due to aggression within the group. Thus, there found to be often a trade off between staying together versus individual needs. So, prey groups always look for efficient strategies for the survival from predator attacks kerleyjoz2005 ; Mckenzieinterfacefocus2012 ; carobook2005 ; Humpherisoecologia1970 . There are different escape strategies have been observed in nature. For example, a school of marine fish would scatter fixing the predator at the centre or splitting up into subgroups creating visual confusion pitcherbook1983 ; Partridge1982 . Besides, on finding a potential threat, animal aggregation often moves closer to reduce the chance of being caught by the predator hamiltonjtb . Moreover, there are instances of direct escapes where preys simply straight away run in the opposite direction to escape from the predator, or run in random zigzag motion to confuse the predator. It is further observed that preys often interact within the group to avoid predation by opting different kind of swarming patterns like spinning, circling, splitting up into sub groups etc carobook2005 ; Humpherisoecologia1970 ; DomeniciJEB2011 ; EdutBBR2004 ; DomeniciMB1997 . However, it still remains far from clear how the local interactions among swarming preys lead to complex behavioural patterns, or how preys optimize their survival chances or influence the predation rates etc.
There are several experimental and theoretical studies which have contributed immensely to understand the emergent behaviours of swarming in living organims vicsekswarm2008 ; attanasi2014collective ; calovietal ; couzinetal2005 ; couzinetal2002 ; LeePRE2015 . Considerable efforts have also been made to understand the collective dynamics of prey-predator systems. Detailed studies on escape trajectories of different species under threats show a certain degree of unpredictability in their escape patterns that confuse the predator in the chase DomeniciJEB2011 ; DomeniciMB1997 . Besides, how the size of the prey group affects predator attacks and the success rate have also been investigated in the field cresswell2011predicting . Also, it has been observed that cooperativity in predator groups significantly increase hunting success upto a certain threshold size of the group schallerbook1972 ; boeschAOPA1989 ; geseCJZ2001 . However, understanding local interactions within the prey group in natural field is quite challenging due to unpredictable nature of the predator attack. In such scenarios, theoretical models further help us to get insights into the complex dynamics of collectively interacting systems. For example, based on self-propelled particle models, collective predation and escape strategies have been explored to provide insights into the predation rate and the catch time of the group AngelaniPRL2012 . In another simple model of prey-predator system, it has been shown that prey swarm could easily escape from the weaker predator but as the strength of the predator increases, system passes through a transition from confusion state of the predator to chasing dynamics chenJRSCinterface2014 . There are also other models on swarming behaviour of preys in the presence of predators where different force laws between predators are explored ZhdankinPRE2010 . Predator confusion and its effect on reducing the attack to kill ratio has also been studied krausebook2002 ; bazzietal . Another evolutionary model suggests that predator confusion drives the swarming behaviour of preys and the attack efficiency decreases rapidly when predators visual filed is restricted OlsonJRSC2013 . Further, survival of a prey has been studied by assigning different sighting radius to the prey and its predators on a square lattice that suggests the importance of optimal sighting range for effective evasion Oshaninproceedings2009 .
Indeed, in natural scenario, the range of interactions of preys may be limited due to their sensitivity, vision, age, or even physical structure. However, very little has been known about the range of cooperative interactions among preys under a predator attack. It is observed that the prey groups rely on their local interactions to confuse the predator. Coordinating the movement of individuals in a group is important to ensure an escape. In this paper, we investigate the effect of range of cooperative interactions among preys in a group while chased by a predator. Based on a simple theoretical prey-predator model that incorporates the essential interactions between preys and the predator, we study the escape dynamics and the survival probability of the prey group by varying the interaction range among preys under a predator attack. Our analysis shows that the range of cooperative interaction has a strong influence on the escape trajectories of preys. It also hugely alters the survival outcome of the prey group. Cohesive interactions with the entire group or no interactions among preys appear to be unfavourable for their survival. Interestingly, we find that the survival of the group is maximum within an intermediate ranges of interaction radius. The optimal regime further varies depending on the size of the prey group and on the strength of the predator. In addition, we also analyse how the spatial correlations among preys and the collective ordering of the group get affected with the change in interacting radius.
Theoretical Model
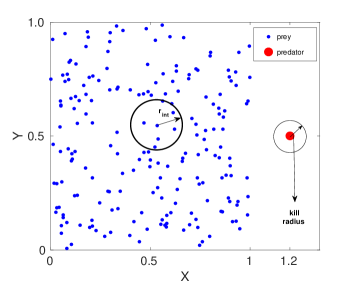
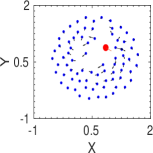
In our model, we consider a group of preys represented by active particles on a two dimensional space as illustrated in Fig. 1. Each prey is characterized by the position, , and the velocity, . To mimic the physical scenario in the field, we consider that preys move in open space (unlike other studies where periodic boundary condition has been imposed). We focus on the escape dynamics when the prey group is under attack by a predator. In general, due to physical or sensory constraints, it is not possible for preys to interact with all other preys in a large group at the time of escape kunzthomas2006 . Therefore, we consider that each prey interacts with the neighbouring preys within a certain reaction radius, , for their survival. We model the prey-prey interactions following the existing literature chenJRSCinterface2014 . Each prey interacts with the surrounding preys within the reaction radius by long range attraction and short range repulsion. The prey-prey interaction force for the ’th prey is given by averaging over all interacting preys within the reaction radius, ,
where is the number of preys interacting with the ’th prey within the given radius, . Here, denotes the strength the prey-prey attraction and is the strength of repulsion. Moreover, as preys always try to escape from the predator, the prey-predator interaction is modelled as a repulsive radial force,
here, denotes the position of the predator and is the strength of repulsive interaction between the prey and the predator. On the other hand, as the predator chases the prey group, it could track all preys and its motion is governed by the attractive force averaged over all preys given by,
where signifies the strength of the predator. Hence, the predator-prey interaction decays as the distance between preys and the predator increases. We assume that when the prey comes close to the predator within a certain kill radius, as illustrates in Fig. 1, the prey is killed. Here, we note that the prey-predation interaction could also be considered by different power laws as discussed by chen and kolkolnikov chenJRSCinterface2014 . Now, the equation of motion of preys and the predator can be described by,
| (1) | |||||
| (2) |
Here, and represent the coefficient of the viscous drag experienced by the prey and the predator respectively. In our model, for simplicity we consider the dynamics in over damped limit.
We study the prey-predator dynamics in dimensionless units. Position variables are scaled as, , and the interaction radius as, . The dimensionless time is defined by ; where and represent the characteristic length and time scale of the prey system. Also, the other relevant scaled parameters are given as, , , , and .
Results
We have studied the prey-predator dynamics by solving the coupled Eqs. (1) and (2) numerically. We have investigated the dynamics for a wide range of parameter values by varying the prey group size , interaction radius , and also the strength of interactions between preys and the predator. Here, we present the dynamics for a case of a ‘strong’ predator. The ‘strong’ predator signifies that if the prey interacts with all preys to escape from the predator, then the whole group is killed by the predator; on the other hand, in case of a ‘weak’ predator, the whole prey group could easily escape. The representative parameter values are kept at , , , and . In our simulations, we consider that preys are initially positioned randomly within a square box of unit area and the predator starts chasing from just outside the box as illustrated in Fig. 1. The kill radius of the predator is taken as . A variety of escape patterns emerge as we vary the range of interaction radius, , among preys as shown in different snapshots in Figs 2.
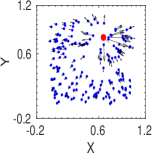
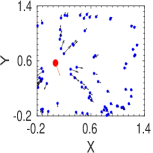
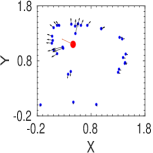
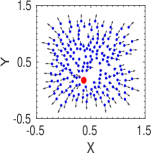
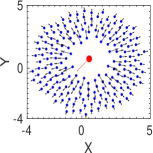
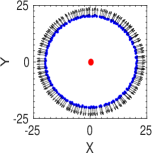
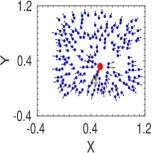
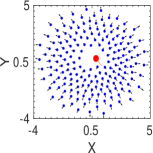
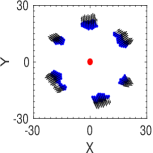
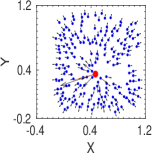
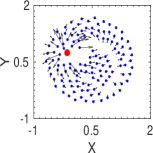
We first consider the scenario, when preys do not interact with each other and every individual just runs away from the predator due to the prey-predator repulsive interaction. As seen from Figs. 2(a)-(c), the predator hunts down the randomly moving preys and the whole group get caught over time. Now, as we incorporate the prey-prey interactions in the group, we find that for short range of interactions radius, the whole prey group is also eventually chased down by the predator. However, as the interaction radius increases, different escape patterns emerge. For example, at interaction radius, , as shown in Figs. 2(d)-(f), interacting preys form a circle surrounding the predator. Thus, the predator gets confuse which direction to attack and meanwhile the prey group moves away by circling the predator. Such escape routes of ring formation has also been observed in nature for several cases chenJRSCinterface2014 ; Partridge1982 . Other escaping trajectories also arise by varying the interaction radius further, for example, for , the prey group splits into smaller subgroups and migrate away from the predator in small groups as could be seen from Figs. 2(g)-(i). Number of subgroups formation not only depends on the interaction radius, but also, on the number of preys and on the initial configurations of the group. On the other hand, at even larger interaction radius at , as shown in Figs. 2(j)-(l), chasing dynamics is observed. The predator is able to catch the prey and eventually chase down the whole prey group as it has been observed when preys interact with all in the group to avoid the predator.
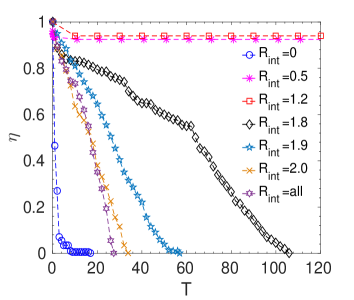
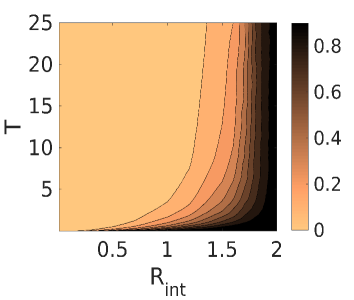
Now, to quantify the survival of preys as a function of interaction radius, we have calculated the survival probability, , of the prey group defined by the ratio of number of survived preys, , at any instant to the initial number of preys, i.e., . It could be seen from Fig. 3(a), as time progresses, for very short range and long range interactions, the whole prey group is killed by the predator. However, in the intermediate range, though initially some preys are caught, but after some time reaches to a steady value which signifies that most of the preys in the group could escape. This strong dependence on the interaction range could be understood from the prey-predator dynamics. With no interaction, =0, or smaller interaction radius, the prey-prey cooperative interaction is not significant and preys move somewhat randomly; hence, due to stronger predator-prey attraction, they are chased down and caught by the predator. On the other hand, for very large interaction radius among preys is equivalent to interacting with all group members, thus, the whole group move cohesively; as a result, the predator could easily track the whole prey group and hunt them down. Interestingly, in the intermediate range of interaction zone, the initial transient motion show the chasing dynamics by the predator, however, as time progresses, the local interactions of preys eventually establish coordinated movements to confuse the predator by forming a circle or splitting up into sub groups, or by other escape routes to survive in the long run. Initially, strong predator-prey attractive force dominates over prey-predator repulsion and prey-prey interaction forces. As time goes on, cooperative interaction force among preys helps to overcome the attractive force of the predator and thus, preys are survived. Such survival strategies of predator confusion has also been observed in nature, for example, the hunting behavior of wolves shows that they eventually give up their pursuit after some initial runs (after failed attempts) mech2010wolves . Our analysis, thus, indicates that a threshold number of interacting preys is required for cooperative decision making or to confuse the predator. Figure 3(b) shows, how each prey on an average interacts with the number of existing fraction of the population within a given interaction radius while on the chase. As seen, for smaller radius, the interacting prey number is very small, the number increases with increasing , and after a certain threshold radius, each prey interacts almost with the entire group.

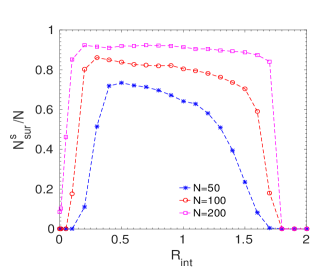
Further, we study the number of survived preys at steady state, , as a function of interaction radius as shown in Fig. 4. Averaging has been done over two hundred such simulation results. It can be seen from the plot that very short range and long range interactions are unfavourable for the prey group survival, however, within an intermediate regime the survival of the group is maximum. Moreover, the survival depends on the prey group size and also on the strength of the predator. In Fig. 4(a), we keep the initial number of preys at , and vary the strength of the predator, . It is observed that stronger the predator, lesser the number of survival because the initial catch by the predator is higher for the stronger predator and thus, the lower threshold value of the interaction radius for the survival of the prey shifts to the larger value as the strength of the predator increases. Upper threshold value of is determined by the range where preys start to interact with almost all existing preys in the group. We now investigate the dynamics by varying the initial prey group size, , while keeping the strength of the predator constant at . As seen from Fig. 4(b), survival chances of the group increases with increase in the prey group size similar to observations in different field studies hirsch2011measuring ; cresswell2011predicting . For larger group size, average number of interacting preys increases within an interaction radius, . So preys are able to establish coordination in the group to confuse the predator and thus, the survival chances also go up.
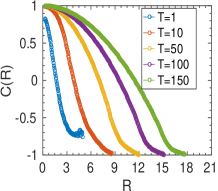
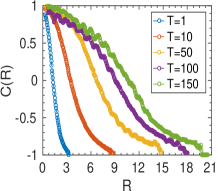
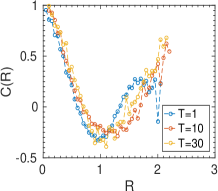
Moreover, to analyse the collective ordering of the prey group while on escape, we study the spatial correlation in velocity fluctuations as described by attanasi2014collective ; attanasi2014finite ,
| (3) |
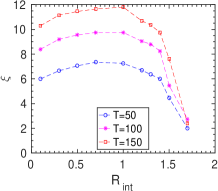
where the fluctuation in velocity of the ’th prey is defined as , the mean velocity, , and denotes the distance between a pair of preys. Here, characterizes how the individual prey behaviour is deviated from the average behaviour of the group. Figure 5 shows some representative plots of the spatial correlation, , among preys for different interaction radius, , at different time instances. As shown in Figs. 5(a) and (b), within the survival regime of the prey-prey interaction, e.g., at and , the spatial correlation among preys increases with time. However, as shown in Fig. 5(c), for longer interaction range at , representing the non-survival regime, as all preys interact and move cohesively while chased by the predator, the ordering extends over the entire spatial domain of the group for the whole time period (till the time preys are killed; here, further time instances are not shown as all preys are killed). We also calculate the correlation length, , for which , to measure the average size of the correlated domain within the prey group in the survival regime. Figure 5(d) presents the correlation length, , as a function of reaction radius . As seen, increases with increasing implying preys become more and more correlated with increase in interaction radius. However, with further increase in , starts decreasing as preys split up into sub groups to escape away from the predator, thus, the correlated domain size decreases.
Discussion
Here, we show that the range of cooperative interactions in a large group of collectively moving preys is very crucial to strategize their routes of escape under a predator attack. It could be seen from our study, based on a simple theoretical model that accounts for the essential prey-prey and prey-predator interactions, the diverse escape patterns emerges, e.g., ring formation, splitting into subgroups, chasing dynamics etc simply by tuning the interaction range between preys. Our study reveals also the survival chances of the group vastly depend on the local range of interacting preys. As shown, selfish run-away of preys without any interaction is not effective for the survival; similarly, cohesive movements of the entire group is also unfavourable for the escape. Interestingly, the survival probability is found to be maximum within an intermediate range of interaction radius. This work further elucidates the existence of an optimal interaction regime for survival and a certain threshold number of interacting preys to establish the coordinated movements to confuse the predator for escape. Further, under the attack of a weak predator, survival is found to be insensitive to the local interaction range of preys, the whole group could easily escape irrespective of their range of interactions. However, in case of a strong predator, since the number of interacting preys are less within a short range, the average prey-prey interaction force is not sufficient to overcome the strong attractive force of the predator. It requires a certain number of interacting preys to confuse the predator and establish the escape routes. Moreover, the optimal survival range also depends on the strength of attraction between preys ( in our model), increasing the strength results more tightly cohesive prey group and thus becomes more vulnerable as the predator could easily track and catch the whole group (for example, keeping the predator strength constant at , if value is increased from to , then the prey group get killed even at a smaller radius, ). The optimal regime is further shown to be sensitive to the prey group size and the strength of the predator as is observed in nature. Further, our study on spatial correlations in velocity fluctuations in preys show the ordering of the group while on escape. The correlated domain increases with increase in the interaction range among preys, reaches a maximum for a certain radius and then again decreases due to splitting up into smaller subgroups. Thus, our simple model could shed light into many aspects of natural prey-predator systems. Such theoretical framework could further be extended in understanding of other swarm behaviours of various species, for example, during collective foraging, migratory behaviour of birds or insects to name a few. Besides, as theoretical modelling and empirical data analysis work hand in hand, more complexity could be incorporated into the model for further quantitative understanding of such conceptual questions in natural scenarios.
ACKNOWLEDGMENTS
The authors acknowledge the financial support from Science and Engineering Research Board (SERB), Grant No. SR/FTP/PS-105/2013, Department of Science and Technology (DST), India.
References
- (1) Vicsek, T., & Zafeiris, A. Collective motion. Physics reports. 517(3-4), 71-140(2012).
- (2) Cavagna, A., Giardina, I., & Grigera, T. S. The physics of flocking: Correlation as a compass from experiments to theory. Physics Reports. 728, 1-62(2018)
- (3) Parrish, J. K., & Edelstein-Keshet, L. Complexity, pattern, and evolutionary trade-offs in animal aggregation. Science. 284(5411), 99-101(1999).
- (4) Sumpter, D. J. Collective animal behavior. Princeton University Press. (2010).
- (5) Krause, J., & Ruxton, G. D. Living in groups. Oxford University Press. (2002).
- (6) Ballerini, M., Cabibbo, N., Candelier, R., Cavagna, A., Cisbani, E., Giardina, I., … & Zdravkovic, V. Empirical investigation of starling flocks: a benchmark study in collective animal behaviour. Animal behaviour. 76(1), 201-215(2008).
- (7) Makris, N. C., Ratilal, P., Jagannathan, S., Gong, Z., Andrews, M., Bertsatos, I., … & Jech, J. M. Critical population density triggers rapid formation of vast oceanic fish shoals. Science. 323(5922), 1734-1737(2009).
- (8) Abaid, N., & Porfiri, M. Fish in a ring: spatio-temporal pattern formation in one-dimensional animal groups. Journal of the Royal Society Interface. 7(51), 1441-1453(2010).
- (9) Couzin, I. D., & Franks, N. R. Self-organized lane formation and optimized traffic flow in army ants. Proceedings of the Royal Society of London. Series B: Biological Sciences. 270(1511), 139-146(2003).
- (10) Waters, A., Blanchette, F., & Kim, A. D. Modeling huddling penguins. PLoS One. 7(11), e50277(2012).
- (11) Traniello, J. F. Foraging strategies of ants. Annual review of entomology. 34(1), 191-210(1989).
- (12) Penzhorn, B. L. A longâ€term study of social organisation and behaviour of Cape mountain zebras Equus zebra zebra. Zeitschrift für Tierpsychologie. 64(2), 97-146(1984).
- (13) Pitcher, T. J., & Wyche, C. J. Predator-avoidance behaviours of sand-eel schools: why schools seldom split. In Predators and prey in fishes. Springer, Dordrecht. 193-204(1983).
- (14) Neill, S., & Cullen, J. M. Experiments on whether schooling by their prey affects the hunting behaviour of cephalopods and fish predators. Journal of Zoology. 172(4), 549-569(1974).
- (15) Parrish, J. K. Using behavior and ecology to exploit schooling fishes. Environmental Biology of Fishes. 55(1-2), 157-181(1999).
- (16) Hayward, M. W., & Kerley, G. I. Prey preferences of the lion (Panthera leo). Journal of zoology. 267(3), 309-322(2005).
- (17) McKenzie, H. W., Merrill, E. H., Spiteri, R. J., & Lewis, M. A. How linear features alter predator movement and the functional response. Interface focus. 2(2), 205-216(2012).
- (18) Caro, T. Antipredator defenses in birds and mammals. University of Chicago Press.(2005).
- (19) Humphries, D. A., & Driver, P. M. Protean defence by prey animals. Oecologia. 5(4), 285-302(1970).
- (20) Partridge, B. L. The structure and function of fish schools. Scientific american. 246(6), 114-123(1982).
- (21) Hamilton, W. D. Geometry for the selfish herd. Journal of theoretical Biology. 31(2), 295-311(1971).
- (22) Domenici, P., Blagburn, J. M., & Bacon, J. P. Animal escapology I: theoretical issues and emerging trends in escape trajectories. Journal of Experimental Biology. 214(15), 2463-2473(2011).
- (23) Edut, S., & Eilam, D. Protean behavior under barn-owl attack: voles alternate between freezing and fleeing and spiny mice flee in alternating patterns. Behavioural brain research. 155(2), 207-216(2004).
- (24) Domenici, P., & Batty, R. S. Escape behaviour of solitary herring (Clupea harengus) and comparisons with schooling individuals. Marine Biology. 128(1), 29-38(1997).
- (25) Vicsek, T. Universal patterns of collective motion from minimal models of flocking. In 2008 Second IEEE International Conference on Self-Adaptive and Self-Organizing Systems IEEE, 3-11(2008).
- (26) Attanasi, A., Cavagna, A., Del Castello, L., Giardina, I., Melillo, S., Parisi, L., … & Viale, M. Collective behaviour without collective order in wild swarms of midges. PLoS computational biology. 10(7), e1003697(2014).
- (27) Calovi, D. S., Lopez, U., Ngo, S., Sire, C., Chaté, H., & Theraulaz, G. Swarming, schooling, milling: phase diagram of a data-driven fish school model. New Journal of Physics. 16(1), 015026(2014).
- (28) Couzin, I. D., Krause, J., Franks, N. R., & Levin, S. A. Effective leadership and decision-making in animal groups on the move. Nature. 433(7025), 513(2005).
- (29) Couzin, I. D., Krause, J., James, R., Ruxton, G. D., & Franks, N. R. Collective memory and spatial sorting in animal groups. Journal of theoretical biology. 218(1), 1-11(2002).
- (30) Lee, S. H., & Ngo, V. T. Effect of vision angle on the phase transition in flocking behavior of animal groups. Physical Review E. 92(3), 032716(2015).
- (31) Cresswell, W., & Quinn, J. L. Predicting the optimal prey group size from predator hunting behaviour. Journal of Animal Ecology. 80(2), 310-319(2011).
- (32) Schaller, G. B. Serengeti: a kingdom of predators(1972).
- (33) Boesch, C., & Boesch, H. Hunting behavior of wild chimpanzees in the Tai National Park. American journal of physical anthropology. 78(4), 547-573(1989).
- (34) Gese, E. M. Territorial defense by coyotes (Canis latrans) in Yellowstone National Park, Wyoming: who, how, where, when, and why. Canadian Journal of Zoology. 79(6), 980-987(2001).
- (35) Angelani, L. Collective predation and escape strategies. Physical review letters. 109(11), 118104(2012).
- (36) Chen, Y., & Kolokolnikov, T. A minimal model of predator–swarm interactions. Journal of The Royal Society Interface. 11(94), 20131208(2014).
- (37) Zhdankin, V., & Sprott, J. C. Simple predator-prey swarming model. Physical Review E. 82(5), 056209(2010).
- (38) Bazazi, S., Ioannou, C. C., Simpson, S. J., Sword, G. A., Torney, C. J., Lorch, P. D., & Couzin, I. D. The social context of cannibalism in migratory bands of the mormon cricket. Plos One. 5(12), e15118(2010).
- (39) Olson, R. S., Hintze, A., Dyer, F. C., Knoester, D. B., & Adami, C. Predator confusion is sufficient to evolve swarming behaviour. Journal of The Royal Society Interface. 10(85), 20130305(2013).
- (40) Oshanin, G., Vasilyev, O., Krapivsky, P. L., & Klafter, J. Survival of an evasive prey. Proceedings of the National Academy of Sciences. 106(33), 13696-13701(2009).
- (41) Kunz, H., Züblin, T., & Hemelrijk, C. K. On prey grouping and predator confusion in artificial fish schools. In Proceedings of the Tenth International Conference of Artificial Life. MIT Press, Cambridge, Massachusetts (2006).
- (42) Mech, L. D., & Boitani, L. (Eds.). Wolves: behavior, ecology, and conservation. University of Chicago Press.(2010).
- (43) Hirsch, B. T., & Morrell, L. J. Measuring marginal predation in animal groups. Behavioral Ecology. 22(3), 648-656(2011).
- (44) Attanasi, A., Cavagna, A., Del Castello, L., Giardina, I., Melillo, S., Parisi, L., … & Viale, M. Finite-size scaling as a way to probe near-criticality in natural swarms. Physical review letters. 113(23), 238102(2014).