Identification of strontium in the merger of two neutron stars
Abstract
Half of all the elements in the universe heavier than iron were created by rapid neutron capture. The theory for this astrophysical ‘r-process’ was worked out six decades ago and requires an enormous neutron flux to make the bulk of these elements.[1] Where this happens is still debated.[2] A key piece of missing evidence is the identification of freshly-synthesised r-process elements in an astrophysical site. Current models[3, 4, 5] and circumstantial evidence[6] point to neutron star mergers as a probable r-process site, with the optical/infrared ‘kilonova’ emerging in the days after the merger a likely place to detect the spectral signatures of newly-created neutron-capture elements.[7, 8, 9] The kilonova, AT2017gfo, emerging from the gravitational-wave–discovered neutron star merger, GW170817,[10] was the first kilonova where detailed spectra were recorded. When these spectra were first reported[11, 12] it was argued that they were broadly consonant with an outflow of radioactive heavy elements, however, there was no robust identification of any element. Here we report the identification of the neutron-capture element strontium in a re-analysis of these spectra. The detection of a neutron-capture element associated with the collision of two extreme-density stars establishes the origin of r-process elements in neutron star mergers, and demonstrates that neutron stars comprise neutron-rich matter[13].
The most detailed information available for a kilonova comes from a series of spectra of AT2017gfo taken over several weeks with the medium resolution, ultraviolet (320 nm) to near-infrared (2,480 nm) spectrograph, X-shooter, mounted at the Very Large Telescope at the European Southern Observatory. These spectra[11, 12], allow us to track the evolution of the kilonova’s primary electromagnetic output from 1.5 days until 10 days after the event. Detailed modelling of these spectra has yet to be done owing to the limited understanding of the phenomenon and the expectation that a very large number of moderate to weak lanthanide lines with unknown oscillator strengths would dominate the spectra[14, 15]. Despite the expected complexity, we sought to identify individual elements in the early spectra because these spectra are well-reproduced by relatively simple models[11].
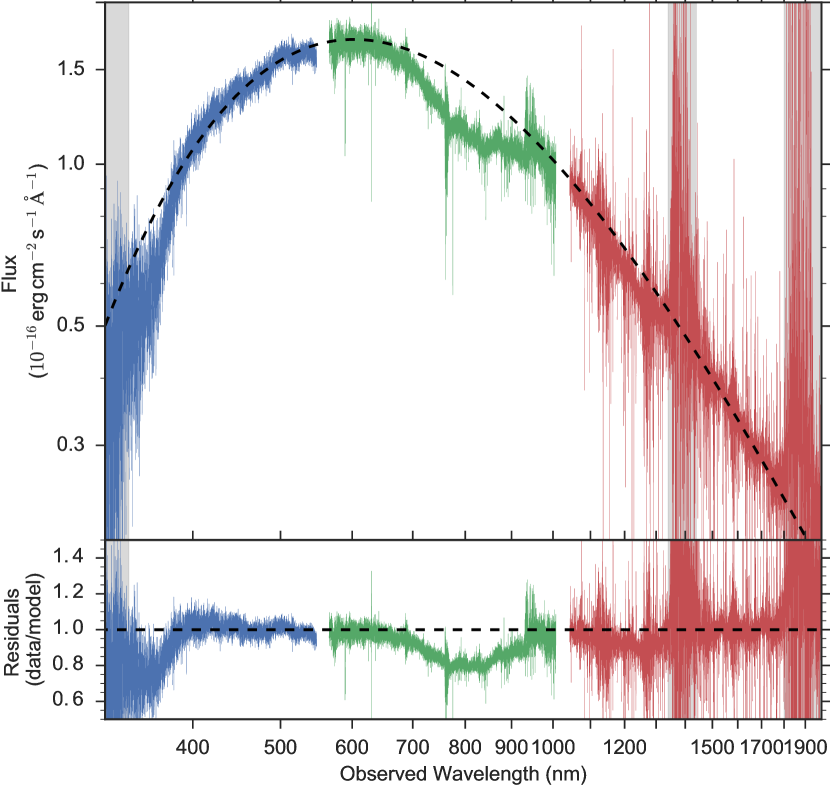
The first epoch spectrum can be reproduced over the entire observed spectral range with a single-temperature blackbody with an observed temperature K. The two major deviations short of m from a pure blackbody are due to two very broad () absorption components. These components are observed centred at about 350 nm and 810 nm (Fig. 1). The shape of the ultraviolet absorption component is not well constrained because it lies close to the edge of our sensitivity limit and may simply be cut off below about 350 nm. The presence of the absorption feature at 810 nm at this epoch has been noted in earlier publications[12, 11].
The fact that the spectrum is very well reproduced by a single temperature
blackbody in the first epoch suggests a population of states close to local thermal equilibrium (LTE). We therefore used three separate methods of increasing complexity initially to determine, without too many assumptions, the most likely origin of the spectral features, and then to self-consistently model and test our conclusion. First, our own LTE spectral synthesis code, second, the LTE line analysis and spectrum synthesis code MOOG[16], and third the moving plasma radiative transfer code, TARDIS[17] (see Methods). We used a variety of spectral line lists for these codes, all of which yielded consistent results. For our own LTE code, we adopted a fiducial temperature of 3,700 K, which is our final model’s best-fit temperature corrected by the Doppler factor () of the absorption features we determine below; changing the temperature of our LTE model in the range 3,700–5,100 K does not significantly affect our results.
To identify the absorption features, we seek lines with wavelengths blueshifted by 0.1–0.3, corresponding approximately to 390–500 nm and 900–1,160 nm in the rest frame (see Methods). The lines will also be broadened with an observed width dependent on the velocity and geometry. For spherically expanding ejecta, the line-broadening will be similar to the expansion velocity of the gas. We do not attempt a detailed geometric model here because it depends on assumptions about the geometry of the gas and the wavelength-dependent opacity, with significant relativistic and time-delay corrections.
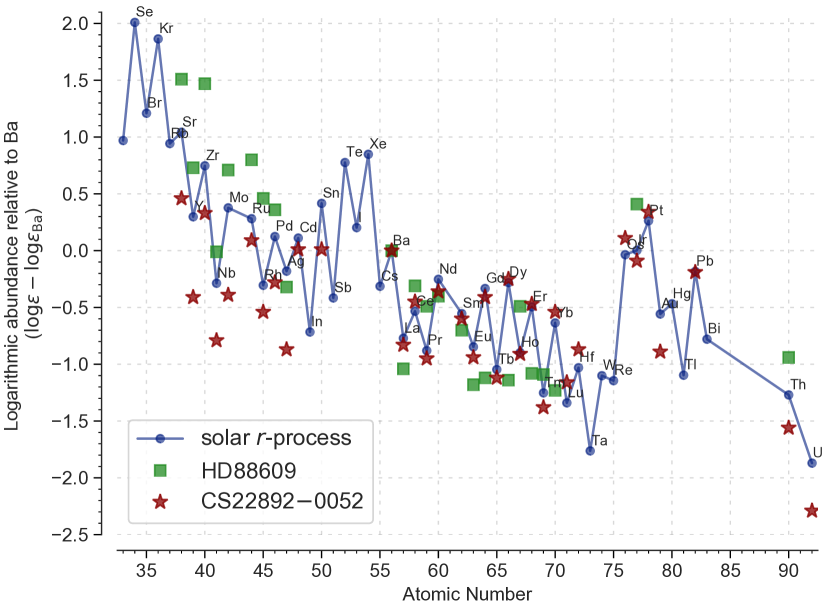
We adopt an initially agnostic view on the expected abundances. We use solar r-process abundance ratios (total solar abundances of heavy elements[18] with s-process elements subtracted[19]), and abundances from two metal-poor stars, old enough to be dominated by the r-process in their neutron-capture abundances[20, 21]. These three sets span a wide range in the ratio of light to heavy r-process abundances (Fig. 2). We also produce absorption spectra for each element individually (Extended Data Figs. 2 and 3).
Our LTE models with abundances from a solar-scaled r-process and metal-poor star abundances all show that Sr produces a strong feature centred at an observed wavelength of nm, as well as features shortward of nm, for our adopted blueshift (Fig. 3, see also Extended Data Fig. 3). The restframe wavelengths of the longer wavelength features are 1,000–1,100 nm. It is worth noting that Sr is typically considered an s-process element because only about 30% of the cosmic (solar) abundance is produced by the r-process[18, 19]. For this reason it has not always been considered in kilonova simulations. However, it is one of the more abundant r-process elements, accounting for at least a few percent by mass of all r-process elements[19]. Of all the r-process elements Sr displays by far the strongest absorption features in this region of the spectrum (Extended Data Figs. 2 and 3). The lanthanide elements, and especially Ba, produce strong absorption but only in the optical region shortward of about 650 nm. The spectral features we observe can therefore only be Sr, an element produced near the first r-process peak.
The 810 nm feature was previously proposed[12] to originate in absorption from Cs i and Te i. This identification can be ruled out because neither Cs i nor Te i produce strong lines in a plasma at this temperature (Extended Data Fig. 3). Much stronger lines would be expected from ions of other elements co-produced with Cs (Z=55, e.g. from La ii, see Methods).
The most abundant r-process elements are those in the first peak (Fig. 2), elements with , and of these, it is Sr, Y (Z=39), and Zr (Z=40) that are easily detected in a low density, K thermal plasma, because these elements have low excitation potentials for their singly-charged ions. Seen in this context, the detection of Sr in AT2017gfo is not surprising, in spite of prior expectations that the spectra would be dominated by heavier elements[22, 14]. Furthermore, the atomic levels in Sr that give the absorption lines observed at nm are metastable. Photo-excitation can increase the population in these states, strengthening the nm feature significantly[23] compared to resonance blue/near-ultraviolet absorption lines. Ba and the lanthanide series contribute significantly to the total opacity of r-process material in the optical region of the spectrum (Fig. 3). But we do not detect strong optical features. We cannot, however, easily exclude the presence of elements on this basis. Even if we could exclude the presence of heavier elements in the outer layers of the thermal, expanding cloud, there is no way from these early spectra to exclude that such elements could exist at lower depths or in an obscured component.
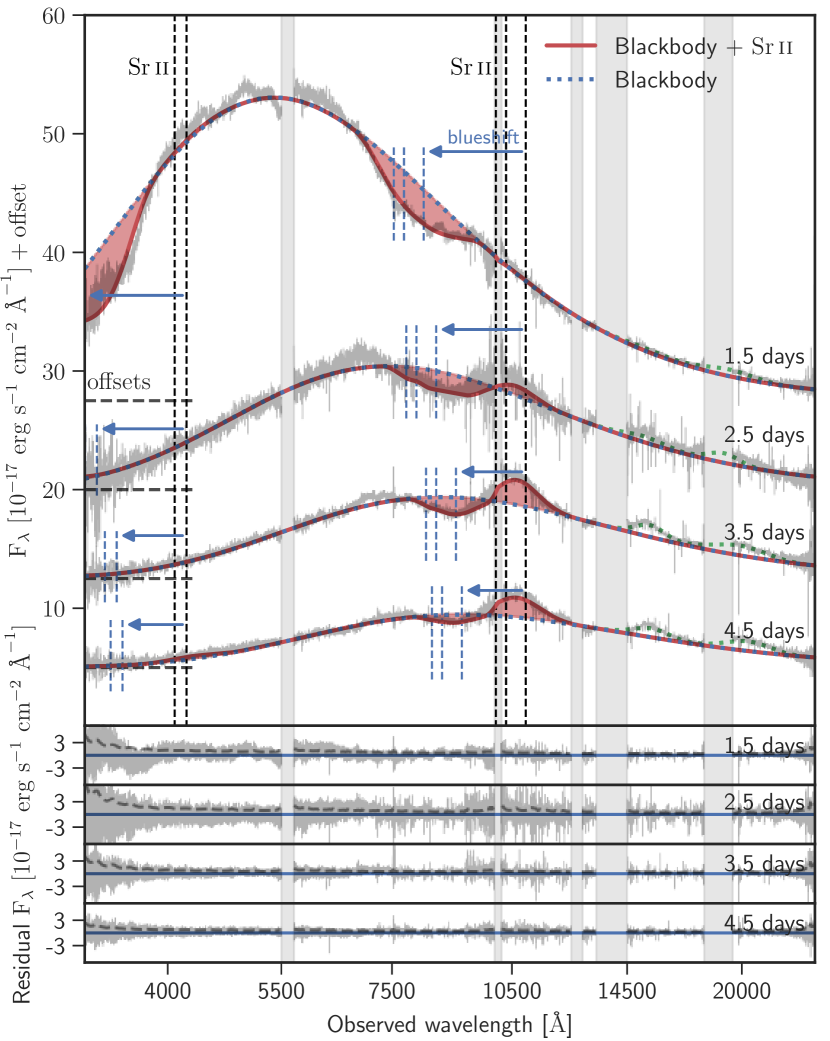
Since a simple r-process abundance LTE model can account well for the first epoch spectrum, we expand it to the subsequent three epochs while the kilonova is still at least partially blackbody-like. With a freely expanding explosion we expect to begin observing P Cygni lines once the outer absorbing ‘atmosphere’ begins to become more optically thin and attain a significant physical radius with respect to the photospheric radius. We fit the first four epochs as a blackbody with P Cygni lines from Sr. We fit only the strongest lines to reduce our computational time to a manageable level, as these lines provide most of the opacity at these wavelengths. These fits are shown in Fig. 4 and offer a compelling reproduction of the spectra at all three epochs. The P Cygni model has free parameters for the velocities of the photosphere and atmosphere, which change the shape of the profile. The fit is remarkable given its simplicity and our lack of knowledge of the system geometry. We note that P Cygni emission components are always centred close to the rest wavelength of the spectral lines, so the observed wavelength of the emission line is not a free parameter. The most prominent emission component observed throughout the spectral series is centred close to 1,050 nm, and the weighted restframe centre of the near-infrared lines from Sr is also 1,050 nm. This adds to our confidence in the line identification based on the simple thermal r-process absorption model.
We further confirm our results using TARDIS, extending the code’s atomic database to include elements up to 92U with the latest Kurucz linelists[24] with its 2.31 million lines. Our TARDIS models produce results very similar to our static-code models, reproducing the spectra well (Extended Data Fig. 6). In particular, the P Cygni emission/absorption structure is well-reproduced as expected, confirming our LTE and MOOG modelling, and showing Sr dominating the features around m.
From the detection of Sr, it is clearly important to consider lighter r-process elements in addition to the lanthanide elements in shaping the kilonova emission spectrum. Observations of abundances in stars in dwarf galaxies[6] suggest that large amounts of Sr are produced together with Ba (Z=56) in infrequent events, implying the existence of a site that produces both light and heavy r-process elements together in quantity, as found in some models[25, 26]. This is consistent with our spectral analysis of AT2017gfo and analyses of its lightcurve[27, 28]. Together with the differences observed in the relative abundances of r-process Ba and Sr in stellar spectra[29], this suggests that the relative efficiencies of light and heavy r-process production could vary substantially from merger to merger.
Extreme-density stars composed of neutrons were proposed shortly after the discovery of the neutron[13], and identified with pulsars three decades later[30]. However, no spectroscopic confirmation of the composition of neutron stars has ever been made. The identification here of an element that could only have been synthesised so quickly under an extreme neutron flux, provides the first direct spectroscopic evidence that neutron stars comprise neutron-rich matter.
References
- [1] Burbidge, E. M., Burbidge, G. R., Fowler, W. A. & Hoyle, F. Synthesis of the Elements in Stars. Rev. Mod. Phys. 29, 547–650 (1957).
- [2] Siegel, D. M., Barnes, J. & Metzger, B. D. Collapsars as a major source of r-process elements. Nature 569, 241–244 (2019).
- [3] Lattimer, J. M., Mackie, F., Ravenhall, D. G. & Schramm, D. N. The decompression of cold neutron star matter. Astrophys. J. 213, 225–233 (1977).
- [4] Eichler, D., Livio, M., Piran, T. & Schramm, D. N. Nucleosynthesis, neutrino bursts and gamma-rays from coalescing neutron stars. Nature 340, 126–128 (1989).
- [5] Freiburghaus, C., Rosswog, S. & Thielemann, F.-K. R-Process in Neutron Star Mergers. Astrophys. J. Lett. 525, L121–L124 (1999).
- [6] Ji, A. P., Frebel, A., Simon, J. D. & Chiti, A. Complete Element Abundances of Nine Stars in the r-process Galaxy Reticulum II. Astrophys. J. 830, 93 (2016).
- [7] Metzger, B. D. et al. Electromagnetic counterparts of compact object mergers powered by the radioactive decay of r-process nuclei. Mon. Not. R. Astron. Soc. 406, 2650–2662 (2010).
- [8] Barnes, J. & Kasen, D. Effect of a High Opacity on the Light Curves of Radioactively Powered Transients from Compact Object Mergers. Astrophys. J. 775, 18 (2013).
- [9] Tanvir, N. R. et al. A ‘kilonova’ associated with the short-duration -ray burst GRB 130603B. Nature 500, 547–549 (2013).
- [10] Abbott, B. P., Abbott, R. & et al. GW170817: Observation of Gravitational Waves from a Binary Neutron Star Inspiral. Physical Review Letters 119, 161101 (2017).
- [11] Pian, E. et al. Spectroscopic identification of r-process nucleosynthesis in a double neutron-star merger. Nature 551, 67–70 (2017).
- [12] Smartt, S. J. et al. A kilonova as the electromagnetic counterpart to a gravitational-wave source. Nature 551, 75–79 (2017).
- [13] Baade, W. & Zwicky, F. Cosmic Rays from Super-novae. Proceedings of the National Academy of Science 20, 259–263 (1934).
- [14] Tanaka, M. & Hotokezaka, K. Radiative Transfer Simulations of Neutron Star Merger Ejecta. Astrophys. J. 775, 113 (2013).
- [15] Kasen, D., Metzger, B., Barnes, J., Quataert, E. & Ramirez-Ruiz, E. Origin of the heavy elements in binary neutron-star mergers from a gravitational-wave event. Nature 551, 80–84 (2017).
- [16] Sneden, C., Bean, J., Ivans, I., Lucatello, S. & Sobeck, J. MOOG: LTE line analysis and spectrum synthesis. Astrophysics Source Code Library (2012).
- [17] Kerzendorf, W. E. & Sim, S. A. A spectral synthesis code for rapid modelling of supernovae. Mon. Not. R. Astron. Soc. 440, 387–404 (2014).
- [18] Lodders, K., Palme, H. & Gail, H.-P. Abundances of the Elements in the Solar System. Landolt Börnstein (2009). 2011 update arxiv:0901.1149v2.
- [19] Bisterzo, S., Travaglio, C., Gallino, R., Wiescher, M. & Käppeler, F. Galactic Chemical Evolution and Solar s-process Abundances: Dependence on the 13C-pocket Structure. Astrophys. J. 787, 10 (2014).
- [20] Honda, S., Aoki, W., Ishimaru, Y. & Wanajo, S. Neutron-Capture Elements in the Very Metal-poor Star HD 88609: Another Star with Excesses of Light Neutron-Capture Elements. Astrophys. J. 666, 1189–1197 (2007).
- [21] Sneden, C. et al. Evidence of Multiple R-Process Sites in the Early Galaxy: New Observations of CS 22892-052. Astrophys. J. Lett. 533, L139–L142 (2000).
- [22] Kasen, D., Badnell, N. R. & Barnes, J. Opacities and spectra of the r-process ejecta from neutron star mergers. Astrophys. J. 774, 25 (2013).
- [23] Jeffery, D. J. & Branch, D. Analysis of Supernova Spectra. In Wheeler, J. C., Piran, T. & Weinberg, S. (eds.) Supernovae, Jerusalem Winter School for Theoretical Physics, 149 (1990).
- [24] Kurucz, R. L. Including all the lines: data releases for spectra and opacities. Canadian Journal of Physics 95, 825–827 (2017).
- [25] Wanajo, S. et al. Production of All the r-process Nuclides in the Dynamical Ejecta of Neutron Star Mergers. Astrophys. J. Lett. 789, L39 (2014).
- [26] Just, O., Bauswein, A., Pulpillo, R. A., Goriely, S. & Janka, H.-T. Comprehensive nucleosynthesis analysis for ejecta of compact binary mergers. Mon. Not. R. Astron. Soc. 448, 541–567 (2015).
- [27] Drout, M. R. et al. Light curves of the neutron star merger GW170817/SSS17a: Implications for r-process nucleosynthesis. Science 358, 1570–1574 (2017).
- [28] Tanvir, N. R. et al. The Emergence of a Lanthanide-rich Kilonova Following the Merger of Two Neutron Stars. Astrophys. J. Lett. 848, L27 (2017).
- [29] Hansen, C. J., Montes, F. & Arcones, A. How Many Nucleosynthesis Processes Exist at Low Metallicity? Astrophys. J. 797, 123 (2014).
- [30] Hewish, A., Bell, S. J., Pilkington, J. D. H., Scott, P. F. & Collins, R. A. Observation of a Rapidly Pulsating Radio Source. Nature 217, 709–713 (1968).
0.1 Spectral synthesis
Different codes were used to compute synthetic absorption spectra. We used MOOG[16, 2] v. 2014, and our own single temperature and density LTE code. In addition, we verified our results using the TARDIS supernova spectral synthesis code. For the first two codes we used line lists gathered from the literature. These line lists can be seen in Supplementary Data 1. For the TARDIS modelling we used the line lists of Kurucz. Our codes yield consistent results with the different line lists.
MOOG is a synthetic spectrum code normally used to generate synthetic absorption spectra of photospheres in cool stars under the assumption of local thermodynamic equilibrium. It requires a model atmosphere that dictates how temperature, gas pressure, and electron density behave in different layers of the surface gas. Here we adopt Kurucz model atmospheres[3]. The second requirement is a line list containing the rest wavelength of the absorption transition, the element or ion in which the transition takes place, the excitation potential of the lower level, and the oscillator strength. The atomic data are based on refs. [4, 5, 6, 7, 8, 9, 10] with updates from NIST. The strength of the absorption features are calculated solving radiative transfer equations with a plane parallel treatment of the atmospheres, assuming that the velocity distribution is Maxwellian, and that excitations and ionisations are described by the Boltzmann and Saha equations, respectively. The line/wing damping follows a scaled Unsöld approximation and the source function follows a simple black body while scattering (on H, He, and ) enters mainly through opacity terms.
Our own code assumes only a gas in LTE without scattering, and that the Boltzmann and Saha equations can be used to get the ionisation and excitation state of each element individually. We then use the line lists above and level information from NIST to determine the relative strengths of the lines. We adopted a fiducial electron density of , based on the mean density of of singly-ionized material in a sphere with the area of the best-fit blackbody. The density of the atmosphere is almost certainly lower than this.
To make sure the MOOG models and our LTE calculations are reasonably comparable, for the MOOG models an effective temperature at the surface of the photosphere of T K and a surface gravity of following temperature and density profiles in Kurucz model atmospheres, give rise to a temperature of 3,800 K and an electron density of cm-3 within the photosphere. Absorption lines from lanthanide ions are believed to be an important source of opacity due to transitions with unknown oscillator strengths. For an LTE plasma, it is likely that such lines are important and create a complex continuum[22, 15]. However, the lanthanide opacity is extremely high in the ultraviolet and blue regions of the spectrum. The fact that we detect blue emission in the spectrum of AT2017gfo is already a strong indication that lanthanide elements do not dominate the early continuum spectrum, as suggested by other authors[11, 12]. Furthermore, the infrared feature arises from levels that may be overpopulated due to optical pumping, enhancing the strength of this feature further with respect to the line-generated continuum at these wavelengths.
Synthetic spectra are generated using both codes based on line lists containing r-process elements, and which are capable of producing strong features in an LTE plasma at these temperatures. We include all elements from 33As up to 83Bi as well as 90Th and 92U. We do not include the elements 35Se, 36Br, 37Kr, 53I, or 54Xe as they produce no strong or moderate lines at these temperatures and are rarely detected in stellar spectra[13]. These elements have first excitation energies above 5.97 eV for their neutral and singly charged ions, giving a fractional population at our fiducial temperature. Neither do we include elements with no stable isotopes (43Tc and 61Pm), nor any molecules. The absorption line profiles are dominated by the velocity and density distribution of the expanding atmosphere.
Our line lists contain the strongest lines for LTE spectra at these temperatures. Since we are interested in finding strong, isolated lines, this procedure should effectively capture all lines that could realistically be candidates.
0.2 Could large numbers of weak lines dominate the optical/NIR opacity?
The opacity of the kilonova is dominated by absorption lines. The list of lines we use for MOOG (see references above) has most of the strong lines in common with the Kurucz list[14] we use for the TARDIS modelling. The results we retrieve from the different techniques and line lists are a useful check on the robustness of the modelling methodologies. Both methods yield consistent results, indicating that the overall result presented here is robust to the selection of the specific line list and the modelling method chosen. We note that a feature at about 810 nm is also produced in the spectral synthesis analysis of ref. [14], where lists comprising known lines are also used. This feature (M. Tanaka, private communication) is produced primarily by the same Sr ii lines we identify in this work.
The major caveat in identifying line features is the possibility that missing lines could significantly influence the broad spectral shape compared to what is predicted from known lines. Of particular concern are the large numbers of unknown lines from the lanthanide elements that are likely to dominate the line-expansion opacity[22, 15]. While we argue here that our line lists are reasonably complete in strong lines at these temperatures and densities (and since they are used for modelling stars with similar temperatures and densities, this makes sense), it is possible that a very large number of weaker lines could contribute.
However, the line-forming region of the kilonova is likely to be physically extended, covering a significant fraction of the kilonova radius, particularly in the near-infrared. The presence of a P Cygni profile at m supports that a substantial volume (though not mass) of the kilonova must be substantially optically thin at this wavelength. The mass absorption coefficient of the Sr ii lines at m peaks at about cmg-1 for lines with FWHM, a temperature of K and a density of . This is at least two orders of magnitude higher than the mean value for lanthanides such as Ce and Nd in the optically-thin limit using the Kurucz line lists. Given that the line lists for these elements are likely to be very incomplete at these wavelengths, we extrapolate the value of the Ce line opacity of the VALD lines at 9,000 Å to m, which should give a similar opacity to the line lists calculated in ref. [22] with the autostructure code. When the lines are extremely optically thick, within the bulk of the kilonova in the first days, the Ce opacity is about cmg-1 (cf. ref. [22]). In the optically-thin regime in the outer layers, the Ce line opacity rises about two orders of magnitude. Using this optically-thin extrapolation of the Ce lines, the Sr ii opacity is still a factor of 4–5 higher, not including abundance effects that are likely to make the Sr line stronger still. We show an example of this effect by calculating the expansion opacity for a low optical depth plasma in Extended Data Fig. 5. That calculation is purely illustrative, showing how the Sr lines can dominate the opacity when the gas has low optical depth. For a self-consistent model calculation, see the TARDIS model spectra in Extended Data Fig. 6.
0.3 Spectral modelling
What appears as two separate emission components are identified in the spectra. First, a nearly blackbody spectrum modified by absorption features, that appears to cool over time. Second, an emission component at redder wavelengths that increases in strength relative to the first component with time. These two components do not necessarily arise due to discrete ejection mechanisms, but may reflect that different parts of the spectrum probe different physical depths and thus physical conditions, through the wavelength-dependent expansion opacity[16, 17]. Here we focus only on the thermal component in the blue part of the spectrum and model it as a blackbody with an extended envelope. We model the second component with Gaussian emission lines in order not to bias the overall continuum fit at shorter wavelengths, but do not interpret them. However, these features clearly provide important information on the composition of the plasma and must be addressed in future studies.
The expansion velocity of the gas can be inferred from the expansion of the blackbody from the time of the explosion. Due to the optical thickness of a blackbody, we would only be presented with the front face of the explosion. Consequently, pure absorption features in the spectrum should be blueshifted by the mean Doppler shift induced by the expansion speed of the gas. Conservatively, we allow 0.1–0.3 as the range of the blueshift[11, 18, 19], which depends on the details of the geometry of the system and thus restrict our search for lines in the first epoch to rest wavelengths of 350 nm and 810 nm 1.1–1.3.
At the densities of the ejecta, the dominant source of opacity is expansion opacity[22, 15]. This effect is able to establish an apparent thermalisation through photo-equilibration of the states[20]. With wavelength-dependent opacity, the physical depth traced at each wavelength varies. Because the large majority of lines are in the blue end of the spectrum, the expansion opacity there will be higher and, conversely, the physical depth shallower. This causes the relative strength of UV/near-infrared lines to change compared to the pure LTE transmission values, with bluer absorption lines less prominent relative to near-infrared ones. Additionally, because the population of states is photo-equilibrated, metastable states will be enhanced relative to non-metastable, as compared to LTE values[23]. It is therefore impossible, primarily due to the strongly wavelength-dependent opacity, to use a simple comparison of LTE line-strengths across very different wavelengths. Instead, we use independent optical depth parameters () for the two absorption feature fits here. We also use the TARDIS code (see below) to achieve a more self-consistent treatment with moving atmosphere, line-expansion opacity, which shows the simultaneous presence of the and m Sr ii features.
0.4 P Cygni modelling
The expansion velocity of the photosphere is very high (0.2–0.3). At the measured temperature of the photosphere, the thermal widths of individual lines are very narrow compared to the gross velocity structure. This means that the resonance region is very small and the Sobolev approximation can be used in the Elementary Supernova (ES) model as a prescription for the absorption structure near isolated lines[23]. We use the implementation of the P Cygni profile in the ES from https://github.com/unoebauer/public-astro-tools, where the profile is parametrized in terms of the rest wavelength, , the optical depth of the line, , two scaling velocities for the radial dependence of , the photospheric velocity, and the maximal velocity of the ejecta. The latter two parameters specify the velocity stratification. The expansion velocity of the photosphere is simultaneously used for the relativistic Doppler correction to the blackbody temperature. Additionally, because the implementation of the P Cygni profile we are using does not include the relative population of the states in the transition, we have included a parameter for enhancement/suppression of the P Cygni emission component.
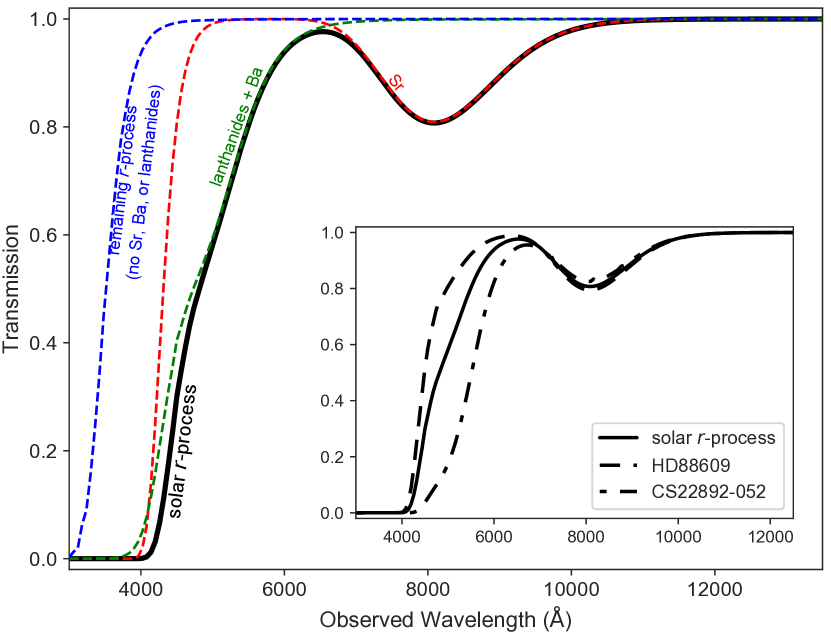
For practical reasons, we cannot fit all lines simultaneously. However, fortunately, a handful of lines provide most of the opacity. Because the relative opacity dictates the apparent strengths of the lines, we divide the spectrum into ultraviolet/blue and red/infrared regions to find the lines that will be strongest in their respective spectral region. We do this because the opacity changes so severely from the infrared to the optical (Fig. 3). We make the division at 600 nm where the opacity increases sharply, however choosing 550 nm or 700 nm makes no difference. We then include the strongest lines in each region (all lines with a minimum strength of 20% of the strongest line). The resultant lines are the strong resonance lines from the ground state of Sr ii at 407.771 and 421.552 nm, and the lines from the Sr ii 4p64d metastable states at 1,032.731, 1,091.489, and 1,003.665 nm. These lines are all modelled using the same P Cygni profile prescription, where the relative strengths of each of the lines in the two absorption complexes are set by the LTE relations, and in spite of the relative simplicity of the analysis, provides a surprisingly good fit to the data.
The final model we use to fit the spectrum is a relativistically-corrected blackbody photosphere absorbed by an expanding atmosphere, containing the five above-mentioned Sr ii transitions, described by independent optical depths for the infrared and ultraviolet lines. The ratios of the lines internally in each set are defined by their LTE strengths. In the fitting model we also use two additional Gaussian emission lines at long wavelengths from the second emission component in order not to bias the long wavelength continuum fit. The best fit parameters and their associated errors are found by sampling the posterior probability distributions of the parameters, assuming flat priors on all parameters. The fitting framework used is LMFIT[21] and the sampling is done using emcee[22]. We initiate 100 samplers, each sampling for 1,000 steps. We discard the first 100 steps as a burn-in phase of the MCMC chains. We use the median of the marginalized posterior probability distribution as the best-fit values, and the 16th and 84th percentiles as the uncertainties. The best-fit models are shown in Fig. 4. The objective function, being highly non-linear, causes the posterior probability distributions to be highly complex and thus the best-fit values difficult to optimize. However, the peak of the distributions are well centered, meaning the best-fit values are well constrained, regardless of the posterior probability distribution complexity.
0.5 Expansion velocity evolution
The fits constrain two independent parameters that can be used to infer the velocity of the ejected material. The photospheric expansion velocity used to determine the width of the P Cygni line profile and the blackbody radius, which scales with the square root of the observed luminosity and can be converted to an expansion velocity based on the time of observation. These two parameters are uncorrelated, as supported by the MCMC posterior probability function samples, and therefore constitute two independent measurements of the same physical quantity. We show a plot of the evolution of these two parameters in Extended Data Fig. 4. The correspondence between the two estimates of the expansion velocity is striking, especially given that the ratio of the estimates is geometry-dependent, and we have assumed only simple spherical symmetry here. Only the first epoch shows a somewhat discrepant value, and there we expect a P Cygni model not to be entirely applicable. This close correspondence between the two independent measures and the reasonable values inferred further supports the validity of the line identification and the overall model.
0.6 TARDIS modelling
TARDIS[17] is a Monte Carlo radiative-transfer spectral synthesis code, where photons are essentially propagated through an expanding atmosphere. Each photon will at any point have a probability of being absorbed by an atomic transition, based on the wavelength of the photon, strength of the line, and density of atomic species and electron population. A synthetic spectrum can then be constructed by collecting the emergent photons.
To generate the synthetic spectra with TARDIS, we set up the physical models using the inferred photospheric expansion velocities at the observed epochs. For homologously expanding ejecta, the velocity of the atmosphere layers are at all times specified by the outer edge expansion and the photospheric expansion. We use the measured photospheric expansion velocity as the inner expansion velocity and select the outer atmospheric velocity such that the bluest edge of the developed absorption profiles in the synthetic spectra match the observed ones. Currently, TARDIS only supports spherically symmetric explosions, so for simplicity, we adopt this geometry. The kilonova ejecta are in most cases likely to be asymmetric, due to the preferential motion of the mass in the plane of the orbit of the two neutron stars. The neglect of deviation from spherical symmetry most likely affects the absorption profiles and the inferred mass in the atmosphere, as we could potentially only be seeing ejecta in a cone. Additionally, TARDIS assumes a single photospheric velocity across the entire wavelength range. Due to the strong wavelength dependence of the opacity, as discussed earlier, the depth at which the photons escapes varies across the spectral coverage. Therefore, the same reservations about inferring the mass in a given shell at a given wavelength applies to the TARDIS simulations. This can be seen in effect when choosing an ejecta density that matches the absorption feature at nm, because then the strength of the nm absorption feature is significantly overpredicted. Conversely, selecting an ejecta density that matches the nm absorption feature underpredicts the strength of the nm absorption.
At each epoch, the temperature of the photosphere is chosen so that an atmosphere with no lines returns a blackbody-like spectrum which is similar to the best-fit blackbody found in simple P Cygni model fits. Both the excitation and ionization structure of the elements in the atmosphere are set according to LTE where we assume for simplicity a constant temperature throughout the atmosphere. This approach does not capture optical pumping of metastable states and other non-LTE effects that will change the population of the upper levels.
For the input abundances, we use the solar r-process abundance ratio as shown in Fig. 2, starting from 31Ga. We run the simulation in three steps, consecutively including heavier elements. For the first set of simulations, we include only the elements from 31Ga to 37Rb and, as can be seen in Fig. 2, no lines cause a significant deviation from a pure blackbody. Next we include 38Sr which forms the strong feature observed centred at nm in the first epoch, almost exclusively due to the three strong Srii lines at m. Last we run the same simulation, including all elements from 31Ga to 92U. The feature at nm is unaffected by the inclusion of the heavier elements.
For the density, we initially adopt a power-law density structure of the ejecta, parametrized in terms of velocity and epoch: . We find that the line shapes depend on the assumed slope, where for steeper slopes, a larger fraction of the line absorption is closer to the line centre. We specify a density profile of , as is used in ref. [23], as this supported by the theoretical models and seem to reproduce the absorption profiles relatively well. As also investigated in[15], there is some freedom in the choice of slope, as it is not well constrained from a modelling perspective and could have different values depending on the matter ejection mechanism.
Adopting a single across all four epochs, with a , does not yield synthetic spectra that match the observed spectra well around the nm 38Sr absorption feature across the epochs. If is chosen to reproduce the strength of the 38Sr absorption feature of the first epoch, the strength of the absorption feature is significantly overpredicted in the later epochs using the same composition and assuming homology; the ejecta density has to be scaled down by a factor of 5 in the subsequent epochs to match the spectrum. In other words, the observed mass of Sr in the optically thin part of the spectrum inferred from the TARDIS model for the first epoch spectrum appears to be significantly larger than for the later epochs. Specifically, atmosphere masses of , , , and of 38Sr are required to reproduce the observed absorption feature at nm for the first four epochs respectively.
These numbers should be treated with some caution as this is the derived mass assuming spherical symmetry, a fixed photospheric velocity, and no correction for light travel time effects. They must be interpreted as lower limits to the total amount of material ejected, as they only trace the matter between the photospheric front and the outer atmosphere. Using the assumed solar abundances, these masses correspond to this atmosphere having approximately 1% of the total ejecta mass inferred from lightcurve modelling[15].
The TARDIS models additionally constrain the amount of the heavier r-process elements present in the outer, transparent layers of the ejecta. Using the solar r-process abundances with the inclusion of the heaviest elements, the TARDIS synthetic spectra exhibit almost continuous absorption up to , which is not seen in the observed spectra. This point was also touched upon earlier. The exact limit on the amount of heavy r-process material in the outer layers is difficult to infer accurately, based on the simple models used, but our modelling indicates that the ratio of heavy to light element abundance in this layer is significantly lower than the solar r-process ratio. This conclusion is consistent with the inference made by other authors on the basis of the early blue colour of the continuum spectrum[11, 12].
The inability of a single composition and density to reproduce the spectra across the first four epochs may hint at a change in the elemental abundance ratios as the photosphere recedes further into the ejecta.
The TARDIS models demonstrate that an isolated feature observed at nm can be produced by Sr and that no other known lines form this feature. Additionally, the models hint at a possible variation in the abundances as the deeper layers of the ejecta component are exposed, in line with what is suggested by some models of NS mergers[24].
0.7 Exclusion of the Cs i and Te i identification
The Cs I 6s–6p resonance transitions[12] would of course require Cs I to be present in the gas. But because Cs has the lowest first ionisation potential of any element, the singly-charged ions of other elements inevitably synthesised with Cs[1], such as La ii, Eu ii, and Gd ii, are millions of times more abundant than Cs i in an LTE plasma at close to the observed blackbody temperatures. This problem is even worse at temperatures that produce significant strong lines from Te i. These other elements will cause absorption lines that are at least two orders of magnitude stronger in the same wavelength region as the proposed Cs and Te lines, e.g. the 706.62 nm, 742.66 nm, or 929.05 nm lines of La ii, Eu ii, and Gd ii respectively, to name one of each. The same argument holds for the excited state transition of Te i which has a very high excitation energy of 5.49 eV; the relative population of the Te i excited state is extremely low, less than . Thus, no realistic scenario exists in which either of these lines can be detected without orders of magnitude stronger lines from other elements dominating.
References
- [1]
- [2] MOOG spectral synthesis code. https://www.as.utexas.edu/~chris/moog.html.
- [3] Castelli, F. & Kurucz, R. L. New Grids of ATLAS9 Model Atmospheres. arXiv Astrophysics e-prints (2004).
- [4] Biémont, E. & Quinet, P. Recent Advances in the Study of Lanthanide Atoms and Ions. Physica Scripta Volume T 105, 38 (2003).
- [5] Den Hartog, E. A., Lawler, J. E., Sneden, C. & Cowan, J. J. Improved Laboratory Transition Probabilities for Nd II and Application to the Neodymium Abundances of the Sun and Three Metal-poor Stars. Astrophys. J. Suppl. 148, 543–566 (2003).
- [6] Lawler, J. E., Bonvallet, G. & Sneden, C. Experimental Radiative Lifetimes, Branching Fractions, and Oscillator Strengths for La II and a New Determination of the Solar Lanthanum Abundance. Astrophys. J. 556, 452–460 (2001).
- [7] Lawler, J. E., Wickliffe, M. E., den Hartog, E. A. & Sneden, C. Improved Laboratory Transition Parameters forEu II and Application to the Solar Europium Elemental and Isotopic Composition. Astrophys. J. 563, 1075–1088 (2001).
- [8] Lawler, J. E., Wickliffe, M. E., Cowley, C. R. & Sneden, C. Atomic Transition Probabilities in Tb II with Applications to Solar and Stellar Spectra. Astrophys. J. Suppl. 137, 341–349 (2001).
- [9] Lawler, J. E., Den Hartog, E. A., Sneden, C. & Cowan, J. J. Improved Laboratory Transition Probabilities for Sm II and Application to the Samarium Abundances of the Sun and Three r-Process-rich, Metal-poor Stars. Astrophys. J. Suppl. 162, 227–260 (2006).
- [10] Sneden, C., Lawler, J. E., Cowan, J. J., Ivans, I. I. & Den Hartog, E. A. New Rare Earth Element Abundance Distributions for the Sun and Five r-Process-Rich Very Metal-Poor Stars. Astrophys. J. Suppl. 182, 80–96 (2009).
- [11] McCully, C. et al. The Rapid Reddening and Featureless Optical Spectra of the Optical Counterpart of GW170817, AT 2017gfo, during the First Four Days. Astrophys. J. Lett. 848, L32 (2017).
- [12] Chornock, R. et al. The Electromagnetic Counterpart of the Binary Neutron Star Merger LIGO/Virgo GW170817. IV. Detection of Near-infrared Signatures of r-process Nucleosynthesis with Gemini-South. Astrophys. J. Lett. 848, L19 (2017).
- [13] Sneden, C., Cowan, J. J. & Gallino, R. Constraints on the Nature of the s- and r-processes. In Cunha, K., Spite, M. & Barbuy, B. (eds.) Chemical Abundances in the Universe: Connecting First Stars to Planets, vol. 265 of IAU Symposium, 46–53 (2010).
- [14] Kurucz line list. http://kurucz.harvard.edu/linelists/gfnew/gfall08oct17.dat.
- [15] Tanaka, M. et al. Properties of Kilonovae from Dynamical and Post-merger Ejecta of Neutron Star Mergers. Astron. Astrophys. 852, 109 (2018).
- [16] Karp, A. H., Lasher, G., Chan, K. L. & Salpeter, E. E. The opacity of expanding media - The effect of spectral lines. Astrophys. J. 214, 161 (1977).
- [17] Barnes, J. & Kasen, D. Effect of a high opacity on the light curves of radioactively powered transients from compact object mergers. Astrophys. J. 775, 18 (2013).
- [18] Shappee, B. J. et al. Early Spectra of the Gravitational Wave Source GW170817: Evolution of a Neutron Star Merger. ArXiv e-prints (2017).
- [19] Waxman, E., Ofek, E., Kushnir, D. & Gal-Yam, A. Constraints on the ejecta of the GW170817 neutron-star merger from its electromagnetic emission. ArXiv e-prints (2017).
- [20] Pinto, P. A. & Eastman, R. G. The Physics of Type IA Supernova Light Curves. II. Opacity and Diffusion. Astrophys. J. 530, 757–776 (2000).
- [21] Newville, M. et al. Lmfit: Non-Linear Least-Square Minimization and Curve-Fitting for Python. Astrophysics Source Code Library (2016).
- [22] Foreman-Mackey, D., Hogg, D. W., Lang, D. & Goodman, J. emcee: The MCMC Hammer. Proc. Ast. Soc. Pacific 125, 306 (2013).
- [23] Tanaka, M. et al. Kilonova from post-merger ejecta as an optical and near-Infrared counterpart of GW170817. Proc. Ast. Soc. Japan 69, 102 (2017).
- [24] Perego, A. et al. Neutrino-driven winds from neutron star merger remnants. Mon. Not. R. Astron. Soc. 443, 3134–3156 (2014).
- [25] Sneden, C. et al. The Extremely Metal-poor, Neutron Capture-rich Star CS 22892-052: A Comprehensive Abundance Analysis. Astrophys. J. 591, 936–953 (2003).
We thank Masaomi Tanaka for revisiting his previous analysis for us and for access to his spectra and line lists. We thank Jens Hjorth and Nanda Rea for useful discussions. We thank the ESO Director General for allocating Discretionary Time to this programme and the ESO operation staff for excellent support. DW, DBM, and JS are supported in part by Independent Research Fund Denmark grant DFF - 7014-00017. The Cosmic Dawn Center is funded by the Danish National Research Foundation. AA is supported by the European Research Council through ERC Starting Grant No. 677912 EUROPIUM. AB is supported by the European Research Council through ERC Starting Grant No. 759253 GreatMoves and by the Sonderforschungsbereich SFB 881 “The Milky Way System” (subproject A10) of the German Research Foundation (DFG) and acknowledges support by the Klaus Tschira Foundation. SC acknowledges partial funding from Agenzia Spaziale Italiana-Istituto Nazionale di Astrofisica grant I/004/11/3. GL is supported by a research grant (19054) from Villum Fonden. KEH acknowledges support by a Project Grant (162948–051) from The Icelandic Research Fund. AJL acknowledges funding from the European Research Council under grant agreement No. 725246, and from STFC via grant number ST/P000495/1. EP acknowledges funding from ASI INAF grant I/088/06/0, and from INAF project: ‘Gravitational Wave Astronomy with the first detections of aLIGO and aVIRGO experiments’
DW, CJH, and JS were the primary drivers of the project; AK, DBM, JPUF, and ACA were involved in important discussions developing the understanding of the physical processes. All authors contributed to discussions and editing the paper. DW did the initial blackbody with absorber fits to the first epoch spectrum and created Figs. 1 and 3, and Extended Data Figs. 3 and 5, made the initial line identification, recognised the P Cygni profiles in the later epochs, wrote the LTE code, and was the primary author of the main text. CJH computed the initial models and synthetic spectra with MOOG, and generated the MOOG spectra for HD 88609 and CS 22892052. CJH and AK produced the MOOG spectra from 3000–20 000 Å for the kilonova template photosphere for all heavy elements. CJH wrote related sections on MOOG spectrum synthesis and significant parts of the text on nucleosynthesis. AK provided the line lists. JS reduced and processed all the X-shooter data, produced the P Cygni fitting codes and fit the P Cygni profiles to all epochs, as well as extending the TARDIS code to include the Kurucz linelists and implemented the TARDIS modelling. JS also produced Fig. 4 and Extended Data Figs. 1, 2, and 6, wrote the related methods sections and a significant part of the main text.
Reprints and permissions information is available at www.nature.com/reprints. The authors declare no competing financial interests. Correspondence and requests for materials should be addressed to D. W. (darach@nbi.ku.dk).
Work in this paper was based on observations made with ESO Telescopes at the Paranal Observatory under programmes 099.D-0382 (PI: E. Pian), 099.D-0622 (PI: P. D’Avanzo), 099.D-0376 (PI: S. J. Smartt), and 099.D-0191 (PI: A. Grado).
![[Uncaptioned image]](/html/1910.10510/assets/x5.png)
![[Uncaptioned image]](/html/1910.10510/assets/x6.png)
![[Uncaptioned image]](/html/1910.10510/assets/x7.png)
![[Uncaptioned image]](/html/1910.10510/assets/x8.png)
![[Uncaptioned image]](/html/1910.10510/assets/ED_fig5.jpg)