Cross section of -induced reactions on 197Au at sub-Coulomb energies
Abstract
- Background
-
Statistical model calculations have to be used for the determination of reaction rates in large-scale reaction networks for heavy-element nucleosynthesis. A basic ingredient of such a calculation is the -nucleus optical model potential. Several different parameter sets are available in literature, but their predictions of -induced reaction rates vary widely, sometimes even exceeding one order of magnitude.
- Purpose
-
This paper presents the result of -induced reaction cross-section measurements on gold which could be carried out for the first time very close to the astrophysically relevant energy region. The new experimental data are used to test statistical model predictions and to constrain the -nucleus optical model potential.
- Method
-
For the measurements the activation technique was used. The cross section of the (,n) and (,2n) reactions was determined from -ray counting, while that of the radiative capture was determined via X-ray counting.
- Results
-
The cross section of the reactions was measured below E MeV. In the case of the 197Au(,2n)199Tl reaction down to 17.5 MeV with 0.5-MeV steps, reaching closer to the reaction threshold than ever before. The cross section of 197Au(,n)200Tl and 197Au(,)201Tl was measured down to E and 14.0 MeV, respectively, with 0.5-MeV steps above the (,2n) reaction threshold and with 1.0-MeV steps below that.
- Conclusions
-
The new dataset is in agreement with the available values from the literature, but is more precise and extends towards lower energies. Two orders of magnitude lower cross sections were successfully measured than in previous experiments which used -ray counting only, thus providing experimental data at lower energies than ever before. The new precision dataset allows us to find the best-fit -nucleus optical model potential and to predict cross sections in the Gamow window with smaller uncertainties.
I Introduction
The elements heavier than iron are mainly produced via neutron capture reactions B2FH57; Kappeler11-RMP; Arnould07-PR. These processes, however, cannot create the so-called -nuclei on the proton-rich side of the valley of stability. The so-called process Rauscher13-RPP is mainly responsible for the production of these isotopes. The process occurs in hot, dense astrophysical plasma environments like in thermonuclear supernovae Nishimura18-MNRAS; Travaglio18-AJ or in core collapse supernovae Woosley78-AJS; Rauscher02-AJ. The -process reaction network involves tens of thousands of reactions on thousands of mainly unstable nuclei, thus the reaction rates have to be predicted in a wide mass and temperature range. For this purpose the Hauser-Feshbach (H-F) statistical model Hauser52-PR using global optical model potentials (OMPs) is widely used. While the nucleon-nucleus OMP (N-OMP) is relatively well known, the predicted reaction rates may vary over one order of magnitude depending on the chosen -nucleus OMP (A-OMP) Kiss13-PRC; Netterdon13-NPA. Recently, several cross-section measurements have been carried out mostly on proton rich isotopes to test the global A-OMPs (e.g., Ozkan07-PRC; Sauerwein11-PRC; Filipescu11-PRC; Netterdon13-NPA; Kiss14-PLB; Simon15-PRC; Yalcin15-PRC; Halasz16-PRC; Scholz16-PLB; Mayer16-PRC; Szucs18-PLB; Korkulu18-PRC; Kiss18-PRC).
In the present work the cross sections of the 197Au(,)201Tl, 197Au(,n)200Tl, and 197Au(,2n)199Tl reactions were measured at energies below the Coulomb barrier, reaching the upper end of the Gamow window for typical temperatures of the process of (where is the temperature in K). The new experimental results are compared to the predictions of several open-access global A-OMPs. Although 197Au is not in the -nuclei mass range, it is only slightly above the heaviest -nucleus 196Hg, thus it can help understanding the systematic in the mass region. Furthermore, experimental studies are facilitated by the mechanical and chemical properties of gold and by the fact that gold is mono-isotopic with the only stable isotope 197Au. The application of the activation technique Gyurky19-EPJA is possible because of the reasonable half-lives of the residual 199Tl, 200Tl, and 201Tl nuclei. However, -ray spectroscopy had to be complemented by X-ray spectroscopy to cover all reactions under study in the present work, and the X-ray decay curves had to followed for a long period to disentangle the contributions of the different reaction channels.
The paper is organized as follows. In sec. II the reactions under investigation will be presented. In sec. III the experimental details will be given, while in sec. IV the data analysis is detailed. The experimental results are summarized in sec. V. In sec. VI the obtained data are compared to statistical model calculation. Finally in sec. VII a summary is given.
| Reaction | Reaction | Half-life | X- or -ray | : Relative | : Multiplicator | Absolute |
| product | (h) | energy (keV) | intensity (%) | for absolute intensity | intensity (%) | |
| (,) | 201Tl | 73.01 0.04 | 70.8 | 44.6 0.6 | ||
| 167.4 | 10.00 0.06 | |||||
| (,n) | 200Tl | 26.1 0.1 | 367.9 | 100 | 0.87 0.06 | 87 6 |
| 579.3 | 15.8 0.8 | 13.7 1.2 | ||||
| 828.3 | 12.4 0.7 | 10.8 1.0 | ||||
| 1205.6 | 34.4 1.9 | 30 3 | ||||
| (,2n) | 199Tl | 7.42 0.08 | 158.4 | 40 2 | 0.124 0.012 | 5.0 0.5 |
| 208.2 | 99 5 | 12.3 1.3 | ||||
| 247.3 | 75 4 | 9.3 1.0 | ||||
| 455.5 | 100 5 | 12.4 1.4 |
II Studied reactions
Gold has only one stable isotope the 197Au, therefore the 100% isotopic purity of the targets is naturally granted. In the energy range investigated here not only radiative capture occurs, but capture can also be followed by one or two neutron emissions111Many more reaction channels - involving mostly emissions - are energetically possible, but they typically have much lower cross sections - because of the Coulomb barrier in the exit channel - than the ones studied in the present work.. All these three reaction channels - detailed below - lead to radioactive nuclei, thus the activation technique can be used to investigate them.
In table 1 the decay parameters of the reaction products are summarized. In the case of the rays the absolute intensities are obtained from the relative intensities and a multiplicator as given in the decay data compilations NDS199; NDS200; NDS201. These are indicated in the table and used in the analysis in order to take the systematic uncertainties correctly into account. In the case of the X ray the absolute intensities per decay is the available quantity in the compilation NDS201.
II.1 197Au(,)201Tl
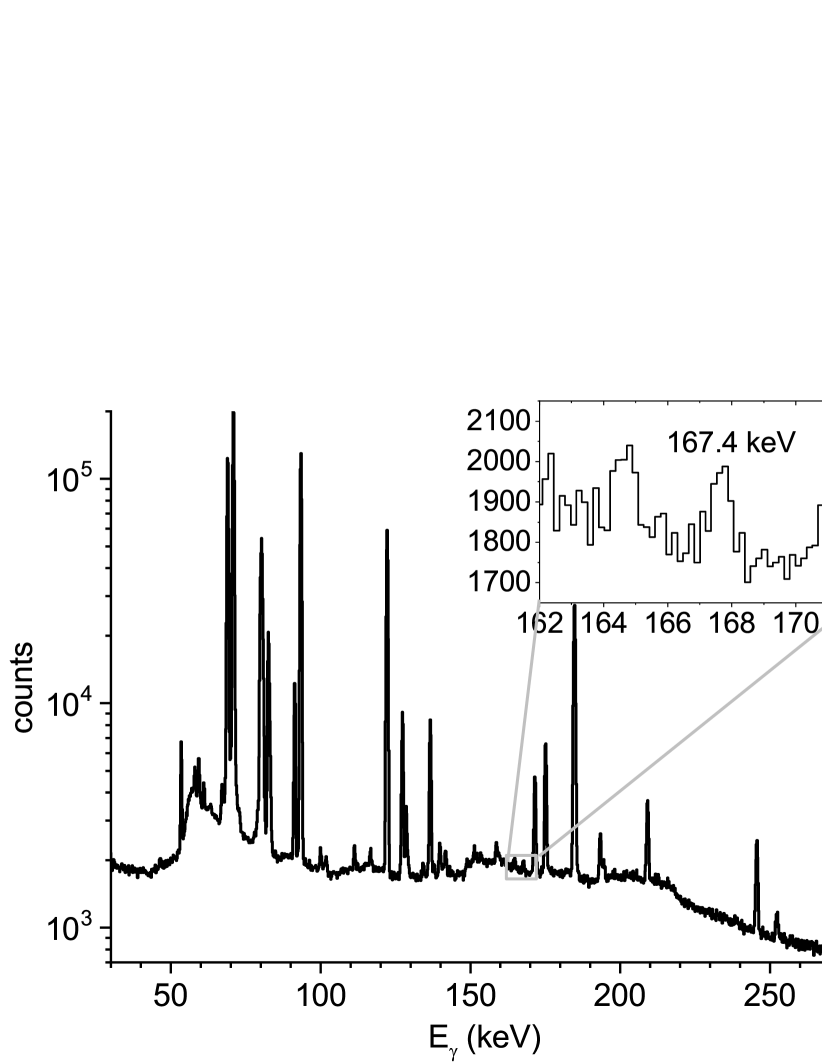
There is only one cross-section dataset for this reaction in the literature by Basunia et al. Basunia07-PRC and several derived upper limits Capurro88-JRNC; Necheva97-ARI; Kulko07-PAN. Even if Capurro et al. Capurro88-JRNC published their data as definite values, they can only be considered as upper limits because of some neglected experimental issues as pointed out by Necheva et al. Necheva97-ARI. The weak transition at 167.4 keV of 201Tl is often buried by the Compton background of the strong 367.9-keV line from the (,n) reaction product. Owing to this difficulty the lowest measured cross-section point prior to our work was at MeV. With the method described in sec. IV.2 we were able to measure two orders of magnitude lower cross sections down to 14 MeV.
II.2 197Au(,n)200Tl
There are many datasets in the literature for this reaction Kurz71-NPA; Calboreanu82-NPA; Capurro85-JRNC; Bhardwaj86-NIMA; Shah95-Pra; Necheva97-ARI; Ismail98-Pra; Kulko07-PAN; Basunia07-PRC. Almost all of these works used the stacked foil technique to measure the reaction cross section at different energies, the only exception is Calboreanu et al. Calboreanu82-NPA. The energy uncertainty for the reported values are much higher than in this work, where thin single targets were used. All the literature data are in agreement within their error bars; however, either the energy or the cross-section uncertainty is large in the energy range where our investigation has been done. Our new dataset has much higher precision, therefore it provides a better constraint on the theoretical models in this energy region.
II.3 197Au(,2n)199Tl
The threshold of the reaction channel with two neutron emission is at MeV. Above this energy the cross section increases rapidly. Most of the previously mentioned studies of the (,n) reaction investigated also this reaction channel, and there are a few others Lanzafame70-NPA; Kurz71-NPA; Calboreanu82-NPA; Capurro85-JRNC; Bhardwaj86-NIMA; Shah95-Pra; Necheva97-ARI; Ismail98-Pra; Kulko07-PAN; Basunia07-PRC. Similarly to the (,n) channel the literature data are in good agreement within their error bars, but they have limited precision. Our new results are much more precise in the whole investigated energy range, and reach closer to the reaction threshold than ever before.
III Experimental details
III.1 Targets
Two types of gold targets were used. Either gold layers with typical thicknesses between 0.1 and 0.3 m evaporated onto thin aluminum foils or self-supporting gold foils with typical thicknesses of m were used. The absolute number of target atoms were measured for each target by at least two of the following four independent methods.
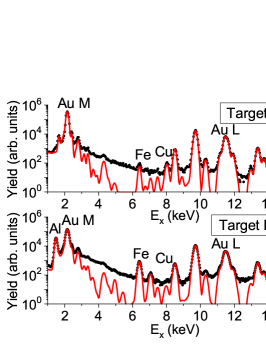
Both types of targets were investigated by proton induced X-ray emission (PIXE) technique Koltay11-HNC. For this purpose the PIXE setup of MTA Atomki installed on the left 45∘ beamline of the 5-MV Van de Graaff accelerator Kertesz10-NIMB was used. A 2-MeV proton beam with about 1- to 3-nA intensity impinged on the targets. Typical PIXE spectra of the two target types can be seen in the left column of fig. 1. The collected spectra were fitted using the GUPIXWIN program code Campbell10-NIMB. The final thickness uncertainty of this method is about 4% including the fit uncertainty and systematic uncertainties concerning the geometry of the setup and the accuracy of the charge measurement. Besides the thickness determination, the PIXE method allows trace impurity identification in the targets. The self-supporting foils contain Ni and Cu on the 200- and 350-ppm levels, respectively. The aluminum backing of the evaporated targets contains Ti, V, Ni, Cu, Zn, Ga below 50 ppm and Fe with about 3000 ppm.
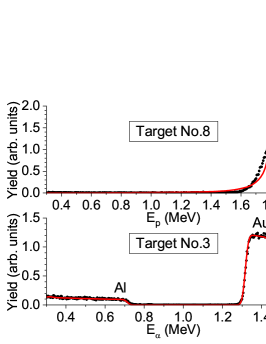
The targets were investigated also by Rutherford backscattering spectroscopy (RBS) using the Oxford-type Nuclear Microprobe Facility at MTA Atomki Huszank15-JRNC. In the case of the evaporated targets an beam of 1.6 MeV while for the self-supporting targets a proton beam of 2.0 MeV was used provided by the 5-MV Van de Graaff accelerator. Typical -RBS and proton-RBS spectra are shown in the middle column of fig. 1. The measured RBS spectra were analyzed with the SIMNRA software SIMNRA. The uncertainty of the number of target atoms is 3% from -RBS and 8% from proton-RBS. The former is mainly the general accuracy of the given RBS system determined from the measured thickness reproducibility of many standards, and partly from the statistical uncertainty of the fit. The higher uncertainty for the proton-RBS is due to the roughness of the samples causing worse fit.
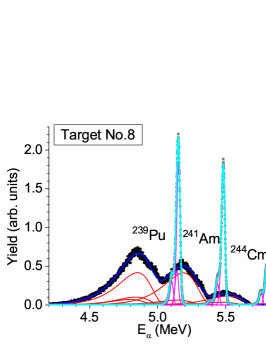
As a third thickness determination method in the case of the evaporated targets, weighing was used. The weight of each Al foil was measured before and after the evaporation. The target thicknesses were then calculated from the known surface area of the target and the weight difference. The uncertainty of this method is between 2-4% depending on the thickness of the samples taking into account the precision of the weight measurement (better than 5 g) and the possible evaporation non-uniformity. In the case of the self-supporting foils the energy loss of particles from a triple-nuclide -source was measured in an ORTEC SOLOIST alpha spectrometer. A typical -energy spectrum is shown in right panel of fig. 1, where the difference between the peak position in the calibration and measurement runs gives the energy loss. The total fit plotted by dark blue and light blue is the sum of the fits made for each of the eight energies from the source (purple and red lines in the figure). Using the known stopping power, the foil thickness was determined with an accuracy of about 8% stemming mainly from the stopping power uncertainty (i. e. 7.4%) and partly from that of the measured energy loss.
For each foil the different methods gave consistent results. In the analysis the weighted average of the thickness values obtained with the various methods were used (see table 2).
III.2 Irradiations
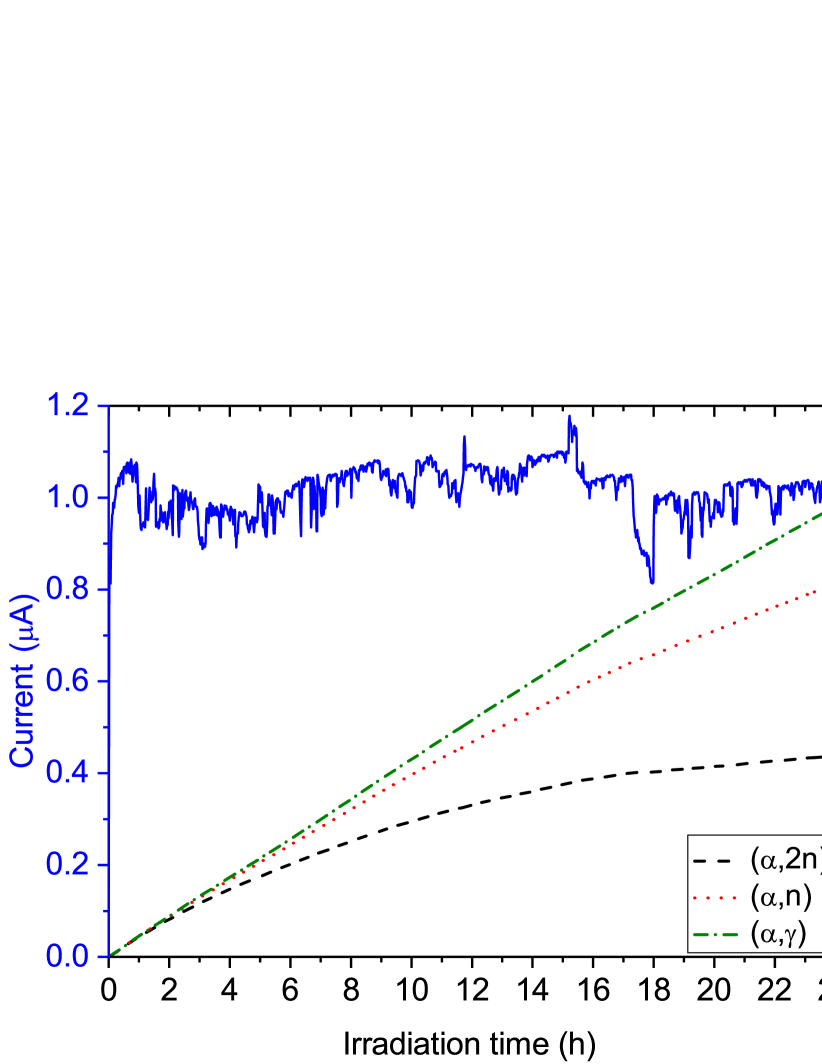
For the irradiations, the MGC-20 type cyclotron of Atomki was used. The particles entered the activation chamber through a beam defining aperture followed by a second aperture supplied with V against secondary electrons either escaping from the chamber or emerging from the collimator. The apertures and the chamber was electrically isolated allowing to measure the beam current. The typical -beam current was 1 – 2.5 A. The length of the irradiations was typically 20 – 34 h. The beam current was recorded with a multichannel scaler, thus the small variations in the beam intensity could be taken into account in the data analysis. For the activation analysis described below, we define the effective projectile fluence for each reaction product by the following equation:
| (MeV) | Target thickness () | () | ||||
|---|---|---|---|---|---|---|
| 199Tl | 200Tl | 201Tl | ||||
| 20.0 |
|
1.97 | 3.46 | 4.12 | ||
| 19.5 |
|
1.09 | 2.02 | 2.44 | ||
| 19.0 |
|
1.12 | 2.28 | 2.88 | ||
| 18.5 |
|
1.00 | 2.03 | 2.54 | ||
| 18.0 |
|
1.45 | 2.58 | 3.06 | ||
| 17.5 |
|
1.53 | 2.75 | 3.29 | ||
| 17.0 |
|
1.88 | 2.34 | |||
| 16.0 |
|
1.88 | 2.26 | |||
| 15.0 |
|
3.31 | 4.15 | |||
| 14.0 |
|
3.29 | 3.95 | |||
| 13.7222Behind energy degrading foil. |
|
3.29 | ||||
| (1) |
where the sum is over each step of the multichannel scaler assuming constant flux () within a single time interval of length (1 min in this case). is the decay constant of the given isotope (i. e. 199Tl; 200Tl; 201Tl). Typical beam current and effective fluence curves as a function of time are shown in fig. 2 and the final effective fluence for each irradiation is presented in table 2.
III.3 -ray and X-ray detection
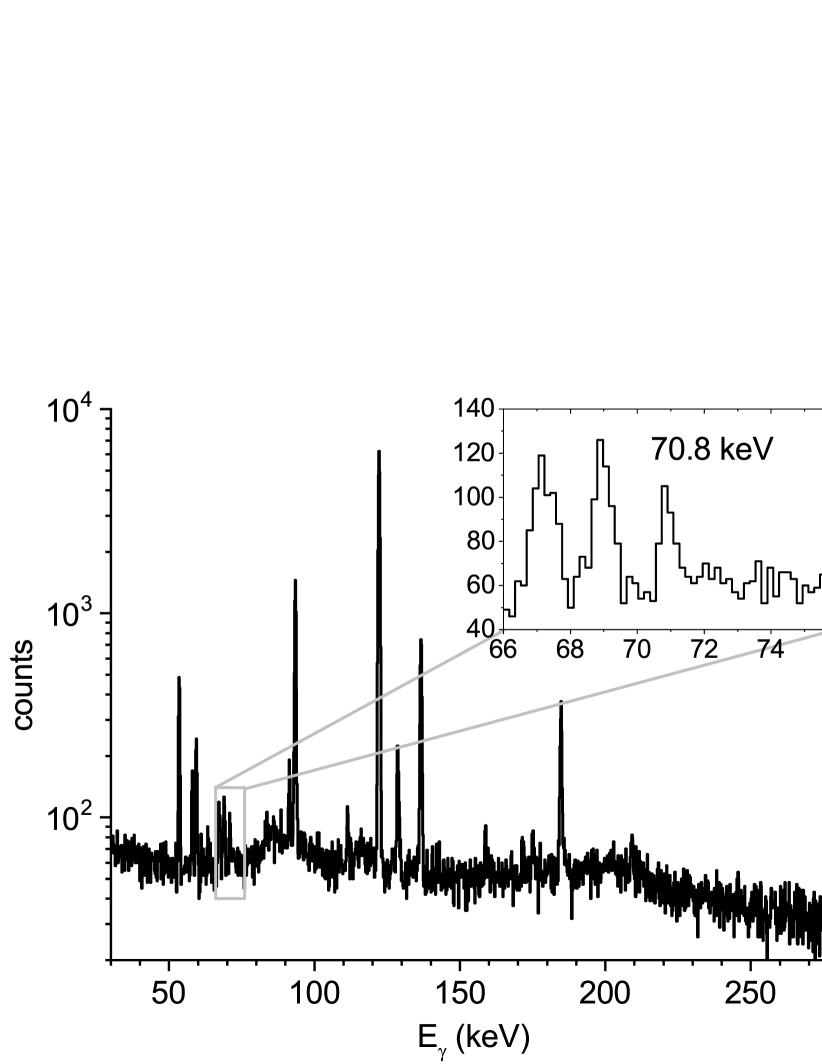
The produced activity was determined by counting the and/or X rays following the decay of the reaction products (see table 1). In the case of the X-ray counting only the 70.81-keV K X-ray line was used, because the other strong K line at 68.894 keV has a contribution from the X-ray fluorescence peak of gold at 68.806 keV. These two peaks were not separable in the spectrum.
For the counting a thin crystal high-purity germanium detector, a so-called Low Energy Photon Spectrometer (LEPS) was used. The detector was equipped with a home made quasi 4 shielding consisting of layers of copper, cadmium and lead Szucs14-AIPConf.
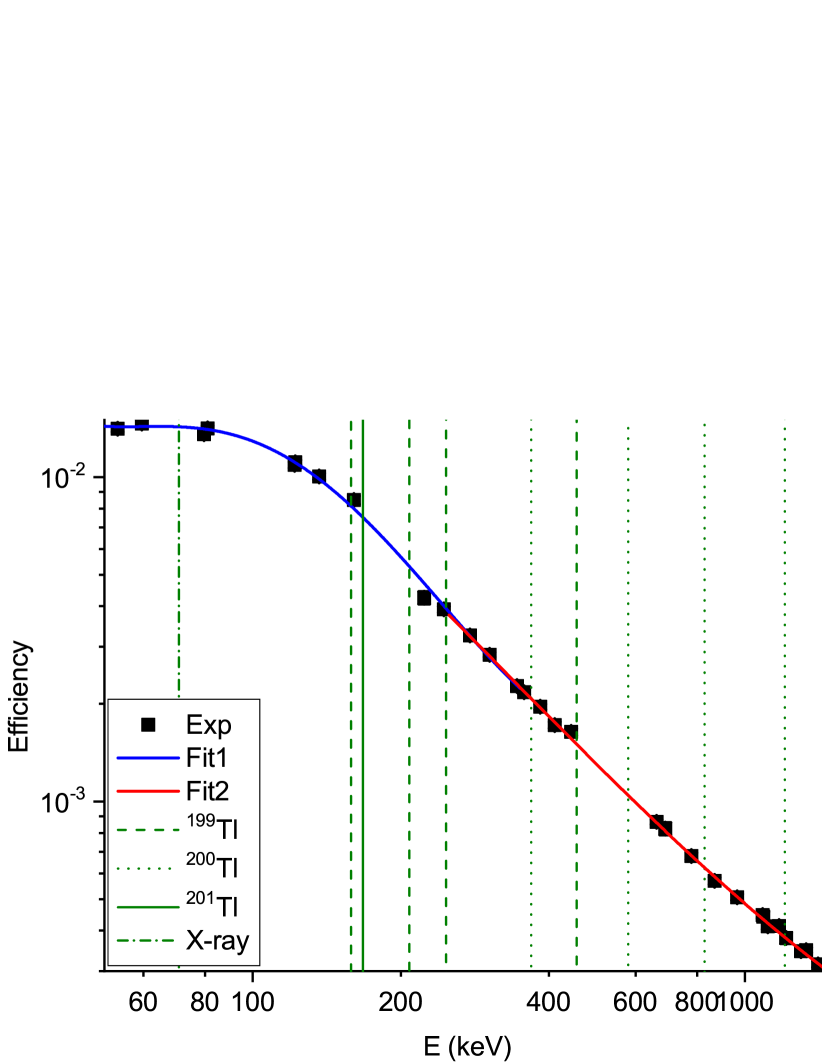
The detector efficiency calibration was done with sources of known activity at a counting distance of 10 cm, thus minimizing the true-coincidence summing effect. Since the energies of the decay radiation are between the energies of rays of the calibration sources, only interpolation was necessary. This was done by fitting log-log polynomial functions to the measured efficiency points. Between 50 keV and 350 keV a 5th order polynomial, while between 250 keV and 1400 keV a 3th order function describes well the measured efficiency. In the overlapping region the two functions are in fair agreement as shown in fig. 3. For the relative efficiency uncertainty, the 1 confidence band of the fits was used.
The targets with lower activity were counted in 3-cm target to detector end-cap distance. At this distance the -ray detection efficiencies were determined by using several targets which were counted both in 10-cm and 3-cm geometry and from the observed count rates, knowing the half-lives of the products and the time difference of the countings, the efficiency-conversion factors were derived. This factor contains the possible loss due to the true-coincidence summing in close geometry. The conversion factors measured with the different sources were consistent, therefore their statistically weighted average was used in the analysis.
The close-geometry efficiency uncertainty contains the uncertainty of the fit and the uncertainty of the conversion factors, thus ranges from %. The highest values are for the lines of 199Tl, because they sit on the Compton-continuums of the slower decaying lines of 200Tl, causing higher statistical uncertainty. The X-ray detection efficiency in close geometry was determined using the target irradiated with 20.0 MeV. It was measured two times both at the 10-cm and 3-cm geometry. The counting times were optimized so that for the first counting pair the 200Tl, for the second counting pair the 201Tl dominated the X-ray peak. This was necessary because of the different summing effects characterizing the two isotopes, which lead to slightly different close geometry efficiency of the X ray with the same energy.
Self-absorption effects could be neglected because of the relatively thin targets in the present work. The energy of the detected X ray is just below the K absorption-edge of gold, thus experiences a few times higher absorption as the rays. For the thickest gold target (see Table II) the X-ray self-absorption is less than 0.2% considering an even activity distribution in the target, thus can be neglected safely.
IV Data analysis
IV.1 (,2n) and (,n) cross sections
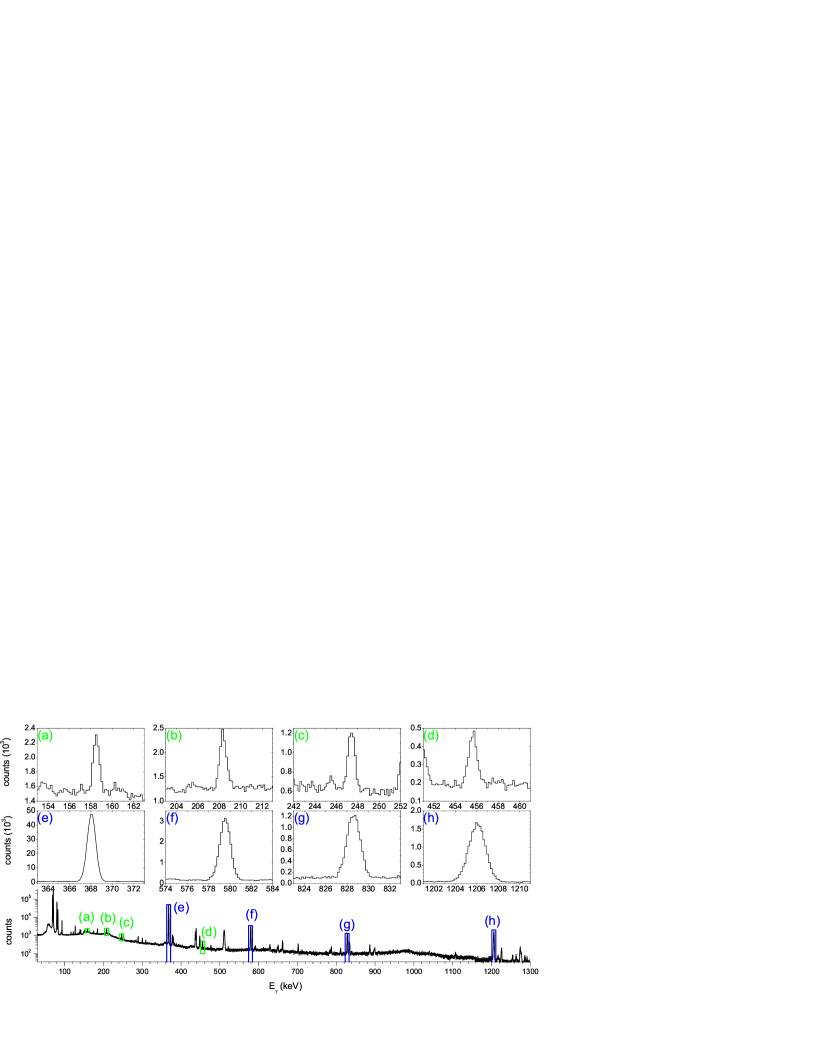
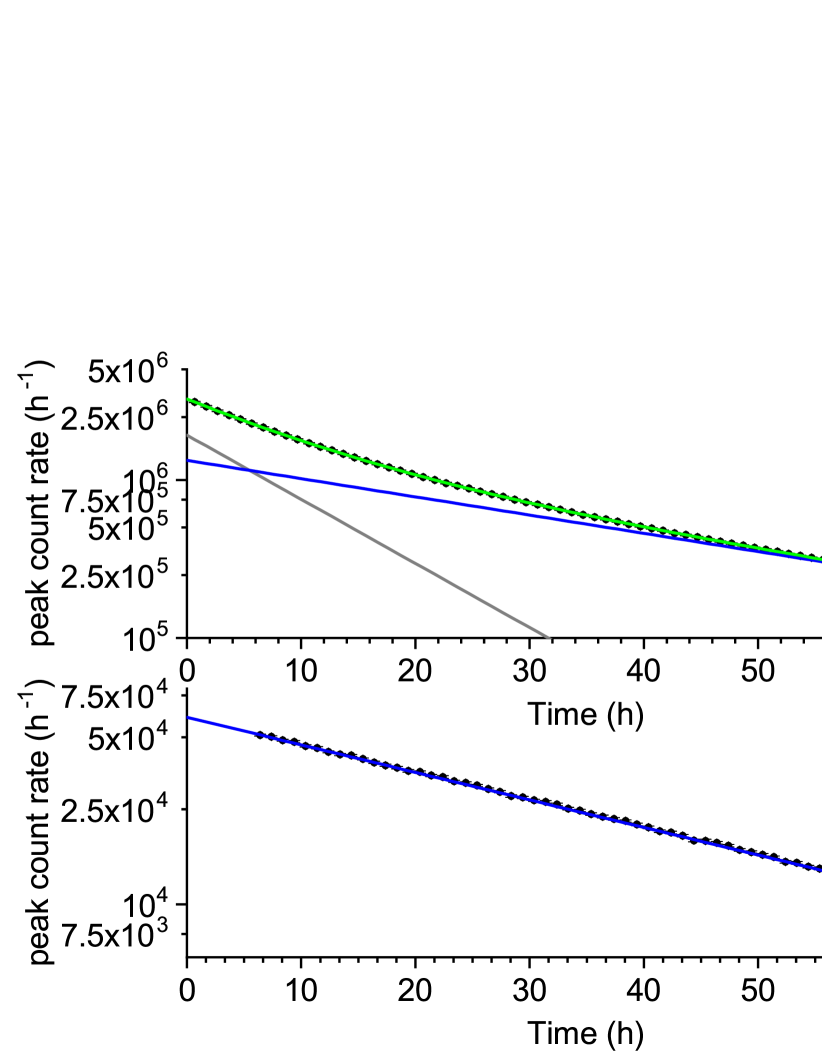
First the activity of the (,n) and above 17.1 MeV also that of the (,2n) reaction products were determined as follows. The peaks were fitted with Gaussian plus linear background in each hourly-recorded spectra (see fig. 4). If the uncertainty of the peak area from the fit was more than 10% then spectra were added together until the fit resulted in lower than 10% statistical uncertainty. This spectrum summing was done separately for each of the studied peaks.
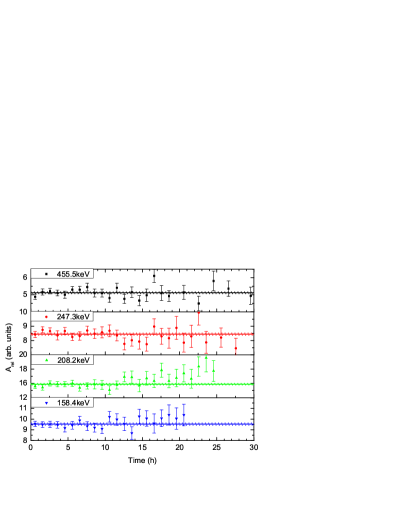
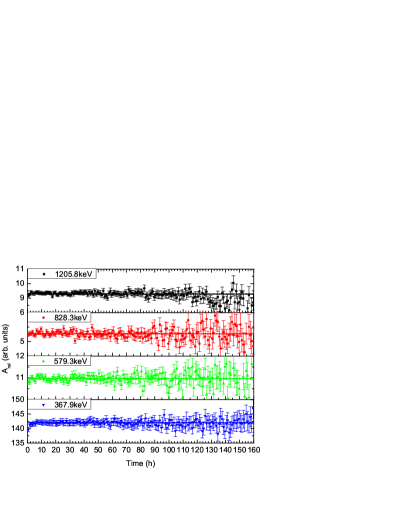
The peak areas were then divided by the corresponding waiting and counting time factors, yielding a number related to the activity of the given isotope at the end of the irradiation (hereafter referred to as the relative activity). The statistically weighted average of these individual numbers (see e. g. fig. 5) is the finally obtained relative activity (), which was calculated with the following equation:
| (2) |
where the summation runs till the last counting which results in better than 10% fit uncertainty. is the peak area from the - counting, is the decay constant of isotope , and are the waiting time and length of the - counting, respectively. The weighting factors are the square of the reciprocal statistical uncertainty coming mainly from the fitted peak areas and partly from the uncertainty of the counting and waiting factors. The uncertainty of the relative activities are the reciprocal square-root of the sum of the weights. The relative activity determination for the irradiation at 18.0 MeV is plotted in fig. 5.
The relative activities of a given transition were then divided by the relative intensities () and detection efficiencies () of the corresponding rays. Consistent values were obtained for all the studied transitions, thus the created activity of a given isotope at the end of the irradiation was calculated as follows:
| (3) |
where the summation goes over the four transition of the isotope in question. The weights are formed from the combined uncertainty of , and . Finally the average is divided by the multiplicator for the absolute intensity .
At the very end the reaction cross sections are obtained by the following equation:
| (4) |
where is the created activity of isotope in the sample, is the target thickness and is the effective irradiation fluence as defined in eq. (1).
IV.2 (,) cross sections
The rays from the decay of 201Tl were only visible at and above 17.5-MeV bombarding energy (see fig. 6), because of the Compton background of the very intense 367.9-keV line of the (,n) reaction product and other parasitic activities created on the trace impurities of the targets. Owing to the common systematic uncertainties of the -ray and X-ray counting methods, the final uncertainty would not decrease by averaging. Therefore the adopted cross section was only derived from the X-ray counting as it has much higher precision.
The produced 201Tl activity from the X-ray counting was determined as follows.
The X-ray peak was fitted by Gaussian and quadratic background. Similar to the -peak fits, spectra were added together so that the peak fit in this case resulted in less than 20% peak area uncertainty.
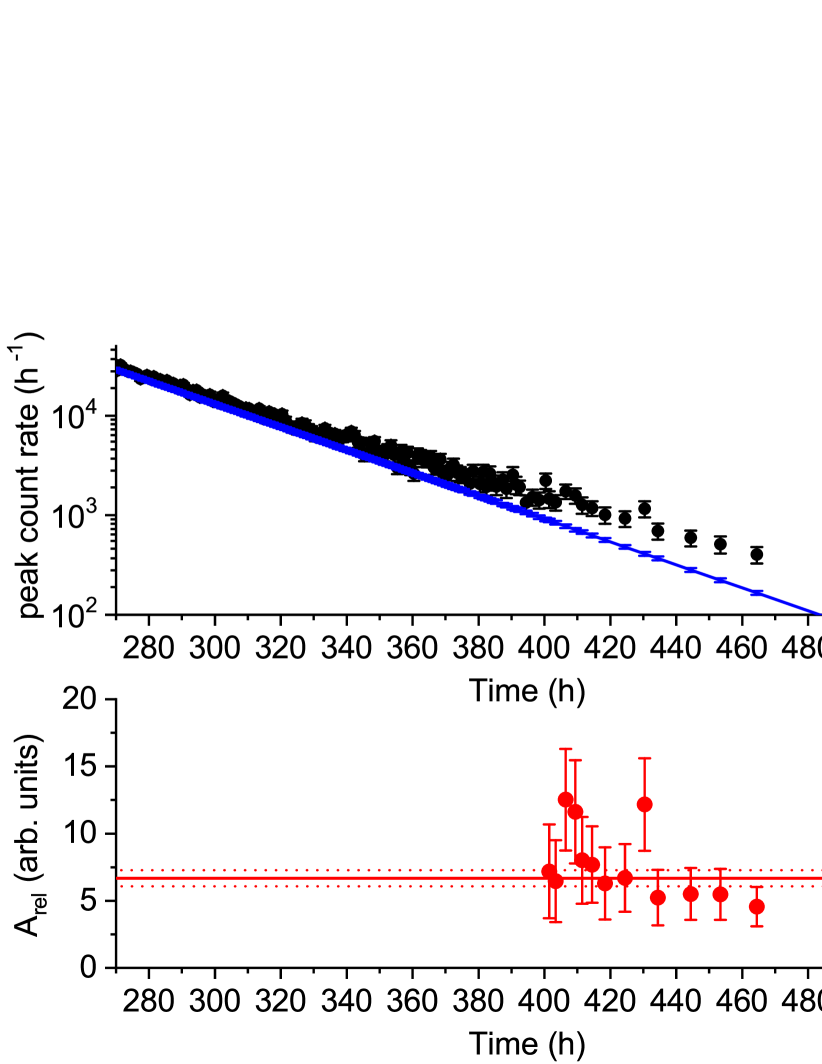
Owing to the half-life difference, after about 16 days, the (,) reaction product 201Tl had a large enough contribution to the X-ray peak. The subtraction of the contribution from the other two reaction products became possible, as discussed below. A typical spectrum used for the X-ray activity determination is shown in fig. 7 where already more than half of the peak counts are caused by the 201Tl activity.
The subtraction of the contributions from the other isotopes was done as follows. Below the (,2n) reaction threshold the X-ray decay-curve recorded in the first days after the irradiation was fitted using the 200Tl half-life, thus the X-ray relative activity of 200Tl was determined (see lower panel of fig. 8). Above the (,2n) reaction threshold, the X-ray decay curve was fitted with the sum of two exponentials with the known half-lives of 199Tl and 200Tl, similarly as e.g. in Kiss et al. Kiss18-PRC. From the fit the relative X-ray activity for both reaction products was derived. An example of such a fit is also shown in fig. 8 (upper panel). In the first days of the countings the contribution of the (,) reaction product is negligible to the X-ray peak as calculated using the literature X-ray intensities and the produced activity previously determined via counting.
The X-ray countings for the 201Tl activity were done at least 15 days after the irradiations. After such a waiting time the contribution from the (,2n) reaction product was always negligible. For the subtraction of the X-ray contribution of the (,n) reaction product, the relative activity ratio of the 367.9-keV ray and the X ray was used. The ratio was determined from several samples at the actual 3-cm counting geometry. Since the uncertainty of the relative activity from the 367.9-keV line contains only the uncertainty of the counting statistics, the number to be subtracted is more precise than what would be calculated from the absolute activity. This latter would contain the uncertainties of the detection efficiencies and X-ray branchings.
After subtracting the (,n) contribution, only those points were used where the relative uncertainty of the remaining peak areas was not higher than 50%. Then those were corrected for the decay and counting time resulting in the X-ray relative-activity values. The final relative activity is the weighted average of those from the subsequent countings, similar to the -ray relative activities (see fig. 9).
The 13.7-MeV point was measured differently from the others. For the 14-MeV irradiation two targets were placed in the irradiation chamber separated by a 2.13 m thick Al foil. The beam energy at the position of the second target is calculated using SRIM, from the known thickness of the first target and the Al energy degrader foil. The energy uncertainty of this point is therefore higher. At this energy the 367.9-keV line from the (,n) reaction product was not visible during the course of the 1.5-days counting right after the irradiation. Therefore, the activity was determined from X-ray counting only using the absolute X-ray branching ratio from the literature (see table 1). The X-ray peak count rate followed the half life of the 200Tl, thus was considered to be populated only by the (,n) reaction product.
In the case of the self-supporting foils having no backing, some activity can be lost when the reaction takes place at the rear of the target layer, and the reaction product cannot be stopped in the remaining part of the foil. A SRIM simulation srim was done to estimate this effect. As a starting point of the simulation, Tl nuclei were equally distributed in the gold foil, and each of them had a velocity directing to the rear of the foil, calculated from the reaction kinematics for each irradiation energy. The simulation showed that about 3% of the Tl nuclei can leave the gold foils. This loss was finally taken into account in the created activity determination with a conservative 30% relative uncertainty.
The effective energy in each case is taken at the middle of the target. The energy loss is calculated with SRIM srim. The energy uncertainty determined by the initial beam-energy uncertainty of 0.3%. The effect of the target thickness and energy loss on beam-energy uncertainty is %, thus neglected.
Beside the statistical uncertainties propagated with the averaging as discussed before, each data point contains the respective target thickness uncertainty as quoted in table 2 and the uncertainty of the Tl loss in the case of the self-supporting targets. As systematic uncertainty, the absolute branching (7-10%), the absolute detection efficiency (3%) and the beam current (3%) uncertainty was quadratically added to get the finally quoted uncertainties. The absolute detection efficiency uncertainty accounts for the uncertainty of the absolute activity of the calibration sources and that of the counting distance reproducibility.
V Experimental results
V.1 X-ray intensities
| Eα (MeV) | Relative X-ray intensity (%) | ||||||||
|---|---|---|---|---|---|---|---|---|---|
| 199Tl | 200Tl | 201Tl | |||||||
| 20.0 |
|
|
|
||||||
| 19.5 |
|
|
|||||||
| 19.0 |
|
|
|||||||
| 17.0 |
|
||||||||
| Average |
|
|
|
||||||
| Ref.Debertin79-ARI |
|
||||||||
The X-ray relative activity of all the created isotopes is determined for several samples. Using the -ray relative activity and the X- and -ray detection efficiencies, the relative X-ray branching ratios are determined here. For each isotopes table 3 presents the X-ray branching ratios relative to the strongest lines (i.e. 455.5 keV for 199Tl, 367.9 keV for 200Tl and 167.4 keV for 201Tl, respectively). To avoid the systematic effect of the efficiency scaling, only data points measured at the 10-cm counting geometry are used. The uncertainty of the relative detection efficiency was added to the final value after averaging. A comparison with other measured relative branching ratios is possible only in the case of 201Tl. For the other isotopes no published values are available in the literature.
The absolute intensities were calculated by scaling the relative values by the multiplicator shown in table 1. For each isotope the measured absolute intensities can be compared to the values presented in NuDat2 NuDat. In the NuDat2 database the X-ray branching ratios are obtained with the RADLIST RADLIST program using the internal conversion coefficients. The present experimental data found to be in agreement with the calculated values from the database (see table 4). In the case of 199Tl and 200Tl the experiential values are somewhat less precise owing to the uncertainty of the multiplicator. However, for 201Tl the precision limiting factor was the counting statistics, the obtained branching ratio is more precise than that in the database. For this isotope the latest evaluation also contains experimental data for the X-ray intensities. The new value has to be compared with the more precise evaluated value of 44.6 0.6% NDS201 stated also in table 3 and used for the 197Au(,)201Tl cross section determination.
V.2 Reaction cross sections
The measured reaction cross sections are shown in table 5. In the case of the 18.5-MeV data point only counting was done. In this measurement the peak from the 197Au(,)201Tl reaction was not visible, thus no cross section could be derived. The total uncertainties presented in the table are the quadratic sum of the systematic uncertainties (10.6%, 8.1%, and 4.5% for the (,2n), (,n), and (,) reactions respectively) and statistical uncertainties of the datapoints. The latter varies between 2-6% for the neutron emitting reactions while for the radiative-capture reaction it is 9-15% except for the two lowest energy data points (26% and 54%).
| Isotope | NuDat2 NuDat | This work | ||||
|---|---|---|---|---|---|---|
| 199Tl |
|
|
||||
| 200Tl |
|
|
||||
| 201Tl |
|
|
VI Theoretical analysis
VI.1 Formalism and general remarks
The new experimental data were analyzed within the statistical model (SM). In a schematic notation, the cross section (,) of an -induced reaction is given by
| (5) |
with the transmission coefficients into the -th open channel and the branching ratio for the decay into the channel . The total transmission is given by the sum over all contributing channels: . The are calculated from global optical potentials for the particle channel and from the -ray strength function (GSF) for the photon channel. The include contributions of all final states in the respective residual nucleus in the -th exit channel. In practice, the sum over all final states is approximated by the sum over low-lying excited states up to a certain excitation energy (these low-lying levels are typically known from experiment) plus an integration over a theoretical level density for the contribution of higher-lying excited states:
| (6) |
| Eα (MeV) | Eeff (MeV) | 197Au(,2n)199Tl (mb) | 197Au(,n)200Tl (mb) | 197Au(,)201Tl (b) | ||||||||
|---|---|---|---|---|---|---|---|---|---|---|---|---|
| 20.0 |
|
|
|
|
||||||||
| 19.5 |
|
|
|
|
||||||||
| 19.0 |
|
|
|
|
||||||||
| 18.5 |
|
|
|
|||||||||
| 18.0 |
|
|
|
|
||||||||
| 17.5 |
|
|
|
|
||||||||
| 17.0 |
|
|
|
|||||||||
| 16.0 |
|
|
|
|||||||||
| 15.0 |
|
|
|
|||||||||
| 14.0 |
|
|
|
|||||||||
| 13.7333Measured with energy degrader foil. See text for details. |
|
|
For further details of the definition of , see Rauscher11-IJMPE. refers to the entrance channel where the target nucleus is in its ground state under laboratory conditions. The calculation of stellar reaction rates may require further modifications of Eq. (5) which have to take into account thermal excitations of the target nucleus Rauscher11-IJMPE.
From Eqs. (5) and (6), the following properties of the reactions under study can be expected. The total reaction cross section (summed over all non-elastic channels) depends only on the transmission in the entrance channel and is thus only sensitive to the chosen -nucleus optical model potential (A-OMP). At very low energies all particle channels are closed. Here the only open reaction channel is the (,) channel, leading to a cross section of the (,) reaction of about ; consequently, at very low energies the (,) cross section is essentially only sensitive to the chosen A-OMP.
The (,p) channel opens at about 6.5 MeV. However, because of the high Coulomb barrier in the exit channel, the transmission remains practically negligible in the energy range under study, and a more detailed discussion of the (,p) channel will be omitted.
Contrary to the (,p) channel, there is no Coulomb barrier for the (,n) channel. Already close above the (,n) threshold at 9.7 MeV, the transmission exceeds all transmissions into other channels. Now the (,n) cross section becomes close to the total reaction cross section , and thus the (,n) cross section is practically only sensitive to the chosen A-OMP. This finding holds until energies of about 17 MeV where the (,2n) channel opens. At these higher energies the total reaction cross section is essentially distributed among the (,n) and (,2n) channels; i.e., the sum of the (,n) and (,2n) cross sections is approximately given by and is sensitive to the A-OMP only. But the individual (,n) and (,2n) cross sections are sensitive to the ratio between and which in turn depend on the chosen nucleon-nucleus optical model potential (N-OMP) and on the chosen level densities (LD) for the residual 200Tl and 199Tl nuclei.
At all energies above the (,n) threshold, the (,) cross section depends on the ratio and is thus sensitive not only to the transmission and the -ray strength function, but also sensitive to all further ingredients like the A-OMP, N-OMP, and LD. The analysis of the (,) excitation function alone does not allow to fix any ingredient of the SM calculations because of the complex sensitivity of the (,) cross section.
VI.2 Additional data from elastic scattering
The total reaction cross section can also be derived from the analysis of elastic scattering angular distributions. It has been shown recently that extracted from elastic scattering is consistent with the sum over the (,) cross sections of all non-elastic channels Gyurky12-PRC; Ornelas16-PRC.
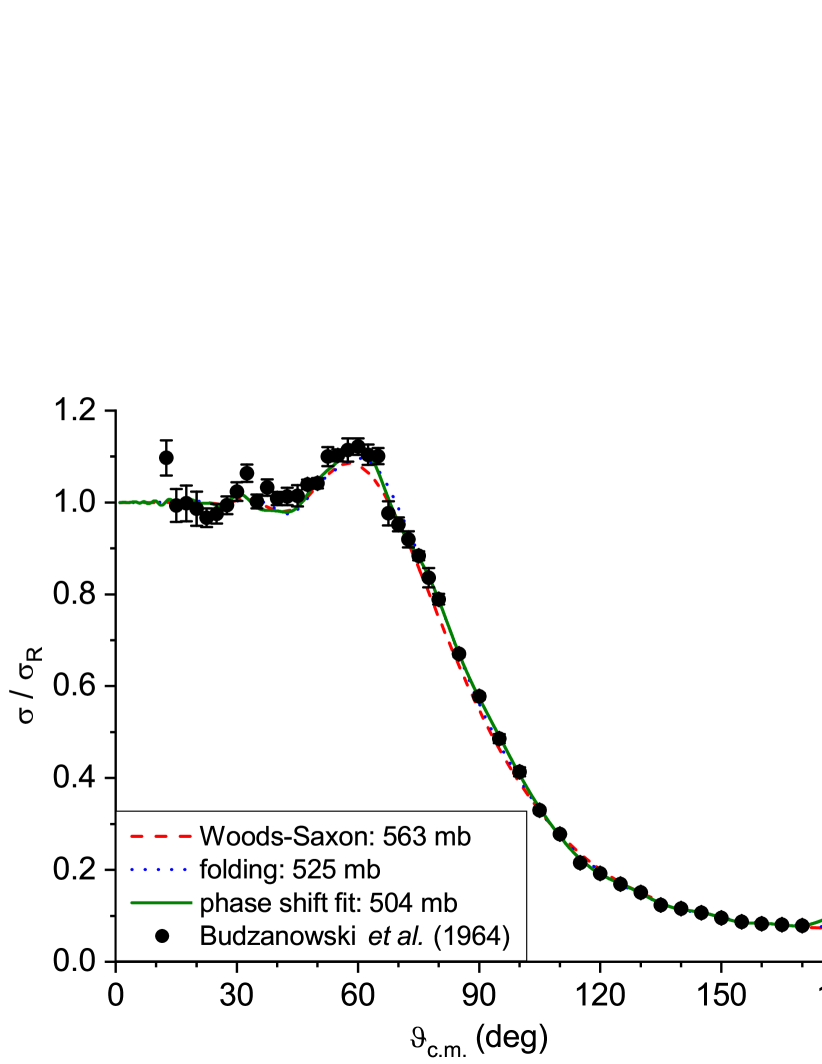
The elastic scattering angular distribution at MeV by Budzanowski et al. Budzanowski64-PL provides the chance to obtain one further data point for at the upper end of the energies under study. This value for directly constrains the A-OMP at relatively high energies.
The angular distribution of Budzanowski64-PL was analyzed in the following way. Optical model fits were performed using either Woods-Saxon potentials of volume type in the real and imaginary part of the OMP, or a folding potential was used in the real part in combination with a surface Woods-Saxon potental in the imaginary part. Furthermore, a phase shift fit was made using the approach of Chiste96-PRC. The fits are shown in Fig. 10 and give of 563 mb, 525 mb, and 504 mb. Because of the significantly larger of the Woods-Saxon fit (which clearly underestimates the elastic cross section around and thus slightly overestimates with 563 mb), we adopt = mb at 24.7 MeV.
VI.3 -based assessment
The new experimental data, in combination with the additional data point for from 197Au(,)197Au elastic scattering Budzanowski64-PL and the further data points of Basunia07-PRC, will be used to determine a best-fit set of parameters for the SM calculations. For this purpose the TALYS code (version 1.9) TALYS-V19 was used which is a well-established open-source code for SM calculations. Similar to previous studies (see Mohr17-PRC for 64Zn + , Talwar18-PRC; Mohr18-PRC for 38Ar + and Kiss18-PRC for 115In + ), the complete TALYS parameter space was investigated, and a -based assessment was used to find the best description of the experimental data. In practice, 14 different A-OMPs were used which turn out to be the most important ingredient of the SM calculation. These 14 A-OMPs were combined with 5 different N-OMPs, 6 LDs, and 8 GSF (with two options for the M1 contribution), leading to an overall calculation of 6720 excitation functions. The N-OMPs, LDs, and GSFs were taken from the built-in TALYS options. For the A-OMPs 14 different options were used which exceed the 8 standard options in TALYS; these 14 A-OMPs will be discussed in further detail. The A-OMPs are also summarized in Table 6.
| alphaomp | Ref. | Abbr. | comments |
|---|---|---|---|
| 1 | Watanabe58-NP | WAT | Watanabe: default in earlier TALYS versions |
| 2 | McFadden66-NP | MCF | McFadden/Satchler: simple 4-parameter potential |
| 3 | Demetriou02-NPA | DEM1 | Demetriou et al., version 1: real folding, imaginary volume WS |
| 4 | Demetriou02-NPA | DEM2 | Demetriou et al., version 2: real folding, imaginary volume+surface WS |
| 5 | Demetriou02-NPA | DEM3 | Demetriou et al., version 3: real folding plus dispersion relation |
| 6 | Avrigeanu14-PRC | AVR | Avrigeanu et al.: multi-parameter WS |
| 7 | Nolte87-PRC | – | Nolte et al.: not appropriate for low energies |
| 8 | Avrigeanu94-PRC | – | Avrigeanu et al.: not appropriate for low energies |
| 9 | Mohr13-ADNDT | AT-V1 | Mohr et al.: systematic potential, adjusted to low-energy scattering data |
| 10 | Demetriou02-NPA | DEM3x1.1 | Demetriou et al., version 3: real part multiplied by 1.1 |
| 11 | Demetriou02-NPA | DEM3x1.2 | Demetriou et al., version 3: real part multiplied by 1.2 |
| 12 | Demetriou02-NPA | DEM3x0.9 | Demetriou et al., version 3: real part multiplied by 0.9 |
| 13 | Demetriou02-NPA | DEM3x0.8 | Demetriou et al., version 3: real part multiplied by 0.8 |
| 14 | Demetriou02-NPA | DEM3x0.7 | Demetriou et al., version 3: real part multiplied by 0.7 |
It is well-known that the early A-OMP by Watanabe (WAT) Watanabe58-NP and the simple 4-parameter Woods-Saxon (WS) potential by McFadden and Satchler (MCF) McFadden66-NP (alphaomp 1 and 2 in TALYS) show a trend to overestimate the cross sections of -induced reactions. This trend becomes pronounced especially towards low energies below the Coulomb barrier. For completeness it has to be mentioned that a new explanation for the failure of the MCF potential at low energies was provided recently in Mohr19-IJMPE.
A series of A-OMPs was suggested by Demetriou et al. Demetriou02-NPA which are based on the double folding procedure in the real part. The first version DEM1 uses a volume WS potential in the imaginary part where the strength is energy-dependent according to a Brown-Rho parametrization Brown81-NPA. In the second version DEM2 the imaginary part is composed of a volume WS and a surface WS. The strength of the real parts in DEM1 and DEM2 is taken from the parametrization of real volume integrals from -decay data Mohr00-PRC. The third version DEM3 uses an imaginary part very close to DEM2 and additionally introduces the coupling between the real and imaginary part by a dispersion relation. Typically, the DEM1, DEM2, and DEM3 potentials (alphaomp 3, 4, 5 in TALYS) predict smaller cross sections than WAT and MCF. Recently it has been pointed out that an excellent reproduction of experimental data can be obtained if the real part of the DEM3 potential is scaled by factors between 1.1 and 1.2 for heavy nuclei Scholz16-PLB; a smaller scaling factor of 0.9 was found for 64Zn Mohr17-PRC. Therefore, different scaling factors for the DEM3 potential were also investigated (alphaomp 10-14).
The recent version of the Avrigeanu potentials Avrigeanu14-PRC (AVR, alphaomp 6 in TALYS) consists of a real part in WS parametrization which has been chosen close to folding potentials. The imaginary part is composed of WS volume and surface terms with mass- and energy dependent parameters. Similar to the Demetriou potentials, the AVR potential leads to smaller cross sections than WAT and MCF at low energies.
The potential by Nolte et al. Nolte87-PRC (alphaomp 7 in TALYS) and the earlier potential by Avrigeanu et al. Avrigeanu94-PRC (alphaomp 8) have been adjusted to experimental data at higher energies. It has been found that these potentials are inappropriate at very low energies Mohr17-PRC; Mohr18-PRC. This finding is confirmed in the present work where per point of above 50,000 (5,800) was found for the Nolte (early Avrigeanu) potential. These huge correspond to average deviations from the experimental data by more than a factor of 3.6 (2.4) whereas all other potentials reach average deviations far below a factor of two.
The ATOMKI-V1 potential Mohr13-ADNDT (AT-V1, implemented as alphaomp 9 in TALYS V1.8) is based on a double-folding potential in the real part in combination with a surface WS potential in the imaginary part. The parameters of AT-V1 have been adjusted to elastic scattering in the mass range, i.e. below the 197Au nucleus under study in this work.
The 14 A-OMPs in Table 6 were used in a strict -based assessment. The experimental data show a clear preference for the DEM3 potential (multiplied by 1.1 and 1.2) and the AVR potential. We find per point of about 4.6 (DEM3x1.2), 6.1 (AVR), and 6.2 (DEM3x1.1). This corresponds to an average deviation of 1.39, 1.41, and 1.50 for the DEM3x1.2, AVR, and DEM3x1.1 potentials. In the following, all will be given per experimental data point. is defined by
| (7) |
and ,i is the larger of the ratios or for the -th experimental data point.
As pointed out above, the sensitivity to the other ingredients of the SM calculations is relatively minor. About 50 different choices of GSF, N-OMP, and LD in combination with the DEM3x1.2 A-OMP result in a minor increase of by less than 1.0 and between 1.39 and 1.46.
A strict assessment is only valid for statistical uncertainties. Unfortunately, the uncertainties of the present data have a significant contribution from systematic uncertainties (see Table 1 and discussion at the end of Sec. III). An attempt was made to disentangle the relevance of the statistical and systematic uncertainties. For this attempt we restrict ourselves to our new experimental data from Table 5.
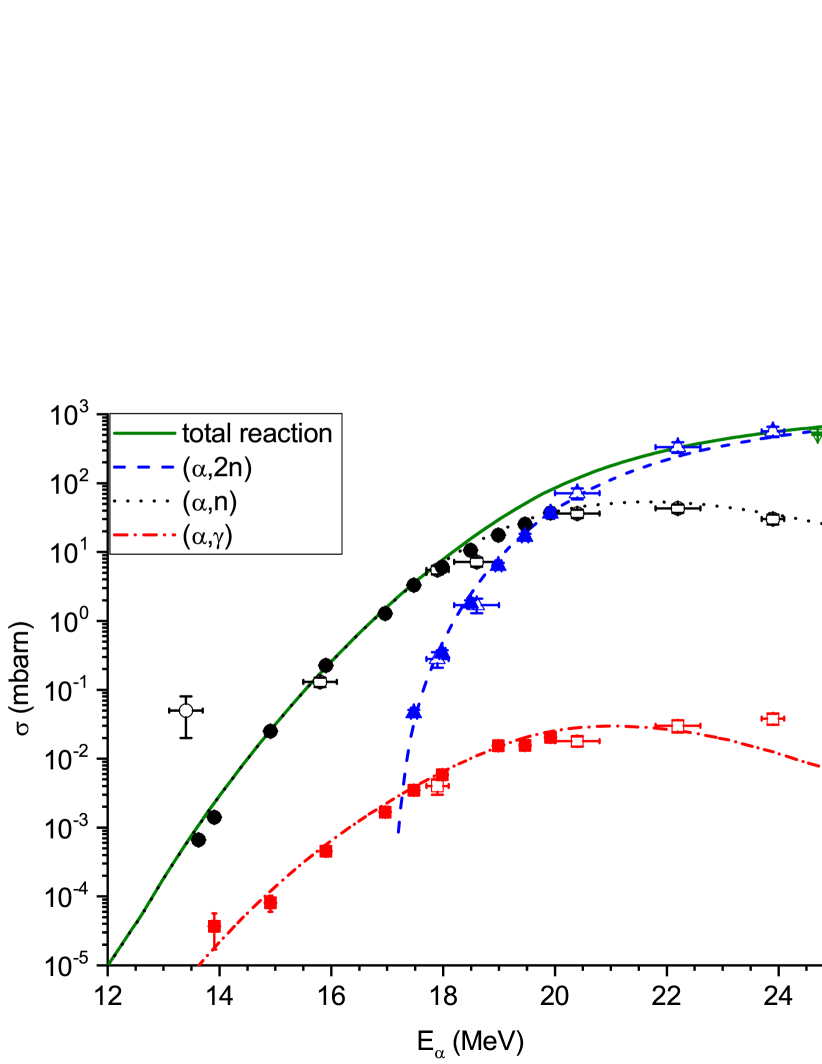
In a new calculation, the best-fit parameters are derived from our experimental data with statistical uncertainties only. Here we find that the best reproduction of our experimental data is obtained for the AVR A-OMP with and . Compared to the result from all available experimental data, we find a significantly increased which results from the smaller (statistical only) uncertainties. The average deviation decreases from about 1.4 to 1.2; this decrease is related to relatively large deviation factors for some data points of the Basunia data, in particular at the lowest energy of Basunia for the (,n) channel. Interestingly, the best-fit A-OMP changes from DEM3x1.2 to AVR; however, the DEM3x1.2 A-OMP provides and , i.e. very close to the results from the AVR A-OMP. In fig. 11 the measured cross sections are shown together with the calculated ones using the AVR A-OMP.
Next, we have to consider the systematic uncertainties which are dominated by the -ray intensities in the -decays of the residual nuclei (see Table 1). Under these circumstances the systematic uncertainties are common within each (,) channel, but not common to all experimental data; i.e., it is possible that both (,n) and (,2n) data are higher or lower within their systematic uncertainties, but it is also possible that the (,n) data are higher and the (,2n) data are lower (and vice versa). To cover the full range of systematic uncertainties, we have scaled the (,), (,n), and (,2n) data by of the systematic uncertainties, leading to 27 hypothetical experimental data sets within the systematic uncertainties. The number of 27 results from 3 channels which are varied independently by factors , 1.0, and . Further calculations with finer steps in one channel (and no variation in the other channels) confirm that the overall behavior of the landscape is relatively smooth.
For the 27 hypothetical data sets, the best-fit parameters of the SM calculations are derived using the same -based assessment as before. It is found that the best-fit A-OMP is well constrained to the AVR or DEM3x1.2 potentials. In general, the AVR potential is obtained when the (,n) and (,2n) cross sections are increased whereas the DEM3x1.2 potential is favored for smaller (,n) and (,2n) cross sections. The overall smallest and is found for the AVR A-OMP and the case where the cross sections of the (,), (,n), and (,2n) channels are all increased by of the systematic uncertainties, i.e., by about 9% for the (,), 16% for the (,n), and 21% for the (,2n) channel.
Surprisingly, although the present experimental data cover the (,), (,n), and (,2n) channels over several MeV, it is difficult to provide constraints for the SM parameters beyond the A-OMP. The variation of the experimental data within their systematic uncertainties constrains the A-OMP to AVR or DEM3x1.2, but almost any choice of the N-OMP, GSF, and LD appears in the best-fit parameters of the 27 hypothetical experimental data sets which represent the range of systematic uncertainties.
VI.4 Extrapolation to astrophysically relevant energies
The A-OMPs are an essential ingredient for the calculation of stellar reaction rates in the astrophysical process. This process operates at typical temperatures of , corresponding to a Gamow window around 8.9 MeV at and 11.7 MeV at . As the (,n) channel opens around 10 MeV and starts to dominate already a few hundred keV above the threshold, the (,) and (,n) rates above must remain uncertain because the branching between the (,) and (,n) channels depends on several parameters of the statistical model which cannot be well constrained (see discussion above). We restrict ourselves to the analysis of the total reaction cross section which depends solely on the chosen A-OMP.
At MeV, corresponding to the center of the Gamow window at , we find = 7.34 nb from the AVR potential and 4.56 nb from the DEM3x1.2 potential; both potentials have been determined from the -based assessment in the previous section. Thus, nb can be estimated with an uncertainty of about 25%. The small uncertainty of 25% is based on the constraints from the new experimental data in combination with the similar energy dependence of from the two best-fit potentials down to about 11 MeV.
A further extrapolation down to MeV (corresponding to ) is obviously more uncertain, but the predictions from the two best-fit potentials remain within about a factor of 2.5 with = 0.123 pb for the AVR potential and = 0.047 pb from the DEM3x1.2 potential. From the average of the two predicted cross sections, pb with an uncertainty of less than a factor of two can be recommended. This is a significant achievement, because the range of predictions at 9.1 MeV from modern A-OMPs (AVR, DEM, AT1) covers two orders of magnitude from 0.03 to 3 pb, and the MCF potential predicts an even higher cross section of about 37 pb.
In addition, reaction rates for the (,) reaction are calculated at temperatures of and 3 for the best-fit potentials (DEM3x1.2 and AVR) and compared to the widely used MCF potential. At the higher temperature of the DEM3x1.2 and AVR rates agree within about a factor of two wheres the MCF rate exceeds the average of the DEM3x1.2 and AVR rates by a factor of 300. The discrepancies increase towards lower temperatures. At the DEM3x1.2 and AVR rates deviate by a factor of about 3.5, whereas the MCF rate exceeds the DEM3x1.2 and AVR rates by three orders of magnitude.
Finally, it has been pointed out by Rauscher Rauscher10-PRC that the simple Gamow window estimate for the most effective energies is inaccurate for -induced nuclei on heavy nuclei. Typically, the most effective energy is shifted to lower energies by about MeV, thus further increasing the range of predicted cross sections at the most effective energies and increasing the uncertainties of the reaction rates.
VII Summary
Alpha-induced reactions were investigated at low energies using the activation technique in combination with -ray and X-ray spectroscopy. The cross sections of the (,), (,n), and (,2n) reactions were measured with unprecedented sensitivity, and thus far lower cross-section data could be obtained than available in literature. The lowest data points of the present work reach the upper end of the Gamow window for temperatures of the astrophysical process.
The new dataset allowed us to choose the best -nucleus optical model potential based on a strict -based statistical assessment. It was found that the best-fit theoretical calculations are obtained using either the latest potential by Avrigeanu et al. Avrigeanu14-PRC or the third version of the Demetriou et al. Demetriou02-NPA A-OMP with a scaling factor of 1.2 for the real part. The total reaction cross section is well constrained within a factor of two uncertainty down to the lowest -process temperatures. However, due to the systematic uncertainties of the present data, the other constituents of the statistical model calculations as the nucleon-nucleus optical model potential, -ray strength function, and level density cannot be constrained; but these constituents typically have only minor impact for the reaction rate calculations for the most important (,) reactions.