11email: daria.kubyshkina@oeaw.ac.at 22institutetext: Lund Observatory, Department of Astronomy and Theoretical Physics, Lund University, Box 43, SE-221 00 Lund, Sweden 33institutetext: Institute of Computational Modelling, SB RAS, 660036, Krasnoyarsk, Russia 44institutetext: Siberian Federal University, 660041, Krasnoyarsk, Russian Federation 55institutetext: Institute for Astronomy, University of Vienna, Türkenschanzstrasse 17, A-1180 Vienna, Austria 66institutetext: Observatoire astronomique de l’Université de Genève 51 ch. des Maillettes, 1290 Sauverny, Switzerland 77institutetext: Institute of Physics/IGAM, University of Graz, Universitätsplatz 5, A-8010 Graz, Austria
The Kepler-11 system: evolution of the stellar high-energy emission and initial planetary atmospheric mass fractions
The atmospheres of close-in planets are strongly influenced by mass loss driven by the high-energy (X-ray and extreme ultraviolet, EUV) irradiation of the host star, particularly during the early stages of evolution. We recently developed a framework to exploit this connection and enable us to recover the past evolution of the stellar high-energy emission from the present-day properties of its planets, if the latter retain some remnants of their primordial hydrogen-dominated atmospheres. Furthermore, the framework can also provide constraints on planetary initial atmospheric mass fractions. The constraints on the output parameters improve when more planets can be simultaneously analysed. This makes the Kepler-11 system, which hosts six planets with bulk densities between 0.66 and 2.45 g cm-3, an ideal target. Our results indicate that the star has likely evolved as a slow rotator (slower than 85% of the stars with similar masses), corresponding to a high-energy emission at 150 Myr of between 1-10 times that of the current Sun. We also constrain the initial atmospheric mass fractions for the planets, obtaining a lower limit of 4.1% for planet c, a range of 3.7–5.3% for planet d, a range of 11.1–14% for planet e, a range of 1–15.6% for planet f, and a range of 4.7–8.7% for planet g assuming a disc dispersal time of 1 Myr. For planet b, the range remains poorly constrained. Our framework also suggests slightly higher masses for planets b, c, and f than have been suggested based on transit timing variation measurements. We coupled our results with published planet atmosphere accretion models to obtain a temperature (at 0.25 AU, the location of planet f) and dispersal time of the protoplanetary disc of 550 K and 1 Myr, although these results may be affected by inconsistencies in the adopted system parameters. This work shows that our framework is capable of constraining important properties of planet formation models.
Key Words.:
Hydrodynamics – Planets and satellites: atmospheres – Planets and satellites: physical evolution – Planets and satellites: individual: Kepler-11 system1 Introduction
During the early stages of evolution, up to about 1–2 Gyr, late-type stars can follow different evolutionary paths in terms of their rotation rate and hence high-energy (X-ray plus extreme ultraviolet, EUV: hereafter XUV) emission (e.g. Tu et al. 2015; Johnstone et al. 2015b). Furthermore, the XUV emission from young stars has a decisive effect on the atmospheric loss and evolution of their planets (e.g. Lopez & Fortney 2013; Owen & Lai 2018). Therefore, the present-day properties of planetary atmospheres are intimately related to the evolutionary paths that were followed by their host stars. In general, hydrogen-rich planets are expected to orbit low-activity stars, as was shown by McDonald et al. (2019), who statistically studied the radius distribution of sub-Neptune-mass planets in relation to the amount of X-ray flux they received from the host stars integrated over their lifetime. However, this yields no information on individual systems.
Recently, we developed a framework that used this connection to extract the XUV evolution of a star from the current properties of orbiting planets. The framework uses a Bayesian scheme to track the evolution of a primordial hydrogen-dominated planetary atmosphere (i.e. it tracks the evolution of the planetary radius) as a function of the stellar XUV flux evolution history considering the system parameters (planetary mass, orbital separation, stellar mass, current stellar rotation period, and age of the system), their uncertainties, and the currently observed planetary radius (Kubyshkina et al. 2019).
Within the framework of our model, the ideal objects to study are close-in planets of sub-Neptune to Neptune masses because they are highly affected by atmospheric escape, but still retain a significant fraction of their primordial hydrogen-dominated atmospheres. Kubyshkina et al. (2019) tested the framework for a wide range of system parameters and then applied it to the HD 3167 and K2-32 planetary systems, each containing one planet with the appropriate characteristics for our analysis. However, the tests carried out and presented in that work indicated that the constraint on the evolution of the stellar XUV flux may improve significantly if the analysis is carried out simultaneously considering multiple planets in the same system.
| planet | [AU] | [] | [] | [g cm-3] | [] |
| b | (a) | (a) | (a) | (a) | (b) |
| (c) | |||||
| c | (a) | (a) | (a) | (a) | (b) |
| (c) | |||||
| d | (a) | (a) | (a) | (a) | (b) |
| (c) | |||||
| e | (a) | (a) | (a) | (a) | (b) |
| (c) | |||||
| f | (a) | (a) | (a) | (a) | (b) |
| (c) | |||||
| g | (a) | (a) | (a) | (a) | – |
With six rather low-density sub-Neptune-like planets, the Kepler-11 system appears to be an ideal target for applying our framework. The Kepler-11 system is composed of six closely packed planets within 0.5 AU, with planetary radii in the range of 1.8 to 4.3 but with densities that are significantly lower than those of the terrestrial planets and ice giants in the Solar System. From an analysis of the first 16 months of Kepler photometry, Lissauer et al. (2011) derived the planetary radii from transits and masses from transit timing variations, concluding that the five innermost Kepler-11 planets have bulk densities between 0.5 and 3.0 g cm-3. Lissauer et al. (2013) revised the previous analyses by employing 40 months of Kepler photometry and obtained slightly smaller planetary radii and significantly lower masses for the two innermost planets. This reduced the range of bulk densities to 0.6–1.7 g cm-3. In both studies, the stellar properties were obtained from the analysis of one (Lissauer et al. 2011) or two (Lissauer et al. 2013) Keck I spectra that were analysed with spectroscopy made easy (Valenti & Piskunov 1996; Valenti & Fischer 2005). From comparisons of the spectroscopic analysis results with stellar evolutionary tracks, they finally adopted a stellar mass of M⊙ and an age of 8.5 Gyr.
Bedell et al. (2017) revised the stellar properties using 22 newly obtained Keck spectra, deriving a stellar mass of 1.0420.005 M⊙ and a system age of 3.21.5 Gyr, indicating that Kepler-11 is very similar to the Sun. In addition to comparisons with stellar evolutionary tracks, Bedell et al. (2017) inferred the age of the system by employing gyrochronology (obtaining an age of 3–3.4 Gyr), lithium abundance (obtaining an age of 3.51.0 Gyr), the yttrium-to-magnesium [Y/Mg] abundance ratio (obtaining an age of 4.00.7 Gyr), and stellar activity (obtaining an age of 1.7 Gyr). All these estimates are well below those of Lissauer et al. (2013). By changing the stellar properties, Bedell et al. (2017) also revised the planetary properties and obtained somewhat different masses compared to previous estimates, but the bulk densities changed only slightly. We list the planetary masses, radii, and bulk densities obtained by Bedell et al. (2017) in Table 1.
We present here the results obtained from simultaneously modelling the atmospheric evolution of all Kepler-11 planets considering the more recent parameters given by Bedell et al. (2017). We also describe here a few upgrades to the modelling framework described by Kubyshkina et al. (2019). We give constraints on the evolution of the XUV emission of the host star and on the initial atmospheric mass fractions of the Kepler-11 planets. This paper is organised as follows. Section 2 gives a brief description of the modelling framework and of its upgrades with respect to what is described in Kubyshkina et al. (2019). Sections 3 and 4 present the results and their discussion, and Section 5 draws the conclusions of this work.
2 Modelling approach
The modelling framework we used for the analysis of the Kepler-11 system was developed and thoroughly described in Kubyshkina et al. (2019), but with a few improvements that we detail here. The modelling approach combines three main ingredients that are necessary to study the evolution of a planetary atmosphere: a model of the stellar flux evolutionary track, a model that relates planetary parameters and atmospheric mass, and a model for computing atmospheric escape rates.
The amount of XUV flux emitted by a late-type star is tightly related to the stellar rotation rate, and the evolutionary tracks for the stellar rotation rate of young (2 Gyr) late-type stars may follow different paths ranging from slow (rotation period longer than 8 days) to fast (rotation period shorter than 3 days) rotation (Johnstone et al. 2015b; Tu et al. 2015). To account for this, we modelled the rotation period (in days) as a power law in (age), normalised such that the rotation period at the present age () is consistent with the observed stellar rotation period (). We obtained
| (1) |
where the exponent is a positive value that typically ranges between 0 and 2 and controls the stellar rotation period at ages younger than 2 Gyr. After 2 Gyr, the different paths converge into one, for which we take the empirical power law given by Mamajek & Hillenbrand (2008).
From the rotation period at each moment in time, we derived the stellar X-ray and EUV luminosities following Pizzolato et al. (2003) and Wright et al. (2011), which relate rotation rates and stellar masses to X-ray luminosity, including saturation effects for the fastest rotators, and Sanz-Forcada et al. (2011), which relate X-ray and EUV fluxes. To account for variations in stellar bolometric luminosity, hence of the planetary equilibrium temperature, with time, we used the MESA isochrones and stellar tracks (MIST, Paxton et al. 2018) model grid.
To estimate the planetary mass-loss rate at each moment in time from the stellar flux and planetary parameters (mass , radius , equilibrium temperature , and orbital separation ), we used the analytic formulae given by Kubyshkina et al. (2018b), which have been derived fitting the results of a large grid of one-dimensional hydrodynamic upper-atmosphere models for planets hosting a hydrogen-dominated atmosphere (Kubyshkina et al. 2018a). Our hydrodynamic approach for modelling atmospheric escape considers only thermal escape and accounts for ionisation, dissociation, recombination, and L- and H-cooling. It therefore ignores ion-pickup interactions with the stellar wind. However, the inclusion of these non-thermal processes would not affect our results. This is shown by comparing the thermal and non-thermal mass-loss rates: Kislyakova et al. (2014) estimated that mass-loss rates from non-thermal processes for the Kepler-11 planets are between and , while the thermal mass-loss rates at the present time range between and , and were even higher during the early stages of evolution.
To estimate the atmospheric mass of a planet, , as a function of planetary parameters, Kubyshkina et al. (2019) employed the results of the model presented by Johnstone et al. (2015a), who pre-computed a grid of atmospheric masses for the range of planetary parameters covered by Kubyshkina et al. (2018a, b), among which we further interpolated during an evolution run. However, a series of works studying the Kepler-11 system (including Lissauer et al. 2011, 2013; Ikoma & Hori 2012) used the approximation given by Lopez & Fortney (2013, 2014). For this reason, to enable comparisons between our and previous results, particularly with respect to the initial atmospheric mass fraction , we here employ the approximation of Lopez & Fortney (2014) as the prime tool for deriving atmospheric mass fractions from the system parameters. However, we compared the two approaches for the specific case of the Kepler-11 system and obtained that the approximation of Lopez & Fortney (2014) leads to a slightly higher atmospheric mass than the model by Johnstone et al. (2015a). The differences increase with planetary mass and reach about 7% for planet e. We further tested the dependence of the final results on this choice and found that the differences are not significant. For both approaches, the core composition has only a minor influence on the result.
In our previous works we modelled the planetary atmospheric evolution (Kubyshkina et al. 2018a, 2019) and considered an initial planetary radius (and therefore ) corresponding to a value of the restricted Jeans escape parameter equal to 5, where is the Jeans escape parameter at the position of the planetary radius and for a temperature equal to , for a hydrogen-dominated atmosphere (Jeans 1925; Fossati et al. 2017). As we showed in Kubyshkina et al. (2019), this approximation does not influence the result for the majority of planets, but some of the planets in the Kepler-11 system (d, e, and likely g) are an exception. We therefore further set the initial atmospheric mass fraction of all planets as a free parameter here.
Combining the ingredients described above enables computing planetary atmospheric evolutionary tracks for any set of input parameters. We assumed that the stellar mass remains constant with time and ignored the contribution of gravitational contraction and radioactive decay on during the first phases of evolution. We furthermore assumed that each planet accreted a hydrogen-dominated atmosphere from the protoplanetary nebula. The starting time of the simulations was set to 1 Myr, but we ran tests for starting ages ranging between 0.3 and 10 Myr (see Section 3). The typical lifetimes of protoplanetary discs would be around 5 Myr (Mamajek 2009), but we focused on a younger age to enable comparison of our results with accretion models (see Section 4).
The analysis in this paper relies on the assumption that the orbital semi-major axes of the Kepler-11 planets have remained roughly constant since the dispersal of the gas disc. We now justify this assumption by arguing that only a very minor change in semi-major axes of a few percent can have taken place: a strong instability in the system’s past is unlikely, but tidal forces may have caused a minor change in semi-major axes.
When the parameters of Bedell et al. (2017) are used, the inner five planets are separated by 8.0, 15.7, 8.9, and 11.1 mutual Hill radii, while orbital eccentricities are low () and the system is coplanar to within . This compact, dynamically cold configuration likely rules out any significant orbital changes since the epoch of planet formation, which must have occurred within the gas disc for the planets to have acquired their significant hydrogen envelopes. The high multiplicity, low eccentricities and inclinations, and near-resonant period ratios are characteristic of super-Earth systems that remain stable after formation in the gas disc (Izidoro et al. 2019; Lambrechts et al. 2019). Lissauer et al. (2013) showed that assigning high eccentricities resulted in orbital instability in Myr, which additionally favours a dynamically cold configuration (low eccentricity and inclination) that has not undergone a past instability.
Although the planets have likely not undergone any major orbital changes since their formation, small changes in their semi-major axes could have occurred as a result of tidal deformation of the planets. Using the constant- tidal model of Jackson et al. (2008) and assuming a planetary tidal quality factor of , we find a timescale for tidal eccentricity damping of the inner planet of 600 Myr, so that some tidal evolution in the system is certainly possible. Kepler-11b and c are just wide of the 5:4 mean motion resonance, and differential tidal dissipation of neighbouring resonant planets has been invoked to explain why many Kepler systems have orbital period ratios just wide of exact integer ratios (e.g., Delisle et al. 2014; Delisle & Laskar 2014). In such scenarios, the orbital semi-major axes change by only a few percent because the damping ceases when the planets move away from the resonance and the associated eccentricity forcing weakens. Such a small change in orbital semi-major axes will result in a similarly small change in the incident XUV flux on the planets, much smaller than the range of fluxes corresponding to the range of stellar rotation histories considered in this paper.
At each step of the evolution, we first computed the mass-loss rate based on the stellar flux and system parameters, which we used to update the atmospheric mass fraction and the planetary radius. We adjusted the time step such that the change in atmospheric mass is lower than 5%. Finally, we applied a Bayesian approach to constrain the planetary initial mass fractions and the evolutionary tracks of the stellar XUV luminosity by fitting the currently observed planetary radii. To this end, we combined the planetary evolution model with the open-source Markov chain Monte Carlo (MCMC) algorithm of Cubillos et al. (2017) to compute the posterior distributions for for each planet, the stellar rotation rate, and the considered system parameters.
For each MCMC run, we let the planetary masses, age of the system, present-time rotation period, orbital separations, and stellar mass be free parameters, with Gaussian-like priors according to the measured values and uncertainties. The present-time rotation period of the star was defined using the surface rotation velocity and set as days (Bedell et al. 2017). The goodness of fit was quantified using chi-squared statistics. For the unknown parameters (initial atmospheric masses and the power law in Equation (1), which sets the evolution of the stellar XUV luminosity), we set a uniform prior within the following ranges. For , we considered a range from 0 to 2, where 0 corresponds to the stellar rotation period remaining constant before 2 Gyr and 2 corresponds to periods shorter than 0.3 days for the parameters of Kepler-11. For the atmospheric mass fractions of the five inner planets, we set uniform priors from 0 to 50%, while for the possibly high-mass planet g, we set a uniform prior between 0 and 100%. Increasing the upper limit for the atmospheric mass fractions does not significantly affect the results. As the degree of the power law given in Equation (1) is not intuitively clear, we provide the results in terms of the stellar rotation period at the age of 150 Myr. This particular age was chosen because it allows comparison with the distribution of stellar rotation periods measured in young open clusters (Johnstone et al. 2015b).
3 Results
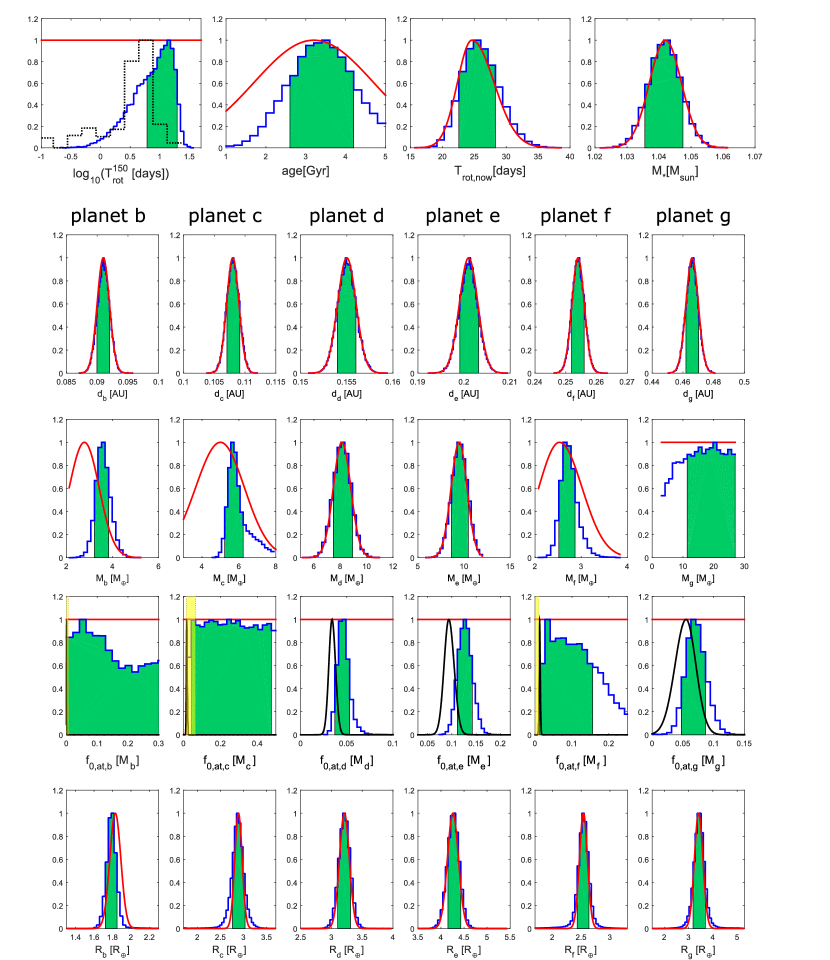
As mentioned above, we considered the system parameters given by Bedell et al. (2017). We obtained a rotation period at 150 Myr ranging between 5.7 and 19.7 days (Figure 1, top left panel), which corresponds to the long-period wing of the distribution obtained for stars in 150 Myr old open clusters (Johnstone et al. 2015b). In terms of X-ray luminosity, this range corresponds to values of about 1 and 10 times the X-ray luminosity of the present Sun. The posterior distributions of the system parameters are consistent with the priors, except for the mass of planet b, for which the posterior peaks at the 1 upper boundary of the prior. The planet lies very close to the host star, making it subject to powerful escape. For this reason, to avoid complete atmospheric escape, the framework tends to increase the mass of the planet because planet b is likely to still host a shallow hydrogen-dominated atmosphere (see Table 1), as discussed in detail in Kubyshkina et al. (2019).
Except for planet g, for which the prior mass is unconstrained, the mass posteriors match the prior distributions well for the heavier planets in the system (i.e. d and e), while the posteriors are significantly narrower than the priors for the lighter planets (b, c, and f). The 68 higher posterior density (HPD) credible intervals are 3.2-4.0 , 5.2-6.2 , and 2.5-2.9 for planets b, c, and f, respectively. For planet g, the posterior distribution decreases steeply to lower masses with a minimum of about , and is almost uniform above 11 . Although formally the lower boundary of HPD interval lies at 11 , the shape of the probability distribution function does not enable us to place any firm constraint on the planetary mass.
The posterior distributions (bottom row of Figure 1) are close to uniform for the two innermost planets, but are well constrained for planets d, e, f, and g. For planet b, the distribution has a broad maximum below an of about 15% (with a peak at 5%), and it remains practically uniform above this value. For planet c, we obtain a lower limit of 4.0%. For planet f, the least massive in the system, the posterior probability distribution is nearly flat between values of 4 and 13%, decreases steeply above this, has an isolated peak at 3%, and is cut abruptly below 1%. When the lifetime of the protoplanetary disc is increased above 3 Myr, the peak at 3% becomes less pronounced and the upper limit of 68% credible interval decreases to 10%. The posterior distributions for planets d and e have a Gaussian-like shape, and the HDP credible intervals lie in the 3.7–5.3% and 11.1–14.4% ranges, respectively. From the posterior distributions we conclude that the atmospheres of the two high-mass planets (d and e) likely remained nearly unaffected by atmospheric escape, while the low-mass planets b, c, and f have lost a significant amount of hydrogen, up to more than 10 times their present-day atmospheres.
It may look surprising that although the mass of planet g is unconstrained, the posterior probability distribution is quite narrow. The reason is that a small change in the fraction of hydrogen leads to a large change in planetary radius (well constrained by the observations) but to a small change in the planetary mass. To illustrate this, we considered a planet (orbiting at the position of planet g) with a mass of 10 and an atmospheric mass fraction of . By increasing by just the planetary radius increases by about 0.2 . Reaching the same change in atmospheric mass fraction by changing the planetary mass requires an increase in by 5 .
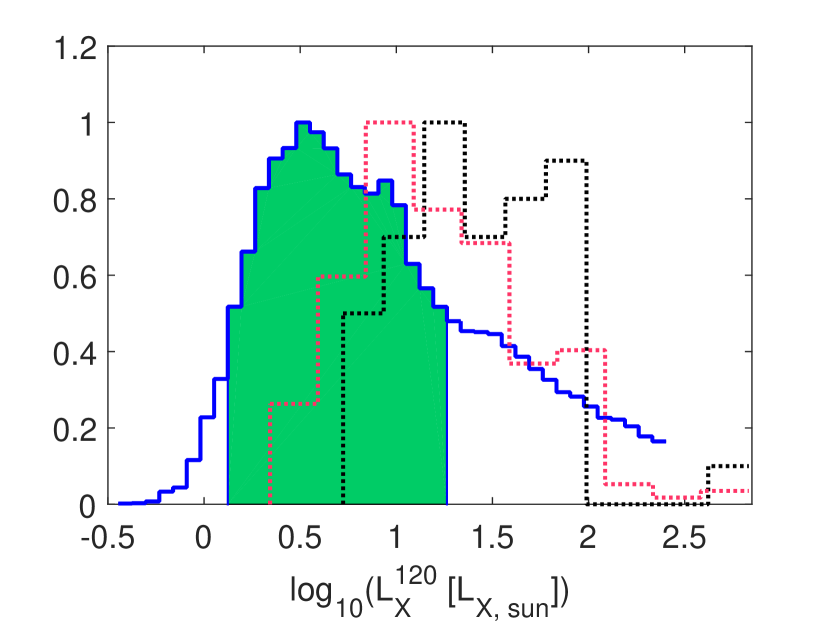
We used the empirical conversion between the rotational period of the star and its X-ray luminosity derived by Wright et al. (2011). However, this relation may not apply equivalently well for stars of different spectral type. To verify this, we collected X-ray measurements obtained for stellar members of the young (120 Myr) open cluster NGC 2516 (Pillitteri et al. 2006) and compare them to our results in Figure 2. This plot indicates that Kepler-11 was less active than the average stars of similar spectral type, which agrees with our results based on the stellar rotation period.
4 Discussion
Based on the system parameters given by Lissauer et al. (2011), Ikoma & Hori (2012) studied atmospheric accretion within the nebula for the five inner planets assuming a temperature of the protoplanetary disc ranging between 200 and 940 K and disc-dispersal ages ranging between 0.01 and 10 Myr. Therefore, the work of Ikoma & Hori (2012) provides a way to use the planetary atmospheric mass fractions derived above to infer the properties of the protoplanetary disc.
The model of Ikoma & Hori (2012) assumes a grainless atmosphere with a solar H/He abundance on top of a rocky body222The density of the rocky core has only a minor effect on the result. in pressure balance with the protoplanetary disc at either the Bondi radius or the Hill radius, whichever is smaller, and heated by the rocky core from below. The authors assumed that the planet is hot at the beginning of the simulation but has no further energy supply, so that the rocky body cools rapidly, on a timescale much shorter than the atmospheric accretion timescale. The protoplanetary disc dissipates concurrently with the growth of the atmosphere until full dissipation. The decrease in disc density results in atmospheric cooling. Furthermore, during disc dissipation, the atmospheres of planets whose masses are too low to undergo runaway accretion experience significant erosion due to the expansion of the atmosphere as a consequence of the decreasing external pressure provided by the disc (Stökl et al. 2015; Owen & Wu 2017). Because of their low masses, this also applies to the planets in the Kepler-11 system.
A direct combination of the results of Ikoma & Hori (2012) with our results is not strictly possible because of differences in the considered planetary and stellar masses; but the masses of planets d and e did not change significantly between Lissauer et al. (2011), which was considered by Ikoma & Hori (2012), and Bedell et al. (2017), which we considered here. For this reason, we searched for the parameters of the protoplanetary disc in the work of Ikoma & Hori (2012) that best fit the mass and posterior distributions of planets d and e. We obtained a disc dispersal time of 1 Myr and a temperature of 550 K at the position of planet f. After then fixing the disc dispersal time and temperature with the results for planets d and e, we determined the range of atmospheric mass fractions predicted by Ikoma & Hori (2012) for planets b, c, and f corresponding to the range of planetary masses given by our probability distributions for these three planets. We obtained values in the following ranges: below 0.5% for the planet b, 1.5–6.5% for the planet c, and below 1% for the planet f (see yellow shaded areas in Figure 1). These ranges lie close to the lower boundary of our estimates, except for planet f, where the range is practically below the lower boundary of our HPD credible interval, and it partly lies even below the present-time atmospheric mass fraction. This low value of an initial atmospheric mass fraction seems unlikely and might suggest that the protoplanetary disc may have survived longer than 1 Myr. These results indicate that our analysis has the potential of providing important constraints to planet formation models and calls for dedicated formation models that are more consistent with our input parameters and assumptions.
For planet g, we cannot place a constraint on the planetary mass. However, the same accretion model of Ikoma & Hori (2012) that fits other planets in the system predicts an initial atmospheric mass fraction above 70% for the mass range above and position of planet g. This estimate is largely higher than what the planet could possibly lose through atmospheric escape according to the results of our modelling. The initial mass of the atmosphere of planet g estimated in the present work (0.05-0.09 ) would indicate, according to the accretion model of Ikoma & Hori (2012), a planetary mass range between 3 and 4 Earth masses. Although this reasoning cannot be regarded as a strict constraint, it may indicate that the mass of planet g is significantly lower than the given upper limit.
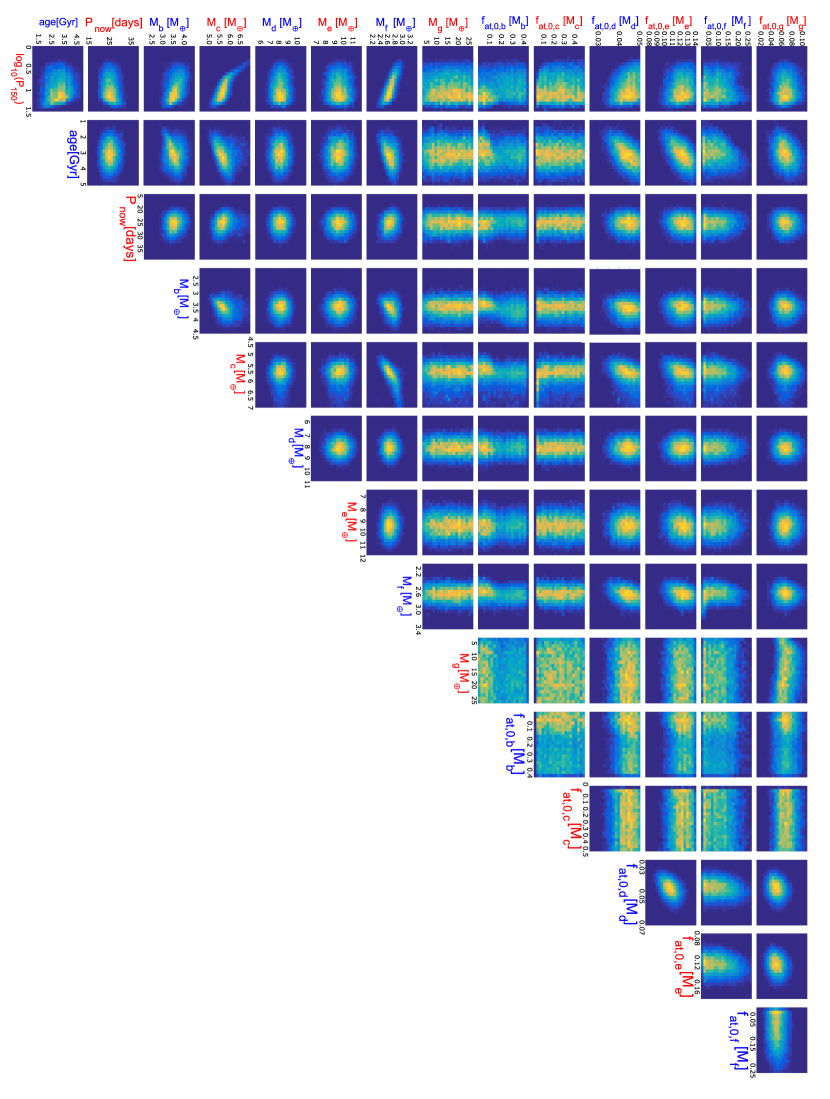
Figure 3 presents the pair-wise posterior distributions of the system parameters. In total, each MCMC run included 22 parameters, but to improve the readability of the plot, we excluded stellar mass and planetary orbital separations because they match the priors and do not show any correlation with other parameters. We searched for correlations in Figure 3. There is a weak correlation between age of the system and stellar rotation period at 150 Myr, , where a younger star corresponds to a slower rotator. The masses of planets b, c, and f are also correlated with (the slower the rotator, the lower the mass of the planet) and age of the system (the younger the system, the lower the mass of the planet). The initial atmospheric mass fractions of planets d, e, and g present a weak correlation with age (younger systems have smaller initial envelopes). The initial atmospheric mass fractions of planets b and c are instead independent of both age and stellar rotation period, indicating that the evolution of these atmospheres is completely set in the first few megayears during the saturation phase of the stellar XUV emission. These correlations arise because the strength and extent of atmospheric escape, hence the evolution of the planetary radius, depends on the age of the system, planetary mass, and stellar XUV emission, which is tightly related to the stellar rotation period (Section 2).
We employed a specific power law to describe the evolution of the stellar rotation model. Aiming to quantify possible variations in the result due to the choice of the model, we tested the effect of changing the age at which the two parts of the power law 1 merge (), which we set to be equal to 2 Gyr, by changing it between 800 Myr and 3 Gyr. We ran the full simulation setting at 800 Myr, 1.5 Gyr, and 3 Gyr (the run with equal to 2 Gyr is the default one) and obtained that the peak of the posterior distribution of the stellar rotation period at an age of 150 and 550 Myr changes by at most, while the edges of the HPD vary by up to , corresponding to variations in the stellar rotation period of up to one day. We further tested this by also changing the assumed time of the disc dispersal and found that the variations in the posterior distribution for the stellar rotation period at an age of 150 Myr are largest for shorter dispersal times (¡3 Myr), while for longer times the effect is smaller, particularly for longer than 2 Gyr. We also found that for the planets with the lowest masses (i.e. planets b, c, and f) variations in the posterior distributions for planetary mass and initial atmospheric mass fraction are always lower than and , respectively, while they are negligible for the high-mass planets (i.e. planets d and e). We find typically small variations probably because most of the atmosphere escapes in the first few tens of megayears, which is a short period of time compared to the timescales described by the two portions of the power law, hence by the specific position of .
5 Conclusions
The Kepler-11 system is composed of a star with approximately solar mass and six planets in the range of super-Earths to Neptune mass, five of which orbit within the distance of Mercury to the Sun. However, based on their observed masses and radii, all Kepler-11 planets seem to still retain hydrogen-dominated atmospheres. We employed a planetary atmospheric evolution scheme in a Bayesian framework to derive the evolutionary path of the stellar rotation, and therefore high-energy emission, and to constrain the initial atmospheric mass fractions of the six planets.
Our results indicate that this exotic configuration with six close-in low-density planets is possible when the star has evolved as a slow rotator, following an evolution of the rotation period covered by about 15% of all stars in the 0.9–1.1 M⊙ mass range. We also found that the initial atmospheric mass fractions can be well constrained for high-mass and/or distant planets because for such planets, atmospheric escape is not strong enough to dramatically affect the atmosphere, even during the early stages of evolution. Specifically, in the Kepler-11 system, this is the case for planets d and e, for which we obtain narrow posterior distributions of the initial atmospheric mass fraction, which indicate that both planets have lost about 35% of their initial hydrogen atmospheric content. In particular, for planets d and e, we find that the initial atmospheric mass fraction was likely to lie within 3.7–5.3% and 11.1–14.2%, respectively. For the outermost planet (planet g), assuming 10 , which corresponds to the formal lower mass limit, escape has led to a total loss of about 15% of the initial hydrogen atmospheric content, with an initial atmospheric mass fraction peaking at about 6.5%. For the other planets in the system (b, c, and f), the probability distributions of the initial mass fraction are significantly broader, but still enable us to place some constraints. For planet b, we find that the initial atmospheric mass fraction was likely below 10%, for planet c we find that it was higher than 4%, and for planet f we find that it was between 1 and 15%.
We further employed our results for planets d and e in combination with those of Ikoma & Hori (2012) to make a first attempt at constraining the temperature and lifetime of the protoplanetary disc. We obtained values of 550 K at the position of planet f and 1 Myr. Further comparisons for planets b, c, and f suggest that a disc-dispersal time of 1 Myr may be underestimated. These results should be taken with caution because of differences in the system parameters considered in this work and by Ikoma & Hori (2012).
We have shown that planetary atmospheric evolution modelling can be a very powerful tool for constraining both planet formation processes (i.e. atmospheric accretion) and stellar characteristics (i.e. evolution of the stellar rotation rate), in particular for the latter, which is otherwise difficult, if not impossible, to obtain by other means. In theory, our analysis framework could be applied to any planet, but it gives meaningful results only for systems hosting at least one planet currently holding a hydrogen-dominated atmosphere and for which the planetary mass and radius and the age of the system are well measured. Most (sub-)Neptunes have so far been detected by the Kepler and K2 missions, but the masses and ages of many of these planets are poorly constrained. The Transiting Exoplanet Survey Satellite, TESS (Ricker et al. 2015) and CHaracterising ExOPlanets Satellite, CHEOPS (Broeg et al. 2013) missions are expected to greatly increase the number of systems that can be analysed in this way, hence giving us the possibility to constrain planet formation and the evolution of stellar rotation on the basis of a statistically significant sample of planets.
References
- Bedell et al. (2017) Bedell, M., Bean, J. L., Meléndez, J., et al. 2017, ApJ, 839, 94
- Broeg et al. (2013) Broeg, C., Fortier, A., Ehrenreich, D., et al. 2013, European Physical Journal Web of Conferences, 03005
- Cubillos et al. (2017) Cubillos, P., Harrington, J., Loredo, T. J., et al. 2017, AJ, 153, 3
- Delisle et al. (2014) Delisle, J.-B., Laskar, J., & Correia, A. C. M. 2014, A&A, 566, A137
- Delisle & Laskar (2014) Delisle, J.-B., & Laskar, J. 2014, A&A, 570, L7
- Fossati et al. (2017) Fossati, L., Erkaev, N. V., Lammer, H., et al. 2017, A&A, 598, A90
- Ikoma & Hori (2012) Ikoma, M., & Hori, Y. 2012, ApJ, 753, 66
- Izidoro et al. (2019) Izidoro, A., Bitsch, B., Raymond, S. N., et al. 2019, arXiv e-prints, arXiv:1902.08772
- Jackson et al. (2008) Jackson, B., Greenberg, R., & Barnes, R. 2008, ApJ, 678, 1396
- Jeans (1925) Jeans, J. 1925, The Dynamical Theory of Gases. By Sir James Jeans. Cambridge University Press, 1925. ISBN: 978-1-1080-0564-7
- Johnstone et al. (2015b) Johnstone, C. P., Güdel, M., Brott, I., & Lüftinger, T. 2015b, A&A, 577, A28
- Johnstone et al. (2015a) Johnstone, C. P., Güdel, M., Stökl, A., et al. 2015a, ApJ, 815, L12
- Kislyakova et al. (2014) Kislyakova, K. G., Johnstone, C. P., Odert, P., et al. 2014, Astronomy and Astrophysics, 562, A116
- Kubyshkina et al. (2019) Kubyshkina, D., Cubillos, P., Fossati, L., et al. 2019, ApJ, 879, 1, 26
- Kubyshkina et al. (2018a) Kubyshkina, D., Fossati, L., Erkaev, N. V., et al. 2018a, A&A, 619, A151
- Kubyshkina et al. (2018b) Kubyshkina, D., Fossati, L., Erkaev, N. V., et al. 2018b, ApJ, 866, L18
- Lambrechts et al. (2019) Lambrechts, M., Morbidelli, A., Jacobson, S. A., et al. 2019, A&A, 627, A83
- Lissauer et al. (2011) Lissauer, J. J., Fabrycky, D. C., Ford, E. B., et al. 2011, Nature, 470, 53
- Lissauer et al. (2013) Lissauer, J. J., Jontof-Hutter, D., Rowe, J. F., et al. 2013, ApJ, 770, 131
- Lopez & Fortney (2013) Lopez, E. D., & Fortney, J. J. 2013, ApJ, 776, 2
- Lopez & Fortney (2014) Lopez, E. D., & Fortney, J. J. 2014, ApJ, 792, 1
- McDonald et al. (2019) McDonald, G. D., Kreidberg, L., & Lopez, E. 2019, ApJ, 876, 22
- Mamajek & Hillenbrand (2008) Mamajek, E. E., & Hillenbrand, L. A. 2008, ApJ, 687, 1264-1293
- Mamajek (2009) Mamajek, E. E. 2009, American Institute of Physics Conference Series, 1158, 3
- Owen & Wu (2017) Owen, J. E., & Wu, Y. 2017, ApJ, 847, 29
- Owen & Lai (2018) Owen, J. E., & Lai, D. 2018, MNRAS, 479, 5012
- Paxton et al. (2018) Paxton, B., Schwab, J., Bauer, E. B., et al. 2018, ApJS, 234, 34
- Pillitteri et al. (2006) Pillitteri, I., Micela, G., Damiani, F., et al. 2006, A&A, 450, 993
- Pizzolato et al. (2003) Pizzolato, N., Maggio, A., Micela, G., Sciortino, S., & Ventura, P. 2003, A&A, 397, 147
- Ricker et al. (2015) Ricker, G. R., Winn, J. N., Vanderspek, R., et al. 2015, Journal of Astronomical Telescopes, Instruments, and Systems, 1, 014003
- Sanz-Forcada et al. (2011) Sanz-Forcada, J., Micela, G., Ribas, I., et al. 2011, A&A, 532, A6
- Stökl et al. (2015) Stökl, A., Dorfi, E., & Lammer, H. 2015, A&A, 576, A87
- Tu et al. (2015) Tu, L., Johnstone, C. P., Güdel, M., & Lammer, H. 2015, A&A, 577, L3
- Valenti & Fischer (2005) Valenti, J. A., & Fischer, D. A. 2005, ApJS, 159, 141
- Valenti & Piskunov (1996) Valenti, J. A., & Piskunov, N. 1996, A&AS, 118, 595
- Wright et al. (2011) Wright, N. J., Drake, J. J., Mamajek, E. E., & Henry, G. W. 2011, ApJ, 743, 48