Multiple populations in globular clusters and their parent galaxies††thanks: Based on observations with the NASA/ESA Hubble Space Telescope, obtained at the Space Telescope Science Institute, which is operated by AURA, Inc., under NASA contract NAS 5-26555. .
Abstract
The ‘chromosome map’ diagram (ChM) proved a successful tool to identify and characterize multiple populations (MPs) in 59 Galactic Globular Clusters (GCs). Here, we construct ChMs for 11 GCs of both Magellanic Clouds (MCs) and with different ages to compare MPs in Galactic and extra-Galactic environments, and explore whether this phenomenon is universal through ‘place’ and ‘time’. MPs are detected in five clusters. The fractions of 1G stars, ranging from 50% to 80%, are significantly higher than those observed in Galactic GCs with similar present-day masses. By considering both Galactic and MC clusters, the fraction of 1G stars exhibits: (i) a strong anti-correlation with the present-day mass, and (ii) with the present-day mass of 2G stars; (iii) a mild anti-correlation with 1G present-day mass. All Galactic clusters without MPs have initial masses smaller than M⊙ but a mass threshold governing the occurrence of MPs seems challenged by massive simple-population MC GCs; (iv) Milky Way clusters with large perigalactic distances typically host larger fractions of 1G stars, but the difference disappears when we use initial cluster masses. These facts are consistent with a scenario where the stars lost by GCs mostly belong to the 1G. By exploiting recent work based on Gaia, half of the known Type II GCs appear clustered in a distinct region of the integral of motions space, thus suggesting a common progenitor galaxy. Except for these Type II GCs, we do not find any significant difference in the MPs between clusters associated with different progenitors.
keywords:
globular clusters: general, stars: population II, stars: abundances, techniques: photometry.1 Introduction
Observational evidence demonstrates that most Galactic Globular Clusters (GCs) host two main groups of stars with different chemical composition (hereafter first-generation and second-generation, or 1G and 2G). The origin of this phenomenon remains one of the most-intriguing open issues in the field of stellar astrophysics (e.g. Kraft, 1994; Gratton et al., 2004; Gratton et al., 2012; Marino et al., 2015, 2019, and references therein).
Using the diagnostic tool of a pseudo-color diagram called ‘Chromosome Map’ (ChM), Milone
et al. (2017, 2018b) and Zennaro et al. (2019) have provided an unprecedented detailed analysis of the multiple populations (MPs) pattern in Milky Way GCs.
ChMs have shown that MPs are indeed the common outcome of the formation of all the 59 Milky Way GCs analyzed.
Although MPs are present in most studied Galactic GCs, each cluster still exhibits its own specific pattern. The number of distinct populations
ranges from two (e.g. NGC 6397) to more than seventeen (NGC 5139, hereafter Centauri). The
fractions of 1G stars vary from a minimum of less than 10% ( Centauri) to more than 60% (e.g. NGC 6717 and NGC 6838).
Neverthless, MPs in Galactic GCs share some common properties.
In general,
MPs can be separated into two main discrete groups of 1G and 2G stars in the ChM, and their relative importance depends on the cluster mass. The incidence and complexity of the MP phenomenon in Galactic GCs both increase with cluster mass:
more massive Galactic GCs have larger helium variations and a predominance of 2G stars. Similarly, the color extension of the ChM correlates with the mass of the host GC (Milone, 2015; Milone
et al., 2017, 2018b; Lagioia et al., 2019a).
ChMs have also revealed the presence of two classes of clusters, namely Type I and Type II GCs, with the latter constituting 17% of the objects and displaying a more complex chemical pattern, including variations in Fe and heavy elements (e.g. Marino et al., 2009; Marino
et al., 2015; Yong &
Grundahl, 2008; Yong
et al., 2014; Johnson et al., 2015; Johnson
et al., 2017; Da Costa et al., 2009).
According to some scenarios, GCs have experienced multiple bursts of star formation where 2G stars formed from material polluted by more massive 1G stars (e.g. Ventura et al., 2001; Decressin et al., 2007; Denissenkov &
Hartwick, 2014; D’Antona
et al., 2016).
One of the most intriguing and controversial implications is that the proto GCs should have been substantially more massive at birth (e.g. Ventura
et al., 2014). This condition comes from the evidence that in most clusters the present-day 1G stars are the minority population (e.g. Milone
et al., 2017) and that only a small fraction of the mass of 1G stars
is delivered with the proper chemical composition to make 2G stars. Thus, the proto GCs
should have lost a large fraction of their
1G stars into the Galactic halo, thus making a significant
contribution to the early assembly of the Galaxy (e.g. Renzini
et al., 2015).
In alternative scenarios, all GC stars are coeval and the chemical enrichment of 2G stars is attributed to the accretion of material processed and ejected by massive or supermassive stars of the same generation in the proto GCs (e.g. Bastian et al., 2013; Gieles et al., 2018).
The formation mechanism of the MPs may well have important implications for the assembly of the Milky Way halo and for other galaxies that host GC systems. Consequently, the present lack of knowledge of the origin of this phenomenon is an important issue that needs to be resolved. What we need to understand is the series of events that led from primordial gas clouds in the early Universe to the GCs with their MPs that we see today; if the MP phenomenon depends on age (and redshift); and if any dependence with the parent galaxy exists. In other words, could the Milky Way environment have favoured the formation of GCs with MPs? And, to what extent have GCs contributed to the assembly of their host galaxy, in particular of their stellar halo?
What we know about MPs in extragalactic environments comes essentially from observations of GCs in nearby Local Group galaxies. Similarly to Galactic GCs, the -Gyr old GCs of the Large and Small Magellanic Clouds (LMC, SMC), Fornax and the M 31 GC G 1 host MPs, (e.g. Mucciarelli et al., 2009; Larsen et al., 2014; Hollyhead et al., 2017; Niederhofer et al., 2017; Lagioia et al., 2019b; Nardiello et al., 2019; Gilligan et al., 2019), thus indicating that the MP phenomenon is not restricted to the Milky Way.
Spectroscopic elemental abundances of stars in MC clusters younger than 2 Gyr suggest that these objects, at odds with old Milky Way GCs, are chemically homogeneous (e.g. Mucciarelli et al., 2014; Martocchia et al., 2017). Similarly, the extended main-sequence turn offs and multiple main sequences (MSs) observed in clusters younger than Gyr in both the Milky Way and MCs are interpreted as due to stellar rotation(e.g. D’Antona et al., 2015; Milone et al., 2017; Li et al., 2017; Cordoni et al., 2018; Marino et al., 2018c; Bastian et al., 2018; Marino et al., 2018a; Milone et al., 2018a), rather than to chemical variations, and are possibly associated with age spreads (e.g. Goudfrooij et al., 2011, 2017). These observations have prompted the idea that MPs may have formed exclusively at high redshift.
On the other hand, the recent discovery that MC GCs with ages between 2 and 10 Gyr host stellar populations with different nitrogen abundance (e.g. Niederhofer et al., 2017; Hollyhead et al., 2017, 2018; Lagioia et al., 2019b) suggests that MPs might not be exotic events from the past, but can also form at lower redshift. Alternatively, it has been speculated that the occurrence of chemical anomalies may depend on the stellar mass and the MPs appear only in stars with masses less than 1.6 (Bastian & Lardo, 2018), though no specific physical mechanism was envisaged.
However, while many observations, mostly based on the ChM, have allowed the accurate characterization of MPs in Galactic GCs, MPs in extragalactic environments are still poorly constrained. Specifically, the lack of ChMs for extra-Galactic GCs prevents us from a direct comparison of the MPs properties with Milky Way GCs, and it remains unclear whether MPs in other galaxies exhibit the same features of variety, discreteness and dependence on the cluster mass as observed in Galactic GCs.
Furthermore, it remains to be understood whether the two classes of Type I and Type II GCs have the same origin, or if the Type II objects could have originated in extragalactic environments, as tentatively suggested by Marino et al. (2015, 2019). In this hypothesis, the properties of the parent galaxies hosting Type II GCs might be different from those of galaxies hosting Type I clusters alone. The identification of Type II GCs in the Magellanic Clouds, for example, would be important to understand the origin of Type II clusters.
To shed light on the dependence of the MP phenomenon on the galactic environment, an in-depth comparison of young and old GCs in different galaxies is mandatory to understand to what extent the MPs phenomenon depends on formation redshift and whether the properties of MPs are universal or depend on the host galaxy. In this paper we exploit multi-band photometry from archive HST data to extend a similar investigation based on the ChM performed in the surveys of MPs in Galactic GCs to four LMC clusters, namely NGC 1783, NGC 1806, NGC 1846 and NGC 1978, and seven SMC clusters, Lindsay 1, Lindsay 38, Lindsay 113, NGC 121, NGC 339, NGC 416, and NGC 419 with ages between and 10.5 Gyrs.
Historically, several authors (e.g. Zinn, 1993; van den Bergh, 1993; Mackey & Gilmore, 2004) have used metallicities and horizontal-branch morphologies to infer two distinct sub-systems of Milky Way GCs; those formed in satellite galaxies and those formed ’in-situ’ within the Galaxy. In a recent work, Massari et al. (2019), linked each Galactic GC to the most-probable progenitor galaxy, based on Gaia data release 2 (DR2) data (Gaia Collaboration et al., 2018) and defined two groups of GCs, accreted and formed in-situ. To explore the nature of different classes of Milky Way GCs, we have examined if GCs with different origins would exhibit different properties in their stellar populations.
The paper is organized as follows. The data and the data analysis are presented in Section 2, while in Sections 3 and 4 we respectively build the ChMs of the analyzed LMC and SMC clusters and derive the fraction of 1G and 2G stars in each cluster. Section 5 is focused on the comparison of stellar populations in GCs of different parent galaxies. Summary and conclusions are provided in Section 6.
2 Data and data analysis
In this work we use the fraction of 1G stars with respect to the total number of stars measured for 59 Galactic GCs by Milone et al. (2017, 2018b) and Zennaro et al. (2019) and analyzed archive data for an additional eleven clusters in the LMC and SMC.
To derive the fraction of 1G stars in the seven Magellanic Cloud clusters Lindsay 1, Lindsay 38, Lindsay 113, NGC 121, NGC 339, NGC 416, and NGC 1978, we used the photometric and astrometric catalogs published by Lagioia et al. (2019a, b) based on HST images collected through the F336W, F343N, F438W, F814W filters of WFC3/UVIS and the F814W filter of ACS/WFC. We refer to the papers by Lagioia and collaborators for details on the dataset and the data analysis.
The main properties of the WFC3/UVIS and ACS/WFC images of the other four Magellanic Cloud clusters, NGC 419, NGC 1783, NGC 1806 and NGC 1846, together with additional images of LINDSAY1 and NGC 416, are summarized in Table 1. Stellar photometry and astrometry are derived from images corrected for the poor charge transfer efficiency (CTE) of HST (see Anderson & Bedin, 2010, for details) and employing the Jay Anderson’s software package KS2, which is the evolution of , developed by Anderson et al. (2008) to analyze WFC/ACS data.
Two different methods have been adopted to derive the magnitudes and positions of stars depending on their luminosities. To measure bright stars we first fit the best point-spread function (PSF) model in each individual exposure, and then average the various measurements to get the best estimates for flux and position. The KS2 routines combine information from all exposures to measure faint stars, determine the average stellar position from all exposures and then fit each exposure pixel with the PSF solving for the magnitude only (see Sabbi et al., 2016; Bellini et al., 2017, for details).
Instrumental magnitudes have been calibrated to the Vega mag system as in Bedin et al. (2005) by using the photometric zero points provided by the Space Telescope Science Institute webpages111http://www.stsci.edu/hst/wfc3/analysis/uvis_zpts/ and http://www.stsci.edu/hst/acs/analysis/zeropoints. We corrected stellar positions for geometric distortion by using the solutions provided by Anderson & King (2006) for ACS/WFC or Bellini & Bedin (2009) and Bellini et al. (2011) for UVIS/WFC3. To select the stars with the best photometry and astrometry, we identified in the catalogs the isolated sources that are well fitted by the PSF model and have small random mean scatters in position and magnitude. To do this, we used the method described by Milone et al. (2009) that is based on the various diagnostics of the astrometric and photometric quality provided by KS2. Photometry has been corrected for differential reddening and spatially-dependent variations of the photometric zero point due to small inaccuracies in the sky determination and in the PSF model as in Milone et al. (2012b).
2.1 Artificial stars
We further performed artificial-star (AS) experiments to estimate the photometric errors and to compare the observed ChMs with those expected for a simple stellar population. Specifically, we generated for each cluster a catalog containing positions and fluxes of 100,000 ASs. We assumed for ASs the same F814W luminosity distribution as derived for the real stars and calculated the corresponding colors from the fiducial lines of red-giant branch (RGB), sub-giant branch (SGB), and MS stars. Moreover, we adopted the same radial distribution for the ASs as observed for the real stars in close analogy to Milone et al. (2009).
Photometry and astrometry of ASs have been carried out as in Anderson et al. (2008, see their Section 6) by adopting the same computer programs and the same methods by Anderson and collaborators that we used for real stars and described in Section 2. We considered an AS as recovered if the measured flux and position differ by less than 0.75 mag and 0.5 pixel, respectively, from the corresponding input values. We applied to ASs the same stringent criteria described in Section 2 to select a sample of stars with high photometric and astrometric quality and included in the analysis only the selected stars.
| ID | CAMERA | FILTER | DATE | NEXPTIME | PROGRAM | PI |
| LINDSAY 1 | UVIS/WFC3 | F275W | Jun 12 2019 | 1500s1501s21523s21525s | 15630 | N. Bastian |
| NGC 416 | UVIS/WFC3 | F275W | Jun 18 2019 | 1500s1512s21525s21529s | 15630 | N. Bastian |
| NGC 419 | UVIS/WFC3 | F336W | Aug 25 2011 | 400s600s2700s740s | 12257 | L. Girardi |
| UVIS/WFC3 | F343N | Aug 03 2016 | 450s21250s1650s | 14069 | N. Bastian | |
| UVIS/WFC3 | F438W | Aug 03 2016 | 70s150s350s550s | 14069 | N. Bastian | |
| WFC/ACS | F555W | Jul 08 2006 | 220s4496s | 10396 | J. Gallagher | |
| WFC/ACS | F814W | Jan 15 - Jul 08 2006 | 410s8474s | 10396 | J. Gallagher | |
| NGC 1783 | UVIS/WFC3 | F336W | Oct 12 2011 | 21190s1200s | 12257 | L. Girardi |
| UVIS/WFC3 | F343N | Sep 14 2016 | 450s845s1650s | 14069 | N. Bastian | |
| WFC/ACS | F435W | Jan 14 2006 | 90s2340s | 10595 | P. Goudfrooij | |
| WFC/ACS | F814W | Jan 14 2006 | 8s2340s | 10595 | P. Goudfrooij | |
| WFC/ACS | F814W | Oct 07 2003 | 170s | 9891 | G. Gilmore | |
| NGC 1806 | UVIS/WFC3 | F336W | Oct 12 2011 | 21190s1200s | 12275 | L. Girardi |
| UVIS/WFC3 | F343N | Sep 13-14 2016 | 450s845s1650s | 14069 | N. Bastian | |
| WFC/ACS | F435W | Sep 29 2005 | 90s2340s | 10595 | P. Goudfrooij | |
| WFC/ACS | F555W | Sep 29 2005 | 40s2340s | 10595 | P. Goudfrooij | |
| WFC/ACS | F555W | Aug 08 2003 | 300s | 9891 | G. Gilmore | |
| WFC/ACS | F814W | Sep 29 2005 | 8s2340s | 10595 | P. Goudfrooij | |
| WFC/ACS | F814W | Aug 08 2003 | 200s | 9891 | G. Gilmore | |
| NGC 1846 | UVIS/WFC3 | F336W | Apr 16-17 2011 | 900s81032s | 12219 | A. P. Milone |
| UVIS/WFC3 | F343N | Apr 04 2016 | 450s845s1650s | 14069 | N. Bastian | |
| WFC/ACS | F435W | Jan 01 2006 | 90s2340s | 10595 | P. Goudfrooij | |
| WFC/ACS | F555W | Jan 01 2006 | 40s2340s | 10595 | P. Goudfrooij | |
| WFC/ACS | F555W | Oct 08 2003 | 300s | 9891 | G. Gilmore | |
| WFC/ACS | F814W | Jan 01 2006 | 8s2340s | 10595 | P. Goudfrooij | |
| WFC/ACS | F814W | Oct 08 2003 | 200s | 9891 | G. Gilmore |
2.2 Globular Cluster parameters
In this paper we investigate stellar populations in Magellanic Cloud and Galactic GCs. Our analysis on Galactic GCs requires a number of quantities taken from the literature such as the present-day masses, , and the initial cluster masses, , from Baumgardt & Hilker (2018) and Baumgardt et al. (2019), the GC ages from Dotter et al. (2010) and Milone et al. (2014), and the parameters of the GC orbits from Baumgardt et al. (2019). The integrals of motion (IOM) are provided by Massari et al. (2019) and include the energy, , the angular momentum in z-direction, , and , which is the angular momentum component perpendicular to (e.g. Helmi & de Zeeuw, 2000).
We used the fractions of 1G stars derived by Milone et al. (2017) and Milone et al. (2018a) and the maximum internal helium variations from Milone et al. (2018b) and Zennaro et al. (2019). We assumed that Ruprecht 106 and Terzan 7 are composed of 1G stars alone as shown by Villanova et al. (2013); Milone et al. (2014); Dotter et al. (2018); Lagioia et al. (2019a) from either spectroscopy or multi-band photometry of RGB stars. Similarly, we considered AM 1, Eridanus, Palomar 3, Palomar 4, Palomar 14 and Pyxis as simple populations, as suggested by Milone et al. (2014) based on the horizontal-branch morphology.
The ages and maximum internal helium variations of the eleven LMC and SMC clusters used in this paper are listed in Table 2 together with the references to the corresponding literature papers. Present-day masses and initial masses of NGC 419, NGC 1783, NGC 1806 and NGC 1846 are taken from Goudfrooij et al. (2014), while present-day and initial masses of Lindsay 1, Lindsay 38, Lindsay 113, NGC 121, NGC 339, NGC 416, and NGC 1978 are derived by Paul Goudfrooij by using the same methods and computer programs described by Goudfrooij et al. (2014) (see also Goudfrooij et al., 2011).
Although the work by Baumgardt & Hilker (2018) and Goudfrooij et al. (2014) provide state of the art estimates for initial masses of Galactic and MC GCs, their mass determinations are affected by a number of uncertainties. An important factor is related to our poor knowledge of the evolution of the Milky Way and the MCs, and their tidal fields. Other significant uncertainties are due to processes during the formation and early evolution of star clusters whose impacts are hard to estimate quantitatively, especially for star clusters with current ages older than a few Gyr. Examples of the latter processes are mass loss due to interactions with molecular clouds in their birth environment (e.g., Fall et al., 2009; Fall & Chandar, 2012) and the unknown level of primordial mass segregation, which can cause a significant spread of mass loss rates over the first few Gyr (e.g., Vesperini et al., 2009). Indeed, GC masses used here are derived by assuming that the gravitational potential of the Galaxy and the MCs is time independent and there is no initial mass segregation. In addition, Goudfrooij and collaborators estimate the initial cluster masses of Magellanic Cloud GCs by considering a tidally limited model cluster with a moderate degree of mass segregation, , and using the results of the simulation called SG-R1 in D’Ercole et al. (2008). Table 2 provides both estimates of GC initial masses.
3 Multiple populations in Magellanic Cloud clusters
The ChM is a pseudo-color diagram used to identify and characterize stellar populations along the MS, RGB, or asymptotic giant branch (AGB) of GCs (Milone et al., 2015; Marino et al., 2017). Milone et al. (2017, 2018b) build the ChMs for 58 GCs by using the color, which is mostly sensitive to stellar populations with different helium abundance, and the =()() pseudo color, which maximizes the separation among stellar populations with different nitrogen content. In particular, the ChM allows to distinguish 1G stars, which are distributed around the origin of the reference frame, and 2G stars that are extended towards large and small (i.e. negative) .
The fact that accurate photometry in the F275W band can be obtained from space telescopes for relatively bright stars only, is one of the main challenges to derive the ChM of distant GCs. To overcame this problem, Zennaro et al. (2019) exploited the color and the =()() pseudo color to build the ChM of the outer-halo GC NGC 2419 and of the GCs M 15 and 47 Tucanae. They find that this alternative ChM, similarly to the classical ChM that involves F275W photometry, is also an efficient tool to identify MPs in GCs and demonstrated that the groups of 1G and 2G stars selected from both ChMs are almost identical.
To derive the ChM for each analyzed LMC and SMC cluster, we combined information from the vs. CMD and the vs. pseudo-CMD, which are mostly sensitive to stellar populations with different abundances of helium and nitrogen, respectively. We obtained the verticalized color and the pseudo-color of RGB stars by using the procedure described in Milone et al. (2015, 2017) and Zennaro et al. (2019).
The resulting vs. ChMs are plotted in Figure 1 (black points), where we also show the distribution expected from a single population (orange points) and derived from the ASs.
Among the eleven analyzed Magellanic Cloud clusters, NGC 121 exhibits the most-complex ChM. In addition to the group of 1G stars clustered around the origin of the reference frame, it hosts an extended 2G that comprises a stellar population with and and a group of stars with intermediate values of and . Clearly, the ChMs of Lindsay 1, NGC 339 and NGC 416 exhibit two stellar populations, with the 2G of Lindsay 1 and NGC 339 hosting a minority of the total number of cluster stars. The distribution of stars in the ChM of NGC 1978 shows a tail of stars with , which is not expected from observational errors alone, thus suggesting that this cluster hosts also a small fraction of 2G stars. The remaining GCs, namely Lindsay 38, Lindsay 113, NGC 419, NGC 1783, NGC 1806 and NGC 1846 show no evidence for multiple populations. The same conclusion that these clusters are consistent with simple populations is provided by Martocchia et al. (2019) by using different photometric diagrams.
3.1 Reading the vs. ChM
To interpret the ChMs shown in the panels of Figure 1 we adopted the isochrones used by Milone et al. (2018b) that account for the typical chemical composition of stellar populations in GCs. These isochrones are obtained by assuming stellar atmospheric parameters from the Dartmouth stellar evolution database (Dotter et al., 2008) and using appropriate synthetic spectra to account for the specific abundances of He, C, N and O in 1G and 2G stars (see Milone et al., 2018b, for details).
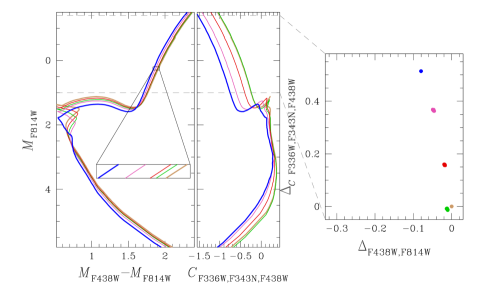
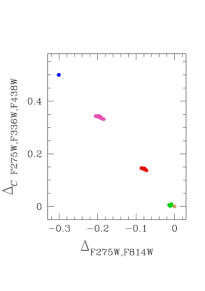
We plot in the left panels of Figure 2 the vs. CMD and the vs. pseudo CMD of five isochrones, I1—I5, with ages of 13.0 Gyr, [Fe/H]=1.5, [/Fe]=0.4 and different chemical compositions. Specifically, we assumed that the two isochrones I1 and I5 have extreme helium values of Y=0.247 and 0.297, while isochrones I2, I3 and I4 have intermediate helium abundances and are enhanced in helium by ∆Y=0.02, 0.02, and 0.03, respectively, with respect to I1. We used solar C, N and O abundances for both I1 and I2. I5 has the most-extreme chemical composition ([C/Fe]=0.5, [N/Fe]=1.2 and [O/Fe]=), while I3 and I4 exhibit intermediate C, N, O abundances that correspond to [C/Fe]=0.15, [N/Fe]=0.40 and [O/Fe]=0.20 and [C/Fe]=0.30, [N/Fe]=0.80 and [O/Fe]=, respectively.
The isochrone segments with are used to derive the vs. ChM plotted in the middle panels of Figure 2.
The isochrone I1 populates the origin of the reference frame in this ChM, whereas stars with the most-extreme chemical composition (isochrone I5) exhibit the largest values of and . The stellar populations described by isochrones I3 and I4 occupy intermediate positions in the ChMs with respect to I1 and I5. Isochrones I1 and I2, which share the same C, N, and O abundances but different helium content, have similar values.
The isochrones plotted in Figure 2 are previously used by Milone
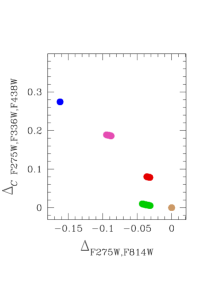
et al. (2018b) to characterize the classical vs. ChM (see their Figure 6). We reproduce the ChM by Milone and collaborators in the right panels of Figure 2.
The quantity used in the classical ChM provides a wider pseudo-color separation between the stellar populations than . This is mostly due to the fact that stars with the same luminosity but different helium contents differ in their effective temperatures. As a consequence, the color, which is more sensitive than to effective-temperature variations, provides a wider pseudo-color separation among stellar populations with different helium abundance. On the other hand, the pseudo-color is slightly less effective than to separate the five stellar populations plotted in Figure 2.
Despite the differences above, the comparison between middle and left panels in Figure 2 reveals that, qualitatively, the five stellar populations occupy similar relative positions in both ChMs. This fact confirms previous findings by Zennaro et al. (2019) who show that 1G and 2G stars in NGC 104 and NGC 7078 occupy similar positions in the vs. and vs. ChMs.
In the lower panels of Figure 2 we extend the analysis to five stellar populations with [Fe/H]=0.5, [/Fe]=0.0 and age of 2 Gyr. The differences in He, C, N and O for the isochrones I2–I5 with respect to I1 are the same as those adopted for the simulation of the 13-Gyr stellar populations. A visual inspection of the classical ChM and the vs. ChM reveals that MPs in young and old GCs qualitatively exhibit similar behaviours. We also note that 2-Gyr old stellar populations span a wider range of and than those with 13 Gyr. Such difference is mostly due to the fact that the young populations are more-metal rich than the old ones. Moreover, the RGBs of the I2 and I3 stellar populations plotted in the upper panel of Figure 2 share almost the same F438WF814W colors, while the I3 RGB stars shown in the lower panel have slightly bluer F438WF814W colors than I2 stars with the same F814W magnitude. We verified that the different metallicities and effective temperatures of the analyzed young and old RGB stars are responsible for such small color difference.
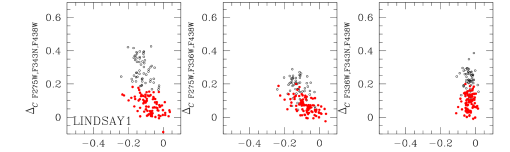
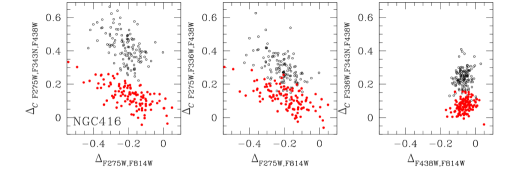
To further demonstrate that the 1G and 2G stars occupy similar positions in the ChMs by Milone et al. (2017) and in those used in this paper, we compare in Figure 3 the vs. (see Milone, 2019), vs. and vs. ChMs for Lindsay 1 and NGC 416. Clearly, the sample of 1G stars and 2G stars, which are identified from left-panel ChMs and are colored red and black, respectively, exhibit similar relative locations in the three ChMs. These results demonstrate that the vs. diagram is an efficient tool to identify and characterize 1G and 2G stars in young and old GCs.

4 The fraction of first- and second-generation stars in LMC and SMC clusters
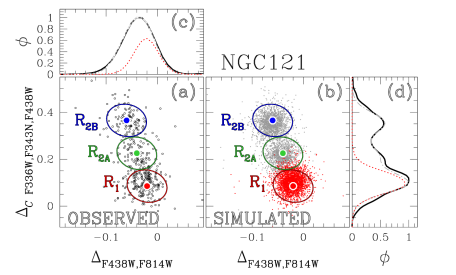
To calculate the relative numbers of stars in the stellar populations of Lindsay 1, NGC 121, NGC 416, NGC 339, and NGC 1978 we applied the procedure illustrated in Figure 4 for NGC 121. This method was developed by Milone et al. (2012a) to derive the fraction of stars in the distinct stellar populations in GCs by using the CMD and extended by Nardiello et al. (2018) and Zennaro et al. (2019) to the ChM.
We defined three elliptical regions, namely , , and in the ChM of NGC 121. Each ellipse has the same axis ratio and inclination as the ellipse that provides the best fit with the error distribution. The coordinates of the centers of the ellipses correspond to the average values of and of the stars in the three stellar populations of the clusters.
We expect that, due to observational errors, each region comprises stars of the three stellar populations. Specifically, the number of stars within the region , , is made up of 1G, 2GA and 2GB stars (, , ) according to the following relation
| (1) |
where , , and are the fractions of 1G, 2GA and 2GB stars, respectively, within R1. Similar relations involve the number of stars, (), within the regions () of the ChM and the fraction of 1G, 2GA and 2GB stars within these regions (, , and ).
The number of stars in the three populations of NGC 121 are calculated by solving for these three equations. The values of , and used in these equations are derived by counting the stars within the corresponding ellipses, as illustrated in Figure 4a. In Figure 4b we show the procedure to derive the fraction of 1G stars within the R1, R2 and R3 used in the equations 1. To do this, we used ASs to simulate 1G stars only (red points). The values of , , and are the ratio between the number of simulated stars within R1, R2 and R3 and the total number of simulated 1G stars. We used a similar procedure to estimate the fractions of 1G, 2GA and 2GB stars within regions R2A and R2B.
We find that 1G includes 51.7%2.6 of the total number of analyzed RGB stars, while the 2GA and 2GB host 20.72.1% and 27.62.3% of stars, respectively. The size of each ellipse is chosen by eye with the criterium of including at the same time the bulk of simulated ASs and minimizing the overlap between two adjacent regions. However, we verified that by changing the major axis by 25% the resulting values of the population ratios are the same within 0.008 (see also Nardiello et al., 2018). Similarly, we verified that when we use circles instead of ellipses the results are nearly the same, thus indicating that the conclusion do not significantly depend on the shape of the region.
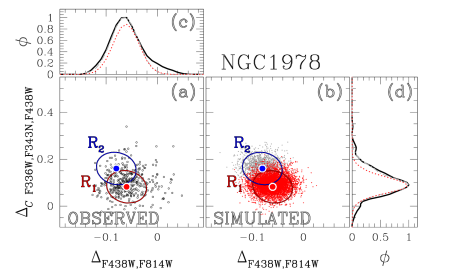
The same method has been applied to Lindsay 1, NGC 416, NGC 339 and NGC 1978, where we identified two groups of 1G and 2G stars. Figure 5 illustrates the same procedure described above for NGC 121 but for NGC 1978, which is the MP cluster where the 2G is less evident. Results are listed in Table 2. The fraction of 2G stars dramatically changes from one cluster to another and ranges from 0.15 in NGC 1978 and NGC 339 to 0.50 in NGC 121.
4.1 Internal helium variation
We verified that the groups of 1G and 2G stars of Lindsay 1, NGC 121, NGC 339 and NGC 416 identified in our paper comprise almost the same stars classified as first- and second generation by Lagioia et al. (2019b) who also estimated the helium difference between 2G and 1G stars in these GCs (Y2G-1G). Since Lindsay 1, NGC 339 and NGC 416 host only two populations, the values of Y2G-1G derived by Lagioia and collaborators correspond to the maximum internal helium variation within these clusters (Ymax).
In the case of NGC 121, we estimated Ymax as the helium difference between 2GB and 1G stars by using the method introduced in Milone et al. (2013) and used by Lagioia et al. (2019b). Briefly, we measured the color difference between the RGB fiducial lines of 2GB and 1G stars at four different values of the F814W luminosity. The comparison between the observed colors with appropriate grid of synthetic spectra with different abundances of He, C, N and O provides an estimate of the relative abundances of these elements. We find that the maximum internal helium variation within NGC 121 is Y, and the abundance differences between the synthetic spectra of 2GB and 1G stars that provide the best fit with the data are [C/Fe]=0.300.10, [N/Fe]=0.800.15 and [O/Fe]=0.450.15. Similarly, we estimate that the helium difference between the two stellar populations of NGC 1978 is Y, and the best-fit values of [C/Fe], [N/Fe] and [O/Fe] correspond to 0.050.05, 0.070.03 and 0.000.03, respectively.
In the same way as we have distinguished between the classical phenomenon of MPs in ancient GCs and the presence of extended turnoffs and split main sequences of young MC and Galactic clusters (attributed to stellar populations with different rotation rates and possibly different ages) a note of warning is necessary when discussing the nitrogen difference among stars. In fact, a nitrogen increase as low as found among the stars in NGC 1978 is not necessarily a signature of ‘multiple populations’ in the sense of the term derived from our knowledge of ancient GCs. For instance, in the context of binary evolution, pure CN cycling, occurred in the stellar interior and later exposed in the stellar atmosphere of a companion star through different paths of binary evolution, can account for up to a factor two increase in the nitrogen abundance. Further, the small percentage of these anomalous stars (15%) makes them compatible with being remnants of peculiar evolutionary paths. Binary evolution, on the contrary can not explain [N/Fe] variations larger than 0.3 dex associated with oxygen depletion, which are associated with the full CNO cycle.
5 Relations with the host galaxy
To investigate the importance of environment and age on the onset of MPs in GCs and to understand whether the MP properties depend on the host galaxy or not, we compare the results on Magellanic Cloud clusters established in the previous section, with similar findings for Galactic GCs.
5.1 Comparing multiple populations of Galactic and Magellanic-Cloud clusters
As discussed in Section 2.2, work based on the ChM provided homogeneous determinations of the fractions of 1G and 2G stars in 59 clusters (Milone et al., 2017; Zennaro et al., 2019) mostly observed as part the UV survey of Galactic GCs (Piotto et al., 2015). Besides these 59 GCs, some clusters seem to show no evidence of multiple populations (see Villanova et al., 2013; Milone et al., 2014; Dotter et al., 2018; Lagioia et al., 2019a, for details).
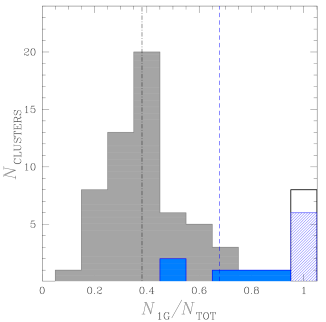
We compare in Figure 6 the histogram distribution of the fraction of 1G stars in Galactic GCs (gray histogram), with the corresponding distribution for SMC and LMC GCs (blue histogram). The analyzed LMC and SMC clusters with multiple populations host, on average, a higher fraction of 1G stars than the studied sample of Galactic GCs. In particular, the fractions of 1G stars of NGC 339 and NGC 1978 are significantly larger than those observed in Milky Way GCs.
Milone et al. (2017) showed that the fractions of 2G stars in Galactic GCs correlate with the absolute luminosity of the host cluster (from the 2010 version of the Harris, 1996, catalog) and with cluster mass (from McLaughlin & van der Marel, 2005). Although there is no significant correlation with the orbital parameters of the host clusters, GCs with large perigalactic distances ( kpc) tend to have smaller fractions of 2G stars than GCs with similar absolute luminosities and kpc (Zennaro et al., 2019). We verified that the result by Zennaro et al. (2019), which is based on the values of by Baumgardt & Hilker (2018), is confirmed when perigalactic distances from Massari et al. (2019) are used.
In the upper-left panel of Figure 7 we adopted gray dots to represent the fraction of 1G stars for Galactic GCs against the logarithm of the GC masses by Baumgardt & Hilker (2018). When we consider only Galactic GCs with multiple populations, the Spearman’s rank correlation coefficient between these two quantities is , where the uncertainty is estimated by bootstrapping with replacements performed 10,000 times. The error indicates one standard deviation of the bootstrapped measurements. Hence, we confirm the anti-correlation between GC mass and fraction of 1G stars for clusters with MPs. The Spearman’s rank correlation coefficient is when we include the analyzed candidate simple population GCs.
We confirm the conclusion by Zennaro et al. (2019) that GCs with multiple populations and kpc (red starred symbols of Figure 7) have systematically larger fractions of 1G stars than the remaining Milky Way GCs. The difference is more extreme in the studied Magellanic Cloud clusters (blue symbols in Figure 7), where the fraction of 1G stars is even larger than that of Galactic GCs with large perigalactic radii.
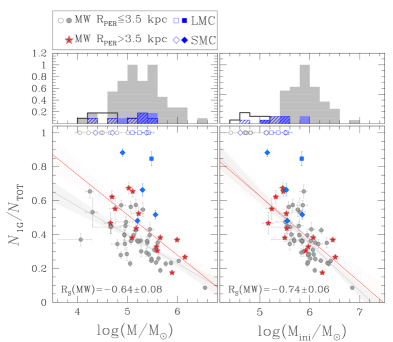
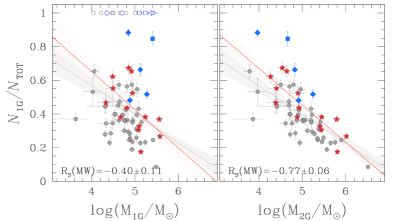
We find that the fraction of 1G stars exhibits a weak anti-correlation with the present-day mass of 1G stars as shown lower-left of Figure 7 (RS(MW)=0.400.11). In contrast, there is strong anti-correlation with the present-day mass of 2G stars corresponding to RS(MW)=0.770.06 (lower-right panel of Figure 7).
Finally, in the upper-right panel of Figure 7 we plotted the fraction of 1G stars as a function of the logarithm of the initial cluster masses from Baumgardt & Hilker (2018) and Goudfrooij et al. (2014). Initial masses provide stronger correlations with the fraction of 1G stars than those derived from present-day masses, as indicated by the high absolute values of the correlation coefficients, Rs(MW), for Galactic GCs with multiple populations and Rs(MW)= for all Galactic GCs, respectively. In this case, clusters with large perigalactic radii follow the same relation as GCs with kpc as demonstrated by the fact that the least-squares best-fit lines obtained from these two groups of clusters overlap each other.
The fractions of 1G stars in three out of five MC clusters with MPs are comparable with those of Galactic GCs with similar masses at formation, thus supporting the possibility of a universal relation between initial mass and fraction of 1G stars.
In the uppermost panels of Figure 7 we show the histogram distributions of the present-day masses and of the initial masses (taken at face values from Baumgardt & Hilker (2018) and Goudfrooij et al. (2014), but see the caveats discussed in Section 2.2.) for Galactic GCs with multiple populations (gray histograms), Galactic GCs with no evidence of multiple populations (black open histogram), Magellanic Cloud GCs with multiple populations (blue-shaded histogram) and for Magellanic Cloud GCs where we did not detect multiple populations (white-blue histogram). Clearly, both Galactic and MC GCs without multiple populations exhibit, on average, lower present-day masses than MP GCs but the present-day mass distributions of GCs with and without MPs overlap each other. The mass difference between simple- and multiple-population Galactic GCs is more pronounced when we consider the initial masses. Specifically, the fact that all Galactic GCs with initial masses larger than host multiple populations, whereas simple-populations Galactic GCs have initial masses, suggests a possible mass threshold for the formation of MPs (e.g. Bragaglia et al., 2012).
However, the presence of a universal mass threshold of for the onset of multiple populations seems challenged by the evidence that some Magellanic Cloud GCs with initial masses of are consistent with simple populations, whereas NGC 339, with an initial mass of hosts MPs. We further note that the masses of simple stellar population MC GCs are similar to the masses of 1G stars in multiple-population GCs.
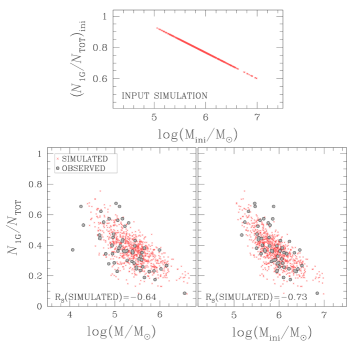
In an attempt to interpret the results of Figure 7, we ran a large number of Monte-Carlo simulations. In each of them, we simulated 10,000 clusters with a distribution of initial masses that is similar to the one derived by Baumgardt & Hilker (2018) for the analyzed Galactic GCs, and with an initial fraction of 1G stars, ()ini, that linearly increases from at to at . We assumed that each GC retains a fraction of its initial mass of 1G (2G) corresponding to a fixed value () plus a Gaussian scatter, (). Finally, we calculated the resulting fraction of 1G stars, the cluster mass and the total mass of 1G and 2G stars and added to these value the same uncertainties associated with the observations.
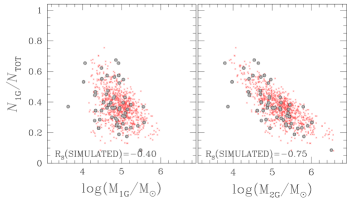
The best match with the observations of Figure 7 corresponds to and . In this simulation we assumed that the 1G retains 16% of its initial mass in stars with , while the 2G retains 95% of its stars, with . Results from the best-fit simulation are illustrated in Figure 8 and indicate that observations are consistent with a scenario where the stars lost by GCs mostly belong to the 1G.
5.2 Multiple populations and cluster age
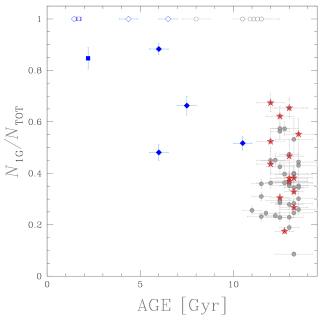
Figure 9 shows that there is no evidence for a significant correlation between the fraction of 1G stars in Milky-Way GCs and the cluster ages, although simple-population Galactic GCs have ages between 8 and 11 Gyr and are younger than the remaining GCs with multiple populations.
The five LMC and SMC clusters where we detected multiple populations have ages of 2.0–10.5 Gyr and are younger than the bulk of Milky Way GCs. Their fractions of 1G stars are, on average, higher than those of Galactic GCs, although NGC 121, NGC 416 and NGC 339 host similar fractions of 1G stars as some 13 Gyr-old Milky Way clusters.
As discussed in the previous subsection, the fraction of 1G stars mostly depends on the mass of the host GC, and that it is challenging to compare masses of clusters with different ages of different galaxies. As a consequence, we believe that it is not possible to draw any strong conclusion on a possible relation between the fraction of 1G stars and cluster age, without properly removing the effect of cluster mass (see also discussion by Lagioia et al., 2019a).
5.3 Multiple populations and helium abundance
The maximum internal helium variation in GCs ranges from less than to more than in mass fraction and correlates with the total luminosity and the present-day mass of the host GC (e.g. Milone, 2015; Milone et al., 2018b; Lagioia et al., 2018; Zennaro et al., 2019). Figure 10 shows that clusters dominated by 1G stars exhibit small helium spreads and the fraction of 1G stars anti-correlates with the maximum helium variation. The fraction of 1G stars rapidly increases in GCs with Y, while for the clusters with large helium variations the 1G fraction generally lies between 0.1 and 0.4.
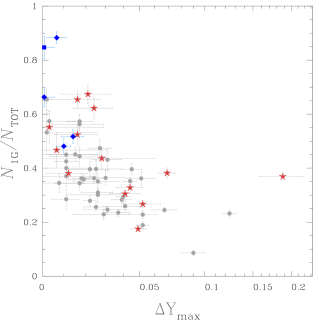
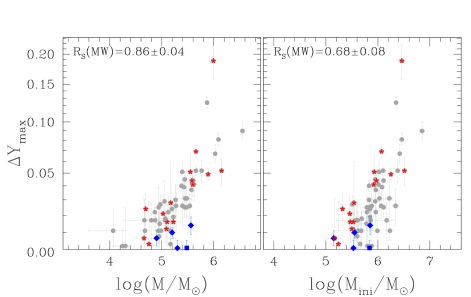
Figure 11 shows that the maximum internal helium variation of Galactic GCs correlates with the present day cluster mass and that Galactic GCs with kpc exhibit the same trend as the remaining Galactic clusters. As regards the five Magellanic Cloud clusters with multiple populations, the range in Ymax is small: a correlation with present-day mass may exist, but relative to the Galactic GCs, the Ymax values at constant present-day mass are smaller. The correlation between the maximum helium variation and the logarithm of cluster mass is still present when we use the initial masses, but the significance of the correlation for Milky Way GCs is (MW)=0.680.08 and thus is lower than that obtained from present-day masses ((MW)=0.860.04). For a fixed initial mass, Galactic GCs with large perigalactic radii exhibit, on average, larger internal helium spreads than the remaining clusters. MC clusters follow the same trend as Galactic GCs in the Ymax vs. plane.
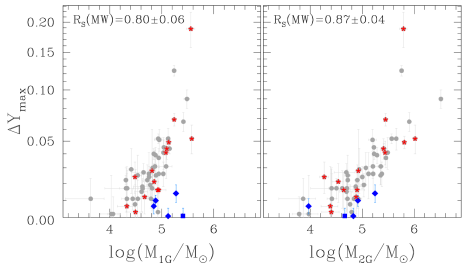
Ymax correlates with the present-day masses of both 1G and 2G stars, with the latter showing the highest values of the Spearman’s correlation rank coefficient ((MW)=0.870.04). Magellanic Cloud clusters have lower values of Ymax than Galactic GCs with similar 1G masses and the difference diminishes when we use the masses of 2G stars.
| ID | age [Gyr] | [pc] | Ymax | ||||
|---|---|---|---|---|---|---|---|
| Lindsay 1 | 8.00.5b | 17.231.61e | 5.30g | 5.53a | 6.23a | 0.6630.037a | 0.0000.004b |
| Lindsay 38 | 6.00.5c | 12.740.53e | 4.70g | 5.13a | 5.79a | 1.00a | 0.000a |
| Lindsay 113 | 4.50.5c | 15.251.38a | 4.36h | 4.61a | 5.10a | 1.00a | 0.000a |
| NGC 121 | 10.50.5b | 8.500.70e | 5.56g | 5.85a | 6.31a | 0.5170.026a | 0.0140.004a |
| NGC 339 | 6.50.5b | 11.690.66e | 4.90g | 5.15a | 5.81a | 0.8830.022a | 0.0070.004b |
| NGC 416 | 6.00.5b | 4.970.77e | 5.20g | 5.55a | 6.05a | 0.4810.030a | 0.0100.003b |
| NGC 419 | 1.60.1c | 5.380.08f | 5.38f | 5.51f | 5.94f | 1.00a | 0.000a |
| NGC 1783 | 1.60.1d | 5.420.11f | 5.42f | 5.54f | 5.98f | 1.00a | 0.000a |
| NGC 1806 | 1.60.1d | 5.100.06f | 5.10f | 5.23f | 5.66f | 1.00a | 0.000a |
| NGC 1846 | 1.60.1d | 5.240.09f | 5.24f | 5.37f | 5.80f | 1.00a | 0.000a |
| NGC 1978 | 2.00.1d | 6.810.19a | 5.48a | 5.84a | 6.28a | 0.8470.042a | 0.0010.003a |
5.4 Multiple populations in Galactic Globular Clusters and the progenitor galaxy
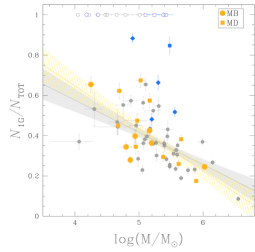
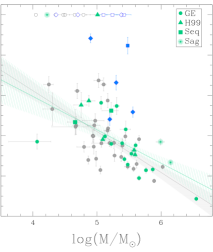
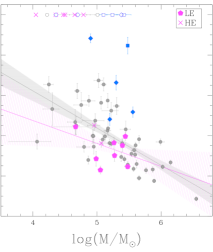
Recent results, mostly based on data provided by the Gaia mission, revealed that the Milky Way and its GCs have experienced a complex assembly history. Massari et al. (2019) analyzed the dynamics of Galactic GCs to identify clusters with common origins. They argue that 40% of clusters would have formed in situ, in the Galaxy which they designate as the ‘Main Progenitor’. This group includes 36 Bulge clusters (MB) and 26 disk clusters (MD). On the other hand, about 35% of Milky Way GCs are the results of merger events with from the merger events of the Gaia-Enceladus dwarf galaxy (GE, Helmi et al., 2018), of the progenitor of the Helmi streams (H99, Helmi et al., 1999; Koppelman et al., 2019), of the Sagittarius dwarf galaxy (Sag, Ibata et al., 1994) and of the Sequoia galaxy (Seq, Myeong et al., 2019). As for the other clusters, about 16% appear to be associated with a group of high-binding energy clusters (LE) with the remainder on loosely bound orbits (HE) with heterogeneous origins.
We now use the allocations by Massari et al. (2019) to investigate the properties of GCs with different progenitors. In the left and middle panels of Figure 12 we show that clusters formed in situ (yellow symbols), clusters that result from mergers (aqua symbols), and LE clusters follow very-similar behaviours in the vs. plane. This result suggests that there is no evidence for a significant difference between the analyzed behaviour of multiple populations and the tentative progenitor galaxy. Possible exceptions include the facts that some LE clusters have low 1G fractions compared to other GCs of similar mass, and that all unassociated HE GCs but NGC 6584 and NGC 6934 are consistent with simple populations.
Historically, GCs have been tentatively grouped in different subsystems on the basis of their metallicities and horizontal-branch morphologies alone, (e.g. Zinn, 1993; van den Bergh, 1993). Mackey & Gilmore (2004) defined three subsystems of ‘young’ halo GCs, possibly formed in external satellite galaxies, ‘old’ halo GCs and Bulge-Disk GCs, which are believed to be born in the Milky Way. For completeness, we applied the same analysis discussed above to those three groups of GCs defined by Mackey and Gilmore and find that they share similar behaviours, thus corroborating the conclusion that the fraction of 1G stars does not significantly depend on the candidate host galaxy.
5.5 Type II GCs in the integral of motion space
In recent papers, Milone et al. (2017) and Marino et al. (2019) defined defined two classes of GCs, designated Type I and Type II, based on the ChMs of 58 clusters. In this sample, 83% exhibit a single sequence of 1G and 2G stars in the ChM; these are the Type I clusters. The Type II clusters show multiple sequences of 1G and 2G stars in the ChMs and optical band photometry of these clusters reveals split SGBs in the CMD (e.g. Milone et al., 2008; Marino et al., 2009; Piotto et al., 2012). Studies based on the synergy of photometry and spectroscopy revealed that Type II GCs correspond to the class of ‘anomalous’ GCs with star-to-star variations in some heavy elements, like Fe and s-process elements. The sample of all Type II GCs comprises NGC 362, NGC 1261, NGC 1851, Centauri, NGC 5286, NGC 6273, NGC 6388, NGC 6656 (M 22), NGC 6715 (M 54), NGC 6934, NGC 7078 (M 15), NGC 7089 (M 2) and Terzan 5 (e.g. Marino et al., 2009; Marino et al., 2015, 2018b; Da Costa et al., 2009; Yong & Grundahl, 2008; Yong et al., 2014, 2016; Carretta et al., 2010; Johnson et al., 2015; Johnson et al., 2017; Nardiello et al., 2018; Ferraro et al., 2009; Massari et al., 2014).
Due to their complex chemical composition, Type II GCs have been often associated with remnants of dwarf galaxies that have been cannibalized by the Milky Way (e.g. Marino et al., 2015, 2017). This possibility is supported by the fact that this class of clusters includes M 54, in the nucleus of the Sagittarius dwarf spheroidal galaxy, and Centauri, which is the most-massive Milky Way GC and, due to the extreme metallicity variation, has been considered as the surviving remnant of a tidally disrupted dwarf galaxy.
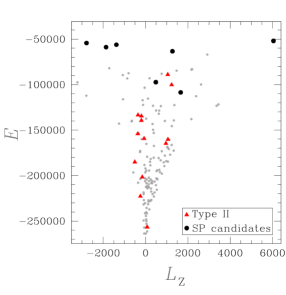
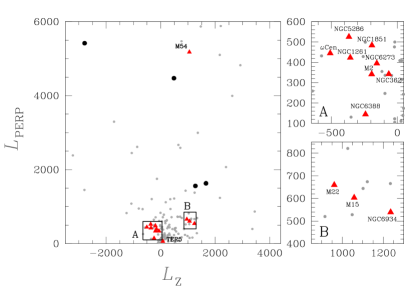
Figure 13 reveals that most Type II GCs are clustered in two distinct regions of the integral of motion space (from Massari et al., 2019). We distinguish a main group of seven Type II clusters, including Cen, NGC 362, NGC 1261, NGC 1851, NGC 5286, NGC 6273 and NGC 7089 (M 2), with km/s kpc and km/s kpc, shown as region A in Figure 13. NGC 6388 shares similar values of as these seven clusters but smaller km/s kpc.
Based on 100,000 Monte-Carlo simulations, where we assumed that the simulated GCs have the same distribution in the IOM as the observed clusters, we find that the probability that seven (or more) out of thirteen randomly-extracted GCs populate a 500250 (km/s kpc)2 square region of the vs. plane is 0.021. In all these cases, the area that includes the seven GCs is centered in the region with km/s kpc, where we observe the highest density of clusters. Hence, we conclude that the fact that seven Type II GCs are clustered in such a small region of the vs. plane around km/s kpc and km/s kpc is unlikely a coincidence due to random event. As a consequence, at least these seven clusters are possibly associated with the same parent galaxy. This is consistent with the associations given in Massari et al. (2019), who found six out of these seven GCs to be likely linked to Gaia-Enceladus. The only remaining cluster, namely NGC 6723, was associated to the LE group, that is located next to Gaia Enceladus in the IOM space. Given the uncertainty in the associations of clusters to progenitors with similar dynamical properties, it is not unreasonable to consider NGC 6723 as well as a possible member of Gaia Enceladus.
We also note that four Type II GCs have km/s kpc and km2/s2. Three of them, NGC 6656 (M 22), NGC 6934 and NGC 7078 (M 15), populate the region B of the vs. plane with similar values of between 500 and 700 km/s kpc. The fourth cluster is M 54, whixh has a much higher value of . However, the small number of three GCs, prevents us from any conclusion on their origin. For completeness, we show that the sample of high-energy GCs is mostly composed of simple-population GCs (large black dots in Figure 13).
6 Summary and final remarks
In this work we compare the properties of MPs in Magellanic Cloud GCs and in Galactic GCs either formed in situ or associated with various progenitor galaxies. Our goal is to investigate whether the presence of MPs is a universal phenomenon or depends on the host galaxy. The main results of the paper can be summarized as follows:
-
•
We derived the vs. ChM of eleven GCs in the LMC and SMC with ages between 1.5 and 10.5 Gyr to search for evidence of MPs with different light-element abundances. We find that the ChMs of Lindsay 1, NGC 121, NGC 339, NGC 416 and NGC 1978 are not consistent with a simple population thus confirming previous results based on CMDs made with photometry in appropriate filters (e.g. Dalessandro et al., 2016; Niederhofer et al., 2017; Lagioia et al., 2019a; Martocchia et al., 2018a, b, 2019; Chantereau et al., 2019) and on stellar spectroscopy (Hollyhead et al., 2017, 2018).
-
•
From the ChMs we estimated the fractions of 1G and 2G stars in these MC clusters, in the same manner as previously done for Milky Way GCs. We find that the fraction of 2G stars ranges from 15% in NGC 339 and NGC 1978 to about 50% in NGC 121. The remaining GCs, Lindsay 38, NGC 419, Lindsay 113, NGC 1783, NGC 1806 and NGC 1846, show no evidence of MPs in agreement with the conclusion drawn by Mucciarelli et al. (2014); Milone (2017); Martocchia et al. (2017); Li et al. (2019) for these clusters.
-
•
We compared the population ratios derived for these MC clusters with the fractions of 1G stars measured from the ChMs of 56 Galactic GCs by Milone et al. (2017) and Zennaro et al. (2019). Moreover, we included in the analysis eight Galactic GCs that are likely composed of a simple population ( but are still lacking a ChM analysis, Villanova et al., 2013; Milone et al., 2014; Dotter et al., 2018; Lagioia et al., 2019a). Milone et al. (2017) show that the fraction of 1G stars in Galactic GCs ranges from 10% to more than 60%, a quantity that anti-correlates with the total luminosity (from the 2010 version of the Harris, 1996, catalog) and the present-day mass of the host cluster (from McLaughlin & van der Marel, 2005). The same correlation is confirmed when the present-day and initial cluster masses derived by Baumgardt & Hilker (2018) are used.
-
•
The fraction of 1G stars in the five MC clusters in which MPs are detected also seems to anti-correlate with mass, although the small number prevents firm conclusions. Magellanic Cloud clusters with MPs host typically larger fractions of 1G stars than Galactic GCs with similar present-day masses.
-
•
Simple-population Galactic GCs have initial masses smaller than M⊙ thus suggesting that a mass threshold governs the occurrence of MPs. This conclusion is challenged by four simple-population MC GCs, namely NGC 419, NGC 1783, NGC 1806 and NGC 1846, with initial masses of M⊙. The fact that these four clusters have ages of Gyr is consistent with the conclusion by Bastian et al. (2018) and Martocchia et al. (2019) that MPs could appear only in GCs older than 2 Gyr. However, given the uncertainties in the initial mass determinations that we discussed in Section 2, we can not exclude that the difference between the initial masses of these young MC and the most massive simple population Galactic GCs, is due to systematic errors in the initial mass estimates of either Galactic GCs or MC clusters, or both.
-
•
Our analysis reveals that the fraction of 1G stars in all GCs with MPs exhibits a strong anti-correlation with the present-day mass of the 2G but only a mild correlation with the present-day mass of 1G stars. When we compare the fraction of 1G stars with the initial cluster masses we also obtain a strong anti-correlation, with a value of the Spearman’s rank correlation coefficient that is higher than that obtained from the present-day mass. Clusters with large and small perigalactic radii share a similar behaviour when the initial masses are used and MC clusters with MPs follow the same trend defined by Galactic GCs.
These results are consistent with a scenario where the fraction of 1G stars decreases with cluster mass at formation and the GCs have lost a large fraction of 1G stars but a smaller amount of 2G stars. This scenario would result in strong anti-correlations between the fraction of 1G stars and both the initial mass of the host cluster and the present-day mass of 2G stars. We would also expect a less-significant correlation with the present-day mass of 1G stars. As a consequence, the correlation between present-day cluster mass and the fraction of 1G stars would exhibit a lower significance than the corresponding correlation with the initial mass. This result is consistent with the predictions by several authors that GCs preferentially lost their 1G stars (e.g. D’Ercole et al., 2008, 2010; D’Antona et al., 2016).
-
•
The maximum helium abundance variation in the five MC GCs with MPs ranges from Y to less than Y and may correlate with the present-day cluster mass, in a similar fashion what is observed in Galactic GCs (Milone et al., 2018b; Zennaro et al., 2019). Galactic GCs with different values of the perigalactic radii follow the same behaviour in the Ymax vs. plane, in contrast with the Magellanic-Cloud GCs, which host smaller helium variations than Galactic GCs with similar masses.
The maximum helium variation in Galactic GCs correlates with the initial cluster mass, but this correlation is less significant (RS(MW)=0.680.08) than that observed with the present-day mass (RS(MW)=0.860.04). Moreover, Galactic GCs with large perigalactic radii exhibit larger values of Ymax than Milky Way GCs with similar initial masses small perigalactic radii. MC clusters follow the same relation between maximum helium variation and initial masses. This observational evidence is consistent with a scenario where the helium variation depends on the total mass of the 2G.
-
•
Based on the work by Massari et al. (2019), who linked most Galactic GCs to a variety of progenitor systems, we analyzed multiple populations in 17 GCs formed in situ, 25 clusters that are considered the products of merging processes, and 17 other GCs that are not associated with any parent stellar stream and and which are characterized by either high or low energy. When we plot the fraction of 1G stars against the cluster mass, these three groups of GCs follow nearly the same pattern. As a consequence, there is no evidence for any dependence of the present day population ratio in GCs on the progenitor system.
-
•
Six out of eight candidate simple-population GCs are unassociated high-energy clusters. The remaining two simple-population clusters, Rup 106 and Terzan 7 are associated with the progenitor of the Helmi stream and to the Sagittarius dwarf spheroidal, respectively. Based on these results, we speculate that simple-population GCs are low-mass clusters that formed in the environment of dwarf galaxies.
-
•
The recently identified class of Type II, or ‘anomalous’ GCs is composed of thirteen known GCs with internal variations of heavy elements. Our investigation, together with other work, based on high-precision HST photometry of six additional LMC clusters (Wagner-Kaiser et al., 2017), reveal that there is no evidence of Type II GCs in LMC and SMC GC populations. To understand whether Type II GCs have an extragalactic origin, as suggested by the fact that the nuclear star cluster M 54 of the Sagittarius Dwarf Spheroidal belongs to this class of objects, we investigate their position in the integrals of motions space.
As demonstrated by Helmi & de Zeeuw (2000), the integral of motions space is a powerful tool to search for accreted satellites. Indeed, before the merging process, Milky Way satellites have clumps in the integrals of motions space. The initial clumping should be present even after the satellite has completely mixed with the Galaxy and some systems survive as coherent structures for more than a Hubble time.
Seven, possibly eight, Type II GCs are clustered in a small region of the vs. plane. This evidence demonstrates that at least the seven Type II GCs may be associated with a single accretion event.
In conclusion, our results show that similar MP properties are present in Milky Way and MC GCs, which also display a ChM consistent with the presence of both a 1G and a 2G group. The fact that the maximum helium variation and the fraction of 1G stars in MC and groups of Milky Way GCs with different origin, and possibly different parent galaxies, follow the same relation with cluster mass, suggest that GC mass is a universal parameter that determines the complexity of MPs in GCs.
Evidence for a possible dependence of MP properties on the environment is provided by Type II GCs, which, using both our data and that of Wagner-Kaiser et al. (2017), are apparently not found in the SMC and LMC cluster populations. seem to be absent either in the SMC and the LMC. In contrast, the possibility that at least seven out of thirteen known Type II GCs might be associated with a unique progenitor galaxy, possibly Gaia Enceladus, suggests that their host galaxy has favoured the formation of these intriguing objects.
acknowledgments
We thank the anonymous referee for her/his contribution. This work has received funding from the European Research Council (ERC) under the European Union’s Horizon 2020 research innovation programme (Grant Agreement ERC-StG 2016, No 716082 ’GALFOR’, PI: Milone, http://progetti.dfa.unipd.it/GALFOR), and the European Union’s Horizon 2020 research and innovation programme under the Marie Sklodowska-Curie (Grant Agreement No 797100). APM and MT acknowledge support from MIUR through the FARE project R164RM93XW SEMPLICE (PI: Milone). CL acknowledges support from the one-hundred- talent project of Sun Yat-Sen University. HJ acknowledges support from the Australian Research Council through the Discovery Project DP150100862.
References
- Anderson & Bedin (2010) Anderson J., Bedin L. R., 2010, PASP, 122, 1035
- Anderson & King (2006) Anderson J., King I. R., 2006, Technical report, PSFs, Photometry, and Astronomy for the ACS/WFC
- Anderson et al. (2008) Anderson J., et al., 2008, AJ, 135, 2055
- Bastian & Lardo (2018) Bastian N., Lardo C., 2018, ARA&A, 56, 83
- Bastian et al. (2013) Bastian N., Lamers H. J. G. L. M., de Mink S. E., Longmore S. N., Goodwin S. P., Gieles M., 2013, MNRAS, 436, 2398
- Bastian et al. (2018) Bastian N., Kamann S., Cabrera-Ziri I., Georgy C., Ekström S., Charbonnel C., de Juan Ovelar M., Usher C., 2018, MNRAS, 480, 3739
- Baumgardt & Hilker (2018) Baumgardt H., Hilker M., 2018, MNRAS, 478, 1520
- Baumgardt et al. (2019) Baumgardt H., Hilker M., Sollima A., Bellini A., 2019, MNRAS, 482, 5138
- Bedin et al. (2005) Bedin L. R., Cassisi S., Castelli F., Piotto G., Anderson J., Salaris M., Momany Y., Pietrinferni A., 2005, MNRAS, 357, 1038
- Bellini & Bedin (2009) Bellini A., Bedin L. R., 2009, PASP, 121, 1419
- Bellini et al. (2011) Bellini A., Anderson J., Bedin L. R., 2011, PASP, 123, 622
- Bellini et al. (2017) Bellini A., Anderson J., Bedin L. R., King I. R., van der Marel R. P., Piotto G., Cool A., 2017, ApJ, 842, 6
- Bragaglia et al. (2012) Bragaglia A., Gratton R. G., Carretta E., D’Orazi V., Sneden C., Lucatello S., 2012, A&A, 548, A122
- Carretta et al. (2010) Carretta E., et al., 2010, A&A, 520, A95
- Chantereau et al. (2019) Chantereau W., Salaris M., Bastian N., Martocchia S., 2019, MNRAS, 484, 5236
- Cordoni et al. (2018) Cordoni G., Milone A. P., Marino A. F., Di Criscienzo M., D’Antona F., Dotter A., Lagioia E. P., Tailo M., 2018, ApJ, 869, 139
- D’Antona et al. (2015) D’Antona F., Di Criscienzo M., Decressin T., Milone A. P., Vesperini E., Ventura P., 2015, MNRAS, 453, 2637
- D’Antona et al. (2016) D’Antona F., Vesperini E., D’Ercole A., Ventura P., Milone A. P., Marino A. F., Tailo M., 2016, MNRAS, 458, 2122
- D’Ercole et al. (2008) D’Ercole A., Vesperini E., D’Antona F., McMillan S. L. W., Recchi S., 2008, MNRAS, 391, 825
- D’Ercole et al. (2010) D’Ercole A., D’Antona F., Ventura P., Vesperini E., McMillan S. L. W., 2010, MNRAS, 407, 854
- Da Costa et al. (2009) Da Costa G. S., Held E. V., Saviane I., Gullieuszik M., 2009, ApJ, 705, 1481
- Dalessandro et al. (2016) Dalessandro E., Lapenna E., Mucciarelli A., Origlia L., Ferraro F. R., Lanzoni B., 2016, ApJ, 829, 77
- Decressin et al. (2007) Decressin T., Meynet G., Charbonnel C., Prantzos N., Ekström S., 2007, A&A, 464, 1029
- Denissenkov & Hartwick (2014) Denissenkov P. A., Hartwick F. D. A., 2014, MNRAS, 437, L21
- Dotter et al. (2008) Dotter A., Chaboyer B., Jevremović D., Kostov V., Baron E., Ferguson J. W., 2008, ApJS, 178, 89
- Dotter et al. (2010) Dotter A., et al., 2010, ApJ, 708, 698
- Dotter et al. (2018) Dotter A., Milone A. P., Conroy C., Marino A. F., Sarajedini A., 2018, ApJ, 865, L10
- Fall & Chandar (2012) Fall S. M., Chandar R., 2012, ApJ, 752, 96
- Fall et al. (2009) Fall S. M., Chandar R., Whitmore B. C., 2009, ApJ, 704, 453
- Ferraro et al. (2009) Ferraro F. R., et al., 2009, Nature, 462, 483
- Gaia Collaboration et al. (2018) Gaia Collaboration et al., 2018, A&A, 616, A1
- Gieles et al. (2018) Gieles M., et al., 2018, MNRAS, 478, 2461
- Gilligan et al. (2019) Gilligan C. K., et al., 2019, MNRAS, 486, 5581
- Glatt et al. (2008) Glatt K., et al., 2008, AJ, 136, 1703
- Glatt et al. (2009) Glatt K., et al., 2009, AJ, 138, 1403
- Glatt et al. (2011) Glatt K., et al., 2011, AJ, 142, 36
- Goudfrooij et al. (2011) Goudfrooij P., Puzia T. H., Chandar R., Kozhurina-Platais V., 2011, ApJ, 737, 4
- Goudfrooij et al. (2014) Goudfrooij P., et al., 2014, ApJ, 797, 35
- Goudfrooij et al. (2017) Goudfrooij P., Girardi L., Correnti M., 2017, ApJ, 846, 22
- Gratton et al. (2004) Gratton R., Sneden C., Carretta E., 2004, ARA&A, 42, 385
- Gratton et al. (2012) Gratton R. G., Carretta E., Bragaglia A., 2012, A&ARv, 20, 50
- Harris (1996) Harris W. E., 1996, AJ, 112, 1487
- Helmi & de Zeeuw (2000) Helmi A., de Zeeuw P. T., 2000, MNRAS, 319, 657
- Helmi et al. (1999) Helmi A., White S. D. M., de Zeeuw P. T., Zhao H., 1999, Nature, 402, 53
- Helmi et al. (2018) Helmi A., Babusiaux C., Koppelman H. H., Massari D., Veljanoski J., Brown A. G. A., 2018, Nature, 563, 85
- Hollyhead et al. (2017) Hollyhead K., et al., 2017, MNRAS, 465, L39
- Hollyhead et al. (2018) Hollyhead K., et al., 2018, MNRAS, 476, 114
- Ibata et al. (1994) Ibata R. A., Gilmore G., Irwin M. J., 1994, Nature, 370, 194
- Johnson et al. (2015) Johnson C. I., Rich R. M., Pilachowski C. A., Caldwell N., Mateo M., Bailey John I. I., Crane J. D., 2015, AJ, 150, 63
- Johnson et al. (2017) Johnson C. I., Caldwell N., Rich R. M., Mateo M., Bailey John I. I., Clarkson W. I., Olszewski E. W., Walker M. G., 2017, ApJ, 836, 168
- Koppelman et al. (2019) Koppelman H. H., Helmi A., Massari D., Roelenga S., Bastian U., 2019, A&A, 625, A5
- Kraft (1994) Kraft R. P., 1994, PASP, 106, 553
- Lagioia et al. (2018) Lagioia E. P., et al., 2018, MNRAS, 475, 4088
- Lagioia et al. (2019a) Lagioia E. P., Milone A. P., Marino A. F., Cordoni G., Tailo M., 2019a, arXiv e-prints, p. arXiv:1909.08439
- Lagioia et al. (2019b) Lagioia E. P., Milone A. P., Marino A. F., Dotter A., 2019b, ApJ, 871, 140
- Larsen et al. (2014) Larsen S. S., Brodie J. P., Grundahl F., Strader J., 2014, ApJ, 797, 15
- Li et al. (2017) Li C., de Grijs R., Deng L., Milone A. P., 2017, ApJ, 844, 119
- Li et al. (2019) Li C., Wang Y., Milone A. P., 2019, arXiv e-prints, p. arXiv:1908.07200
- Mackey & Gilmore (2004) Mackey A. D., Gilmore G. F., 2004, MNRAS, 355, 504
- Marino et al. (2009) Marino A. F., Milone A. P., Piotto G., Villanova S., Bedin L. R., Bellini A., Renzini A., 2009, A&A, 505, 1099
- Marino et al. (2015) Marino A. F., et al., 2015, MNRAS, 450, 815
- Marino et al. (2017) Marino A. F., et al., 2017, ApJ, 843, 66
- Marino et al. (2018a) Marino A. F., Przybilla N., Milone A. P., Da Costa G., D’Antona F., Dotter A., Dupree A., 2018a, AJ, 156, 116
- Marino et al. (2018b) Marino A. F., et al., 2018b, ApJ, 859, 81
- Marino et al. (2018c) Marino A. F., Milone A. P., Casagrande L., Przybilla N., Balaguer-Núñez L., Di Criscienzo M., Serenelli A., Vilardell F., 2018c, ApJ, 863, L33
- Marino et al. (2019) Marino A. F., et al., 2019, MNRAS, 487, 3815
- Martocchia et al. (2017) Martocchia S., et al., 2017, MNRAS, 468, 3150
- Martocchia et al. (2018a) Martocchia S., et al., 2018a, MNRAS, 473, 2688
- Martocchia et al. (2018b) Martocchia S., et al., 2018b, MNRAS, 477, 4696
- Martocchia et al. (2019) Martocchia S., et al., 2019, MNRAS, 487, 5324
- Massari et al. (2014) Massari D., et al., 2014, ApJ, 795, 22
- Massari et al. (2019) Massari D., Koppelman H. H., Helmi A., 2019, A&A, 630, L4
- McLaughlin & van der Marel (2005) McLaughlin D. E., van der Marel R. P., 2005, ApJS, 161, 304
- Milone (2015) Milone A. P., 2015, MNRAS, 446, 1672
- Milone (2017) Milone A. P., 2017, in Charbonnel C., Nota A., eds, IAU Symposium Vol. 316, Formation, Evolution, and Survival of Massive Star Clusters. pp 275–280, doi:10.1017/S1743921315009278
- Milone (2019) Milone A. P., 2019, arXiv e-prints, p. arXiv:1908.11703
- Milone et al. (2008) Milone A. P., et al., 2008, ApJ, 673, 241
- Milone et al. (2009) Milone A. P., Bedin L. R., Piotto G., Anderson J., 2009, A&A, 497, 755
- Milone et al. (2012a) Milone A. P., Piotto G., Bedin L. R., Cassisi S., Anderson J., Marino A. F., Pietrinferni A., Aparicio A., 2012a, A&A, 537, A77
- Milone et al. (2012b) Milone A. P., et al., 2012b, A&A, 540, A16
- Milone et al. (2013) Milone A. P., et al., 2013, ApJ, 767, 120
- Milone et al. (2014) Milone A. P., et al., 2014, ApJ, 785, 21
- Milone et al. (2015) Milone A. P., et al., 2015, MNRAS, 447, 927
- Milone et al. (2017) Milone A. P., et al., 2017, MNRAS, 464, 3636
- Milone et al. (2018a) Milone A. P., et al., 2018a, MNRAS, 477, 2640
- Milone et al. (2018b) Milone A. P., et al., 2018b, MNRAS, 481, 5098
- Mucciarelli et al. (2009) Mucciarelli A., Origlia L., Ferraro F. R., Pancino E., 2009, ApJ, 695, L134
- Mucciarelli et al. (2014) Mucciarelli A., Dalessandro E., Ferraro F. R., Origlia L., Lanzoni B., 2014, ApJ, 793, L6
- Myeong et al. (2019) Myeong G. C., Vasiliev E., Iorio G., Evans N. W., Belokurov V., 2019, arXiv e-prints, p. arXiv:1904.03185
- Nardiello et al. (2018) Nardiello D., et al., 2018, MNRAS, 477, 2004
- Nardiello et al. (2019) Nardiello D., Piotto G., Milone A. P., Rich R. M., Cassisi S., Bedin L. R., Bellini A., Renzini A., 2019, MNRAS, 485, 3076
- Niederhofer et al. (2017) Niederhofer F., et al., 2017, MNRAS, 465, 4159
- Piotto et al. (2012) Piotto G., et al., 2012, ApJ, 760, 39
- Piotto et al. (2015) Piotto G., et al., 2015, AJ, 149, 91
- Renzini et al. (2015) Renzini A., et al., 2015, MNRAS, 454, 4197
- Sabbi et al. (2016) Sabbi E., et al., 2016, ApJS, 222, 11
- Ventura et al. (2001) Ventura P., D’Antona F., Mazzitelli I., Gratton R., 2001, ApJ, 550, L65
- Ventura et al. (2014) Ventura P., di Criscienzo M., D’Antona F., Vesperini E., Tailo M., Dell’Agli F., D’Ercole A., 2014, MNRAS, 437, 3274
- Vesperini et al. (2009) Vesperini E., McMillan S. L. W., Portegies Zwart S., 2009, ApJ, 698, 615
- Villanova et al. (2013) Villanova S., Geisler D., Carraro G., Moni Bidin C., Muñoz C., 2013, ApJ, 778, 186
- Wagner-Kaiser et al. (2017) Wagner-Kaiser R., et al., 2017, MNRAS, 471, 3347
- Yong & Grundahl (2008) Yong D., Grundahl F., 2008, ApJ, 672, L29
- Yong et al. (2014) Yong D., et al., 2014, MNRAS, 441, 3396
- Yong et al. (2016) Yong D., Da Costa G. S., Norris J. E., 2016, MNRAS, 460, 1846
- Zennaro et al. (2019) Zennaro M., Milone A. P., Marino A. F., Cordoni G., Lagioia E. P., Tailo M., 2019, MNRAS, 487, 3239
- Zinn (1993) Zinn R., 1993, in Smith G. H., Brodie J. P., eds, Astronomical Society of the Pacific Conference Series Vol. 48, The Globular Cluster-Galaxy Connection. p. 38
- van den Bergh (1993) van den Bergh S., 1993, ApJ, 411, 178