The (33)-SiC-() Reconstruction: Atomic Structure of the Graphene Precursor Surface from a Large-Scale First-Principles Structure Search
Abstract
Silicon carbide (SiC) is an excellent substrate for growth and manipulation of large scale, high quality epitaxial graphene. On the carbon face (the () or ) face, depending on the polytype), the onset of graphene growth is intertwined with the formation of several competing surface phases, among them a (33) precursor phase suspected to hinder the onset of controlled, near-equilibrium growth of graphene. Despite more than two decades of research, the precise atomic structure of this phase is still unclear. We present a new model of the (33)-SiC-() reconstruction, derived from an ab initio random structure search based on density functional theory including van der Waals effects. The structure consists of a simple pattern of five Si adatoms in bridging and on-top positions on an underlying, C-terminated substrate layer, leaving one C atom per (33) unit cell formally unsaturated. Simulated scanning tunneling microscopy (STM) images are in excellent agreement with previously reported experimental STM images.
pacs:
61.48.Gh, 68.35.B, 68.35.Md, 68.65.PI Introduction
The ability to produce high-quality monolayer or few-layer graphene on a semiconducting substrate, as can be done on SiC,Emtsev et al. (2009); Riedl et al. (2009, 2010); de Heer et al. (2011); Emery et al. (2013); Sforzini et al. (2015) remains a central question to fully leverage the properties of truly two-dimensional graphene. Indeed, commercially traded so-called graphene can be of questionable quality, composed of varying, relatively large numbers of graphene layers (often more than ten). Bøggild (2018); Kauling et al. (2018) In contrast, graphene on Si-face SiC grows as a large-scale monolayer on its own by simply selecting the right thermodynamic conditions Emtsev et al. (2009); Riedl et al. (2010); de Heer et al. (2011); Emery et al. (2013); Nemec et al. (2013); Kunc et al. (2017), and the growth of high-quality few-layer graphene is well documented on C-face SiC() de Heer (2011); Berger et al. (2010); Hass et al. (2008). Graphene grown on SiC thus avoid the problems of commercial graphene samples.
On silicon carbide (SiC), high-quality graphene growth can be achieved by controlled sublimation of Si and thermal decomposition of the substrate.Van Bommel et al. (1975); Forbeaux et al. (2000); Berger et al. (2004); Kunc et al. (2017) The resulting, crystalline graphene layers are of exceptional quality, well suited for implementation of future graphene-based devices.Berger et al. (2006); Emtsev et al. (2009); Lin et al. (2011); Hertel et al. (2012); de Heer (2011); Guo et al. (2013) The specifics of the graphene growth and properties depend strongly on the choice of the polar SiC surface face.Riedl et al. (2010) For epitaxial graphene films on the Si-face of SiC ((111) for the 3C polytype, (0001) for hexagonal polytypes), large-area single- and few-layer graphene is achievable using growth conditions close to thermodynamic equilibrium.de Heer et al. (2011); Nemec et al. (2013) The atomic structure and homogeneity of these phases, including the subsurface region, is unambiguously confirmed, e.g., by x-ray standing waves,Emery et al. (2013); Sforzini et al. (2015) grazing-incidence x-ray diffractionSchumann et al. (2013) or contact-resonance atomic force microscopy.Tu et al. (2016) On the C-face (() or )), graphene layers show electrical properties similar to those of an isolated monolayer graphene film with very high electron mobilities.Hass et al. (2008); Sprinkle et al. (2009); Berger et al. (2010) However, they are typically attributed to multilayer graphene growth. Monolayer graphene growth on the C-face has been attempted,Mathieu et al. (2011); Hu et al. (2012); Ruan et al. (2012) but not, to our knowledge, unambiguously achieved. A past paper by some of usNemec et al. (2015) presented evidence that the growth mode on the C-face is affected by Si terminated surface reconstructions, which remain thermodynamically stable up to the C-rich chemical potential limit where bulk SiC itself is no longer stable against decomposition into bulk C (graphite).
In a very recent publication Li et al. (2019), Li et al. (including some of us) presented a more detailed study of surface phases occurring prior to the onset of near-equilibrium growth of graphene on the C-face of SiC without and with temperature effects and presence of hydrogen. In Ref. Li et al. (2019), a preliminary description of a new (33) surface reconstruction model was presented, which is known to occur along with graphene growth onsetVan Bommel et al. (1975); Starke (1997); Hoster et al. (1997); Li and Tsong (1996); Bernhardt et al. (1999); Seubert et al. (2000); Magaud et al. (2009); Hiebel et al. (2009); Starke and Riedl (2009); Hiebel et al. (2012) and the structure of which had previously eluded a definitive solution.
Presenting the full computational evidence for and understanding of the structure of this key (33) surface phase on C-face SiC is the main objective of this work. Specifically, we performed an ab initio random structure search (AIRSS) Pickard and Needs (2011) to identify the nature of different (22) and (33) reconstructions of the SiC() surface at the onset of graphene growth. We note that further reconstructions with different periodicities were additionally addressed in Ref. Li et al. (2019)
II Background
During annealing at high temperature (lower than but close to the Si sublimation limit, i.e., approaching the chemical potential limit favoring bulk graphite formation), a number of different surface structures are known to arise on the C-face of SiC.Van Bommel et al. (1975); Starke (1997); Hoster et al. (1997); Li and Tsong (1996); Bernhardt et al. (1999); Seubert et al. (2000); Magaud et al. (2009); Hiebel et al. (2009); Starke and Riedl (2009); Hiebel et al. (2012) In the absence of oxygen and hydrogen, graphene growth starts with a Si rich (22) phase with respect to the lateral unit cell of a hexagonal bilayer of bulk SiC.Bernhardt et al. (1999); Li and Tsong (1996) Continued heating leads to a (33) phase. Further annealing leads to a (22) Si adatom phase, referred to as (22) (notation taken from Bernhardt et al. (1999)). Just before graphene forms on the surface, a coexistence of the (33) and the (22) surface phases is observed. Bernhardt et al. (1999); Veuillen et al. (2010). While the atomic structure of the (22) reconstruction was resolved by quantitative low energy electron diffraction (LEED) Seubert et al. (2000), the nature of the (33) reconstruction remained a puzzle. In the last decades, various structural models were suggested for the C-face (33) phase.Li and Tsong (1996); Hoster et al. (1997); Hiebel et al. (2012); Deretzis and La Magna (2013); Nemec et al. (2015) Based on STM images, Li and Tsong proposed a tetrahedrally shaped cluster motif to explain the reconstruction.Li and Tsong (1996) Hoster, Kulakov, and Bullemer suggested a different geometric configuration of atoms on the basis of STM measurements, albeit without specifying the chemical composition.Hoster et al. (1997) Deretzis and La Magna Deretzis and La Magna (2013) suggested a carbon rich composition with 6 C and 4 Si atoms. Hiebel et al. Hiebel et al. (2012) suggested a model consisting of a SiC-bilayer with a stacking fault of one half of the cell and two adatoms, a Si adatom and C adatom. Experimentally, Auger electron spectroscopy (AES) indicates Si:C ratios of (62):1 Hoster et al. (1997) and 1.2:1 Bernhardt et al. (1999). Although they differ by a factor of , both experiments agree on a Si-rich near-surface composition. In the C-rich limit, this is initially somewhat surprising. However, in 2015, a computational analysis of several existing and new structure models by some of us Nemec et al. (2015) favored a model with all adatoms chosen to be Si, consistent with the high experimental Si:C ratios. The specific (33) model discussed in Ref. Nemec et al. (2015) was adapted from a well known (33) reconstruction occurring on the Si-face.Starke et al. (1998) Qualitatively, the Si-rich termination may be understood by the greater stability of the heterogeneous Si-C bond over a homogeneous C-C bond – thus, the dangling bonds of C atoms of the topmost Si-C bilayer show a preference for termination with Si, rather than C adatom motifs. However, all (33) models discussed in the past are still too high in energy, even at the chemical potential limit of bulk graphite formation, to coexist with the (22) adatom structure.Nemec et al. (2015) The structure model by Nemec et al. Nemec et al. (2015) reproduced most of the experimental characteristics listed above, but it failed to capture the characteristic STM images with the observed difference in intensity between occupied and empty state STM images (Fig. 2 II in Ref. Nemec et al. (2015)).
III Method
AIRSS has been successfully applied to a variety of systems Pickard and Needs (2010, 2011); Bogdanov et al. (2016). Our AIRSS is based on van der Waals corrected density functional using the FHI-aims all-electron code Blum et al. (2009); Havu et al. (2009); Levchenko et al. (2015) employing the ELPA eigensolver library.Auckenthaler et al. (2011); Marek et al. (2014) Details of our AIRSS approach are listed Sec. II of the supplemental material (SM).sup For the exchange-correlation functional, we use the van der Waals (vdW) corrected Tkatchenko and Scheffler (2009) Perdew-Burke-Enzerhof (PBE) generalized gradient approximationPerdew et al. (1997) (PBE+TS) to calculate total energies. Unless otherwise noted, the calculations are non-spin-polarized. Technical parameters and bulk lattice constants are listed the SM, Secs. I.A. and I.B.sup We restricted our search to the 3C-SiC polytype. In past work, details of reported surface reconstructions appeared to be unaffected by the detailed choice of polytype. Furthmüller et al. (1998); Schardt et al. (2000); Pankratov et al. (2012); Nemec et al. (2015)
To identify the energetically most favorable reconstruction, we calculate the respective surface energies as formulated in the ab initio atomistic thermodynamics approach.Reuter and Scheffler (2001) In the present paper, we neglect vibrational and configurational entropy contributions to the surface energy. The reconstruction models and energetics discussed here are therefore expected to hold for surface phases that form and stabilize at relatively low temperatures. Vibrational entropy effects that modify the higher-temperature equilibria are considered in more detail in Ref. Li et al. (2019). In the limit of sufficiently thick slabs, the surface energy of a two-dimensional periodic SiC slab with a C face and a Si face is given as
The letter denotes total energies for a given surface structure throughout this work. and denote the number of C and Si atoms in the slab, respectively. Terminating H atoms at the bottom face (Si-face) of the slabs cancel in energy differences and are therefore not explicitly considered. We normalize the surface energy to the area of a (11) SiC unit cell. The chemical potentials and of C and Si are given by where is the total energy of a bulk SiC unit cell (see Sec. I.C. of the SMsup ). The chemical potential limits of the C and Si reservoirs are fixed by the requirement that the underlying SiC bulk is stable against decomposition Nemec et al. (2013), leading to:
| (2) |
We sampled the local energy minimum structures of the potential energy surface for the (22) and (33) surface slabs by calculating the surface energy in the carbon rich limit (Eqs. III and 2). Because of the close competition between the diamond and graphite structure for C Berman and Simon (1955); Yin and Cohen (1984); Yu et al. (2014), we include both limiting phases in our analysis. The structure with the lowest energy for a given corresponds to the most stable phase.
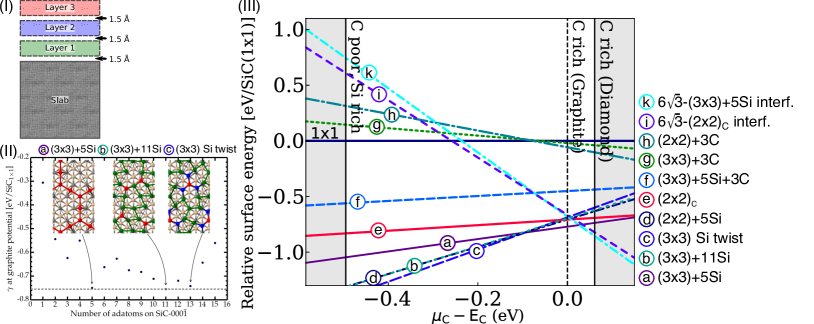
The potential energy landscape is sampled by generating a large ensemble of random initial structures. These structures were created by distributing specific numbers of Si and C atoms randomly into up to three equidistant zones (“Layers”) above a C-terminated, 3-bilayer 3C-SiC() slab (see Fig. 1(I) and the description in the SM, Sec. II.A.sup ). Each zone has a thickness of 2.5 Å, separated by 1.5 Å from adjacent zones. For the initial structures, minimum interatomic distances of 1.5 Å were enforced. We limited the total number of randomly placed atoms in a single zone to nine for the (33) superstructure searches and four for the (22) searches. Overall, we calculated 38,447 structures with up to seven adatoms for the (22) models and 21,008 structures with up to 15 adatoms for the (33) models (see SM Sec. II. A.sup ). Specifically, we considered 2,097 C-only structures, 14,386 Si-only structures and 4,525 mixed Si+C structures for (33) as well as 16,850 C-only structures, 7,197 Si-only structures and 14,430 mixed Si+C structures for (22). Each initial structure was then relaxed into their nearest local minimum at a “light” and computationally inexpensive level of theory, using three-bilayer SiC slabs (H-terminated at the bottom) as support and the local-density approximation (LDA) to density-functional theory for an initial rough energy weighting. Subsequently, a second relaxation at the PBE+TS level was performed at light settings. This led to groups of initial configuration converging to distinct local minimum energy structures (distinguished both by energy and atomic positions; see Fig. 2 in the SM sup ). Interestingly, in all cases considered, we found that the lowest-energy structure for a given composition was sufficiently energetically distinct from higher-energy structures (see Figs. 2 and 3 in the SM sup ). This allowed us to focus on only these lowest-energy structures for further processing atop six-bilayer SiC slabs using FHI-aims’ “tight” settings at the PBE+TS level (for further details, see SM, Sec. I.A. sup ).
For STM images, we used the SIESTA programSoler et al. (2002) and utilities. Specifically, we employed the tool written by Pablo Ordejón and Nicolas LorentePaz and Soler (2006) and an additional tool to include the influence of the tip Ordejón and Lorente . We visualized the STM images using the WSxMHorcas et al. (2007) program.
IV Results
IV.1 Lowest-energy surface reconstruction models
In Figure 1(II), we show the surface energies of the lowest energy structures found for one through 15 adatoms placed on the (33) surface. For the 13-adatom structure, our search confirmed the (33) Si-twist model Nemec et al. (2015) as a low-energy structure (Fig. 1(II), labeled c). In addition, we identified two further low-energy structures, called (33)+5Si (i.e., five Si adatoms, Fig. 1(II), labeled a) and (33)+11Si (i.e., 11 Si adatoms, Fig. 1(II), labeled b). A top view of each of these three structures is depicted in the inset of Fig. 1(II). Our search furthermore confirmed the (22) reconstruction Seubert et al. (2000) for the (22) surface (labeled e in Fig. 1(III)) and revealed an energetically lower, previously unknown 5-adatom structure for the (22) surface (labeled d in Fig. 1(III)). This “(22)-5Si” structure is shown in Fig. 6 in the SM and is discussed in greater detail in Ref. Li et al. (2019) as well. It is noteworthy that the (22) reconstruction proposed by Seubert et al. Seubert et al. (2000), labeled e, would not become stable over the competing (33) reconstructions (a and c) (see below) within the chemical potential limits. Interestingly, the lowest energy structures that we found contain only Si adatoms. Structures containing C adatoms are all to high in surface energy to be relevant.
The most promising search candidates for Si-only, C-only and mixed Si+C models of the (22) and (33) reconstruction are shown as a function of in Fig. 1(III). In addition, two structures featuring graphene layers atop Si-rich reconstructions (labeled “interf.”) that were constructed individually after the AIRSS was complete are also shown. We next discuss these alternative SiC-() surface phases (for more details see SM, Sec. III sup ). Two C-only adatom structures for the (33) and (22) reconstructions with the lowest surface energies are included in Fig. 1(III), labeled g and h. For the (33) periodicity, we also include a surface structure consisting of a mix of 5 Si and 3 C adatoms, labeled f. The three structures labeled f, g and h are the structures with the lowest surface energies for models containing carbon atoms in the adlayer, unless considered as a full graphene layer. However, these structures are to high in surface energy to be relevant.
We next consider structures featuring only Si adatoms, which are the lowest-energy models for all chemical potentials in which a full graphene adlayer cannot yet exist. In the Si rich regime of the chemical potential, the most stable (33) reconstruction is the Si-twist model Nemec et al. (2015), labeled c. For the carbon rich regime, we identify a new Si-rich adatom structure, namely the (33)+5Si labeled a. The Si-twist model has 13 Si adatoms and the (33)+5Si has 5 adatoms, so the Si density of the Si-twist model surface is higher by a factor of 2.6 than in the (33)+5Si model. Interestingly, the factor between these Si concentrations agrees well with the lower limit of factors found between the two past AES measurements.Hoster et al. (1997); Bernhardt et al. (1999) It is conceivable that the difference in the AES measurements could be explained by our surface diagram. While Hoster et al.Hoster et al. (1997) investigated the (33) reconstruction in the Si-rich limit – the Si-twist model, and Bernhardt et al. Bernhardt et al. (1999) performed their measurements at the graphene precursor phase – the (33)+5Si. We also include a model for the (33) reconstruction with 11 Si adatoms, labeled b. Model b consists of a Si ad-layer like the Si-twist model c, but it differs in the second layer (see Fig 1(II)). In summary, the main result of our search is the identification of the new (33)+5Si adatom model that was not considered in any past work and that appears to fill a critical gap in understanding C-face surface phase formation on SiC immediately prior to the graphene growth onset.
IV.2 Validation: Simulated STM and densities of states
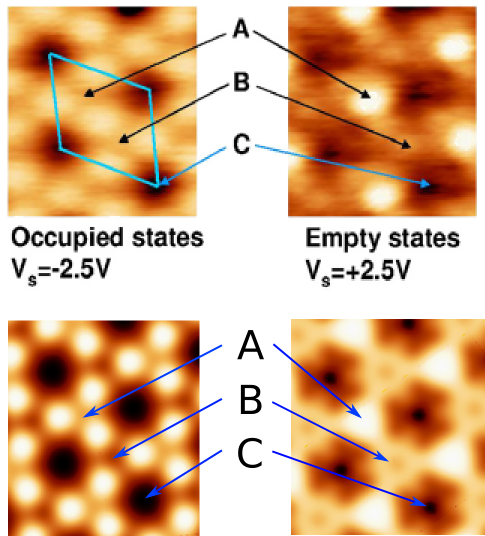
A critical validation of the new (33)+5Si adatom model can be obtained by comparing to existing scanning tunneling microscope (STM) images of the (33) reconstruction,Deretzis and La Magna (2013); Hiebel et al. (2012) which could not be explained by previous models. Specifically, the top row of Fig.2 reproduces a characteristic difference between the empty and filled state images of the (33) reconstruction as observed in past experimental work.Deretzis and La Magna (2013); Hiebel et al. (2012) Previous models failed to describe this difference in simulated STM images. In Figure 2, we present a comparison of the experimental constant current STM images from Hiebel et al. Hiebel et al. (2012) and simulated STM images of the (33)+5Si model. In our simulation, we used the same voltage as in experiment for the occupied and empty states (-2.5 V and 2.5 V, respectively). In Figure 2, the three characteristic points (A, B, C) in the STM images are marked by arrows and labeled according to Hiebel et al. Hiebel et al. (2012). The simulated STM images of the (33)+5Si reconstruction capture the specifics of the STM images very well. The triangular structure in the STM image (Fig. 2 bottom) had previously led to the assumption that the reconstruction should consist of a triangular adatom structure. To our surprise, structure a, the (33)+5Si surface model, does not feature such triangular arranged adatoms. It contains 5 Si adatoms organized in such a way that they form a net of equilateral hexagons on the surface with a side length of 5.34 Å. In the middle of such a hexagon, we find there lies an unsaturated C atom (marked C1 and C2 in Fig. 3 right panel). We also show computed STM images for the alternative (33) reconstruction models (33)+11Si and (33) Si-twist in Figures 13 and 14 in the SM.sup The simulated images for these two reconstructions are markedly different from the experimental images and provide strong supporting evidence that the (33)+5Si surface model is indeed observed in experiment.
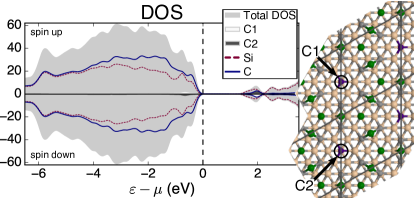
Experimental scanning tunnelling spectroscopy (STS) of the (33) reconstruction also shows a semiconducting surface with a eV band gap.Hiebel et al. (2009) We calculated the spin-polarized electronic density of states (DOS) using the Heyd-Scuseria-Ernzerhof hybrid functional (HSE06) Krukau et al. (2006) for the exchange-correlation functional. The DOS was calculated in a supercell of twice the (33)+5Si simple unit cell, i.e., containing two unsaturated C atoms in the middle of the hexagon (see Fig. 3 right) and allowing the surface to assume a state with net zero spin polarization. In addition, we calculated the projected DOS (p-DOS) for all Si and C atoms in the simulation slab including the unsaturated C atoms labeled C1 and C2 in Fig. 3.
Figure 3 shows the DOS and p-DOS for the spin down (negative -axis) and spin up (positive -axis) channel. The DOS clearly demonstrates that the surface is semiconducting, in agreement with experiment. It features a surface band gap of eV, which is smaller than the bulk 3C-SiC band gap of 2.51 eV on the same level of theory. However, it is in remarkable qualitative agreement with the band gap of eV from scanning tunnelling spectroscopy.Hiebel et al. (2009) In the 3C-SiC bulk band gap close to the conduction band minimum, the surface reconstruction leads to one additional peak. The p-DOS indicates that this peak originates from the unsaturated C atoms (C1 and C2), while the corresponding occupied surface state is in resonance with the SiC bulk states. Thus, the (33)+5Si appears to match the existing experimental observations very well.
IV.3 Relation to graphene-covered interface structures
A final question concerns the interface structures covered by actual graphene layers on SiC(), which have been documented by thorough STM studies. Hiebel et al. (2012) From a theoretical viewpoint, graphene-covered (22) and (33) Si-twist surface models in a (66) supercell covered by a 1313 graphene monolayer were discussed in Ref. Nemec et al. (2015). Both models would not become stable in the thermodynamically allowed chemical potential range for C in our calculations, when compared to the new (33)+5Si model. In Figure 1(III), we include the surface energies of two graphene-covered surfaces with a nearly strain-free (66)-R30∘ periodicity: the graphene-covered (22) from Ref. Nemec et al. (2015), labeled i, and the graphene-covered (33)+5Si interface structure, labeled k (see SM, Sec. V, for details sup ). The latter model, k, is not thermodynamically stable in the allowed C chemical potential range, but it does become lower in energy than the non-graphene covered model very close past the limit of forming bulk graphite. Unlike the SiC(111) face, the structures considered in this work therefore do not indicate the existence of a thermodynamically stable interface between SiC() and a monolayer graphene phase. The existence of a different, stable graphene covered interface structure cannot be entirely ruled out by this limited set of structures. However, the crossover point to a graphene-covered phase observed by us would be consistent with the experimentally observed phase mixtures at SiC() surfaces close to graphitization, where graphene formation occurs kinetically only in the regime where bulk graphite is already the thermodynamically stable limit, consistent with the experimentally observed rapid formation of “few-layer graphene”.
V Conclusion
In this work, we address the long-standing open question of the SiC--(33) reconstruction. Our ab initio random structure search reveals that the surface phase diagram of the SiC- is even richer than previously anticipated. We identified two stable (33) reconstructions, namely the previously published Si-twist model Nemec et al. (2015) in the Si rich regime of the chemical potential and the new (33)+5Si in the C rich regime of the chemical potential. The difference in Si concentration is very similar to the difference between the published AES measurements. Additionally, we identified a new potential candidate for the experimentally observed (22) reconstruction. We note that we restricted our structure searches to (33) and (22) periodicities, addressing the main cases reported in past experimental work but leaving room for other low-energy structures to exist in regimes not covered by these experiments. Indeed, two such phases of differing periodicity are identified in the recent computational study reported in Ref. Li et al. (2019). Importantly, the (33)+5Si model found and substantiated in the present work can reproduce experimental STM images and features a calculated (hybrid density functional theory) band gap of eV, in good agreement with the reported band gap in STS. Our structure search reveals that the C-face of SiC favors Si-only adatom structures over C-only or Si-C mixed adatom models. Overall, the study reported here as well as the recent study of Ref. Li et al. (2019), which also considers vibrational entropy effects at finite temperature, provide a detailed picture of the critical atomic structures that govern the chemical potential onset of graphene formation on the C-face of SiC and a consistent framework for understanding key differences in graphene growth on Si-face versus C-face SiC.
Acknowledgements.
L.N. acknowledge funding by the German Federal Ministry of Education and Research (BMBF) within project “ELPA-AEO” (project number 01IH15001). J.K. acknowledges a visiting student fellowship to Duke University, provided by the Fritz Haber Institute of the Max Planck Society (Berlin). We thank the DEISA Consortium, co-funded through the EU FP7 project RI-222919, for support within the DEISA Extreme Computing Initiative DECI-6. We furthermore thank Profs. Randall M. Feenstra, Michael Widom and their groups for stimulating discussions.References
- Emtsev et al. (2009) K. V. Emtsev, A. Bostwick, K. Horn, J. Jobst, G. L. Kellogg, L. Ley, J. L. McChesney, T. Ohta, S. A. Reshanov, J. Röhrl, et al., Nature Materials 8, 203 (2009).
- Riedl et al. (2009) C. Riedl, C. Coletti, T. Iwasaki, A. A. Zakharov, and U. Starke, Phys. Rev. Lett. 103, 246804 (2009).
- Riedl et al. (2010) C. Riedl, C. Coletti, and U. Starke, Journal of Physics D: Applied Physics 43, 374009 (2010).
- de Heer et al. (2011) W. A. de Heer, C. Berger, M. Ruan, M. Sprinkle, X. Li, Y. Hu, B. Zhang, J. Hankinson, and E. Conrad, Proceedings of the National Academy of Sciences 108, 16900 (2011), eprint https://www.pnas.org/content/108/41/16900.full.pdf.
- Emery et al. (2013) J. D. Emery, B. Detlefs, H. J. Karmel, L. O. Nyakiti, D. K. Gaskill, M. C. Hersam, J. Zegenhagen, and M. J. Bedzyk, Physical Review Letters 111, 215501 (2013).
- Sforzini et al. (2015) J. Sforzini, L. Nemec, T. Denig, B. Stadtmüller, T.-L. Lee, C. Kumpf, S. Soubatch, U. Starke, P. Rinke, V. Blum, et al., Phys. Rev. Lett. 114, 106804 (2015).
- Bøggild (2018) P. Bøggild, Nature 562, 503 (2018).
- Kauling et al. (2018) A. P. Kauling, A. T. Seefeldt, D. P. Pisoni, R. C. Pradeep, R. Bentini, R. V. B. Oliveira, K. S. Novoselov, and A. H. Castro Neto, Advanced Materials p. 1803784 (2018).
- Nemec et al. (2013) L. Nemec, V. Blum, P. Rinke, and M. Scheffler, Physical Review Letters 111, 065502 (2013).
- Kunc et al. (2017) J. Kunc, M. Rejhon, E. Belas, V. Dedic, P. Moravec, and J. Franc, Physical Review Applied 8, 044011 (2017).
- de Heer (2011) W. A. de Heer, MRS Bulletin 36, 632 (2011).
- Berger et al. (2010) C. Berger, J.-Y. Veuillen, L. Magaud, P. Mallet, V. Olevano, M. Orlita, P. Plochocka, C. Faugeras, G. Martinez, M. Potemski, et al., Int. J. Nanotechnol. 7, 383 (2010).
- Hass et al. (2008) J. Hass, F. Varchon, J. E. Millán-Otoya, M. Sprinkle, N. Sharma, W. A. de Heer, C. Berger, P. N. First, L. Magaud, and E. H. Conrad, Physical Review Letters 100, 125504 (2008).
- Van Bommel et al. (1975) A. J. Van Bommel, J. E. Crombeen, and A. Van Tooren, Surface Science 48, 463 (1975), ISSN 0039-6028.
- Forbeaux et al. (2000) I. Forbeaux, J.-M. Themlin, A. Charrier, F. Thibaudau, and J.-M. Debever, Applied Surface Science 162 - 163, 406 (2000).
- Berger et al. (2004) C. Berger, Z. Song, T. Li, X. Li, A. Ogbazghi, R. Feng, Z. Dai, A. Marchenkov, E. Conrad, N. Phillip, et al., Journal of Physical Chemistry B 108, 19912 (2004).
- Berger et al. (2006) C. Berger, Z. Song, X. Li, X. Wu, N. Brown, C. Naud, D. Mayou, T. Li, J. Hass, and A. Marchenkov, Science 312, 1191 (2006).
- Lin et al. (2011) Y. Lin, A. Valdes-Garcia, S. Han, D. Farmer, I. Meric, Y. Sun, Y. Wu, C. Dimitrakopoulos, A. Grill, P. Avouris, et al., Science 332, 1294 (2011).
- Hertel et al. (2012) S. Hertel, D. Waldmann, J. Jobst, A. Albert, M. Albrecht, S. Reshanov, A. Schöner, M. Krieger, and H. B. Weber, Nature Communications 3, 957 (2012).
- Guo et al. (2013) Z. Guo, R. Dong, P. S. Chakraborty, N. Lourenco, J. Palmer, Y. Hu, M. Ruan, J. Hankinson, J. Kunc, J. D. Cressler, et al., Nano Letters 13, 942 (2013).
- Schumann et al. (2013) T. Schumann, M. Dubslaff, M. H. Oliveira, M. Hanke, F. Fromm, T. Seyller, L. Nemec, V. Blum, M. Scheffler, J. M. J. Lopes, et al., New Journal of Physics 15, 123034 (2013).
- Tu et al. (2016) Q. Tu, B. Lange, Z. Parlak, J. M. J. Lopes, V. Blum, and S. Zauscher, ACS Nano 10, 6491 (2016).
- Sprinkle et al. (2009) M. Sprinkle, D. Siegel, Y. Hu, J. Hicks, A. Tejeda, A. Taleb-Ibrahimi, P. Le Fèvre, F. Bertran, S. Vizzini, H. Enriquez, et al., Physical Review Letters 103, 226803 (2009).
- Mathieu et al. (2011) C. Mathieu, N. Barrett, J. Rault, Y. Y. Mi, B. Zhang, W. A. de Heer, C. Berger, E. H. Conrad, and O. Renault, Physical Review B 83, 235436 (2011).
- Hu et al. (2012) Y. Hu, M. Ruan, Z. Guo, R. Dong, J. Palmer, J. Hankinson, C. Berger, and W. A. de Heer, Journal of Physics D: Applied Physics 45, 154010 (2012).
- Ruan et al. (2012) M. Ruan, Y. Hu, Z. Guo, R. Dong, J. Palmer, J. Hankinson, C. Berger, and W. A. de Heer, MRS Bulletin 37, 1138 (2012).
- Nemec et al. (2015) L. Nemec, F. Lazarevic, P. Rinke, M. Scheffler, and V. Blum, Physical Review B 91, 161408 (2015).
- Li et al. (2019) J. Li, Q. Wang, G. He, M. Widom, L. Nemec, V. Blum, M. Kim, P. Rinke, and R. M. Feenstra, Physical Review Materials 3 (2019), ISSN 2475-9953.
- Starke (1997) U. Starke, physica status solidi (b) 202, 475 (1997), ISSN 1521-3951.
- Hoster et al. (1997) H. E. Hoster, M. A. Kulakov, and B. Bullemer, Surface Science 382, L658 (1997).
- Li and Tsong (1996) L. Li and I. S. T. Tsong, Surface Science 351, 141 (1996).
- Bernhardt et al. (1999) J. Bernhardt, M. Nerding, U. Starke, and K. Heinz, Materials Science and Engineering: B 61 – 62, 207 (1999).
- Seubert et al. (2000) A. Seubert, J. Bernhardt, M. Nerding, U. Starke, and K. Heinz, Surface Science 454 – 456, 45 (2000).
- Magaud et al. (2009) L. Magaud, F. Hiebel, F. Varchon, P. Mallet, and J.-Y. Veuillen, Physical Review B 79, 161405 (2009).
- Hiebel et al. (2009) F. Hiebel, P. Mallet, L. Magaud, and J.-Y. Veuillen, Physical Review B 80, 235429 (2009).
- Starke and Riedl (2009) U. Starke and C. Riedl, Journal of Physics: Condensed Matter 21, 134016 (2009).
- Hiebel et al. (2012) F. Hiebel, L. Magaud, P. Mallet, and J.-Y. Veuillen, Journal of Physics D: Applied Physics 45, 154003 (2012).
- Pickard and Needs (2011) C. J. Pickard and R. J. Needs, Journal of Physics: Condensed Matter 23, 053201 (2011).
- Veuillen et al. (2010) J. Veuillen, F. Hiebel, L. Magaud, P. Mallet, and F. Varchon, Journal of Physics D: Applied Physics 43, 374008 (2010).
- Deretzis and La Magna (2013) I. Deretzis and A. La Magna, Applied Physics Letters 102 (2013).
- Starke et al. (1998) U. Starke, J. Schardt, J. Bernhardt, M. Franke, K. Reuter, H. Wedler, K. Heinz, J. Furthmüller, P. Käckell, and F. Bechstedt, Physical Review Letters 80, 758 (1998).
- Pickard and Needs (2010) C. J. Pickard and R. J. Needs, Nature Materials 9, 624 (2010).
- Bogdanov et al. (2016) A. Bogdanov, A. Mysovsky, C. J. Pickard, and A. V. Kimmel, Physical Chemistry Chemical Physics 18, 28316 (2016).
- Blum et al. (2009) V. Blum, R. Gehrke, F. Hanke, P. Havu, V. Havu, X. Ren, K. Reuter, and M. Scheffler, Comp. Phys. Commun. 180, 2175 (2009).
- Havu et al. (2009) V. Havu, V. Blum, P. Havu, and M. Scheffler, J. Comp. Phys. 228, 8367 (2009).
- Levchenko et al. (2015) S. V. Levchenko, X. Ren, J. Wieferink, R. Johanni, P. Rinke, V. Blum, and M. Scheffler, Computer Physics Communications 192, 60 (2015), ISSN 0010-4655.
- Auckenthaler et al. (2011) T. Auckenthaler, V. Blum, H. Bungartz, T. Huckle, R. Johanni, L. Krämer, B. Lang, H. Lederer, and P. Willems, Parallel Computing 37, 783 (2011).
- Marek et al. (2014) A. Marek, V. Blum, R. Johanni, V. Havu, B. Lang, T. Auckenthaler, A. Heinecke, H.-J. Bungartz, and H. Lederer, Journal of Physics: Condensed Matter 26, 213201 (2014).
- (49) See supplementary material. The supplementary material includes reference data of the bulk structure and enthalpy of formation of 3C-SiC, diamond, graphite and silicon. It gives details about the underlying electronic structure and surface energy calculations. The ab initio random structure search and the resulting energy landscape and surface structures are detailed. It includes additional information of the simulated scanning tunneling microscopy images.
- Tkatchenko and Scheffler (2009) A. Tkatchenko and M. Scheffler, Physical Review Letters 102, 073005 (2009).
- Perdew et al. (1997) J. P. Perdew, K. Burke, and M. Ernzerhof, Physical Review Letters 78, 1396 (1997).
- Furthmüller et al. (1998) J. Furthmüller, P. Käckell, F. Bechstedt, A. Fissel, K. Pfennighaus, B. Schröter, and W. Richter, Journal of Electronic Materials 27, 848 (1998).
- Schardt et al. (2000) J. Schardt, J. Bernhardt, U. Starke, and K. Heinz, Physical Review B 62, 10335 (2000).
- Pankratov et al. (2012) O. Pankratov, S. Hensel, P. Götzfried, and M. Bockstedte, Physical Review B 86, 155432 (2012).
- Reuter and Scheffler (2001) K. Reuter and M. Scheffler, Physical Review B 65, 035406 (2001).
- Berman and Simon (1955) R. Berman and F. Simon, Z. f. Elektrochem.: Ber. Bunsenges. Phys. Chem. 59, 333 (1955).
- Yin and Cohen (1984) M. T. Yin and M. L. Cohen, Physical Review B 29, 6996 (1984).
- Yu et al. (2014) C.-J. Yu, G.-C. Ri, U.-G. Jong, Y.-G. Choe, and S.-J. Cha, Physica B: Condensed Matter 434, 185 (2014).
- Soler et al. (2002) J. M. Soler, A. E., J. D. Gale, G. A., J. J., O. P., and D. Sànchez-Portal, Journal of Physics: Condensed Matter 14, 2745 (2002).
- Paz and Soler (2006) O. Paz and J. M. Soler, Phys. Status Solidi, B 243, 1080 (2006).
- (61) P. Ordejón and N. Lorente, A program to simulate stm images, Contained in the SIESTA program package.
- Horcas et al. (2007) I. Horcas, R. Fernàndez, J. M. Gòmez-Rodrìguez, J. Colchero, J. Gòmez-Herrero, and A. M. Baro, Review of Scientific Instruments 78, 013705 (2007).
- Krukau et al. (2006) A. V. Krukau, O. A. Vydrov, A. F. Izmaylov, and G. E. Scuseria, The Journal of Chemical Physics 125, 224106 (2006).