The Driving Force for the Complexation of Charged Polypeptides
Abstract
The phase separation of oppositely-charged polyelectrolytes in solution is of current interest . In this work we study the driving force for polyelectrolyte complexation using molecular dynamics simulations. We calculate the potential of mean force between poly(lysine) and poly(glutamate) oligomers using three different forcefields, an atomistic force field and two coarse-grained force fields. There is qualitative agreement between all forcefields, i.e., the sign and magnitude of the free energy and the nature of the driving force are similar, which suggests that the molecular nature of water does not play a significant role. For fully charged peptides, we find that the driving force for association is entropic in all cases when small ions either neutralize the poly-ions, or are in excess. The removal of all counterions switches the driving force, making complexation energetic. This suggests that the entropy of complexation is dominated by the counterions. When only 6 residues of a 11-mer are charged, however, the driving force is enthalpic in salt-free conditions. The simulations shed insight into the mechanism of complex coacervation and the importance of realistic models for the polyions.
keywords:
Coacervation,Coacervates,Martini,BMW-Martini,Coarse Grained, Lysine, Glutamate, LaTeXUW-Madison]
Theoretical Chemistry Institute and Department of Chemistry, 1101 University Avenue, University of Wisconsin-Madison, Madison, Wisconsin 53703
\abbreviationsIR,NMR,UV
{tocentry}
![[Uncaptioned image]](/html/1910.09112/assets/x1.png)
1 Introduction
Oppositely-charged polyelectrolytes in aqueous solution can undergo a liquid-liquid phase separation to form a polymer-rich and a polymer-poor phase, through a process called complex coacervation.1, 2. The polymer-rich “coacervate” phase can be formed using DNA, polypeptides or polymers in microemulsions3, and the concentration of polyelectrolytes in the coacervate can be changed by tuning the pH4, charge density5 and chirality3 of the polyelectrolytes, ionic strength6, temperature7 and the concentration of salt.5. Complex coacervates have a wide range of applications from microencapsulation of food products8 to drug-delivery9, protein purification10 and dispersion of cells11.
The thermodynamics of this phenomenon is not completely understood.2, 12, 13 One expects a pairing of oppositely charged polyions in the dilute and co-acervate phase, given the strong electrostatic attraction. Multiple experimental14, 15, 16, 17 and computational studies18, 12, 19 argue that complex coacervation has a strong favorable entropic contribution, which could arise from the gain in translational entropy of the counterions when the polyions are complexed.
Several theoretical models have been devised to understand complex coacervation, including the Voorn-Overbeek (VO) theory5, 20, approaches based on the random phase approximation (RPA)21, field theoretic methods22, 23, 24 and integral equation theories25. The theoretical methods rely on simple models and on approximations and molecular dynamics simulations are restricted by the possible lengthscales and timescales accessible26. A molecular dynamics simulation3 of two polyions using the CHARMM2227 forcefield does show complex coacervation, but does not establish the driving force.
Two important concepts in polyelectrolyte complexation are counterion condensation and counterion release. The original Manning formulation 28, 29 of counterion condensation considered a single infinite line of charges and neutralizing counterions. An important parameter is the ratio where is the spacing between charges and is the Bjerrum length, defined as where is the charge of an electron, is the permittivity of free space, is the dielectic constant, is Boltzmann’s constant and is the temperature. For an infinitely thin and long line of charges, Manning found a divergence in the free energy for and postulated that counterions would “condense” onto the polyion for , thereby partially neutralizing the polyion charge until . The condensed counterions were assumed to be bound, and did not contribute to the translational entropy 28 or the self-diffusion constant 29 of the counterions.
For more realistic models, with polyions of finite length or excluded volume, there is no divergence in the free energy as the linear charge density increases. The electrostatic attraction does result in a higher concentration of counterions near the polyion compared to the bulk. The term condensation is often used in this case although the counterions are not bound, and in fact have a very short lifetime (in this work we find it is of the order of picoseconds) near the polyion. The counterion self-diffusion constant is not zero and, since all counterions sample the entire volume, there is no decrease in translational entropy.
Counterion release is often cited as a mechanism for entropy gain due to complexation 18. The picture is that the counterions are condensed on the polyions when they are isolated. When they complex, the electrostatic attraction between polyions is energetically favorable and the pairing of the polyions causes an essentially electro-neutral complex that does not attract either of the counterion species. As a consquence the concentration of counterions near the polyions is significantly reduced compared to the isolated polyions. This is viewed as a release of counterions and often interpreted as resulting in an increase in the translational entropy of the counterions. However, for the reasons mentioned above, this simple picture cannot be the complete story. The two driving forces that are often discussed are the energetic attraction between polyions and the entropy gain due to the counterions12, 27, 18.
The driving force for polyion complexation has been investigated in computer simulations by Ou and Muthukumar (OM) 18. The studied uniformly charged polyions in a continuum solvent using Langevin dynamics simulations. Starting with the two polyions far apart, they allowed them to complex and calculated the change in energy, which they identified as the internal energy change of the process. The Hemholtz free energy change was then calculated via thermodynamic integration and the entropy change from the difference between the Helmholtz free energy and the internal energy. The main conclusion of this work was that the driving force was energetic for weakly charged polyions () but become entropic for strongly charged polyions (). Similar results have been reported by Rathee et al.12 for associatively charged polyions, where the charge state is determined by conditions of chemical equilbrium.
In this work, we investigate a system of two oppositely charged polypeptides with 10 residues each, and calculate the potential of mean force as a function of separation. By performing the calculation at two temperatures we are able to obtain the entropic and energetic contributions to the free energy. We investigate three different forcefields and compare their predictions. Two of the forcefields chosen for this study are coarse-grained, and the third is atomistic, and all of them have been used to study polyelectrolytes.30, 31, 32, 33, 19, 34. We find that all the forcefields are in qualitative agreement with each other, i.e., the magnitude of the free energy and the nature of the driving force are similar, suggesting that the model of water does not play a role. When every residue of the peptides is charged the driving force is entropic in all cases except when no small ions are present. When only 6 of the residues are charged, however, the driving force becomes energetic without added salt. This is in qualitative agreement with the OM study 18 in the sense that the driving force changes from energetic to entropic as the charge density is increased. There are, however, some significant differences. We can estimate by dividing the root-mean-square-end-to-end distance of the peptides by the number of charges. For the atomistic model where every residue is charged this gives a value of =0.225nm for polyglutamate and =0.214nm for polylysine. Since the Bjerrum length for the water model is 0.69nm this gives 3.07 and 3.22 for the two cases. For the case where the peptides have 11 residues, and 6 of the residues are charged, and 2.2 for the two peptides, which is above the counterion condensation threshold. Furthermore we see no evidence for counterion localization, in that all counterions have a non-zero self-diffusion coefficient and short lifetimes near the peptides.
2 Computational Methods
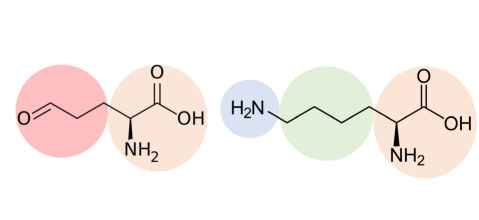
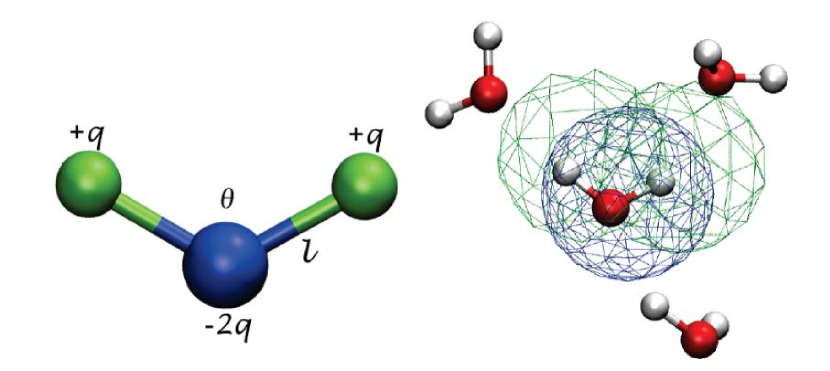
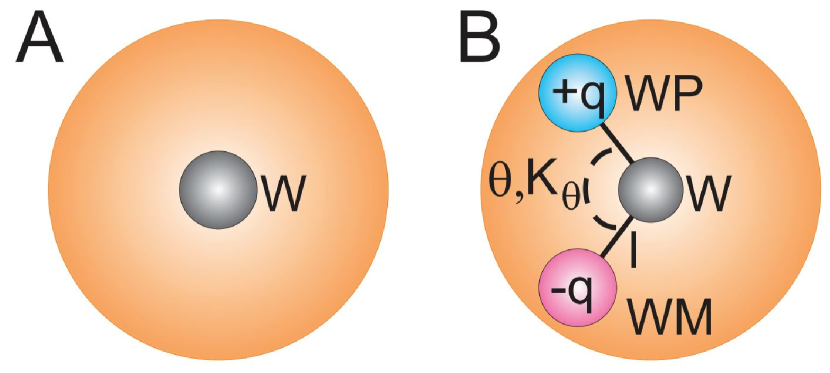
We investigate the potential of mean force between poly(lysine) and poly(glutamate) oligomers with 10 residues each. In most of the simulations all the residues are charged, but we present for comparison one calculation where 5 of the glutamate residues are protonated and 5 of the lysine residues are de-protonated, i.e., the net charge on each is reduced to 6. We compare results from three different forcefields: Martini 2.2 with Big Multipole Water35, 36(BMW-Martini), Martini 2.2 with Polarizable Water37, 36(POL-Martini) and AMBER ff99sb with TIP3P water38(TIP3P-AMBER). A schematic of the different coarse-grained forcefields is shown in Fig. 1.
Three systems are studied in this work: with no excess salt but each polyion is neutralized by oppositely charged counter-ions (C = 0 M), 0.27 M excess salt(C = 0.27 M), and no small ions (CNaCl=0M). The solution with C = 0 M would be the true salt-free case, i.e., solutions of salt-free polycations and polyanions are mixed. The solution with CNaCl=0M provides a bench-mark where no small ions are present. In all cases there is one poly(lysine) and one poly(lysine) molecule with approximate 15,000 atomistic water molecules or 4000 coarse-grained water partilces (one CG water particle corresponds to 4 water molecules). For C = 0 M and 0.27M there are an additional 10 and 80 particles, respectively, of Cl- and Na+, for the cases where all the residues are charged.
Simulations are performed using the GROMACS 5.1.439 package. The Lennard-Jones cutoff is set to 1 nm for the AMBER forcefield and 1.4 nm for the Martini forcefield. The Particle Mesh Ewald40 method is used to calculate the electrostatic interactions with the following configuration: for the AMBER forcefield, the real cutoff spacing is 1 nm and the fast Fourier transform grid spacing is 0.16 nm; for the Martini forcefield the real cutoff spacing is 1.4 nm and the fast Fourier transform grid spacing is 0.20 nm. The Berendsen barostat41 is used to keep the pressure constant, and the Berendsen Thermostat41 used to keep the temperature constant.
Initial configurations are created by inserting molecules randomly into in a square-cuboid box of size 12x6x6 nm3 with periodic boundary conditions in all directions. The energy is minimized using a steepest decent algorithm, and the system is then equilibrated in the NPT ensemble at a pressure of 1 bar. The final configuration obtained from NPT equilibration is used for the pulling simulation in the NVT ensemble. The two polypeptides are pulled apart along the x-direction to generate multiple windows for the umbrella sampling simulations. For POL-Martini and TIP3P-AMBER forcefields, 40 windows are used for a distance of separation between the central residue of poly(lysine) and poly(glutamate) () from 0.4 to 3.8 nm. For the BMW-Martini forcefield, 30 windows are used for between 1 to 3.8 nm.
For the umbrella sampling production runs, a harmonic force constant of 1000 kJ mol-1 nm2 is applied to constrain the distance of separation between the two polypeptides. All production runs are done in a NVT ensemble. Finally, the weighted histogram analysis method42(WHAM) is employed to obtain the potential of mean force curves from the histograms. The last 75 of the production runs are used for WHAM analysis. The standard deviation for the PMF curves are computed by using a bootstrapping method in which complete histograms are considered as independent data points. To ensure that the system is equilibrated, the PMF obtained from the first 25 of the production run is compared to that obtained from the last 75 of the simulation run. The two potential of mean curves were within less than half a standard deviation of each other.
Using the method thus described, PMF curves are obtained for two temperatures, at a lower temperature, T1 and at a higher temperature, T2. For the BMW-Martini forcefield, T1 = 290 K and T2 = 310 K. For POL-Martini and TIP3P-AMBER, T1 = 280 K and T2 = 320 K. Assuming that the energy and entropy of association is constant between the temperature of T1 and T2, the PMF curves obtained from umbrella sampling are decomposed into energetic()) and entropic()) contributions at a given distance of separation using the equations:
| (1) |
| (2) |
Here A is the Hemholtz free energy which is numerically equal to the value of the shifted PMF curve. The standard deviation for is calculated by using bootstrap analysis. The error bars shown in the plots correspond to one standard deviation of the quantity of interest.
3 Results and Discussion
3.1 Potential of mean-force
The potential of mean curves with the three forcefields is shown in figure 2 for C = 0 M and 0.27M, at two different temperatures in each case. As expected, there is a favorable (negative) free energy of association in all cases. The qualitative behavior is the same in all force fields although there are quantitative differences. In particular the magnitude of association is stronger in the atomistic model.
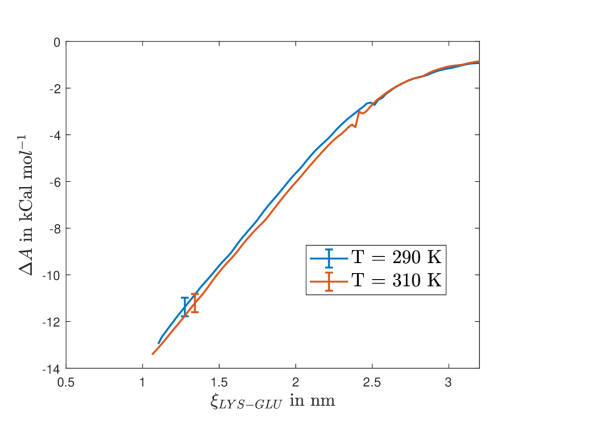
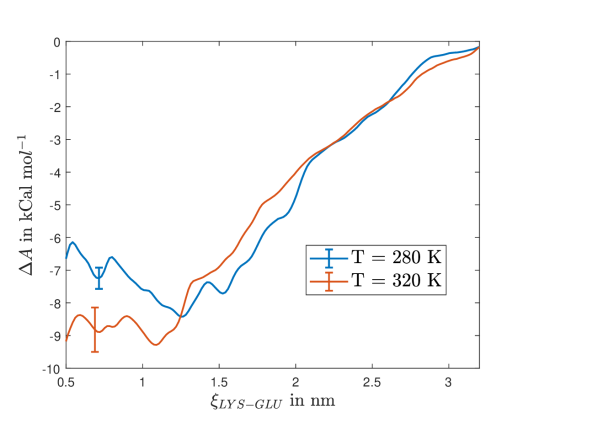
To compare the strength of association we tabulate, in table 1, the free energy of association, defined as the difference in free energy between the value at 1nm and the value far away. For the system with no excess salt and the system with excess salt at T1, both POL-Martini and BMW-Martini underestimate the free energy of association by 3 kcal mol-1 as compared to AMBER. For the system with excess salt at T2, the free energy of association for the AMBER forcefield is 5 kcal mol-1 more favorable than both POL-Martini and BMW-Martini. This quantitative difference in the free energy can be possibly attributed to the mapping protocol of representing multiple beads of atomistic forcefield to a considerably smaller number of molecular sites.43. Another quantitative discrepancy that we observe is the change in free energy with the addition of salt - addition of 0.27 M of excess salt decreases the free energy of association by 7 kcal mol-1 for the coarse grained forcefields and 3 kcal mol-1 for the atomistic forcefield.
| System | A in kcal mol-1 | |||
|---|---|---|---|---|
| C = 0 M | C = 0.27 M | |||
| T1 | T2 | T1 | T2 | |
| Martini 2.2 with Big Multipole Water | -12.64 | -13.55 | -5.00 | -5.63 |
| Martini 2.2 with Polarizable Water | -9.22 | -11.37 | -3.71 | -4.161 |
| AMBER ff99sb with TIP3P Water | -14.27 | -16.96 | -7.07 | -10.19 |
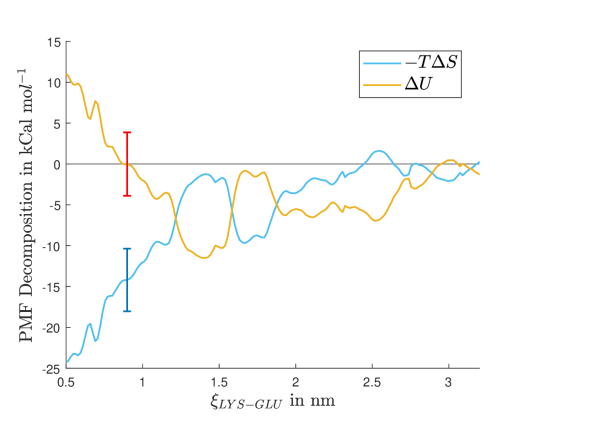
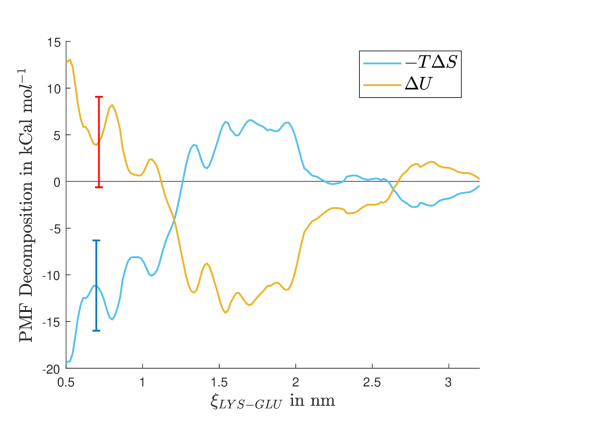
3.2 Decomposition into entropic and energetic contributions
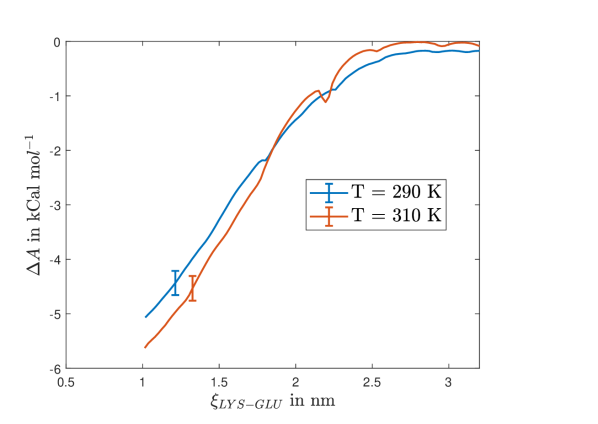
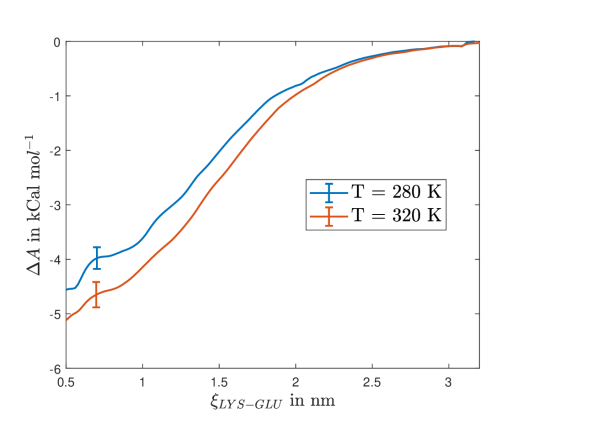
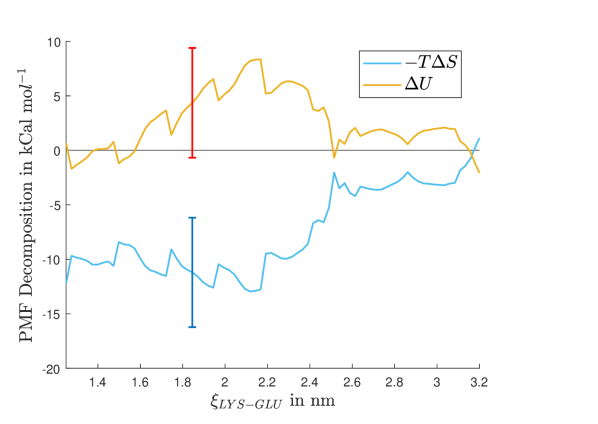
The entropic and energetic contribution to the PMF are shown in figure 3. Results from the three forcefields are consistent in that they reveal that the association is strongly entropically favored at small separations. For TIP3P-AMBER, the driving force switches from being entropically-driven to energetically-driven at separations of 1.5-2nm.
For the TIP3P-AMBER case, the PMF has a stronger energetic contribution at larger separations, especially at the higher salt concentration. This is true in the BMW-Martini result at high salt but is absent in the POL-Martini results. The entropy, energy, and free energy all decrease as the salt concentration is increased. This is consistent with past experimental and theoretical works on this phenomenon2, 44, 45, 13.
The major distinction we find however is the endothermic nature of complexation in the absence of excess salt, and the complexation is entropically driven. A recent experimental study by Fu and Schlenoff 13 suggests that the enthalpic contribution for complex coacervation arises from the changes in water perturbation. This is unlikely in our model, however, because the qualitative behavior (the driving factors of complexation) is insensitive to the water model.

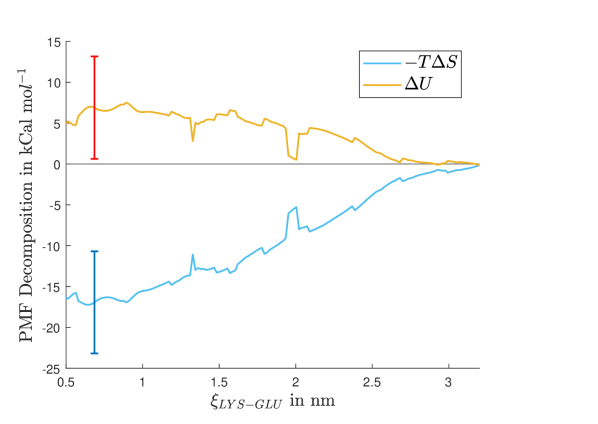
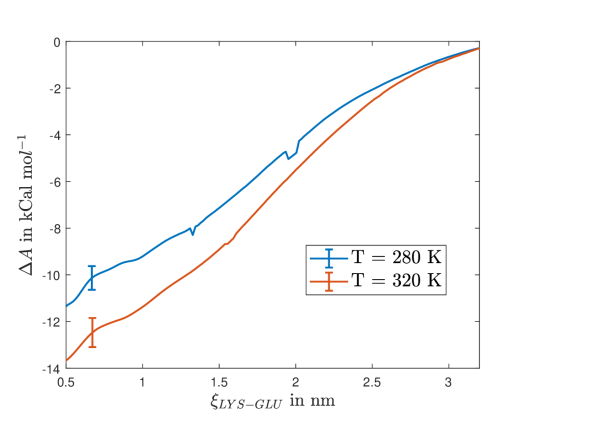
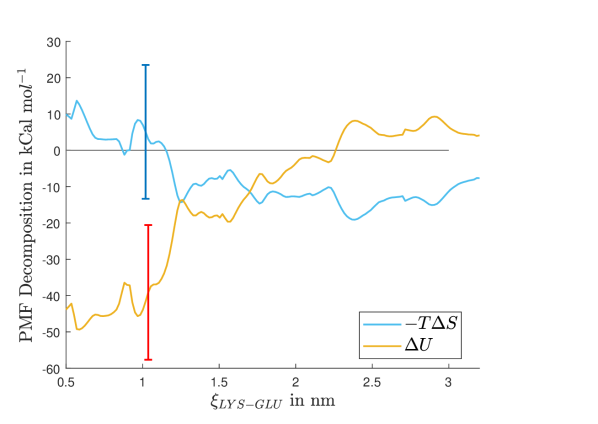
The removal of all small ions makes the driving force energetic. Figure 4 depicts the entropic and energetic contributions for CNaCl=0M. At all temperatures the association is significantly stronger in the absences of small ions; the magnitude of the free energy of complexation is 42.5 kcal mol-1. This suggests that the polyion electrostatic interactions are screened by the small ions even at very short distances. The main result, however, is that the driving force is energetic, which means that just the presence of neutralizing small ions is sufficient to change the nature of the thermodynamic driving force. This strongly indicates that the favorable entropy for complexation predominantly comes from the counterions and the excess salt in the systems.
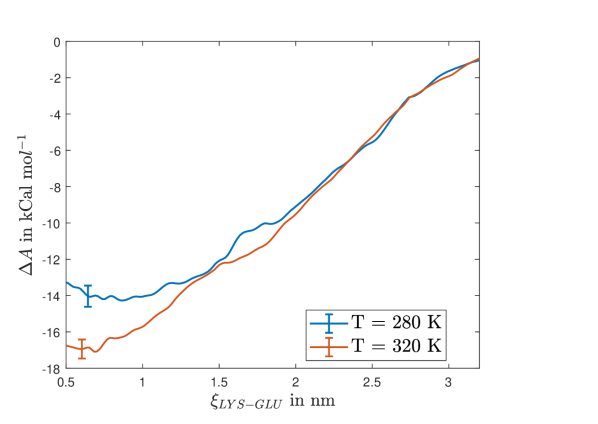
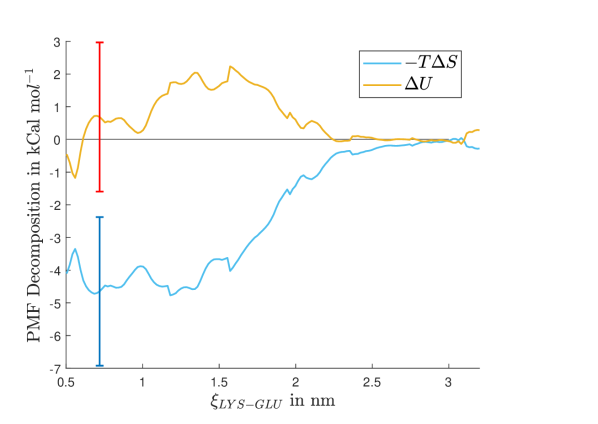
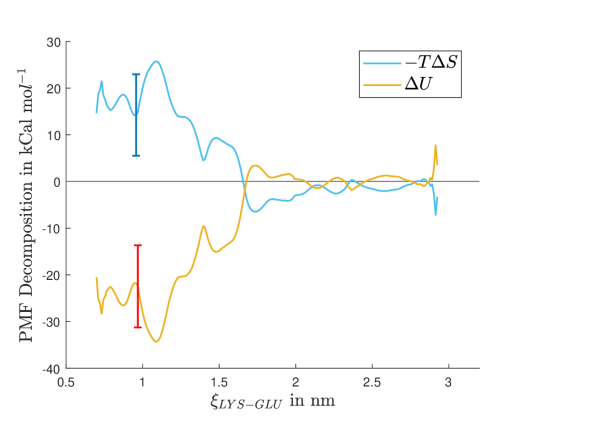
The driving force is also energetic if the charge on the peptides is reduced. Figure 5 depicts the entropic and energetic contributions for a 11-mer peptide with 6 charged groups in salt-free conditions, with the TIP3P-AMBER force field. With the reduced charge density of the polyions, and the correspondingly smaller number of counterions, the driving force is energetic, compared to the entropic PMF observed for fully charged peptides in salt-free solution. This further implies that the entropic driving force arises from contributions from the counterions.
3.3 Contribution of counterions in the entropy of complexation
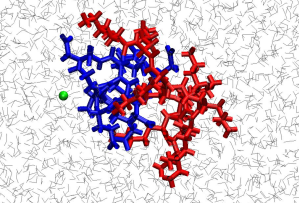
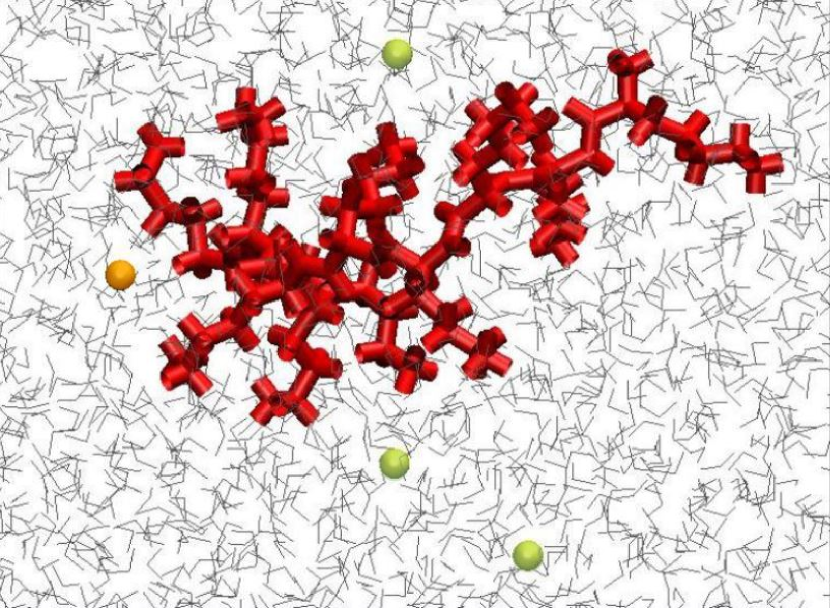
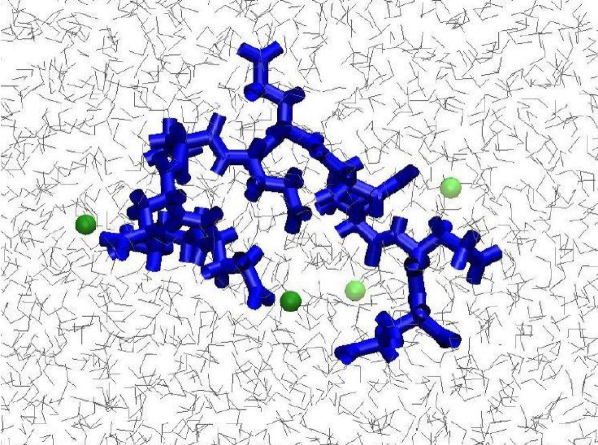
The role of counterions in the entropy of complexation is subtle. Figures 6(a), 6(b) and 6(c) depict snapshots of the polyions in the case where = 1.0 nm (part a) and = 3.5 nm (parts b and c). The separation between polyions is constrained using an umbrella potential as in the PMF calculation. It is evident from the snapshots that there is a substantial increase in the coordination number of the counterions for both polypeptides when they are not interacting with each other. The counterions are not statically constrained, of course, and their diffusion coefficient is not significantly reduced. Note also that the fraction of all counterions within the second shell of the charged groups of the polyion is only 0.3-0.4.
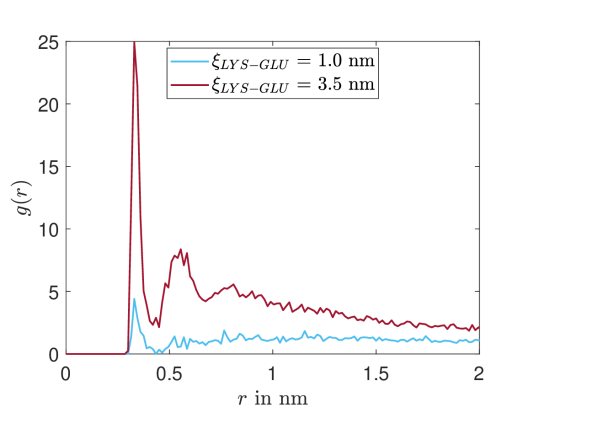
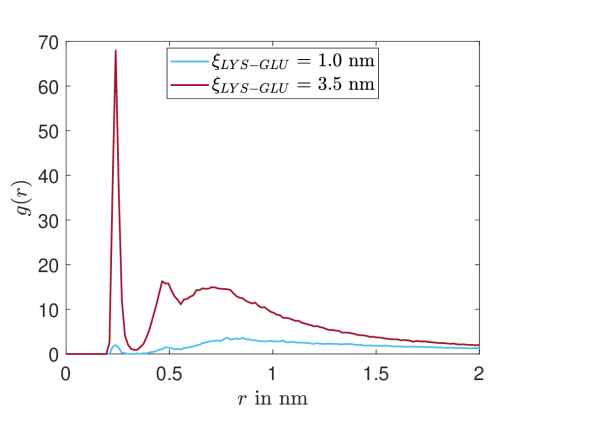
The counterion-polyion correlations can be quantified via the pair distribution function between counterions and the charged sites on the polyions. Specific molecular sites of both polypeptides with the highest partial charge are categorized together and the radial distribution function between each of the these sites and the counterions are calculated. For poly(glutamate) these sites consist of the carbonyl atoms and for poly(lysine), these sites comprise the terminal nitrogen, hydrogen and carbon. These radial distribution functions are shown in fig. 7(a) and 7(b). A substantial increase in the first and second peak of the radial distribution function can be observed for both poly(lysine)-Cl- and poly(glutamate)-Na+ when they are not interacting with each other. The magnitude of the first peak increases by a factor of 5 and 35, respectively, for poly(lysine)-Cl- and poly(glutamate)-Na+.
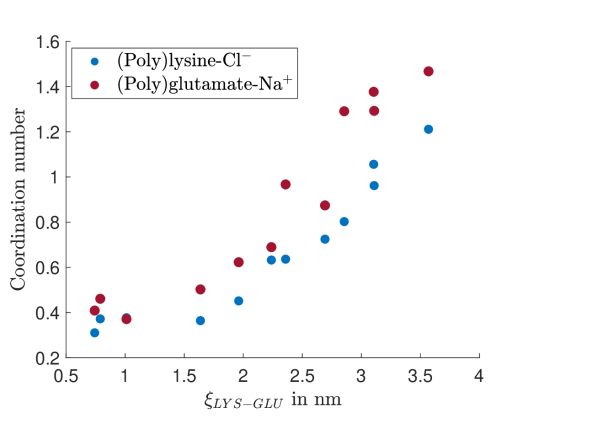
A coordination number calculation between the polypeptides and the counterions for the same system as above at different distance of separation between poly(lysine) and poly(glutamate) is also performed. This is done by defining a sphere of size 0.55 nm around both polypeptides, which approximately corresponds to the second shell (as seen in fig. 7(a)) and averaging the number of counterions found within that shell over all timesteps. Since a switch of driving factors for complexation from being entropically-driven to energetically-driven (as shown in fig. 3(e)) is observed at 1.5 nm for TIP3P-AMBER, it is important to investigate if this switch results from the counterions being bound to the polypeptides at that distance. If such is the case, it would be expected that there is a rapid increase in the coordination number of the ions at 1.5 nm. The coordination number plot is shown in fig. 7(c), which indicates that there is no rapid increase in the coordination number at 1.5 nm. Rather, an almost a linear increase is seen as the polypeptides transition from a complexed to a more dilute region where they are not interacting with each other.
It is important to note that although there is a steep increase in the first and second peaks of the radial distribution function between the polypeptides and counterions as they are brought to a region of no interaction, the average number of ions that reside in the first and second shell of the polypeptides is still not substantially high. Even when the polyelectrolytes are not interacting with each other, only 12 - 16% of the total counterions reside near them. A movie of the trajectory of the system of polypeptides in the non-interacting regime is available at https://doi.org/10.6084/m9.figshare.9209489, where it is evident that although the polypeptides have a large number of counterions in proximity (which can also be seen in fig. 6(b) and 6(c)), the counterions are not bound or condensed, however, and freely move around the polypeptides and continuously leave and enter the coordination shells. Therefore the entropy of complexation does not arise from a loss of translational entropy of the counterions but rather from the increase in the probability of the counterions to be in close proximity with the polypeptides.
4 Conclusion
We study the driving force for the complexation of poly(lysine) and poly(glutamate) oligomers using molecular dynamics simulations of an atomistic and two coarse grained models. Results from all three forcefields are in qualitative agreement for the potential of mean force and driving force for complexation. The agreement between force fields, which have very different treatment for water, suggests that the solvent does not play a dominant role in the complexation process. For peptides where every residue is charged, the driving force is entropic in all cases except when there are no small ions present, in which case it becomes energetic. We conclude that the entropy of the counterions is the important physical reason for polyelectrolyte complexation. When the charge density of the peptides is decreased, and there are correspondingly fewer counterions, the driving force becomes energetic. This further supports the notion that the counterion entropy contributes to the driving force for complexation.
An interesting point is that all the systems studied are well over the counterion condensation threshold and the ratio 1.8-3.2. We do not see any dynamic localization of the counterions, which have non-zero self-diffusion constants and sample the entire volume independent of the separation of the polyions. As a caveat, we mention that there are several differences between these chemically realistic models and the interpretation on the basis of phenomenology of simplified models might be problematic. The peptides are quite short, and the charge moities are not on the backbone but rather on side-chains. In addition, the non-electrostatic contributions to the interactions are likely to be significant. Further study of the complexation of realistic polymers should help our understanding of the physics of the phase behavior of experimental systems.
5 Author Information
Corresponding Author
*E-mail: yethiraj@wisc.edu
ORCID
Arun Yethiraj: 0000-0002-8579-449X
Notes
The authors declare no competing financial interest.
{acknowledgement}
This research work was supported by the National Science Foundation through Grant No. CHE-1856595. We thank Kyeong-Jun Jeong and Dr. Ajay Muralidharan for stimulating and useful discussion regarding this project. All simulations presented here were performed in computational resources provided by UW-Madison Department of Chemistry HPC Cluster under NSF Grant No. CHE-0840494 and the UW-Madison Center for High Throughput Computing (CHTC).
References
- Decher 1997 Decher, G. Fuzzy nanoassemblies: toward layered polymeric multicomposites. science 1997, 277, 1232–1237
- Van der Gucht et al. 2011 Van der Gucht, J.; Spruijt, E.; Lemmers, M.; Stuart, M. A. C. Polyelectrolyte complexes: bulk phases and colloidal systems. Journal of colloid and interface science 2011, 361, 407–422
- Hoffmann et al. 2015 Hoffmann, K. Q.; Perry, S. L.; Leon, L.; Priftis, D.; Tirrell, M.; de Pablo, J. J. A molecular view of the role of chirality in charge-driven polypeptide complexation. Soft Matter 2015, 11, 1525–1538
- Cui et al. 2012 Cui, J.; Yan, Y.; Such, G. K.; Liang, K.; Ochs, C. J.; Postma, A.; Caruso, F. Immobilization and Intracellular Delivery of an Anticancer Drug Using Mussel-Inspired Polydopamine Capsules. Biomacromolecules 2012, 13, 2225–2228, PMID: 22792863
- Overbeek and Voorn 1957 Overbeek, J. T. G.; Voorn, M. J. Phase separation in polyelectrolyte solutions. Theory of complex coacervation. Journal of Cellular and Comparative Physiology 1957, 49, 7–26
- Spruijt et al. 2010 Spruijt, E.; Sprakel, J.; Lemmers, M.; Stuart, M. A. C.; van der Gucht, J. Relaxation Dynamics at Different Time Scales in Electrostatic Complexes: Time-Salt Superposition. Phys. Rev. Lett. 2010, 105, 208301
- Chollakup et al. 2010 Chollakup, R.; Smitthipong, W.; Eisenbach, C. D.; Tirrell, M. Phase Behavior and Coacervation of Aqueous Poly(acrylic acid)-Poly(allylamine) Solutions. Macromolecules 2010, 43, 2518–2528
- Silva et al. 2014 Silva, P. T. d.; Fries, L. L. M.; Menezes, C. R. d.; Holkem, A. T.; Schwan, C. L.; Wigmann, É. F.; Bastos, J. d. O.; Silva, C. d. B. d. Microencapsulation: concepts, mechanisms, methods and some applications in food technology. Ciência Rural 2014, 44, 1304–1311
- Johnson and Wang 2014 Johnson, N. R.; Wang, Y. Coacervate delivery systems for proteins and small molecule drugs. Expert Opinion on Drug Delivery 2014, 11, 1829–1832, PMID: 25138695
- Wang et al. 1996 Wang, Y.-F.; Gao, J.; Dubin, P. Protein separation via polyelectrolyte coacervation: Selectivity and efficiency. Biotechnology Progress 1996, 12, 356–362, cited By 143
- Kim et al. 2016 Kim, S.; Huang, J.; Lee, Y.; Dutta, S.; Yoo, H. Y.; Jung, Y. M.; Jho, Y.; Zeng, H.; Hwang, D. S. Complexation and coacervation of like-charged polyelectrolytes inspired by mussels. Proceedings of the National Academy of Sciences 2016, 113, E847–E853
- Rathee et al. 2018 Rathee, V. S.; Sidky, H.; Sikora, B. J.; Whitmer, J. K. Role of Associative Charging in the Entropy–Energy Balance of Polyelectrolyte Complexes. Journal of the American Chemical Society 2018, 140, 15319–15328
- Fu and Schlenoff 2016 Fu, J.; Schlenoff, J. B. Driving Forces for Oppositely Charged Polyion Association in Aqueous Solutions: Enthalpic, Entropic, but Not Electrostatic. Journal of the American Chemical Society 2016, 138, 980–990, PMID: 26771205
- de Kruif et al. 2004 de Kruif, C. G.; Weinbreck, F.; de Vries, R. Complex coacervation of proteins and anionic polysaccharides. Current Opinion in Colloid & Interface Science 2004, 9, 340 – 349
- Gummel et al. 2007 Gummel, J.; Cousin, F.; Boué, F. Counterions Release from Electrostatic Complexes of Polyelectrolytes and Proteins of Opposite Charge: A Direct Measurement. Journal of the American Chemical Society 2007, 129, 5806–5807, PMID: 17439127
- Priftis et al. 2013 Priftis, D.; Megley, K.; Laugel, N.; Tirrell, M. Complex coacervation of poly(ethylene-imine)/polypeptide aqueous solutions: Thermodynamic and rheological characterization. Journal of Colloid and Interface Science 2013, 398, 39 – 50
- Aberkane et al. 2010 Aberkane, L.; Jasniewski, J.; Gaiani, C.; Scher, J.; Sanchez, C. Thermodynamic Characterization of Acacia Gum--Lactoglobulin Complex Coacervation. Langmuir 2010, 26, 12523–12533, PMID: 20586462
- Ou and Muthukumar 2006 Ou, Z.; Muthukumar, M. Entropy and enthalpy of polyelectrolyte complexation: Langevin dynamics simulations. The Journal of Chemical Physics 2006, 124, 154902
- Elder et al. 2011 Elder, R. M.; Emrick, T.; Jayaraman, A. Understanding the Effect of Polylysine Architecture on DNA Binding Using Molecular Dynamics Simulations. Biomacromolecules 2011, 12, 3870–3879, PMID: 21961938
- Michaeli et al. 1957 Michaeli, I.; Overbeek, J. T. G.; Voorn, M. Phase separation of polyelectrolyte solutions. Journal of Polymer Science 1957, 23, 443–450
- Borue and Erukhimovich 1990 Borue, V. Y.; Erukhimovich, I. Y. A statistical theory of globular polyelectrolyte complexes. Macromolecules 1990, 23, 3625–3632
- Popov et al. 2007 Popov, Y. O.; Lee, J.; Fredrickson, G. H. Field-theoretic simulations of polyelectrolyte complexation. Journal of Polymer Science Part B: Polymer Physics 2007, 45, 3223–3230
- Lee et al. 2008 Lee, J.; Popov, Y. O.; Fredrickson, G. H. Complex coacervation: A field theoretic simulation study of polyelectrolyte complexation. The Journal of Chemical Physics 2008, 128, 224908
- Zhang et al. 2016 Zhang, P.; Alsaifi, N. M.; Wu, J.; Wang, Z.-G. Salting-Out and Salting-In of Polyelectrolyte Solutions: A Liquid-State Theory Study. Macromolecules 2016, 49, 9720–9730
- Perry and Sing 2015 Perry, S. L.; Sing, C. E. PRISM-Based Theory of Complex Coacervation: Excluded Volume versus Chain Correlation. Macromolecules 2015, 48, 5040–5053
- Sing 2017 Sing, C. E. Development of the modern theory of polymeric complex coacervation. Advances in Colloid and Interface Science 2017, 239, 2 – 16, Complex Coacervation: Principles and Applications
- Brooks et al. 2009 Brooks, B. R. et al. CHARMM: The biomolecular simulation program. Journal of Computational Chemistry 2009, 30, 1545–1614
- Manning 1969 Manning, G. S. Limiting Laws and Counterion Condensation in Polyelectrolyte Solutions I. Colligative Properties. The Journal of Chemical Physics 1969, 51, 924–933
- Manning 1969 Manning, G. S. Limiting Laws and Counterion Condensation in Polyelectrolyte Solutions I. Self-diffusion of Small Ions. The Journal of Chemical Physics 1969, 51, 934–938
- Li et al. 2014 Li, N. K.; Quiroz, F. G.; Hall, C. K.; Chilkoti, A.; Yingling, Y. G. Molecular Description of the LCST Behavior of an Elastin-Like Polypeptide. Biomacromolecules 2014, 15, 3522–3530, PMID: 25142785
- Tarakanova et al. 2019 Tarakanova, A.; Ozsvar, J.; Weiss, A. S.; Buehler, M. J. Coarse-Grained Model of Tropoelastin Self-Assembly into Nascent Fibrils. Materials Today Bio 2019, 100016
- Marrink and Mark 2003 Marrink, S. J.; Mark, A. E. The mechanism of vesicle fusion as revealed by molecular dynamics simulations. Journal of the American Chemical Society 2003, 125, 11144–11145
- Kim et al. 2013 Kim, M.; Kim, H. R.; Chae, S. Y.; Larson, R. G.; Lee, H.; Park, J. C. Effect of arginine-rich peptide length on the structure and binding strength of siRNA–peptide complexes. The Journal of Physical Chemistry B 2013, 117, 6917–6926
- Antila et al. 2015 Antila, H. S.; Härkönen, M.; Sammalkorpi, M. Chemistry specificity of DNA–polycation complex salt response: a simulation study of DNA, polylysine and polyethyleneimine. Phys. Chem. Chem. Phys. 2015, 17, 5279–5289
- Wu et al. 2010 Wu, Z.; Cui, Q.; Yethiraj, A. A New Coarse-Grained Model for Water: The Importance of Electrostatic Interactions. The Journal of Physical Chemistry B 2010, 114, 10524–10529, PMID: 20701383
- Marrink et al. 2007 Marrink, S. J.; Risselada, H. J.; Yefimov, S.; Tieleman, D. P.; de Vries, A. H. The MARTINI Force Field: Coarse Grained Model for Biomolecular Simulations. The Journal of Physical Chemistry B 2007, 111, 7812–7824, PMID: 17569554
- Yesylevskyy et al. 2010 Yesylevskyy, S. O.; Schäfer, L. V.; Sengupta, D.; Marrink, S. J. Polarizable water model for the coarse-grained MARTINI force field. PLoS computational biology 2010, 6, e1000810
- Hornak et al. 2006 Hornak, V.; Abel, R.; Okur, A.; Strockbine, B.; Roitberg, A.; Simmerling, C. Comparison of multiple Amber force fields and development of improved protein backbone parameters. Proteins: Structure, Function, and Bioinformatics 2006, 65, 712–725
- Abraham et al. 2015 Abraham, M. J.; Murtola, T.; Schulz, R.; Páll, S.; Smith, J. C.; Hess, B.; Lindahl, E. GROMACS: High performance molecular simulations through multi-level parallelism from laptops to supercomputers. SoftwareX 2015, 1-2, 19 – 25
- Darden et al. 1993 Darden, T.; York, D.; Pedersen, L. Particle mesh Ewald: An N log (N) method for Ewald sums in large systems. The Journal of chemical physics 1993, 98, 10089–10092
- Berendsen et al. 1984 Berendsen, H. J. C.; Postma, J. P. M.; van Gunsteren, W. F.; DiNola, A.; Haak, J. R. Molecular dynamics with coupling to an external bath. The Journal of Chemical Physics 1984, 81, 3684–3690
- Kumar et al. 1992 Kumar, S.; Rosenberg, J. M.; Bouzida, D.; Swendsen, R. H.; Kollman, P. A. THE weighted histogram analysis method for free-energy calculations on biomolecules. I. The method. Journal of Computational Chemistry 1992, 13, 1011–1021
- Sun et al. 2015 Sun, D.; Forsman, J.; Woodward, C. E. Evaluating Force Fields for the Computational Prediction of Ionized Arginine and Lysine Side-Chains Partitioning into Lipid Bilayers and Octanol. Journal of Chemical Theory and Computation 2015, 11, 1775–1791, PMID: 26574387
- Laugel et al. 2006 Laugel, N.; Betscha, C.; Winterhalter, M.; Voegel, J.-C.; Schaaf, P.; Ball, V. Relationship between the Growth Regime of Polyelectrolyte Multilayers and the Polyanion/Polycation Complexation Enthalpy. The Journal of Physical Chemistry B 2006, 110, 19443–19449, PMID: 17004803
- Hofs et al. 2006 Hofs, B.; Voets, I. K.; de Keizer, A.; Cohen Stuart, M. A. Comparison of complex coacervate core micelles from two diblock copolymers or a single diblock copolymer with a polyelectrolyte. Phys. Chem. Chem. Phys. 2006, 8, 4242–4251