Reproducibility of high-performance quantum dot single-photon sources
Abstract
Single-photon sources based on semiconductor quantum dots have emerged as an excellent platform for high efficiency quantum light generation. However, scalability remains a challenge since quantum dots generally present inhomogeneous characteristics. Here we benchmark the performance of fifteen deterministically fabricated single-photon sources. They display an average indistinguishability of with a single-photon purity of and high homogeneity in operation wavelength and temporal profile. Each source also has state-of-the-art brightness with an average first lens brightness value of . Whilst the highest brightness is obtained with a charged quantum dot, the highest quantum purity is obtained with neutral ones. We also introduce various techniques to identify the nature of the emitting state. Our study sets the groundwork for large-scale fabrication of identical sources by identifying the remaining challenges and outlining solutions.
I Introduction
Quantum light sources are key building blocks for the development of quantum enhanced technologies. For instance, indistinguishable single photons are needed for multipartite quantum cryptography Máttar et al. (2018) and for developing quantum networks Hensen et al. (2015); Liao et al. (2017). They also constitute attractive quantum bits for quantum computing Taballione et al. (2019); Wang et al. (2018) that do not suffer from decoherence and can be operated at room temperature Hosseini et al. (2011). Quantum light is also sought after for quantum sensing applications, be it for sub-shot noise quantum imaging Brida et al. (2010) or superresolution Forbes and Rodriguez-Fajardo (2019).
For a long time, single-photon based technologies have relied on heralded single-photon sources, based on probabilistic photon pair generation in non-linear crystals Mosley et al. (2008). However, these sources suffer from intrinsic limitations, where the multi-photon probability scales linearly with the source brightness and reaching high efficiencies requires difficult multiplexing schemes Kaneda et al. (2015); Kaneda and Kwiat (2018).
Semiconductor quantum dots (QDs) have emerged as an excellent platform to generate single-photons. After two decades of fundamental investigation and technological developments, a clear path has been laid out to obtain highly efficient sources of high quantum purity single photons Somaschi et al. (2016); Wang et al. (2019). Quantum dots behave like artifical atoms that can emit single photons on demand. By fabricating a microcavity around a QD, these single photons can be efficiently collected while simultaneously mitigating pure dephasing Giesz et al. (2016); Loredo et al. (2016); Grange et al. (2017).
Despite the excellent performance of QD-based sources, the scalability of the technology remains an open challenge because natural QDs grow at random spatial positions Yoshie et al. (2004) and both the natural and site-controlled QDs show inhomogeneous spectral resonances spanning 2 to 10 meV Huber et al. (2017); Schöll et al. (2019); Juska et al. (2013). While several groups in the QD community have successfully achieved the fabrication of single-photon sources with state-of-the-art performance Claudon et al. (2010); Zadeh et al. (2016); Kirsanske et al. (2017); Ding et al. (2016); Liu et al. (2018), most demonstrations still rely on fabrication techniques where the spatial and spectral matching of the QD cavity coupling is not fully controlled. Obtaining a good QD-cavity coupling thus relies on testing a large number of devices – sometimes in the thousands. Such a low control in the fabrication process is prohibitive for scalability, since the QD-cavity coupling determines not only the source brightness and its spectral bandwidth through the Purcell effect Purcell et al. (1946); Auffèves-Garnier et al. (2007), but also its degree of indistinguishability Grange et al. (2015); Iles-Smith et al. (2017). More recently, several groups have developed techniques to precisely position the QD in a photonic structure Davanco et al. (2017); He et al. (2017); Schnauber et al. (2019). Yet, only a few of them report the performance of more than one or two devices Liu et al. (2019); Wang et al. (2019). How far these technologies are from a large-scale production of identical single-photon sources remains an open question.
In the present work, we address this question by benchmarking fifteen sources consisting of single QDs inside micropillar cavities. The sources are deterministically fabricated using the in-situ cryogenic photolithography technique Dousse et al. (2008). They are operated under resonant excitation in order to obtain the highest degree of quantum purity. For each source, we measure the single-photon purity, indistinguishability, brightness, and study the reproducibility in operation wavelength and temporal profiles.Two types of sources are studied based on different optical transitions: one based on a neutral exciton and the other on a trion, which is a charged exciton. We demonstrate new techniques for identifying these optical transitions, and discuss the physics that determines the source characteristics. Finally, we outline the remaining challenges for larger scale fabrication of identical sources.
II Devices and operation
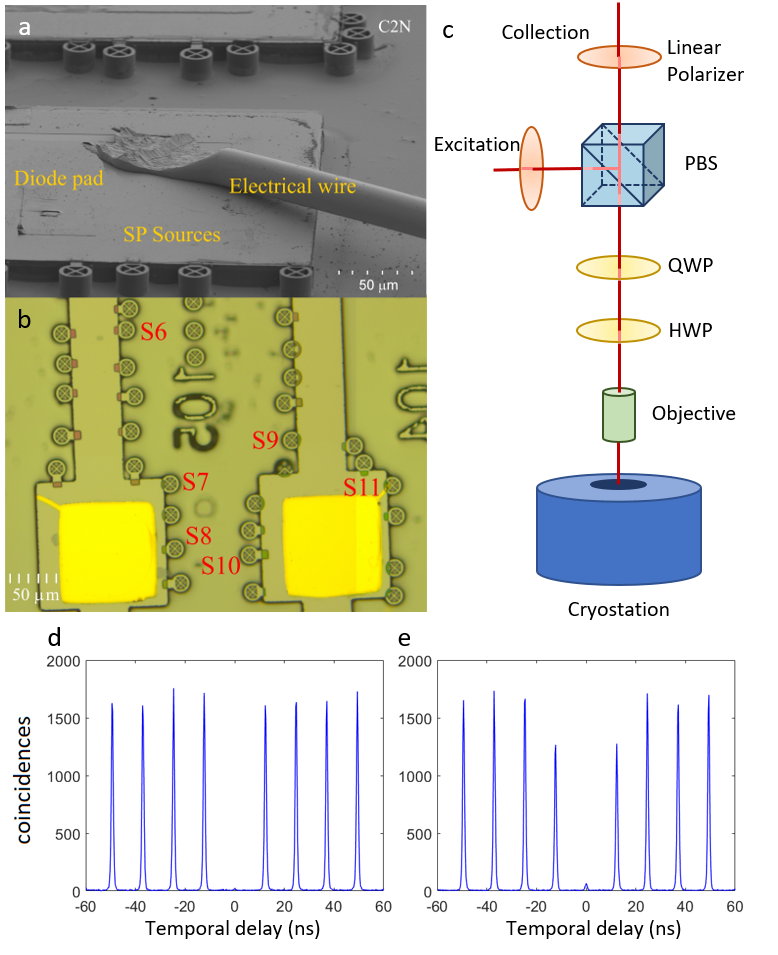
A scanning electron microscope (SEM) image and an optical microscope image of two samples are presented in fig. 1a and b respectively.
The sources that we study are composed of a single semiconductor InGaAs QD embedded in a micropillar -cavity with 14 (28) GaAs/AlAs Bragg pairs in the top (bottom) mirror. A nm-thick Ga0.1Al0.9As barrier, positioned nm above the QD layer, is used to increase the hole capture time inside the QD Ardelt et al. (2015). By creating an electron-hole pair in the QD with an additional laser, we can trap a hole since the electron quickly escapes whereas the hole can not Hilaire et al. (2019). This technique allows us to optically control the QD charge state. The fabrication process makes use of the cryogenic in-situ lithography technique that allows to position the pillar center within 50 nm of the QD and to adjust the pillar cavity diameter to ensure the spectral resonance between the QD and the cavity lines Dousse et al. (2008). The pillar is connected through bridges to a circular frame and a large mesa structure where electrical contacts are attached Nowak et al. (2014). This allows us to fine-tune the QD-cavity resonance via the Stark effect Bennett et al. (2010); Nowak et al. (2014).
In the following, we report on sources from five samples (labelled from A to E) fabricated from the same 2-inch wafer grown by molecular beam epitaxy (MBE). Each sample contains 15 to 30 sources. Only a few sources were investigated on samples A through C and all sources were investigated on samples D and E. Among the studied sources, we selected those giving a first lens brightness greater than . For samples D and E, it was the case for 6 and 4 sources respectively, corresponding to 20 to 25% of sources per sample. The labels in fig. 1b show the corresponding sources for sample D.
Highly indistinguishable photons are obtained from QDs when using resonant excitation Monniello et al. (2014); He et al. (2013). A typical setup for this purpose is presented in fig. 1c. A laser providing 15 ps pulses at a repetition rate of 81 MHz is set to be resonant with the QD transition. The excitation beam enters the setup through a single-mode fiber; then a first telescope (not shown in the figure) optimizes the spatial overlap of the beam with the fundamental mode of the micropillar Dousse et al. (2008); Hilaire et al. (2018). An input polarizer sets the polarization along the reflection axis of a polarizing beam splitter (PBS). The beam is sent through a 0.45 NA objective to a low vibration cryostat where the sample is cooled down to 7 K. The QD emission is collected in the transmission mode of the PBS, orthogonal to the input polarization. A half-wave plate (HWP) and a quarter-wave plate (QWP) are used together to control the polarization with respect to the cavity axes and to correct for polarization ellipticities induced by the setup. In the collection mode of the PBS, a second polarizer improves laser extinction and a second telescope adjusts the single-photon beam diameter to match the collection fiber mode.
Fig. 1d and 1e present typical second-order correlation histograms characterizing the single-photon purity and the photon indistinguishability, here measured on device S7. The is given by the integrated coincidences around zero delay normalized by the area of the side-band peaks. The indistinguishability is measured via two-photon Hong-Ou-Mandel (HOM) interference in a path-unbalanced Mach-Zehnder interferometer, where two consecutive single photons initially separated by about 12 ns interfere at a beam splitter Loredo et al. (2016); Somaschi et al. (2016). The raw indistinguishability is given by where is the ratio of coincidences at zero delay to the averaged coincidences of the uncorrelated peaks. The examples in fig. 1 correspond to and .
III Two types of sources
Using the cross-polarization setup depicted in fig. 1c, the source operation relies on the ability of the QD optical transition to generate light in a polarization orthogonal to the excitation. The emission process differs substantially depending on whether the optical transition under consideration is an exciton or a trion, which, as we explain in this section, leads to significant differences in the source performance.
III.1 Exciton based sources
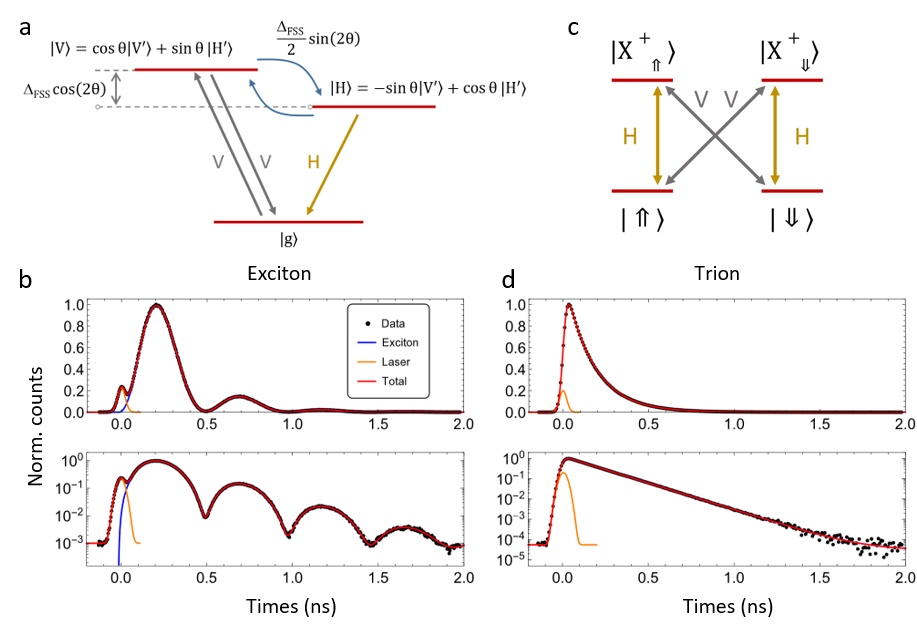
We first analyze the exciton, which corresponds to a three-level system, as depicted in fig. 2a. It comprises a single ground state and the two intrinsic exciton eigenstates—hereafter labelled and — leading to an emission in the corresponding linear polarization and . The two exciton states present a fine-structure splitting (FSS) which is an energy difference arising from the Coulomb exchange interaction in a spatially anisotropic QD Bayer et al. (2002).
The micropillar is not perfectly circular and therefore the cavity itself presents a small anisotropy leading to two nearly-degenerate linearly polarized fundamental cavity modes. The energy difference typically amounts to 30-70 eV which is smaller than the cavity spectral linewidth of 150-300 eV. These two modes, which we label and , cause an effective bi-refringence: when the excitation polarization is not aligned to nor , the portion of the excitation beam that is coupled to the cavity sees its polarization rotated. Such polarization rotation, recently used to measure the cavity coupling accurately Hilaire et al. (2018), leads to laser signal in the collection path. By choosing the excitation to be parallel with an axis of the cavity, this cavity rotated light is suppressed in the collection mode. In the following, we assume the excitation polarization is parallel to and the single-photon collection mode is . The quantum states of the exciton that have a dipole parallel to and are given by
| (1) |
where , presented on fig. 3a, is the angle between the optical polarization axis of and the dipole orientation of the exciton eigenstate .
In a simplified framework where the Purcell effect dominates and pure dephasing effects are negligible, the cavity amplitudes can be adiabatically eliminated to obtain an effective non-hermitian Hamiltonian that describes the emission process Bertlmann et al. (2006):
| (2) | ||||
where is the total Purcell-enhanced emission lifetime, which for small cavity asymmetry is assumed to be the same for both excitonic states.
Starting from the excited state and following a pi-pulse excitation, the time evolution of the exciton is described by
| (3) | ||||
The single-photon emission collected from the mode is then proportional to
| (4) |
This simple model explains important features. A -polarized excitation creates an exciton state that has no overlap with the mode at . The single-photon emission along is thus time delayed from the excitation, with a timescale inversely proportional to the FSS. While both components of the excited state decay with the total decay rate , the emission in the polarization is modulated by the time-dependent oscillation induced by . In the limit where , no emission from an exciton in cross-polarized collection mode is expected. In addition, note that if the exciton axes are aligned along the cavity axes so that , no cross-polarized emission takes place either. On the other hand, the collection is most efficient when .
The measured decay dynamics of an exciton is shown in fig. 2b for source S7. For visualization purposes, the light of the laser was not perfectly extinguished for these data so that we detect both the laser pulse and the exciton emission dynamics to compare the relative timescales. The maximum of the single-photon emission is delayed by approximately ps from the laser excitation pulse. The overall exponential decay is governed by the Purcell-enhanced spontaneous emission rate, and is also modulated by the phase dependence of the frequency components and at the rate . The experimental observations are accurately reproduced by eq. (4) using the following parameters: ps and eV. The damping of the oscillations observed in the lifetime curve were found to be consistent with a finite gaussian detector jitter time with a full width at half maximum (FWHM) of ps, which also dominated the observed width of the 15 ps Gaussian excitation pulse.
All the different excitons studied in this work show a FSS value ranging roughly from to 10 . Such emission process, governed by the QD and cavity asymmetries, adds extra challenges to the fabrication of identical sources. These complex features are circumvented when one considers sources based on a trion, as discussed in the following.
III.2 Trion based sources
When the QD contains a single charge, here a hole, the energy levels and optical selection rules are different. In the absence of an in-plane magnetic field, no linear polarization direction is favored and the optical transition rules can be written in the cavity axes basis. The system ground state is composed of two degenerate energy levels of the hole spin state and , which we define with a quantization axis parallel to . The excited trion states and correspond to two holes with opposite spin states and one electron. The optical selection rules governing these transitions are summarized in fig. 2c: each excited state is connected to both ground states through two optical transitions with linear orthogonal polarizations.
From this picture, it is straightforward to note that in the absence of spin initialization, namely when the hole spin is a mixture of spin up and down states, a -polarized optical excitation leads to a population of both trion states, that each radiate with probability along . This happens on the timescale of the excitation pulse, as opposed to the previous case of the exciton.
The illustrated selection rules lead to the generation of single-photon wavepackets with a mono-exponential decay, where the rise time is governed by the excitation pulse length and the decay time by the Purcell-enhanced spontaneous emission rate. Fig. 2d shows the emission dynamics of the trion-based single-photon source S11. The emission intensity now shows a rapid rise time followed by a mono-exponential decay with a lifetime of ps. Here, the finite detector response of roughly ps is consistent with the observed rise time.
As shown in the following, the nature of the optical transition does not only control the temporal profile but it also determines the brightness and single-photon purity of the sources. It is therefore important to develop tools to identify the nature of the transition.
Advanced equipment is required to observe the exciton splitting, either for high resolution spectral analysis or, as shown in fig 2b, high temporal resolution of the emission dynamics. In the next section, we demonstrate another simple identification tool based on the polarization-dependent optical selection rules.
III.3 Rotated emission identification method
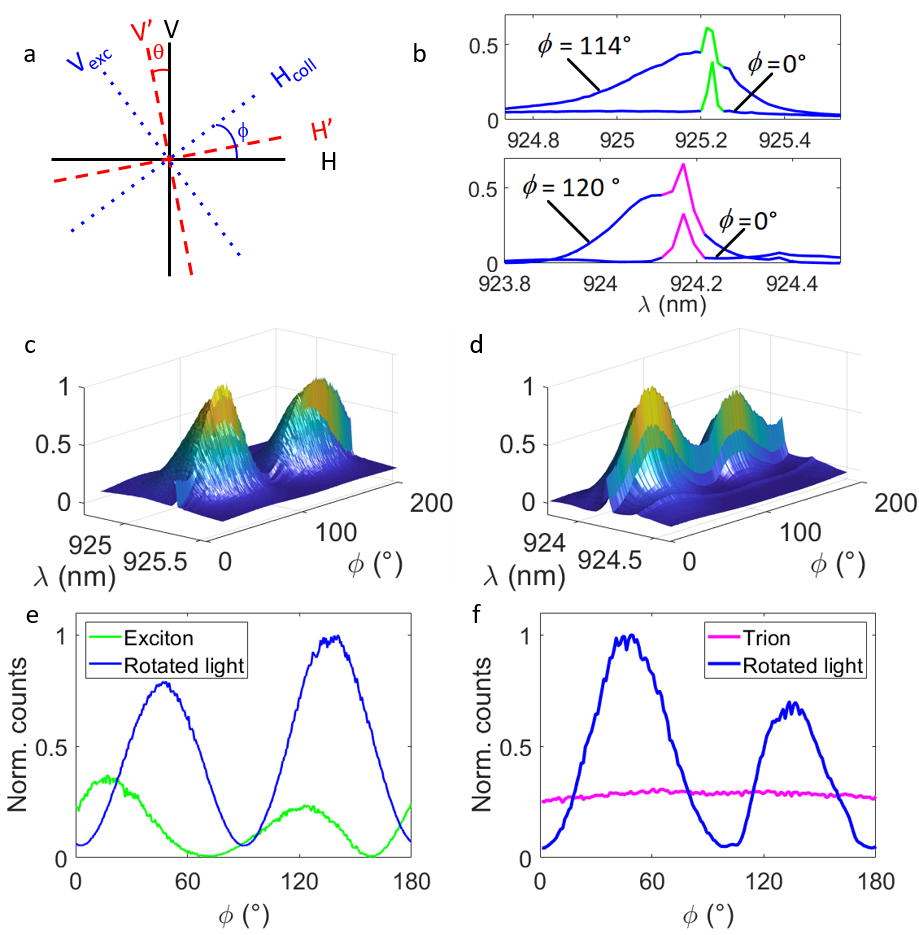
The performance of each source is determined both by the nature of the transition and, in the case of excitons, the orientation of the cavity axes with respect to the QD dipoles. In this context, it is useful to analyze the emission collected in cross-polarization when turning the excitation polarization by an angle with respect to the cavity axes, see fig. 3a. In the experimental configuration described in fig. 1c, the collection polarization is set orthogonal to the excitation polarization by the PBS, hence in the polarization direction (see fig. 3a). For , the excitation is parallel to the cavity axis and only the spectrally narrow emission arising from the QD is collected in the -mode, which corresponds to the configuration used for the source operation. However, when is different from or , an additional broader emission line is visible as shown in fig. 3b for the two devices S5 and S13. This broader emission arises from the birefringence of the cavity, as explained in subsection III.1. For better visualization of the cavity-induced light rotation, we used 3 ps laser pulses, which are spectrally broader than the cavity linewidth. The emission of the cavity rotated light is maximal for around and Hilaire et al. (2018).
Fig. 3c shows the emission spectra measured for the exciton S5, as a function of . Fig. 3e presents the intensity of the cavity rotated light and the QD emission as a function of . The emission arising from the exciton has a sinusoidal dependance with . A laser polarized along one of the exciton axes or ( or ) excites an eigenstate of the system and no emission takes place in the orthogonal polarization. The emission of the exciton thus depends on the angle between the incident polarization and the exciton axes (). This measurement also allows to determine , the angle between the cavity polarization and the exciton axes, an important parameter for the source brightness (see eq. (4)). Fig. 3d and 3f show the same experiment and analysis on a trion-based source S13. The rotated light arising from the cavity has the same sinusoidal dependence but the trion emission is now independent of . Indeed, the selection rules illustrated in fig. 2c can be rewritten in any two-orthogonal linear polarization basis and the amplitude of the QD emission in the polarization orthogonal to the excitation is independent of the orientation of the excitation.
IV Source benchmarking
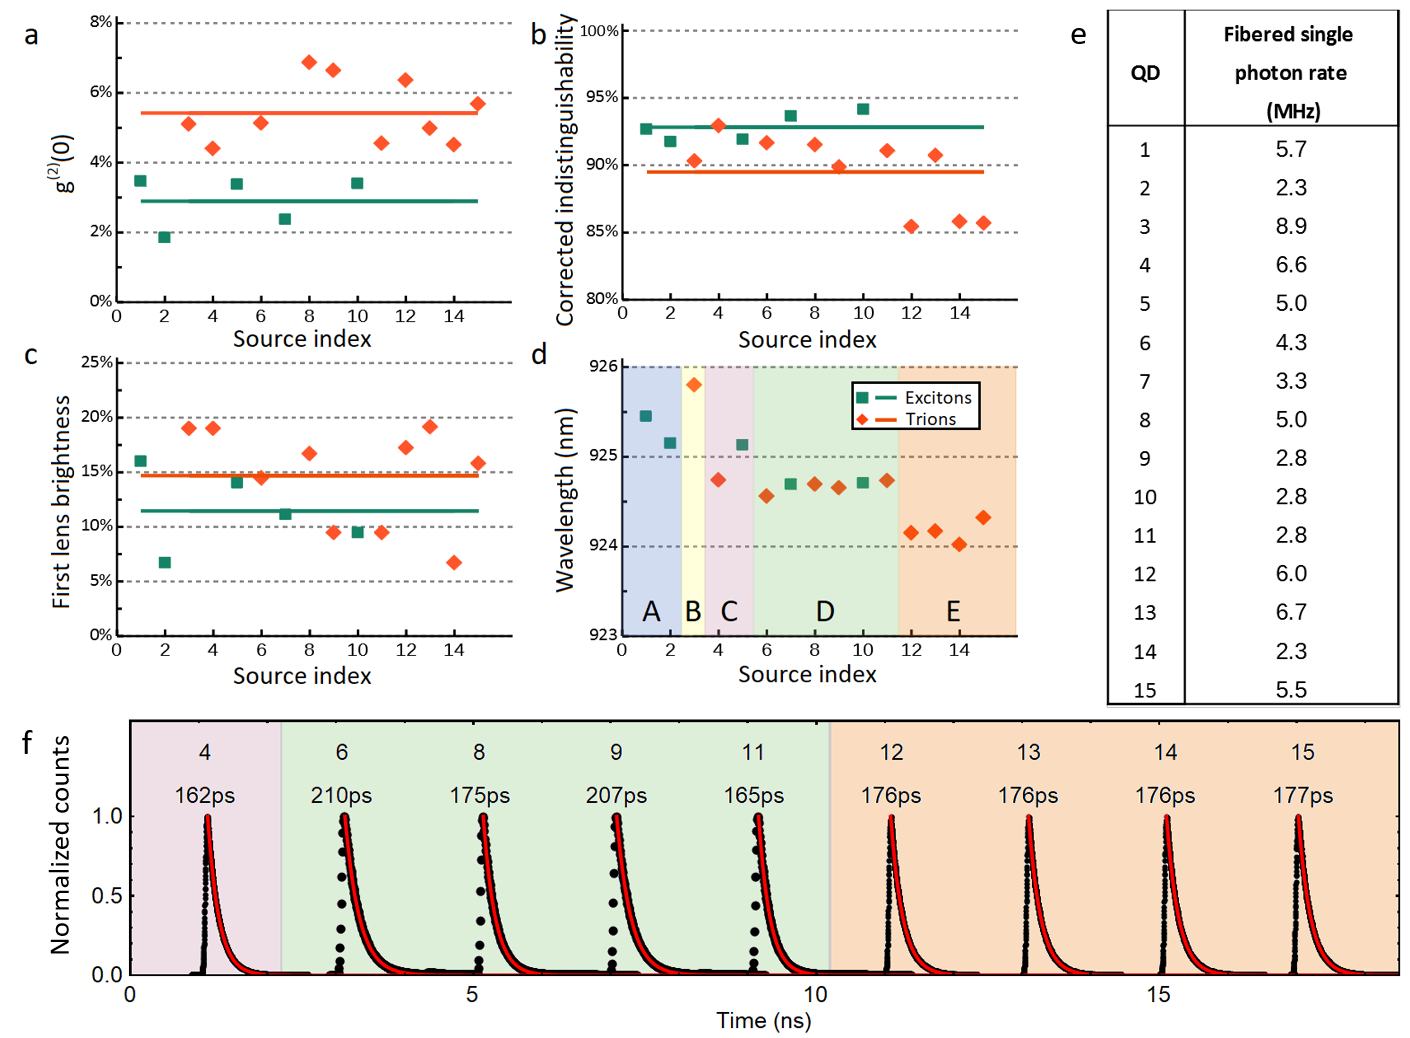
We now discuss the benchmarking of fifteen devices, whose main quantum properties are presented in fig. 4. We consider not only the figures of merit defining each source performance (single-photon purity, indistinguishability and brightness), but also the emission wavelength and temporal profile, that are critical characteristics for large-scale fabrication of identical sources. All figures of merit are reported using -pulse excitation Stievater et al. (2001) with ps pulses at a repetition rate of 81 MHz.
Fig. 4a shows the values of the sources, with an average of . The single-photon purity () is systematically higher for excitons than for trion sources. This can be understood by comparing the different emission processes for each source type in cross-polarization (shown in fig. 2b and fig. 2d). Since the emission from the exciton through the mode of the cavity is delayed compared to the excitation pulse, the probability that the quantum dot gets re-excited afterwards is low because the excitation pulse is over. In the case of a trion, the emission process in cross-polarization begins on the same timescale as the pulse and so there is a higher probability of re-excitation of the transition within the same excitation pulse, leading to the emission of a second photon Fischer et al. (2017); Loredo et al. (2019).
Fig. 4b shows the mean wavepacket overlap between two consecutive single photons emitted with a 12 ns delay. These values are obtained from the HOM visibility histogram and corrected from the corresponding non-zero Ollivier et al. . The mean wavepacket overlap over the various sources is quite homogeneous, with an average value of . Note that this indistinguishability is obtained without spectral filtering and thus it includes the contribution from the phonon sideband, which is strongly suppressed by the cavity funneling effect Grange et al. (2017); Iles-Smith et al. (2017). The slightly lower indistinguishability values of the sources from sample E are likely due to a higher temperature on that chip (around 10-11 K). These observations also show that, despite a very different temporal structure of the single-photon wavepacket in the case of exciton based sources, the coherence is highly preserved in the frequency domain over the emission process.
The source brightness corresponds to the probability to obtain a single photon for a given excitation pulse. It is defined as the collected single-photon rate divided by the excitation repetition rate Senellart et al. (2017). This probability is measured at the output of the collection fiber and then deduced at the first lens (fig. 4c). Both values depend on the global efficiency of our setup (transmission and output coupling), which is approximately . The average first lens brightness is , which is on par with state-of-the-art values using a 0.45 NA collection objective.
In a cross-polarization setup using cavities with a small birefringence, both the first lens and fibered brightness are limited to at most due to the rejection of photons orthogonally polarized to the collection mode. However, this limit can be overcome using polarized cavities Wang et al. (2019). In addition, the brightness is limited by the extraction efficiency, which is intrinsic to the cavity and is very similar for all pillars (), and also by the occupation probability of the QD charge state. Indeed, the rather large variation in brightness among the trion sources could be reduced by a better control on the occupation probability of the hole in the QD Hilaire et al. (2019). The brightness of an exciton based source further depends on both and the relative values of and the emission rate . Because the values of and FSS are not controlled during fabrication, excitons tend to be slightly less bright than trions.
The table in fig. 4e presents the fibered single-photon rate obtained by dividing the detected count rates measured at the output of a single-mode fiber by the efficiency of our silicon based avalanche photodiode ( detection efficiency at nm). It is also worth noting that we use a long-distance microscope objective with a numerical aperture of 0.45 that is placed outside of the cryostat. This limits the brightness because not all of the emission is collected by the objective. Also, this spatial truncation of the beam leads to a deformation of the wavefront which reduces the coupling into the single-mode fiber of typically 50 to 60%. Such collection efficiency could be strongly improved by inserting a high numerical aperture lens into the cryostat itself.
V Perspectives for scalability
Our systematic study of a large number of single-photon sources allows identification of the remaining challenges for the fabrication of remote sources generating highly identical photons. In this context, a key parameter is the source operation wavelength. The typical inhomogeneous broadening of the InGaAs QDs spectum is around nm. However, the in-situ lithography allows us to select QDs in a small spectral range and to fabricate pillars with the correct diameter to match the QD resonance Nowak et al. (2014). Fig. 4d shows the optimal operation wavelength of the sources. Overall, a small deviation of the operation wavelength is observed with an average wavelength of 924.7 nm with a standard deviation of only nm. When considering sources fabricated on the same part of the original wafer, this deviation is substantially reduced with nm for D and nm for E, showing the high degree of control provided by the in-situ lithography. Thus, we conclude that a higher homogeneity in the growth process across the wafer, as typically obtained from industrial epitaxy growth systems, would increase the yield of sources operating at the same wavelength. Note that the residual nm of deviation can be compensated via Stark tuning with minimal reduction to the brightness considering that the typical linewidth of our micropillar cavities is nm.
The temporal profile of the single-photon wavepackets is also another important feature to consider. We show that the challenges are different for sources based on neutral or charged QDs in a cross-polarized setup. Controlling the temporal profile of a exciton based source is challenging because it requires control of the fine-structure splitting and the relative axes orientation of the cavity and QD. Such complete control was not achieved here, but many tools have been developed in the last few years to control both the exciton fine-structure splitting Trotta et al. (2015) and the cavity birefringence Wang et al. (2019). On the other hand, we find that the temporal profiles of the trion-based sources are very consistent across all samples, with an average decay time of ps and a standard deviation of only ps (see fig. 4f).
The most promising path to scalability thus lies in the development of trion based sources where higher single-photon purity can be obtained by using shorter excitation pulses to reduce the probability for re-excitation. Such short pulses have not been used here due to the chromatic dependence of the polarization rejection apparatus. Using a specially designed highly achromatic polarization control or a side excitation scheme Weihs et al. (2012) would improve of the sources performance. Finally, we note that the variation in the brightness of the trion-based sources is rather large. This is due to an imperfect control of the QD charge state. This could be improved by applying an electric field during the in-situ lithography process, which would allow us to explore the different available charge states and their characteristics prior to the QD selection and cavity definition.
VI Conclusion
We have benchmarked a large number of single-photon sources based on semiconductor QDs. The present technology is based on the deliberate choice of using naturally grown QDs, which currently have a higher quantum purity than site controlled QDs Jöns et al. (2013); Reimer et al. (2016). Despite the QD random distribution, in both spatial and spectral degrees of freedom, our technology based on selecting the QDs during an in-situ-lithography step and building a tailored cavity around them, allows us to obtain a large number of sources with highly homogeneous properties. The first-lens brightness is shown to reach state-of-the-art values for resonant excitation with a highly reproducible indistinguishability of . Moreover, we discussed the physics of the sources behaviour in a cross-polarized resonant excitation scheme, and identified the parameters controlling the wavepacket temporal profile, the source brightness and the single-photon purity. The present study shows a clear path for scaling the fabrication process where highly identical remote sources could be obtained using a trion.
Acknowledgements.
This work was partially supported by the ERC PoC PhoW, the French Agence Nationale pour la Recherche (grant ANR SPIQE, USSEPP, QuDICE), the IAD - ANR support ASTRID program Projet ANR-18-ASTR-0024 LIGHT, the QuantERA ERA-NET Cofund in Quantum Technologies, project HIPHOP, the French RENATECH network, a public grant overseen by the French National Research Agency (ANR) as part of the "Investissements d’Avenir" programme (Labex NanoSaclay, reference: ANR-10-LABX-0035). J.C.L. and C.A. acknowledge support from Marie Skłodowska-Curie Individual Fellowships SMUPHOS and SQUAPH, respectively. H. O. Acknowledges support from the Paris Ile-de-France Région in the framework of DIM SIRTEQ.References
- Máttar et al. (2018) A. Máttar, J. Kołodyński, P. Skrzypczyk, D. Cavalcanti, K. Banaszek, and A. Acín, arXiv:1803.07089 [quant-ph] (2018), arXiv: 1803.07089.
- Hensen et al. (2015) B. Hensen, H. Bernien, A. E. Dréau, A. Reiserer, N. Kalb, M. S. Blok, J. Ruitenberg, R. F. L. Vermeulen, R. N. Schouten, C. Abellán, W. Amaya, V. Pruneri, M. W. Mitchell, M. Markham, D. J. Twitchen, D. Elkouss, S. Wehner, T. H. Taminiau, and R. Hanson, Nature 526, 682 (2015).
- Liao et al. (2017) S.-K. Liao, W. qi Cai, W.-Y. Liu, J. Zhang, Y. Li, J.-G. Ren, J. Yin, Q. Shen, Y. Cao, Z.-P. Li, F.-Z. Li, X.-W. Chen, L. hua Sun, J.-J. Jia, J.-C. Wu, X. jun Jiang, J. feng Wang, Y. mei Huang, Q. Wang, Y.-L. Zhou, L. Deng, T. Xi, L. Ma, T. Hu, Q. Zhang, Y.-A. Chen, N.-L. Liu, X.-B. Wang, Z. cai Zhu, C.-Y. Lu, R. Shu, C.-Z. Peng, J.-Y. Wang, and J.-W. Pan, Nature 549, 43 (2017).
- Taballione et al. (2019) C. Taballione, T. A. W. Wolterink, J. Lugani, A. Eckstein, B. A. Bell, R. Grootjans, I. Visscher, D. Geskus, C. G. H. Roeloffzen, J. J. Renema, I. A. Walmsley, P. W. H. Pinkse, and K.-J. Boller, Opt. Express 27, 26842 (2019).
- Wang et al. (2018) J. Wang, S. Paesani, Y. Ding, R. Santagati, P. Skrzypczyk, A. Salavrakos, J. Tura Brugués, R. Augusiak, L. Mancinska, D. Bacco, D. Bonneau, J. Silverstone, Q. Gong, A. Acín, K. Rottwitt, L. Oxenløwe, J. O’Brien, A. Laing, and M. Thompson, Science (New York, N.Y.) 360 (2018), 10.1126/science.aar7053.
- Hosseini et al. (2011) M. Hosseini, G. Campbell, B. M. Sparkes, P. K. Lam, and B. C. Buchler, Nature Physics 7, 794 (2011).
- Brida et al. (2010) G. Brida, M. Genovese, and I. Ruo Berchera, Nature Photonics 4, 227 (2010).
- Forbes and Rodriguez-Fajardo (2019) A. Forbes and V. Rodriguez-Fajardo, Nature Photonics 13, 76 (2019).
- Mosley et al. (2008) P. J. Mosley, J. S. Lundeen, B. J. Smith, P. Wasylczyk, A. B. U’Ren, C. Silberhorn, and I. A. Walmsley, Phys. Rev. Lett. 100, 133601 (2008).
- Kaneda et al. (2015) F. Kaneda, B. G. Christensen, J. J. Wong, H. S. Park, K. T. McCusker, and P. G. Kwiat, Optica 2, 1010 (2015).
- Kaneda and Kwiat (2018) F. Kaneda and P. G. Kwiat, arXiv:1803.04803 [quant-ph] (2018), arXiv: 1803.04803.
- Somaschi et al. (2016) N. Somaschi, V. Giesz, L. De Santis, J. C. Loredo, M. P. Almeida, G. Hornecker, S. L. Portalupi, T. Grange, C. Antón, J. Demory, C. Gómez, I. Sagnes, N. D. Lanzillotti-Kimura, A. Lemaítre, A. Auffeves, A. G. White, L. Lanco, and P. Senellart, Nature Photonics 10, 340 (2016).
- Wang et al. (2019) H. Wang, Y.-M. He, T.-H. Chung, H. Hu, Y. Yu, S. Chen, X. Ding, M.-C. Chen, J. Qin, X. Yang, R.-Z. Liu, Z.-C. Duan, J.-P. Li, S. Gerhardt, K. Winkler, J. Jurkat, L.-J. Wang, N. Gregersen, Y.-H. Huo, Q. Dai, S. Yu, S. Höfling, C.-Y. Lu, and J.-W. Pan, Nature Photonics , 1 (2019).
- Giesz et al. (2016) V. Giesz, N. Somaschi, G. Hornecker, T. Grange, B. Reznychenko, L. De Santis, J. Demory, C. Gomez, I. Sagnes, A. Lemaître, O. Krebs, N. D. Lanzillotti-Kimura, L. Lanco, A. Auffeves, and P. Senellart, Nature Communications 7, 11986 (2016).
- Loredo et al. (2016) J. C. Loredo, N. A. Zakaria, N. Somaschi, C. Anton, L. d. Santis, V. Giesz, T. Grange, M. A. Broome, O. Gazzano, G. Coppola, I. Sagnes, A. Lemaitre, A. Auffeves, P. Senellart, M. P. Almeida, and A. G. White, Optica 3, 433 (2016).
- Grange et al. (2017) T. Grange, N. Somaschi, C. Antón, L. De Santis, G. Coppola, V. Giesz, A. Lemaître, I. Sagnes, A. Auffèves, and P. Senellart, Phys. Rev. Lett. 118, 253602 (2017).
- Yoshie et al. (2004) T. Yoshie, A. Scherer, J. Hendrickson, G. Khitrova, H. M. Gibbs, G. Rupper, C. Ell, O. B. Shchekin, and D. G. Deppe, Nature 432, 200 (2004).
- Huber et al. (2017) D. Huber, M. Reindl, Y. Huo, H. Huang, J. S. Wildmann, O. G. Schmidt, A. Rastelli, and R. Trotta, Nature Communications 8, 15506 (2017).
- Schöll et al. (2019) E. Schöll, L. Hanschke, L. Schweickert, K. D. Zeuner, M. Reindl, S. F. C. da Silva, T. Lettner, R. Trotta, J. J. Finley, K. Müller, A. Rastelli, V. Zwiller, and K. D. Jöns, Nano Letters 19, 2404 (2019), arXiv: 1901.09721.
- Juska et al. (2013) G. Juska, V. Dimastrodonato, L. O. Mereni, A. Gocalinska, and E. Pelucchi, Nature Photonics 7, 527 (2013).
- Claudon et al. (2010) J. Claudon, J. Bleuse, N. S. Malik, M. Bazin, P. Jaffrennou, N. Gregersen, C. Sauvan, P. Lalanne, and J.-M. Gérard, Nature Photonics 4, 174 (2010).
- Zadeh et al. (2016) I. E. Zadeh, A. W. Elshaari, K. D. Jöns, A. Fognini, D. Dalacu, P. J. Poole, M. E. Reimer, and V. Zwiller, Nano Letters 16, 2289 (2016).
- Kirsanske et al. (2017) G. Kirsanske, H. Thyrrestrup, R. S. Daveau, C. L. Dreeßen, T. Pregnolato, L. Midolo, P. Tighineanu, A. Javadi, S. Stobbe, R. Schott, A. Ludwig, A. D. Wieck, S. I. Park, J. D. Song, A. V. Kuhlmann, I. Söllner, M. C. Löbl, R. J. Warburton, and P. Lodahl, Phys. Rev. B 96, 165306 (2017).
- Ding et al. (2016) X. Ding, Y. He, Z.-C. Duan, N. Gregersen, M.-C. Chen, S. Unsleber, S. Maier, C. Schneider, M. Kamp, S. Höfling, C.-Y. Lu, and J.-W. Pan, Phys. Rev. Lett. 116, 020401 (2016).
- Liu et al. (2018) F. Liu, A. J. Brash, J. O’Hara, L. M. P. P. Martins, C. L. Phillips, R. J. Coles, B. Royall, E. Clarke, C. Bentham, N. Prtljaga, I. E. Itskevich, L. R. Wilson, M. S. Skolnick, and A. M. Fox, Nature Nanotechnology 13, 835 (2018).
- Purcell et al. (1946) E. M. Purcell, H. C. Torrey, and R. V. Pound, Phys. Rev. 69, 37 (1946).
- Auffèves-Garnier et al. (2007) A. Auffèves-Garnier, C. Simon, J.-M. Gérard, and J.-P. Poizat, Phys. Rev. A 75, 053823 (2007).
- Grange et al. (2015) T. Grange, G. Hornecker, D. Hunger, J.-P. Poizat, J.-M. Gérard, P. Senellart, and A. Auffèves, Phys. Rev. Lett. 114, 193601 (2015).
- Iles-Smith et al. (2017) J. Iles-Smith, D. P. S. McCutcheon, A. Nazir, and J. Mørk, Nature Photonics 11, 521 (2017).
- Davanco et al. (2017) M. Davanco, J. Liu, L. Sapienza, C.-Z. Zhang, J. V. D. M. Cardoso, V. Verma, R. Mirin, S. W. Nam, L. Liu, and K. Srinivasan, Nature Communications 8, 889 (2017).
- He et al. (2017) Y.-M. He, J. Liu, S. Maier, M. Emmerling, S. Gerhardt, M. Davanço, K. Srinivasan, C. Schneider, and S. Höfling, Optica 4, 802 (2017).
- Schnauber et al. (2019) P. Schnauber, A. Singh, J. Schall, S. I. Park, J. D. Song, S. Rodt, K. Srinivasan, S. Reitzenstein, and M. Davanco, Nano Letters , acs.nanolett.9b02758 (2019).
- Liu et al. (2019) J. Liu, R. Su, Y. Wei, B. Yao, S. Covre da Silva, Y. Yu, J. Iles-Smith, K. Srinivasan, A. Rastelli, J. Li, and X. Wang, Nature Nanotechnology 14, 1 (2019).
- Dousse et al. (2008) A. Dousse, L. Lanco, J. Suffczynski, E. Semenova, A. Miard, A. Lemaître, I. Sagnes, C. Roblin, J. Bloch, and P. Senellart, Phys. Rev. Lett. 101, 267404 (2008).
- Ardelt et al. (2015) P.-L. Ardelt, T. Simmet, K. Müller, C. Dory, K. Fischer, A. Bechtold, A. Kleinkauf, H. Riedl, and J. Finley, Physical Review B 92 (2015), 10.1103/PhysRevB.92.115306.
- Hilaire et al. (2019) P. Hilaire, C. Millet, J. C. Loredo, C. Antón, A. Harouri, A. Lemaître, I. Sagnes, N. S. O. Krebs, P. Senellart, and L. Lanco, arXiv:1909.02440 [cond-mat, physics:quant-ph] (2019), arXiv: 1909.02440.
- Nowak et al. (2014) A. K. Nowak, S. L. Portalupi, V. Giesz, O. Gazzano, C. Dal Savio, P.-F. Braun, K. Karrai, C. Arnold, L. Lanco, I. Sagnes, A. Lemaître, and P. Senellart, Nature Communications 5, 3240 (2014).
- Bennett et al. (2010) A. J. Bennett, R. B. Patel, J. Skiba-Szymanska, C. A. Nicoll, I. Farrer, D. A. Ritchie, and A. J. Shields, Applied Physics Letters 97, 031104 (2010).
- Monniello et al. (2014) L. Monniello, A. Reigue, R. Hostein, A. Lemaitre, A. Martinez, R. Grousson, and V. Voliotis, Phys. Rev. B 90, 041303 (2014).
- He et al. (2013) Y.-M. He, Y. He, Y.-J. Wei, D. Wu, M. Atatüre, C. Schneider, S. Höfling, M. Kamp, C.-Y. Lu, and J.-W. Pan, Nature Nanotechnology 8, 213 (2013).
- Hilaire et al. (2018) P. Hilaire, C. Antón, C. Kessler, A. Lemaître, I. Sagnes, N. Somaschi, P. Senellart, and L. Lanco, Applied Physics Letters 112, 201101 (2018).
- Bayer et al. (2002) M. Bayer, G. Ortner, O. Stern, A. Kuther, A. A. Gorbunov, A. Forchel, P. Hawrylak, S. Fafard, K. Hinzer, T. L. Reinecke, S. N. Walck, J. P. Reithmaier, F. Klopf, and F. Schäfer, Phys. Rev. B 65, 195315 (2002).
- Bertlmann et al. (2006) R. A. Bertlmann, W. Grimus, and B. C. Hiesmayr, Physical Review A 73, 054101 (2006).
- Stievater et al. (2001) T. H. Stievater, X. Li, D. G. Steel, D. Gammon, D. S. Katzer, D. Park, C. Piermarocchi, and L. J. Sham, Physical review letters 87 13, 133603 (2001).
- Fischer et al. (2017) K. A. Fischer, L. Hanschke, J. Wierzbowski, T. Simmet, C. Dory, J. J. Finley, J. Vuckovic, and K. Müller, Nature Physics 13, 649 (2017).
- Loredo et al. (2019) J. C. Loredo, C. Antón, B. Reznychenko, P. Hilaire, A. Harouri, C. Millet, H. Ollivier, N. Somaschi, L. De Santis, A. Lemaître, I. Sagnes, L. Lanco, A. Auffèves, O. Krebs, and P. Senellart, Nature Photonics (2019), 10.1038/s41566-019-0506-3.
- (47) H. Ollivier et al., in preparation .
- Senellart et al. (2017) P. Senellart, G. Solomon, and A. White, Nature Nanotechnology 12, 1026 (2017).
- Trotta et al. (2015) R. Trotta, J. Martín-Sánchez, I. Daruka, C. Ortix, and A. Rastelli, Phys. Rev. Lett. 114, 150502 (2015).
- Weihs et al. (2012) G. Weihs, H. Jayakumar, A. Predojevic, T. Huber, T. Kauten, and G. Solomon (2012) pp. 674–675.
- Jöns et al. (2013) K. D. Jöns, P. Atkinson, M. Müller, M. Heldmaier, S. M. Ulrich, O. G. Schmidt, and P. Michler, Nano Letters 13, 126 (2013).
- Reimer et al. (2016) M. E. Reimer, G. Bulgarini, A. Fognini, R. W. Heeres, B. J. Witek, M. A. M. Versteegh, A. Rubino, T. Braun, M. Kamp, S. Höfling, D. Dalacu, J. Lapointe, P. J. Poole, and V. Zwiller, Phys. Rev. B 93, 195316 (2016).