REVERBERATION MEASUREMENTS OF THE INNER RADII OF THE DUST TORI IN QUASARS
Abstract
We present the results of a dust-reverberation survey of quasars at redshifts . We found a delayed response of the -band flux variation after the optical flux variation in 25 out of 31 targets, and obtained the lag time between them for 22 targets. Combined with the results for nearby Seyfert galaxies, we provide the largest homogeneous collection of -band dust-reverberation data for 36 type 1 active galactic nuclei (AGNs). This doubles the sample and includes the most distant AGN and the largest lag so far measured. We estimated the optical luminosity of the AGN component of each target using three different methods: spectral decomposition, the flux-variation-gradient method, and image decomposition. We found a strong correlation between the reverberation radius for the innermost dust torus and the optical luminosity over a range of approximately four orders of magnitude in luminosity, as is already known for Seyfert galaxies. We estimated the luminosity distances of the AGNs based on their dust-reverberation lags, and found that the data in the redshift–distance diagram are consistent with the current standard estimates of the cosmological parameters. We also present the radius–luminosity relations for isotropic luminosity indicators such as the hard X-ray (14–195 keV), [OIV] 25.89 m, and mid-infrared (12 m) continuum luminosities, which are applicable to obscured AGNs.
1 Introduction
A dust torus surrounding a supermassive black hole, an accretion disk, and a broad emission-line region (BLR) is an important structure in an active galactic nucleus (AGN). The dust torus is a potential gas reservoir for fueling mass to the accretion disk, where the enormous radiation energy of the AGN is produced. It is also a key structure in the unified scheme of AGNs, in which the diversity of type 1 and type 2 AGNs is explained by the viewing angle and obscuration by the dust torus (e.g., Antonucci, 1993). Dust in the torus is illuminated by the strong UV–optical continuum emission from the accretion disk, and it absorbs the radiation energy and then re-radiates it as thermal emission at infrared wavelengths. Since the dust temperature is limited by sublimation of the dust (at approximately – K for graphite grains: Huffman, 1977; Salpeter, 1977; Baskin & Laor, 2018), the hottest dust is thought to be located in the innermost dust torus, producing near-infrared thermal emission, and the size of the hot-dust region is expected to be correlated with the accretion-disk luminosity as , according to the radiation equilibrium of dust (Barvainis, 1987).
Dust-reverberation mapping of an AGN is an important tool for investigating the spatially unresolved structure of the innermost dust torus. It measures the time lag between a flux variation of the UV–optical continuum emission from the accretion disk and that of the near-infrared thermal emission from the innermost dust torus, which is interpreted as the light-travel time from the accretion disk to the dust torus. The radius of the innermost dust torus — or its more detailed geometrical structure — can be inferred from the time lag or the delayed response of the dust emission. Pioneering work has been performed on this topic since the 1970s (Penston et al., 1971; Lebofsky & Rieke, 1980; Clavel et al., 1989; Baribaud et al., 1992; Glass, 1992; Oknyanskii, 1993; Sitko et al., 1993; Oknyanskij et al., 1999; Nelson, 1996; Glass, 2004).
A systematic dust-reverberation survey for a number of type 1 AGNs has been performed by the Multicolor Active Galactic Nuclei (MAGNUM) project (Yoshii, 2002; Yoshii et al., 2003). It established observationally a radius–luminosity relation for the innermost dust torus based on 49 dust-reverberation lags observed in the band (m) for 17 nearby Seyfert galaxies (Minezaki et al., 2004; Suganuma et al., 2004, 2006; Koshida et al., 2014), demonstrated the accretion-disk component in the near-infrared emission and obtained the lag between the flux variations of the dust emission at different wavelengths (Minezaki et al., 2006; Tomita et al., 2006), and examined the long-term variation of the dust-reverberation lag for an AGN (Koshida et al., 2009, 2014). Recent dust-reverberation studies have also been conducted to make a progress in studying the geometry and structure around the central region of the dust torus (Soldi et al., 2008; Lira et al., 2011, 2015; Schnülle et al., 2013, 2015; Pozo Nuñez et al., 2014, 2015; Jun et al., 2015; Vazquez et al., 2015; Oknyansky et al., 2017, 2019; Mandal et al., 2018; Ramolla et al., 2018; Kokubo & Minezaki, 2019; Kynoch et al., 2019; Landt et al., 2019), and Lyu et al. (2019) very recently presented the results of a systematic dust-reverberation survey at longer wavelengths ( and m) for the Palomar–Green (PG) quasars (Schmidt & Green, 1983).
In addition, a possible application of dust reverberation to the distance measurements of AGNs was proposed at the end of the 20th century to investigate the cosmic expansion based on the radius–luminosity relation (Kobayashi et al., 1998b; Oknyanskij, 1999; Oknyanskij & Horne, 2001; Yoshii, 2002). The MAGNUM project was started in order to establish this dust-reverberation–distance method and thereby constrain the cosmological parameters. After the collection of a homogeneous set of dust-reverberation data for 17 Seyfert galaxies by the MAGNUM project, Yoshii et al. (2014) built a model for the radiation equilibrium of dust grains in the innermost dust torus to obtain the luminosity distances of AGNs without requiring any distance ladder. They estimated the Hubble constant from these data and found it to be in good agreement with the current standard estimates. Koshida et al. (2017) compared the distance calibration of Yoshii et al. (2014) to the distances of Type Ia supernovae that occurred in the AGN host galaxies and found that they are consistent. These results indicate that the distance indicator based on dust reverberation is a promising new tool for investigating the cosmic expansion. Now, large new dust-reverberation surveys have been started or been proposed (Hönig, 2014; Hönig et al., 2017).
In this study, we present the results of -band dust-reverberation observations for 31 quasars at redshifts performed by the MAGNUM project. We found delayed responses of the near-infrared flux variations for 25 targets and obtained dust-reverberation lags for 22 of them. They include the most distant AGN with a dust-reverberation lag and a luminous quasar with the largest lag measured so far in the band. We combined these data with the results for nearby Seyfert galaxies (Koshida et al., 2014) to examine the radius–luminosity relation for the innermost dust tori for Seyfert galaxies and quasars. We also estimated their luminosity distances based on the dust-reverberation lags in order to constrain the cosmic expansion. In Section 2, we describe the target AGNs and the procedures of observation, reduction, and photometry, and present the optical and near-infrared light curves. In Section 3, we measure the lag time between the optical and near-infrared flux variations. In Section 4, we estimate the optical luminosity of the AGN component and examine the radius–luminosity relation for the innermost dust torus. In Section 5, we calculate the dust-reverberation distance for the targets at and fit the diagram of redshift versus luminosity distance to the cosmological models. We summarize the results in Section 6. We assume a cosmology with km s-1 Mpc-1, , and (Spergel et al., 2007) throughout this paper, except in Section 5.
2 Observations and Photometry
2.1 Targets
In this paper, we report the results for type 1 AGNs monitored by the MAGNUM project. They include not only quasars but also less luminous type 1 AGNs. We limited the redshift to so that the thermal emission from the dust torus would be significant when it is observed in the near-infrared band. The targets and their basic parameters are listed in Table 1. Based on target visibility and the presence of moderately bright stars within the field of view of the camera to serve as photometric references, we selected type 1 AGNs from the Early Data Release (EDR) catalog of the Sloan Digital Sky Survey (SDSS, Stoughton et al., 2002), the 2-degree Field (2dF) QSO Redshift Survey (2QZ, Croom et al., 2001), the Large Bright Quasar Survey (LBQS, Hewett et al., 1995), and the ninth edition of the Catalog of Quasars and Active Nuclei by Veron-Cetty and Veron (VV9, Veron-Cetty & Veron, 2000) 111No radio-loud quasar was selected from the VV9 catalog because it is possible for a nonthermal variable flux component in the near-infrared to be present in addition to the thermal emission from the dust torus in radio-loud quasars (e.g., McHardy et al., 1999, 2007; Enya et al., 2002).. In addition, we selected three of the PG quasars, for which the broad emission-line (BEL) lag has been measured by reverberation-mapping observations (Kaspi et al., 2000).
2.2 Observations
We conducted monitoring observations using a multicolor imaging photometer (MIP) mounted on the MAGNUM 2 m telescope at the Haleakala Observatories in Hawaii (Kobayashi et al., 1998a). The MIP is capable of simultaneous imaging in one optical band (selected from among , , , , and ) and one near-infrared band (selected from among , , , and ) by splitting the incident beam into two different detectors. We employed an SITe CCD ( pixels) and an SBRC InSb array ( pixels), respectively, as the optical and infrared detectors. The MIP field of view was arcmin2.
In order to measure the dust-reverberation lag, we monitored the targets most frequently in the band and one optical band. We selected the latter from among the , , and bands, depending on the target redshift, so that the rest-frame wavelength of the observing band was close to the band. We monitored the targets less frequently in the next bluer optical bands that we used to decompose the AGN and host-galaxy fluxes (see Section 4.1). We started regular monitoring observations in 2001–2003 and finished them in 2007. We planned to monitor the less luminous targets more frequently, because both the timescale of the flux variation and the dust-reverberation lag are expected to be shorter for such targets. The observational parameters for these sources are also listed in Table 1.
2.3 Reduction and Photometry
We reduced the images using IRAF.222 IRAF is distributed by the National Optical Astronomy Observatories, which are operated by the Association of Universities for Research in Astronomy, Inc., under cooperative agreement with the National Science Foundation. We followed the standard procedures for image reduction, such as correction for bias or sky subtraction and flat-fielding.
For the 28 targets selected from the SDSS EDR, the 2QZ, the LBQS, and the VV9, we observed the target AGN and the nearby field stars within the field of view simultaneously. We then measured the target flux with respect to the field stars using aperture photometry with a circular aperture of arcsec diameter and a sky reference area of – arcsec annulus.
On the other hand, we found no suitable stars to serve as photometric references within the fields of view around the target PG quasars. We therefore observed the target and reference stars outside the field of view alternately, and we measured the target flux with respect to those reference stars, as has been done for nearby Seyfert galaxies (Koshida et al., 2014). We used a larger circular aperture of arcsec diameter for those targets, because the target and the reference star were not observed simultaneously, and the point-spread functions (PSFs) for their images were possibly slightly different.
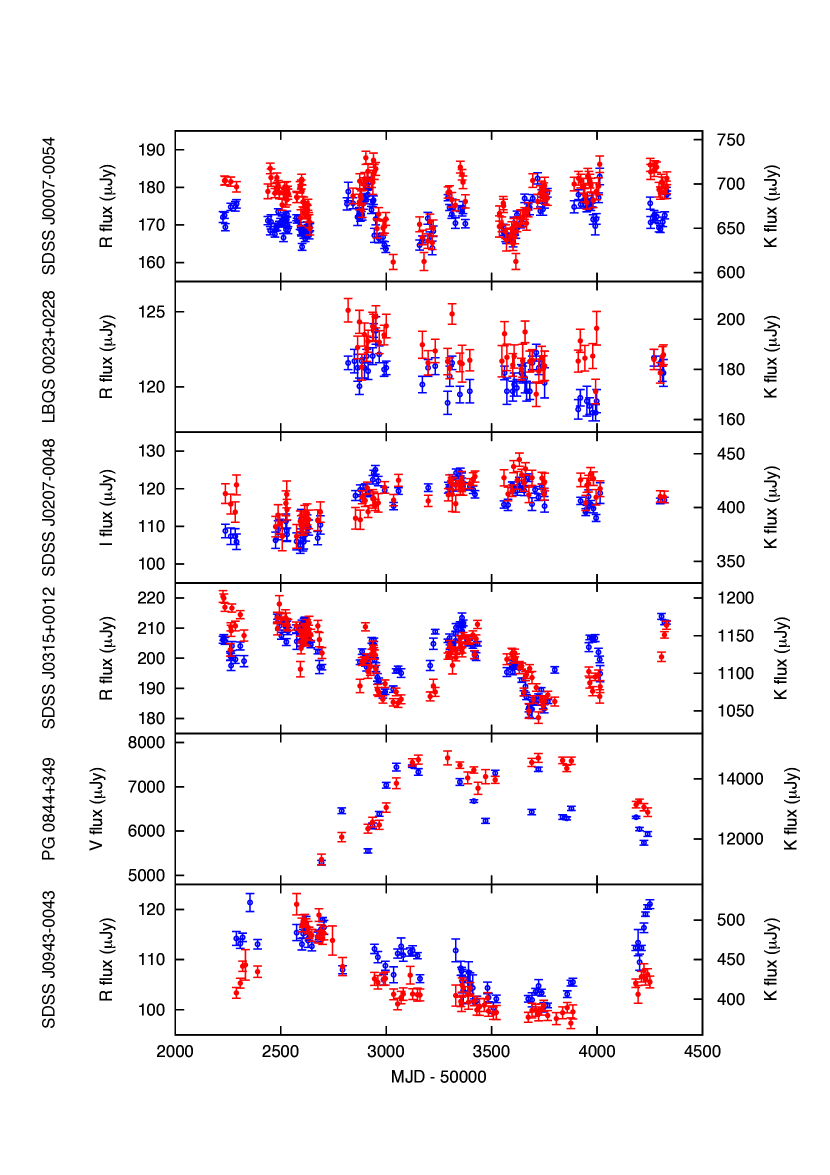
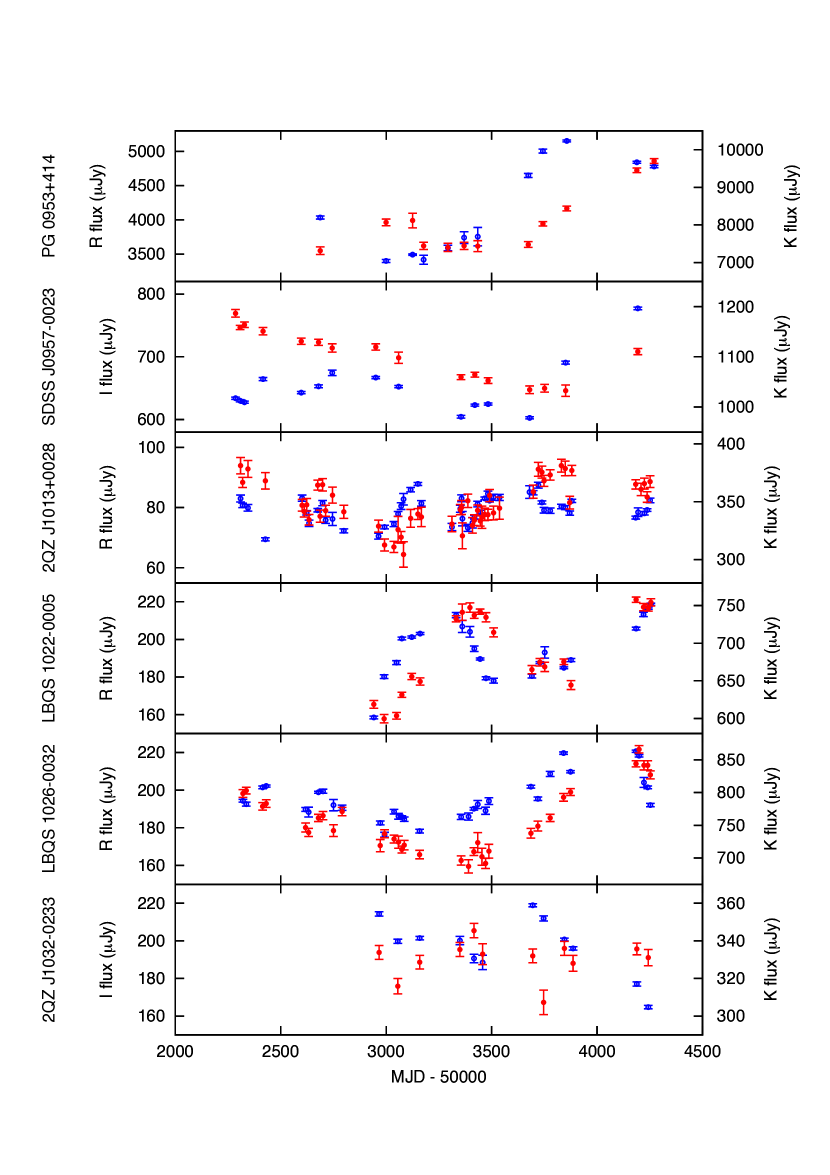
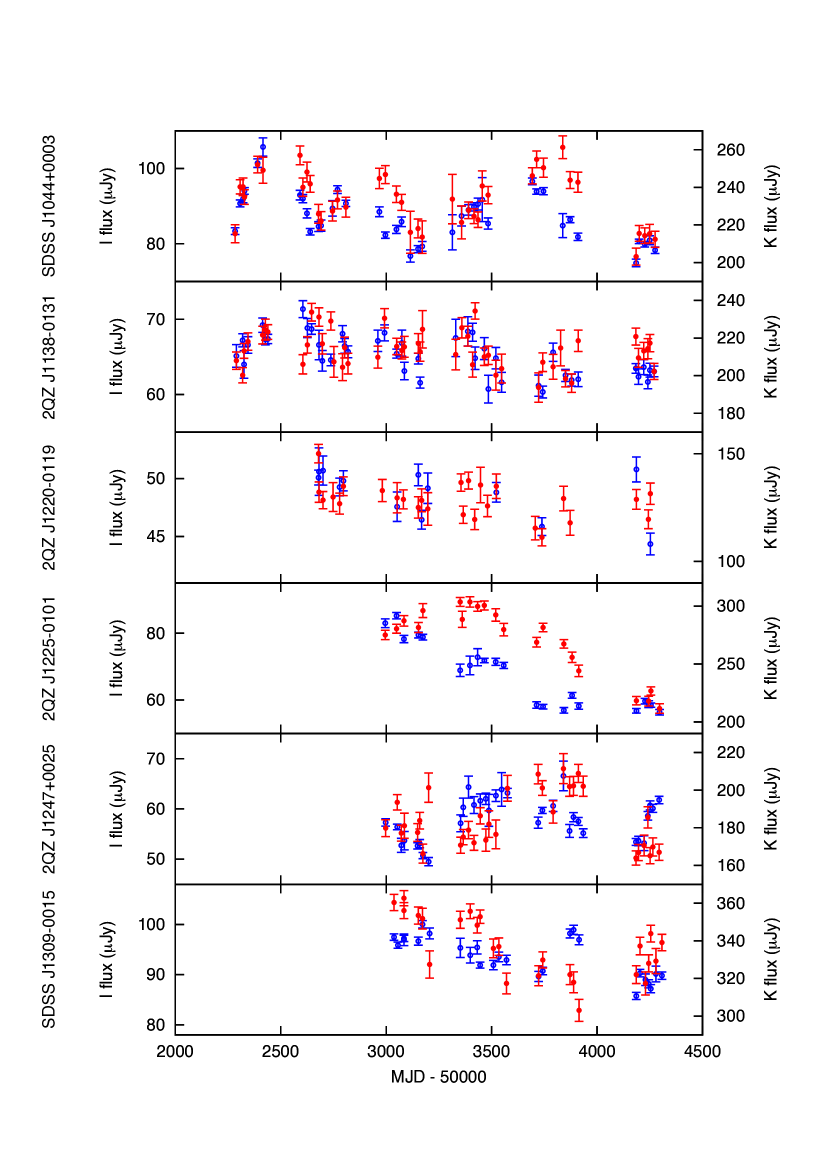
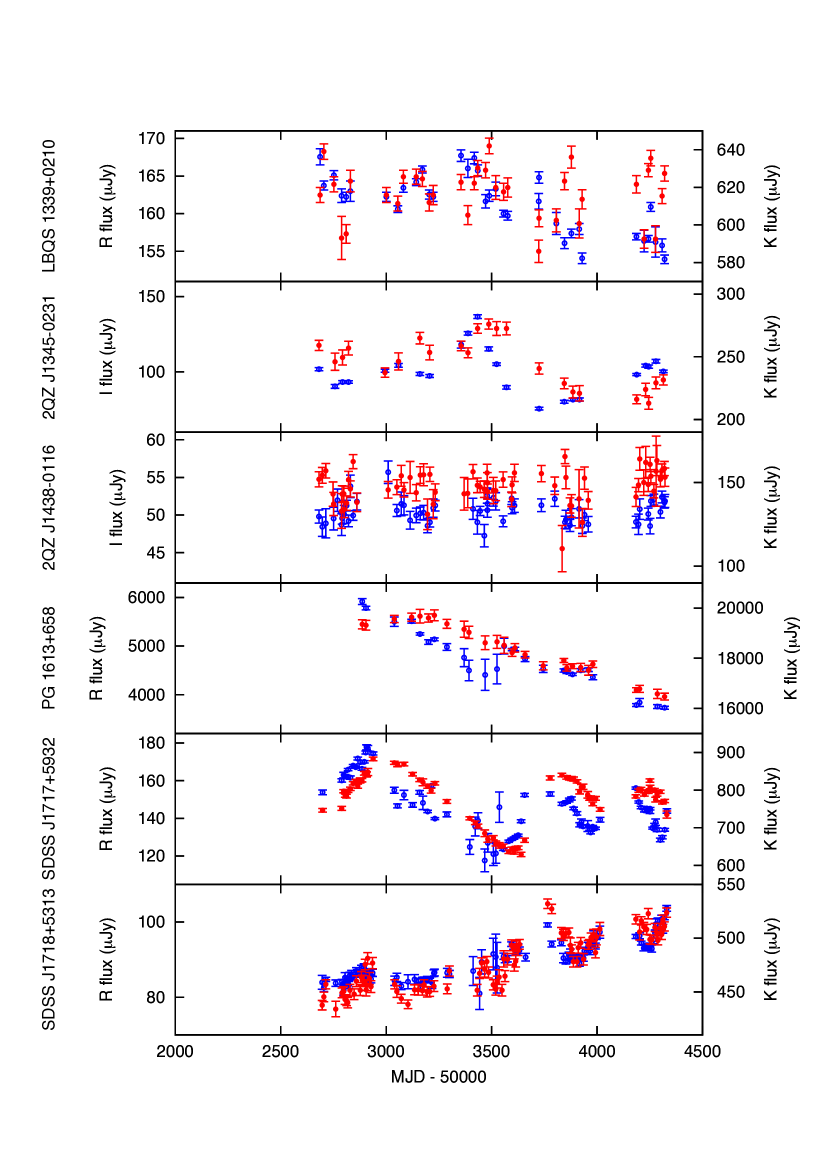
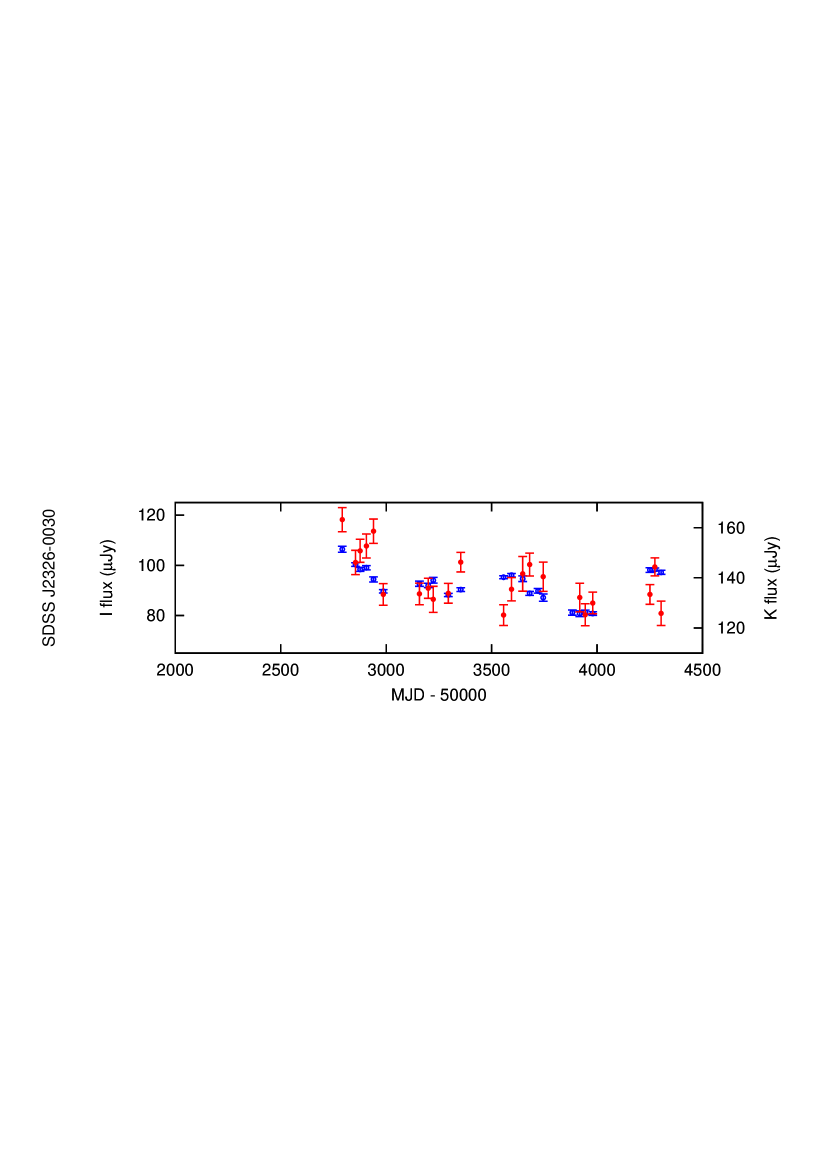
We calibrated the fluxes for the reference stars with respect to the photometric standard stars of Landolt (1992) and Hunt et al. (1998) for the and bands, respectively. Finally, we corrected for Galactic extinction using the NASA/IPAC Extragalactic Database (NED; based on Schlafly & Finkbeiner, 2011). The light curves of the 31 target AGNs are presented in Figure 1, and the corresponding data are listed in Table 2.
3 dust-reverberation analysis
As shown in Figure 1, most targets showed a delayed response of the -band flux variation after the optical flux variation, which indicates the reverberation of the thermal emission from the dust tori in quasars. We estimate the lag time between the optical and -band flux variations as described below for the targets that showed apparent delayed -band responses. In this study, we estimated the lag time for each target during the whole monitoring period and did not examine the time variation of the dust-reverberation lag in a target, because many luminous targets showed relatively slow flux variations.
3.1 Accretion-disk Component in the K-band Fluxes
In addition to the thermal emission from the dust torus, the continuum emission from the accretion disk is thought to contribute to the near-infrared flux of a type 1 AGN. Contamination by the accretion-disk component makes the lag between the optical and near-infrared flux variations more or less shorter than the actual lag of the dust-torus emission response (e.g., Minezaki et al., 2006; Tomita et al., 2006; Lira et al., 2011; Koshida et al., 2014), because the near-infrared flux variation from the accretion disk is almost synchronous with its optical flux variation. Since the contribution from the accretion-disk component becomes larger at shorter wavelengths, possible bias in the measurement of the dust-reverberation lag is more serious for the quasars at larger redshifts.
We assumed that the continuum emission of the accretion disk has a power-law spectrum and the flux changes simultaneously at all wavelengths. Then, the near-infrared fluxes of the accretion-disk component can be estimated as
| (1) |
where represents the optical observing band for each target. We subtracted from the -band fluxes in the procedure for measuring the dust-reverberation lag, as described in the next subsection.
We adopted the power-law index following Yoshii et al. (2014), based on the cross multiple-regression analysis of the - and -band flux variations of local Seyfert 1 galaxies (; Tomita, 2005; Tomita et al., 2006). We also estimated the dust-reverberation lags assuming and , as had been done by Koshida et al. (2014), to examine possible systematic differences depending on . We note that is the power-law index of the standard accretion-disk model (Shakura & Sunyaev, 1973) in the long-wavelength limit.
3.2 Measuring the Dust-reverberation Lag
We measured the dust-reverberation lag using the JAVELIN software (Zu et al., 2011), which has been widely used in recent reverberation studies. It has the advantage that uncertainties in the interpolation of the light-curve data can be estimated self-consistently in a statistical model of the variability. It adopts a damped random-walk model for flux variations of the source emission; this is considered to be a good approximation for the flux variations of the UV–optical continuum emission of type 1 AGNs (e.g., Kelly et al., 2009; Kozłowski et al., 2010; MacLeod et al., 2010, 2012; Zu et al., 2013). It assumes a top-hat transfer function in the transfer equation of the reverberation model, and it fits the source and response light-curve data using the Markov Chain Monte Carlo method to obtain the likelihood distribution for the lag time as well as those for the other parameters of the reverberation model. Recent enhancements of the capability of photometric reverberation mapping for the broad emission lines (Zu et al., 2016) enabled us to fit the data for the -band flux variation with the delayed response of the dust-torus emission superimposed with , which is proportional to (and thus synchronous with) the optical flux variation (Kokubo & Minezaki, 2019). We fixed the proportionality factor as determined by Equation 1 with .
We determined the best estimate and the errors for the dust-reverberation lag from the median, 15.9th percentile, and 84.1th percentile of the likelihood distribution for the lag time that was located around the peak of the cross-correlation function (CCF) of the optical and near-infrared flux variations. When the multiple peaks in the likelihood distribution are found around the CCF peak, we calculated the best estimate of the lag by the averaging the lags of the 15.9th and 84.1th percentiles. We estimated the CCF by using the PYCCF software (Sun et al., 2018), which calculates the interpolation CCF (ICCF; e.g., Peterson et al., 1998). We subtracted the accretion-disk component that we estimated from the optical flux assuming from the -band flux before calculating the CCF.
3.3 Results
Figure 7 shows the likelihood distributions of the dust-reverberation lag obtained by JAVELIN overlaid on the CCFs for the 25 targets for which we found delayed responses of the -band flux variation. We succeeded in obtaining the lag times for 22 targets. They include the most distant quasar with a dust-reverberation lag measured so far (), and the lag times include the largest dust-reverberation lag in the band ever obtained ( yr in the observer frame). Combined with the results on 17 Seyfert galaxies from Koshida et al. (2014), we here provide the largest homogeneous collection of -band dust-reverberation data for AGNs, which has more than double the number of targets. The lag times and their errors are listed in Table 3.
In addition, we estimated a lower limit to the dust-reverberation lag and the uncertain lags for the remaining three targets with apparent delayed responses in the band. In the former case (2QZ J12250101), the CCF showed a very broad plateau at the lag time of – days, but the number of the photometric data points in the overlapping time span of the lag-shifted optical and -band light curves became so small at large lags that the significance of the cross-correlation may be suspect, even within the CCF plateau. Since it was difficult to select one of the multiple peaks in the likelihood distribution obtained by JAVELIN in the range of the CCF plateau, we estimated the 0.135 percentile of the likelihood distribution as the lower limit of the dust-reverberation lag, and listed this in Table 3. In the latter cases (PG 0844349 and 2QZ J10130028), the CCFs showed bimodal distributions, and it was uncertain which peak was significant. For reference, the lag times and their errors estimated from the JAVELIN likelihood distributions associated with the shorter lag in the CCF are also listed in Table 3.
Unfortunately, we found no delayed response in the -band light curves for six targets. For three targets (LBQS 00230228, 2QZ J12200119, and 2QZ J14380116), the amplitudes of possible optical flux variations were small while errors in the -band photometries were apparently large. It was therefore unclear whether there was any delayed response. For two targets (2QZ J10320233, LBQS 1339+0210), the -band fluxes did not change gradually with time but were spread by more than the estimated photometric errors. This made us suspect unaccounted systematic errors in the -band photometries, and may be responsible for the lack of apparent delayed response. For the last target (IRAS F21256+0219), the -band fluxes were fairly stable with time while the amplitude of the flux variation in the optical bands seemed to be small and not well sampled, which would lead to no detection of a delayed response. From these considerations, we consider dust reverberation to be ubiquitous, not only for Seyfert galaxies but also for quasars.
In the last part of this section, we examine possible uncertainties in the dust-reverberation lag due to the accretion-disk component in the -band flux. Figure 11 shows a comparison of the estimated lag times assuming and . We found that the lag times assuming tended to be larger than those assuming , as expected (contamination by the accretion-disk component in the -band flux is larger for smaller ). However, the difference was small, and in many cases the results were almost identical. The average difference was approximately dex, which is consistent with a similar study that estimated the dust-reverberation lags for Seyfert galaxies (Koshida et al., 2014).
3.4 Redshift Correction for the Dust-reverberation Lag
We corrected the observed lag times for possible systematic changes in the dust-reverberation lag depending on redshift in order to compare them to those of AGNs in the local universe. One obvious source is cosmological time dilation, for which the observed time lag is corrected by multiplying by a factor of .
Another factor is the wavelength dependence of the dust-reverberation lag. Since we observed the flux variation of thermal dust emission in the band, the rest-frame wavelength of the observed dust emission becomes shorter at larger redshifts. A radiation-equilibrium model of a dust grain directly illuminated by the accretion disk predicts , where is the temperature of the dust grain and is the distance from the accretion disk (Barvainis, 1987). Assuming that the near-infrared emission of the dust torus at wavelength is dominated by the thermal emission from dust at temperature that peaks at , the wavelength dependence of the dust-reverberation lag is predicted to vary as (Sitko et al., 1993; Oknyanskij & Horne, 2001). This leads to a correction factor of , opposite to that for cosmological time dilation.
However, much smaller differences in the dust-reverberation lag at different wavelengths have been reported for multi-wavelength dust reverberation. Significant, but small differences were found in some AGNs (Tomita, 2005; Tomita et al., 2006; Lira et al., 2011; Jun et al., 2015; Vazquez et al., 2015; Lyu et al., 2019),333 Lyu et al. (2019) reported the ratios of the dust-reverberation radii in , , m as approximately 0.6:1:1.2 by comparing their results with those in the band of Koshida et al. (2014). When the -band radius–luminosity relation for the optical luminosity of Equation 4 in this paper is converted to that for the bolometric luminosity using Equation 14 of Lyu et al. (2019), the ratio of the dust-reverberation radii in and m is estimated at approximately 0.8:1 by comparing it with their result for m. and no significant difference was found in some other AGNs (Lira et al., 2015; Pozo Nuñez et al., 2015; Schnülle et al., 2015; Ramolla et al., 2018; Oknyansky et al., 2019). In some studies, small differences between lag times for different near-infrared bands were found, although it may be difficult to attribute the observed differences in lag times conclusively to the wavelength dependence of the dust-reverberation lag, because the accretion-disk component had not been subtracted from the near-infrared fluxes (Clavel et al., 1989; Sitko et al., 1993; Glass, 2004; Soldi et al., 2008; Pozo Nuñez et al., 2014; Oknyansky et al., 2015, 2017; Mandal et al., 2018).
In this study, we followed Yoshii et al. (2014) and formulated the correction factor empirically by fitting a function of redshift to the result of a cross multiple-regression analysis (Tomita et al., 2006) applied to the multi-wavelength flux variations for six nearby Seyfert galaxies obtained by the MAGNUM project (Tomita, 2005). They found that on average the difference in lag times between the - and -band flux variations of the dust-torus emission was approximately 0.3 times the -band dust-reverberation lag. Instead of the linear interpolation adopted by Yoshii et al. (2014), we used the factor for the correction and obtained . By combining this with the correction factor for cosmological time dilation, we obtained the total correction factor . The redshift-corrected lag times are also listed in Table 3.
4 Radius–Luminosity Relation for the Dust Torus
Here we present dust-reverberation lags for 22 luminous type 1 AGNs, including quasars. Combined with the results for local Seyfert galaxies from Koshida et al. (2014), the MAGNUM project thus provides the largest homogeneous collection of -band dust-reverberation data, which have been analyzed carefully and uniformly to obtain precise estimates of the lag times. Using these results, we examined the correlation between the dust-reverberation radius and the optical luminosity over ranges extending to larger radii and larger luminosities than those presented in previous studies (Suganuma et al., 2006; Koshida et al., 2014). We also use the new data to update the correlation with the isotropic luminosity indicators for AGNs, which will be useful for studies of the structure in obscured AGNs (e.g., Minezaki & Matsushita, 2015).
4.1 Decomposition into the AGN and Host-galaxy Fluxes
The flux obtained by aperture photometry contains a significant contribution from the host-galaxy starlight. We subtracted this from the optical flux averaged over the monitoring period to obtain the flux from the AGN accretion disk. We applied three methods to the targets for the decomposition of the optical flux: spectral decomposition, the flux-variation-gradient method, and image decomposition. In all three methods, we corrected properly for Galactic extinction.
4.1.1 Spectral Decomposition by QSFit
We applied a spectral decomposition method to the targets for which spectra were available in the tenth Data Release of the SDSS (SDSS DR10; Ahn et al., 2014) by using the Quasar Spectral Fitting package (QSFit) software (Calderone et al., 2017)444 http://qsfit.inaf.it/ . QSFit fits the AGN optical spectrum with a combination of an AGN power-law continuum, the host-galaxy spectrum, the Balmer continuum, and the emission lines that include the blended iron complex. It fixes the power-law index at in the redshift range of our targets (), and uses a simulated 5 Gyr old elliptical galaxy template from the SWIRE template library555 http://www.iasf-milano.inaf.it/p̃olletta/templates/swire_templates.html (Silva et al., 1998; Polletta et al., 2007) as the host-galaxy spectrum. We subtracted the AGN power-law continuum calculated by QSFit from the SDSS DR10 spectrum and then integrated the residual spectrum with the response function of the observing band to estimate the host-galaxy flux. We transferred the observational errors in the SDSS DR10 spectrum data and the QSFit fitting error in the scaling factor of the power-law continuum to the error of the host-galaxy flux.
We took the fitted parameters from the catalog of spectral properties of type 1 AGNs (the QSFit catalog; Calderone et al., 2017)666 http://qsfit.inaf.it/cat_1.24/ for 12 targets that had already been processed with QSFit, and we processed another five targets with QSFit ourselves. The estimated host-galaxy fluxes and their errors are listed in Table 4. We did not apply QSFit to the remaining 14 targets, either because no SDSS DR10 spectra were available or because the fraction of “good” mask flags in the SDSS DR10 spectra was so small that QSFit did not function.
4.1.2 Decomposition by Flux Variation Gradient
The multi-epoch flux data in two different optical bands obtained on the same night are known to show a tight linear correlation when they are plotted on a diagram of the flux in one band versus the flux in the other. This indicates that the optical continuum flux consists of a variable AGN flux with a constant spectral shape and a non-variable flux component due to the host galaxy (e.g., Choloniewski, 1981; Winkler et al., 1992; Winkler, 1997; Sakata et al., 2010). Indeed, Sakata et al. (2010) estimated the host-galaxy flux using the image-decomposition method applied to high-angular-resolution images of local type 1 AGNs and demonstrated that the non-variable component of the host-galaxy flux with some contribution from narrow emission lines is approximately located on a fainter extension of the linear regression line from the multi-epoch flux data in the flux-to-flux diagram.
The host-galaxy flux in the aperture can thus be estimated from the intersection of the linear regression line from the multi-epoch flux data and a straight line from the origin, the gradient of which corresponds to the color of the host galaxy, as illustrated by Winkler et al. (1992). We applied this flux-variation-gradient (FVG) method to our data as a second method for estimating the host-galaxy fluxes in the targets. We used the SWIRE 5 Gyr old elliptical template at the target redshift, which is adopted in QSFit, to calculate the flux ratio between the two different bands for the host-galaxy starlight, which is the gradient of the straight line from the origin. We estimated the error from the intersection of the straight line from the origin and the envelope of the linear regression of the multi-epoch flux data.
We obtained the host-galaxy fluxes for 25 targets by using the FVG method. The estimated host-galaxy fluxes and their errors are listed in Table 4. We did not obtain the host-galaxy fluxes for the remaining six targets either because insufficient data points of multi-epoch flux data had been obtained simultaneously in the two different bands or because the flux variations in the optical band had small amplitudes.
4.1.3 Image Decomposition Using Hubble Space Telescope (HST) Images
We applied an image-decomposition method to four targets for which high-angular-resolution images were available in the Hubble Space Telescope (HST) archive. The PG quasars among our targets were observed with the High Resolution Channel of the Advanced Camera for Surveys (ACS/HRC) in the F550M band (Proposal IDs 9851 and 10833, PI Bradley Peterson), and SDSS J17175932 was observed with the Wide Field Channel of the ACS (ACS/WFC) in the F814W band (Proposal ID 9753, PI L. Storrie-Lombardi). Since Sakata et al. (2010) estimated the host-galaxy flux of PG 0844349 in the optical band by the image-decomposition method using the same data, we adopted their estimate of the -band host-galaxy flux, with the additional component of the narrow emission lines just being corrected for the difference in the assumed Galactic extinction.
First we used the two-dimensional image-decomposition program GALFIT (Peng et al., 2002) to fit the HST image of the target with the components of a PSF for the AGN nucleus, the host galaxy, the field galaxies and stars if required, and the background-sky contribution. We generated the PSF image using the Tiny Tim package (Krist, 1995) version 7.5, which models the HST optics and the installed cameras, and we modeled the AGN nucleus and the field stars with a Gaussian profile for which the full width at half maximum was adjusted to give the best fit around the AGN nucleus and the field stars.
Next, we applied aperture photometry using the same size of aperture and sky annulus as for the nucleus-free target image that is made by subtracting the best-fit PSF component from the HST image of the target. We analyzed all the unsaturated exposures in the archive independently to obtain the host-galaxy flux, and we calculated the ensemble standard deviations as the errors for PG 0953414 and PG 1613658. However, there was only one exposure in the archive for SDSS J17175932, so we calculated the error of the host-galaxy flux using IRAF, based on background fluctuations and photon noise.
Finally, we converted the resulting host-galaxy fluxes in the HST bands to those for the optical band used for the monitoring observations. For PG 0953414 and PG 1613658, we converted the flux in the F550M band to that in the band based on the SWIRE 5 Gyr old elliptical template at the target redshift. For SDSS J17175932, we first converted the flux in the F814W band to that in the band and then converted it to that in the band based on linear regression of the multi-epoch flux data in the and bands. The estimated host-galaxy fluxes and their errors are listed in Table 4.
4.1.4 Adopted Host-galaxy Fluxes
We examined the three methods for estimating the host-galaxy fluxes by comparing the resulting host-galaxy fluxes for the same target obtained by two different methods.
There were four targets for which the host-galaxy fluxes were obtained both by the FVG method and by the image-decomposition method. The estimates of both methods were consistent to within the errors for three targets: PG 0844349, PG 0953414, and SDSS J17175932. For PG 1613658, the FVG method estimated a slightly negative value for the host-galaxy flux, which is unphysical.
There were 15 targets for which the host-galaxy fluxes were obtained both by the FVG method and by the spectral decomposition method. For three of these targets, the estimates by the FVG method showed a negative value or exceeded the minimum fluxes during the monitoring observations. Except for these unphysical estimates by the FVG method, we compared those two methods for the remaining 12 targets, as presented in Figure 12. We found that the estimates by both methods were usually consistent to within the errors, although the FVG estimates generally have larger errors. In addition, the FVG estimates seemed to be systematically larger than those obtained by the spectral decomposition method. They differed by a factor of , based on the linear regression analysis. We note here that the spectroscopic aperture for the SDSS spectra of those targets was arcsec in diameter, which is slightly smaller than the photometric aperture of this study, so we suspect that the host-galaxy fluxes based on the SDSS DR10 spectra may be slightly underestimated.
From these considerations, we adopted the host-galaxy fluxes based on the spectral decomposition method (17 targets) and the image-decomposition method (five targets) when these estimates were available. We consider the factor of as a correction factor for the possible aperture loss, and we increased the host-galaxy fluxes from the spectral decomposition method by that factor777 Since the host-galaxy flux for SDSS J17185313 by the spectral decomposition method was very close to the minimum flux during the monitoring observation, the aperture correction was ignored. . We incorporated the uncertainty in the correction factor into the errors of the host-galaxy fluxes by root-sum-square. We adopted the host-galaxy fluxes obtained from the FVG method for the six targets for which they were the only estimates available. We found the value of the best estimate with the lower 1 error subtracted to be negative for three of these targets, and we replaced the lower 1 error by the best estimate itself for them. We did not estimate the host-galaxy fluxes for the remaining four targets, for which we did not obtain a dust-reverberation lag. The adopted host-galaxy fluxes and their errors are also listed in Table 4.
4.2 Optical Luminosities of the Targets
We obtained the representative optical fluxes of the targets during the monitoring period as follows. First, we linearly interpolated and regularly resampled the light curve. Then we averaged the resampled fluxes in order to avoid a possible bias caused by the uneven sampling of the observations. Finally, we subtracted the host-galaxy flux from the average of the resampled fluxes to obtain the representative flux of the target. In the case of SDSS J17206128, the emission in the rest-frame band is in fact closer to that in the observer-frame band, although the monitoring observations for the dust reverberation were conducted in the band (owing to a mistake in the filter selection at the start of observation). We therefore converted the -band AGN flux into an -band flux based on the slope of the linear regression of the multi-epoch flux data in the and bands.
We estimated the -band luminosity of the target from the representative optical flux and the luminosity distance calculated from the target redshift. We used the local flow-corrected redshift of the Virgo infall Great Attractor Shapley supercluster obtained from the NED for the calculation of luminosity-distance, but this correction was very small at large redshifts. We corrected the remaining difference in the rest-frame wavelength of the observing band from the band by assuming a power-law spectrum with for the AGN continuum emission, as assumed in QSFit. The optical fluxes and luminosities of the targets are listed in Table 5.
4.3 Correlation with the Optical Luminosity
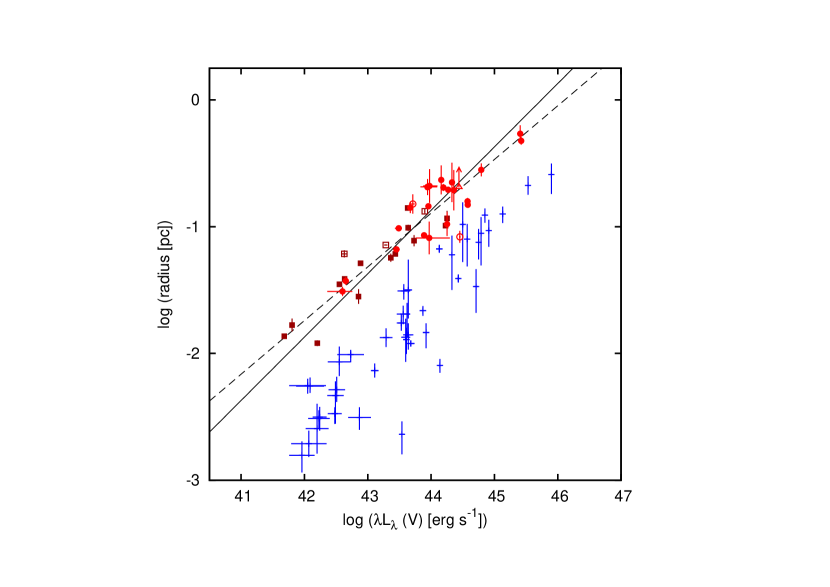
In Figure 13, we plot the dust-reverberation radius obtained by the MAGNUM project against the -band luminosity, together with the reverberation radius of the BLR for comparison. For the dust-reverberation lags of the Seyfert galaxies presented in Koshida et al. (2014), we adopted the lag times estimated by JAVELIN — instead of using the CCF analysis — in accordance with this work, and calculated the lag times for (where is the assumed power-law index of the accretion-disk emission in optical and near-infrared wavelengths) by interpolating the data for and . We recalculated their -band luminosities by updating the Galactic extinction. The recalculated dust-reverberation lags and the luminosities of the Seyfert galaxies from Koshida et al. (2014) are listed in Table 6. We obtained the data for the BLR from the reverberation lags of the Balmer emission lines (mostly H) compiled by Bentz et al. (2013), who carefully estimated the optical luminosities of their targets using the image-decomposition method with the HST images.
As shown in Figure 13, we found the radius of the innermost dust torus inferred from the dust reverberation to be strongly correlated with the optical luminosity for both Seyfert galaxies and quasars, and there appears to be no offset nor break between the radius–luminosity relation for the Seyfert galaxies and that for the quasars. The luminosity range of the sample was about four orders of magnitude, which is about 1.5 orders of magnitude more luminous in extent than our previous result (Koshida et al., 2014). As has been reported for the local Seyfert galaxies (Suganuma et al., 2006; Koshida et al., 2014), we again found the dust-reverberation radius to be located just outside the reverberation radius of the BLR for the quasars as well. This suggests that the BLR is restricted inside the boundary of the dust torus, as expected from the unified scheme of AGNs, for all luminosity ranges of Seyfert galaxies and quasars.
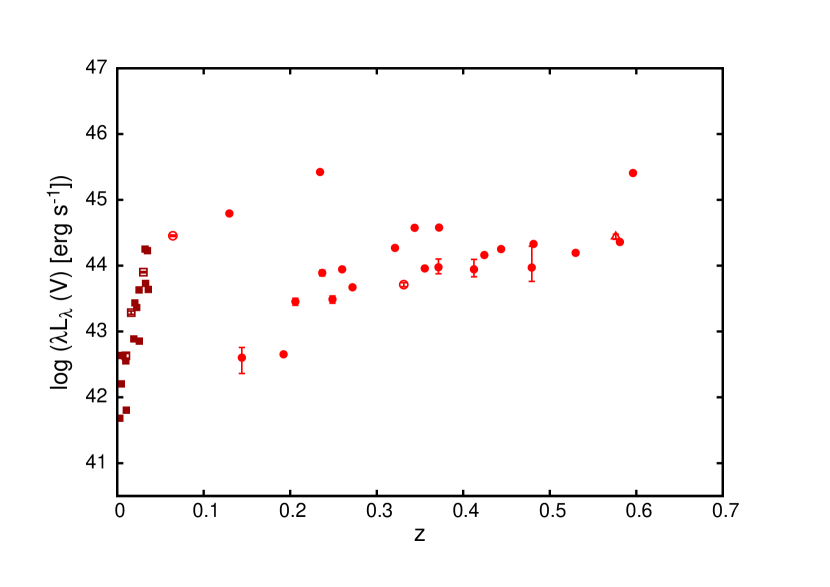
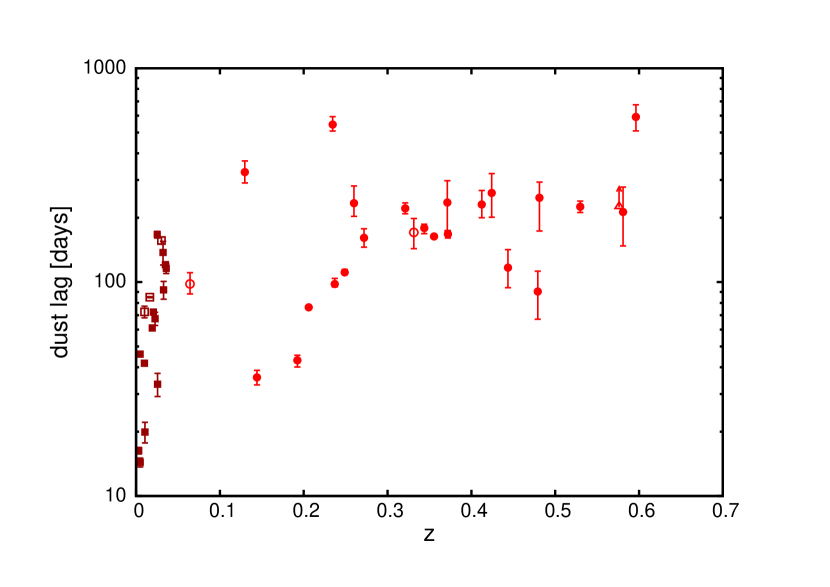
In Figure 14, we plot the dust-reverberation lag and the -band luminosity of the targets against their redshifts. The Seyfert galaxies included among the targets for this study are distributed at redshifts –, and their dust-reverberation lags and luminosities are located in the middle of the dust-reverberation radius–luminosity relation for the local Seyfert galaxies. In addition, the most luminous targets are located at redshifts and , and their dust-reverberation lags and luminosities are very close to each other. These results suggest that the redshift correction for the dust-reverberation lags and the decomposition of the optical AGN fluxes were processed reasonably well. On the other hand, we found that the targets located at redshifts with luminosities erg s-1 often had large errors in the measured lag times. Since they are faint among the targets, the photometric errors (especially in the band) were relatively large. Then, the errors in the measured lag times would be large unless the amplitude of the flux variations were significantly large.
We then applied regression analysis to the radius–luminosity relation for the innermost dust torus. The dust-reverberation lags and the luminosities of the Seyfert galaxies and quasars were fitted by the linear equation
| (2) |
We ignored the data for the three targets for which the lag times were a lower limit or uncertain (the open triangle and circles in Figure 13), and we also ignored the data for the three Seyfert galaxies for which the lag times estimated by JAVELIN were different from those estimated by the CCF analysis by a factor of or larger (the open boxes in Figure 13). As a result, we used the data for 36 AGNs (22 quasars and 14 Seyfert galaxies) for the regression analysis. As shown in Figure 13, more than half of the ignored targets were in fact consistent with the radius–luminosity relation for the 36 selected targets. In addition, although the dust-reverberation radius of PG 0844349 inferred from the lag time associated with the peak with the shorter lag in the CCF was significantly small, that for the peak with the longer lag in the CCF was consistent with the radius–luminosity relation for the 36 selected targets.
Although the errors in the optical luminosities in Table 5 were sometimes estimated to have very small values ( dex), they are unreasonable because possible errors caused by the uncertainties in the fitting methods — such as the spectra of the AGN and the host galaxy, etc. — were not incorporated. Therefore, we added a moderate fractional error (10%, dex) to the error in the optical luminosity by root-sum-square. In addition, we incorporated the peculiar velocity dispersion km s-1 into the luminosity error, as has been done by Koshida et al. (2014). We then fitted Equation 2 to the data, adding an error to the error of the dust-reverberation radius by root-sum-square, so that the reduced reached unity. We adjusted the value of so that the errors of and approximately did not correlate with each other. For calculation of the regression, we used the Marquardt method for the most generalized multivariate least-squares process incorporating normally distributed errors in all variables without any approximations provided by Jefferys (1980, 1981).
The best-fit regression lines are presented in Figure 13, and the resultant parameters are listed in Table 7. The best-fit linear regression with the slope fixed at , which is expected from the radiation equilibrium of dust (Barvainis, 1987), is
| (3) |
This is consistent with the result for the Seyfert galaxies presented in Koshida et al. (2014), as no offset nor break is found between the radius–luminosity relation for the Seyfert galaxies and that for the quasars.
When the slope is set as a free parameter, the best-fit linear regression is
| (4) |
In addition to the primary method for the regression analysis, we calculated the regression using two different methods to examine possible uncertainties introduced by the fitting methods. One is FITEXY estimator (Press et al., 1992) for a bivariate least-squares process incorporating errors in dependent and independent variables. We used the MPFITEXY routine (Williams et al., 2010), which depends on the MPFIT package (Markwardt, 2009) in IDL. The other is a Bayesian linear regression routine linmix_err in IDL developed by Kelly (2007), which incorporates normally distributed errors in dependent and independent variables. It models the distribution of the independent variable by a mixture of Gaussian functions, and we set the parameter NGAUSS for the number of them. Since it fits the data using a Markov Chain Monte Carlo method, we determined the best estimate and the errors for the linear-regression parameters from the median, 15.9th percentile, and 84.1th percentile of their likelihood distributions. Both methods simultaneously fit the intrinsic scatter, which corresponds to for the primary method. We calculated the regression only for the slope being set as a free parameter by these methods, and the results are also listed in Table 7. The results of the regression analysis by different methods agree well with each other, thus they are thought to be robust.
We find that the best-fit slope is smaller than at about the level. A number of possible mechanisms may make the slope smaller. For example, Kawaguchi & Mori (2010, 2011) showed that anisotropic illumination of the accretion disk makes the dust-sublimation radius smaller in the equatorial plane than in the polar directions. If the fraction of the geometrical thickness relative to the radius is smaller for more luminous AGNs as suggested by many studies (e.g. Lawrence, 1991; Ueda et al., 2003; Simpson, 2005; Maiolino et al., 2007; Merloni et al., 2014), their model predicts that the inner radius of the dust torus relative to the square root of the luminosity is smaller for more luminous AGNs.
On the other hand, the inner dust torus was found not to contract immediately after the propagation of a drop in luminosity of the accretion disk (Koshida et al., 2009; Pott et al., 2010; Kishimoto et al., 2013; Oknyansky et al., 2014; Kokubo & Minezaki, 2019). If the response timescale to complete the contraction is less than a few years, as reported by Koshida et al. (2009) and Kokubo & Minezaki (2019), an AGN whose accretion disk has already dimmed but for which the dust torus still remains large would be observed more frequently in less luminous AGNs, in which the timescale for flux variation is expected to be small. In these objects, the inner radius of the dust torus on average would be larger for less luminous AGNs. 888Koshida et al. (2009) also reported that the inner dust torus did not expand immediately after the propagation of an increase in luminosity of the accretion disk. If the clumpy dust clouds located within the sublimation radius can survive temporarily, an AGN whose accretion disk has already brightened but for which the dust torus still remains small may be observed more frequently in less luminous AGNs.
A possible systematic change in the spectral shape of the UV–optical continuum emission of the accretion disk with the luminosity would also change the dust-sublimation radius from the correlation with the square root of the -band luminosity, because the integrated input energy for dust grains normalized by the -band flux depends on the spectral shape of the illumination (Barvainis, 1987; Yoshii et al., 2014). The luminosity dependence of the spectral energy distributions (SEDs) of AGNs has been studied by many authors, but Krawczyk et al. (2013) reported a somewhat complicated behavior in the UV–optical continuum, with more luminous AGNs tending to show a bluer optical continuum and a redder far-UV continuum. The influence of the luminosity-dependent UV–optical continuum on the radius–luminosity relation is thus not simple.
However, we suspect that it is still uncertain whether the slope is significantly smaller than 0.5. First, the number of the targets at both ends of the luminosity range is still limited. In addition, there are possibly observational biases against the largest and smallest lags due to the limited monitoring span and cadence, which — in combination with the scatter in the correlation — would make the slope smaller than its intrinsic value. Moreover, systematic uncertainties in the subtraction of the accretion-disk component in the near-infrared and the wavelength dependence of the dust-reverberation lag may also influence the slope measurement, because more luminous targets are located at larger redshifts, as shown in Figure 14. In order to clarify this point, it is desirable to apply the dust reverberation to more AGNs that cover wider ranges of both redshift and luminosity by longer-term monitoring observations of luminous quasars and higher-cadence ones for less luminous Seyfert galaxies.
3C 273 () is the most luminous quasar for which a dust-reverberation lag in the band has been obtained (Soldi et al., 2008). Its lag time was measured to be yr ( pc), and its optical luminosity was approximately erg s-1. Therefore, its dust-reverberation radius is smaller than the extrapolation of the radius–luminosity relation presented in Figure 13. This suggests either that the increase in the radius of the innermost dust torus saturates in the most luminous quasars or that the slope is significantly smaller than . However, Soldi et al. (2008) indicated that the optical continuum flux is dominated by an “ component” (Paltani et al., 1998) that may be synchrotron emission, and the luminosity of the accretion-disk component may thus be an order of magnitude smaller than the total -band luminosity, as shown in their Figure 5. If the component is highly anisotropic and does not illuminate the dust torus, only the accretion-disk emission would contribute input energy to the radiation equilibrium of the dust. The dust-reverberation radius of this quasar is consistent with the radius–luminosity relation presented here when we use the -band luminosity of the accretion-disk component. The same would hold for the interferometric dust radius of 3C 273 (Kishimoto et al., 2011; GRAVITY Collaboration et al., 2018, 2019), which may influence the discussion of the radius–luminosity relation for the interferometric dust radius and the difference from the dust-reverberation radius (Kishimoto et al., 2011; Koshida et al., 2014; GRAVITY Collaboration et al., 2019).
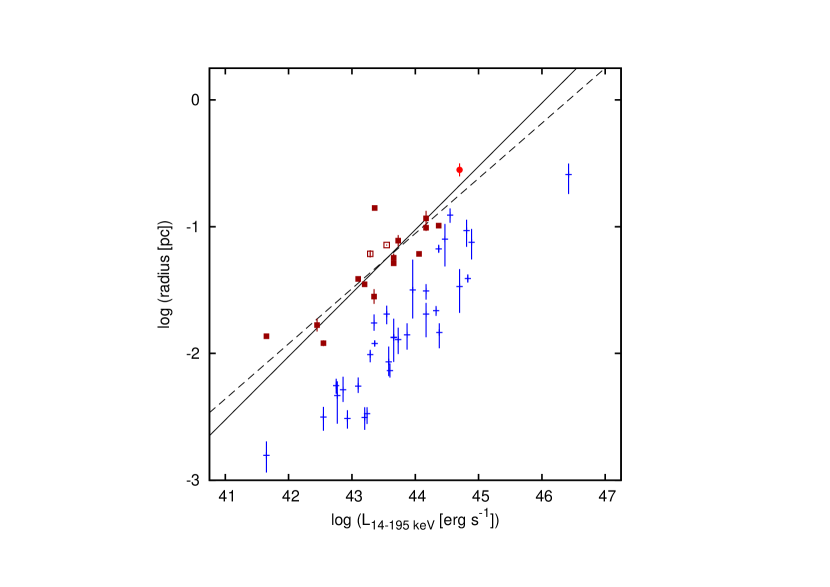
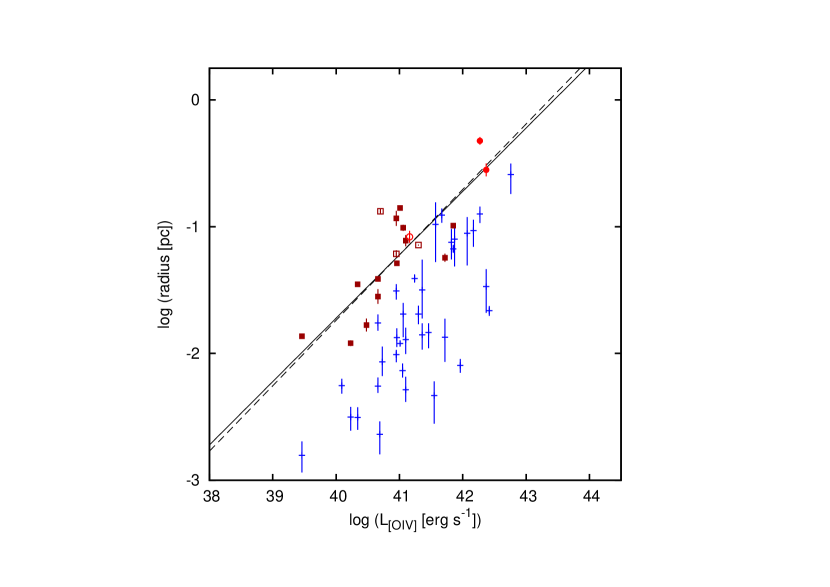
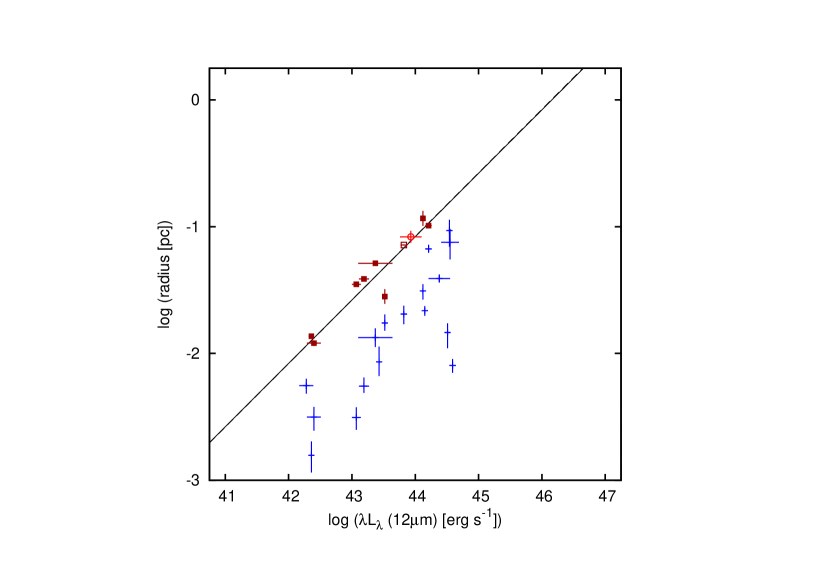
4.4 Correlation with Isotropic Luminosity Indicators
We examined the correlation between the dust-reverberation radius and the isotropic luminosity indicators of AGNs. Although these luminosity indicators are not dominant radiation sources for heating dust in the torus, they are the luminosity indicators for AGNs that are far less obscured by dust. Correlations with these indicators may thus be useful for studying the inner structures of obscured AGNs, such as type 2 AGNs and ultraluminous infrared galaxies.
We present here the correlations with three isotropic luminosity indicators for AGNs: the hard X-ray luminosity, the luminosity of [OIV] 25.89 m emission line in the mid-infrared, and the luminosity of the mid-infrared continuum emission. The former two are updates of the results in Koshida et al. (2014), while the last one is a newly examined correlation. The correlation with X-ray luminosity has also been examined by Tristram & Schartmann (2011) and Fukazawa et al. (2016) based on our early data on dust reverberation (Suganuma et al., 2006). We took the hard X-ray luminosities of the target AGNs from the 14–195 keV luminosities of AGNs by Ricci et al. (2017) based on the 70-month Swift/BAT catalog (Baumgartner et al., 2013). We obtained the [OIV] emission-line luminosities from a number of previous studies (Deo et al., 2007; Meléndez et al., 2008; Diamond-Stanic et al., 2009; Greene et al., 2010; Liu & Wang, 2010; Tommasin et al., 2010; Weaver et al., 2010; Lakićević et al., 2018). We employed the mid-infrared continuum luminosities of the nuclear components at the wavelength m measured by Asmus et al. (2014) based on the mid-infrared images at subarcsecond resolution obtained by ground-based 8 m class telescopes. The isotropic luminosity indicators of the target AGNs are listed in Table 8.
Figures 15–17 present the dust-reverberation radius plotted against the isotropic luminosity indicators, together with the reverberation radius of the BLR obtained by Bentz et al. (2013) for comparison. We applied the regression analysis to those data in the same way as for the -band luminosity. The best-fit regression lines are presented in Figure 15–17, and the resulting parameters are listed in Table 7. Since only a few quasars have data for those isotropic luminosity indicators, the increases in the quantity of the data and in the luminosity range were limited. The best-fit regression for the hard X-ray luminosity and the [OIV] emission-line luminosity are consistent with those of Koshida et al. (2014). Although the quantity of data is small, we found that the dust-reverberation radius was tightly correlated with the mid-infrared continuum luminosity for the Seyfert galaxies, as presented in Figure 17 and Table 7. The slopes of the best-fit linear regressions for all isotropic luminosity indicators are consistent with within 1 error when it was set as a free parameter. This is partly because of the large errors in slope caused by the limited quantity of data and limited luminosity range. Further observations of the isotropic luminosity indicators for more luminous AGNs will enable us to examine more details of the correlations between the dust-reverberation radius and the isotropic luminosity indicators. We note that the dust-reverberation radius of PG 0844349 inferred from the lag time associated with the peak with the shorter lag in the CCF is consistent with the radius–luminosity relation for the [OIV] emission-line and the mid-infrared continuum luminosities, in contrast to the optical -band luminosity. Even from the radius–luminosity relations, it is still uncertain which lag time is favored to represent the radius of the innermost dust torus for PG 0844349.
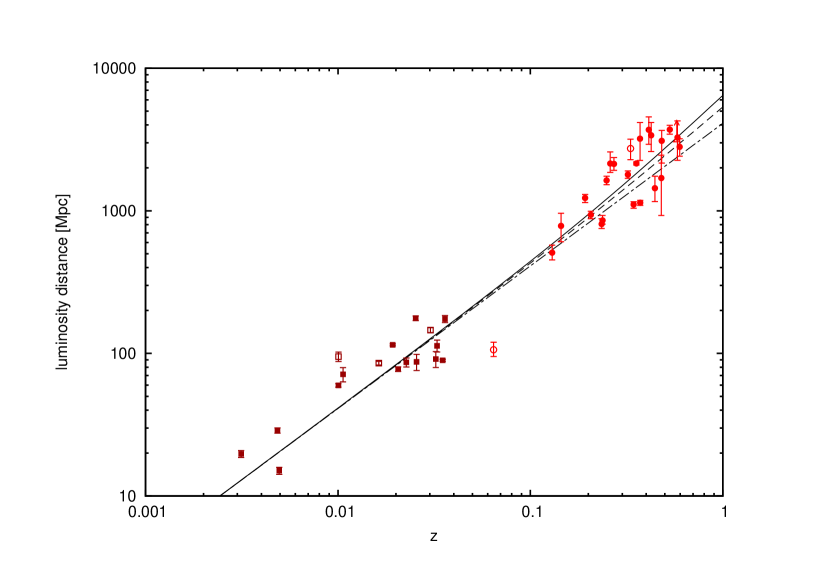
5 Constraining Cosmic Expansion Using Dust-reverberation Distance
Yoshii et al. (2014) formulated an equation to estimate the luminosity distance of an AGN from the dust-reverberation lag and the optical flux, based on a model of the radiation equilibrium of dust grains in the innermost dust torus, and they applied the formula to the data for Seyfert galaxies (Koshida et al., 2014) to obtain the Hubble constant. We apply it here to the data for the Seyfert galaxies and quasars at redshifts to plot a Hubble diagram and examine the cosmological models.
Since we selected the monitoring optical bands from among the , , and bands so as to be close to the rest-frame band, we slightly modified Equation 2 of Yoshii et al. (2014) to give the dust-reverberation distance in megaparsecs as follows:
| (5) |
where
| (6) |
and
| (7) |
Here, represents the monitoring optical bands (, , or ), is the effective frequency of the band, is the -band flux corrected for Galactic extinction, and is the flux for . We assumed for the power-law index for the optical continuum emission of the AGNs around the effective frequency of the band (rest frame). We used for the distance-calibration factor (Yoshii et al., 2014).
Figure 18 plots the dust-reverberation distance against the redshift for the 36 Seyfert galaxies and quasars in our sample. As shown in Figure 18, the cosmological model with current standard estimates ( km s-1 Mpc-1, , ) is consistent with the data. The best-fit cosmological parameters assuming a flat universe are km s-1 Mpc-1 and (), with a confidence interval of – when is fixed at the best-fit value. As a result, an accelerated universe is preferred from the dust-reverberation distances of the AGNs. We note that the deceleration parameter of the universe is sensitive to the difference between the luminosity distances of local AGNs and those of more distant ones. Therefore, precise observations of local AGNs are as important as those of AGNs at large redshifts. In contrast, since the uncertainty in transferred from the uncertainties in the radiation-equilibrium model of the dust only scales the dust-reverberation distance by the same amount at all redshifts, it does not contribute to errors in measuring the acceleration of the cosmic expansion.
Unfortunately, the cosmological parameters () are not tightly constrained by the dust-reverberation distance in this study, partly because the number of targets with precisely measured dust-reverberation lags located at large redshifts () is still small. More monitoring observations with high cadence, long term, and good photometric accuracy will improve the constraints on the cosmological parameters.
Moreover, understanding the origins of scatter in the correlation between the dust-reverberation radius and the luminosity are important for developing appropriate ways to improve the constraints on the cosmological parameters. We note that the correlation with the mid-infrared continuum luminosity is rather better than that with the optical luminosity, which suggests that further improvement of the radius–luminosity correlation, and thus of the dust-reverberation distance, is promising. The delayed response of the contraction (or expansion) of the inner dust torus after the propagation of a change in luminosity, and the target-to-target variation of the SED of the accretion-disk emission, are possible origins of scatter in the correlation. Simultaneously obtained UV–optical–near-infrared continuum spectra are expected to be useful to compensate for these problems. When the dust is located away from the global correlation, the dust temperature determined by radiation equilibrium would be different from the typical value, which can be observed in the SED of the near-infrared dust emission. Then, two parameters in the radiation-equilibrium model of dust for the distance-calibration factor — the SED of the UV–optical continuum emission of the accretion disk and the dust temperature — can be constrained observationally target-by-target to improve the dust-reverberation distance (Yoshii et al., 2014). This spectral information is also useful for subtracting the accretion-disk component from the near-infrared fluxes, which is important for extending the sample of dust-reverberation AGNs to much larger redshifts. As Koshida et al. (2014) examined a possible systematic difference from the global radius–luminosity relation for the innermost dust torus depending on the Eddington ratio and the viewing angle, understanding the geometry and structure in the central region of the dust torus and their possible influence on the dust-reverberation lag are also important for obtaining an accurate dust-reverberation distance.
At the end of this section, we discuss possible sources of systematic uncertainties in constraining the cosmic expansion. One is the uncertainty in the correction for the wavelength dependence of the dust-reverberation lag, because a different redshift correction to the lag time produces a systematic difference in the dust-reverberation distance that depends on redshift, which will alter the constraints on the cosmological parameters. Another is the uncertainty in the slope of the radius–luminosity relation. If it is different from 0.5, Equation 5 estimates systematically different distances that depend on the luminosity, and this will also alter the constraints on the cosmological parameters when the luminosity distribution of the targets changes with redshift. Understanding more details about the wavelength dependence of the dust-reverberation lag and the correlation of the dust-reverberation radius with the luminosity is important for constraining the cosmological parameters accurately. On the other hand, monitoring observations of less luminous targets at large redshifts and at longer wavelengths (– m) and those of luminous targets in the local universe at shorter wavelengths ( and bands) will reduce these systematic uncertainties observationally. Lyu et al. (2019) actually demonstrated the feasibility of dust reverberation at longer wavelengths (– m) for quasars at large redshifts ().
6 Summary
We have presented the results of a dust-reverberation survey of quasars at redshifts obtained by the MAGNUM project. We found a delayed response of the -band flux variation after the optical flux variation for 25 out of 31 targets. For more than half of the remaining six targets, a low signal-to-noise ratio and probable systematic errors in the -band photometry make a possible delayed response uncertain. Therefore, we consider dust reverberation to be ubiquitous, not only for Seyfert galaxies but also for quasars.
We measured the dust-reverberation lag using JAVELIN, fitting the data for the -band flux variations with the delayed response of the dust-torus emission superimposed on the accretion-disk component that is proportional to the optical flux variation. We succeeded in estimating the dust-reverberation lag for 22 out of the 25 targets with a delayed response, which include the most distant AGN with a dust-reverberation lag and the AGN with the largest dust-reverberation lag in the band measured so far. Combined with a selected sample of 14 out of the 17 nearby Seyfert galaxies studied by Koshida et al. (2014), we provide the largest homogeneous collection of -band dust-reverberation data for 36 type 1 AGNs.
Since the flux obtained by aperture photometry contains a significant contribution from the host-galaxy starlight, we estimated the optical luminosity of the AGN component by three different methods: spectral decomposition, the FVG method, and image decomposition. We then examined the correlation between the reverberation radius for the innermost dust torus and the optical luminosity. We found that they are strongly correlated, as is already known for the Seyfert galaxies, and the best-fit radius–luminosity relation is or when the slope of the relation is fixed at or freed, respectively. The latter slope is about smaller than the value of 0.5 that is expected from the radiation equilibrium of dust. However, it is still uncertain whether the slope is significantly smaller than . We found that the dust-reverberation radius to be located just outside of the reverberation radius of the BLR, even for quasars, as expected from the unified scheme of AGNs. We also presented the radius–luminosity relations for the isotropic luminosity indicators, which will be applicable for obscured AGNs. We updated the relations for the hard X-ray (14–195 keV) and the [OIV] 25.89 m luminosities from a previous study (Koshida et al., 2014), and we presented the correlation with the mid-infrared (12 m) continuum luminosity for the first time.
Using this homogeneous data collection, we estimated the luminosity distances of the 36 AGNs based on their dust-reverberation lags (Yoshii et al., 2014), and we found that the data for the redshift–luminosity distance diagram are consistent with current standard estimates for the cosmological parameters. We note that the uncertainties in the calibration factor for the dust-reverberation distance do not produce errors in measuring the acceleration of the cosmic expansion. Unfortunately, the cosmological parameters are not tightly constrained by the dust-reverberation distance in this study. In addition to the random errors, we discussed possible sources of systematic uncertainties in the study of cosmology based on the dust-reverberation distances.
Ongoing and future dust-reverberation mapping surveys for a large number of distant AGNs with different luminosities by large telescopes (VISTA, Hönig et al. 2017; LSST, Hönig 2014; TAO, Yoshii et al. 2016), as well as multi-wavelength dust-reverberation mapping with high cadence and good photometric accuracy for local AGNs (e.g., Landt et al., 2019), will enable us to investigate more details of the geometry and structure in the central region of the dust torus, and to improve constraints on the cosmic expansion based on the dust-reverberation distances. Results from dust reverberation for type 1 AGNs, combined with less obscured emission such as X-rays, are applicable to the study of obscured AGNs (e.g., Minezaki & Matsushita, 2015). Precise high-resolution X-ray spectroscopy that is planned for the next Japanese X-ray satellite XRISM (Tashiro et al., 2018) will enable us to study the dynamics in the central region of AGNs, as demonstrated by the results on NGC 1275 obtained by the Hitomi satellite (Hitomi Collaboration et al., 2018).
References
- Ahn et al. (2014) Ahn, C. P., Alexandroff, R., Allende Prieto, C., et al. 2014, ApJS, 211, 17
- Antonucci (1993) Antonucci, R. 1993, ARA&A, 31, 473
- Asmus et al. (2014) Asmus, D., Hönig, S. F., Gandhi, P., Smette, A., & Duschl, W. J. 2014, MNRAS, 439, 1648
- Baribaud et al. (1992) Baribaud, T., Alloin, D., Glass, I., & Pelat, D. 1992, A&A, 256, 375
- Barvainis (1987) Barvainis, R. 1987, ApJ, 320, 537
- Baskin & Laor (2018) Baskin, A., & Laor, A. 2018, MNRAS, 474, 1970
- Baumgartner et al. (2013) Baumgartner, W. H., Tueller, J., Markwardt, C. B., et al. 2013, ApJS, 207, 19
- Bentz et al. (2013) Bentz, M. C., Denney, K. D., Grier, C. J., et al. 2013, ApJ, 767, 149
- Calderone et al. (2017) Calderone, G., Nicastro, L., Ghisellini, G., et al. 2017, MNRAS, 472, 4051
- Choloniewski (1981) Choloniewski, J. 1981, Acta Astron., 31, 293
- Clavel et al. (1989) Clavel, J., Wamsteker, W., & Glass, I. S. 1989, ApJ, 337, 236
- Croom et al. (2001) Croom, S. M., Smith, R. J., Boyle, B. J., et al. 2001, MNRAS, 322, L29
- Deo et al. (2007) Deo, R. P., Crenshaw, D. M., Kraemer, S. B., et al. 2007, ApJ, 671, 124
- Diamond-Stanic et al. (2009) Diamond-Stanic, A. M., Rieke, G. H., & Rigby, J. R. 2009, ApJ, 698, 623
- Enya et al. (2002) Enya, K., Yoshii, Y., Kobayashi, Y., et al. 2002, ApJS, 141, 45
- Fukazawa et al. (2016) Fukazawa, Y., Furui, S., Hayashi, K., et al. 2016, ApJ, 821, 15
- Glass (1992) Glass, I. S. 1992, MNRAS, 256, 23P
- Glass (2004) —. 2004, MNRAS, 350, 1049
- GRAVITY Collaboration et al. (2018) Gravity Collaboration, Sturm, E., Dexter, J., et al. 2018, Nature, 563, 657
- GRAVITY Collaboration et al. (2019) GRAVITY Collaboration, Dexter, J., Shangguan, J., et al. 2019, arXiv e-prints, arXiv:1910.00593
- Greene et al. (2010) Greene, J. E., Hood, C. E., Barth, A. J., et al. 2010, ApJ, 723, 409
- Hewett et al. (1995) Hewett, P. C., Foltz, C. B., & Chaffee, F. H. 1995, AJ, 109, 1498
- Hitomi Collaboration et al. (2018) Hitomi Collaboration, Aharonian, F., Akamatsu, H., et al. 2018, PASJ, 70, 13
- Hönig (2014) Hönig, S. F. 2014, ApJ, 784, L4
- Hönig et al. (2017) Hönig, S. F., Watson, D., Kishimoto, M., et al. 2017, MNRAS, 464, 1693
- Huffman (1977) Huffman, D. R. 1977, Advances in Physics, 26, 129
- Hunt et al. (1998) Hunt, L. K., Mannucci, F., Testi, L., et al. 1998, The Astronomical Journal, 115, 2594
- Jefferys (1980) Jefferys, W. H. 1980, AJ, 85, 177
- Jefferys (1981) —. 1981, AJ, 86, 149
- Jun et al. (2015) Jun, H. D., Stern, D., Graham, M. J., et al. 2015, ApJ, 814, L12
- Kaspi et al. (2000) Kaspi, S., Smith, P. S., Netzer, H., et al. 2000, ApJ, 533, 631
- Kawaguchi & Mori (2010) Kawaguchi, T., & Mori, M. 2010, ApJ, 724, L183
- Kawaguchi & Mori (2011) —. 2011, ApJ, 737, 105
- Kelly (2007) Kelly, B. C. 2007, ApJ, 665, 1489
- Kelly et al. (2009) Kelly, B. C., Bechtold, J., & Siemiginowska, A. 2009, ApJ, 698, 895
- Kishimoto et al. (2011) Kishimoto, M., Hönig, S. F., Antonucci, R., et al. 2011, A&A, 527, A121
- Kishimoto et al. (2013) —. 2013, ApJ, 775, L36
- Kobayashi et al. (1998a) Kobayashi, Y., Yoshii, Y., Peterson, B. A., et al. 1998a, in Society of Photo-Optical Instrumentation Engineers (SPIE) Conference Series, Vol. 3354, Proc. SPIE, ed. A. M. Fowler, 769–776
- Kobayashi et al. (1998b) Kobayashi, Y., Yoshii, Y., Peterson, B. A., et al. 1998b, in Society of Photo-Optical Instrumentation Engineers (SPIE) Conference Series, Vol. 3352, Proc. SPIE, ed. L. M. Stepp, 120–128
- Kokubo & Minezaki (2019) Kokubo, M., & Minezaki, T. 2019, arXiv e-prints, arXiv:1904.08946
- Koshida et al. (2009) Koshida, S., Yoshii, Y., Kobayashi, Y., et al. 2009, ApJ, 700, L109
- Koshida et al. (2014) Koshida, S., Minezaki, T., Yoshii, Y., et al. 2014, ApJ, 788, 159
- Koshida et al. (2017) Koshida, S., Yoshii, Y., Kobayashi, Y., et al. 2017, ApJ, 842, L13
- Kozłowski et al. (2010) Kozłowski, S., Kochanek, C. S., Udalski, A., et al. 2010, ApJ, 708, 927
- Krawczyk et al. (2013) Krawczyk, C. M., Richards, G. T., Mehta, S. S., et al. 2013, ApJS, 206, 4
- Krist (1995) Krist, J. 1995, in Astronomical Society of the Pacific Conference Series, Vol. 77, Astronomical Data Analysis Software and Systems IV, ed. R. A. Shaw, H. E. Payne, & J. J. E. Hayes, 349
- Kynoch et al. (2019) Kynoch, D., Ward, M. J., Lawrence, A., et al. 2019, Monthly Notices of the Royal Astronomical Society, 485, 2573
- Lakićević et al. (2018) Lakićević, M., Popović, L. Č., & Kovačević-Dojčinović, J. 2018, MNRAS, 478, 4068
- Landolt (1992) Landolt, A. U. 1992, The Astronomical Journal, 104, 340
- Landt et al. (2019) Landt, H., Ward, M. J., Kynoch, D., et al. 2019, MNRAS, 489, 1572
- Lawrence (1991) Lawrence, A. 1991, MNRAS, 252, 586
- Lebofsky & Rieke (1980) Lebofsky, M. J., & Rieke, G. H. 1980, Nature, 284, 410
- Lira et al. (2011) Lira, P., Arévalo, P., Uttley, P., McHardy, I., & Breedt, E. 2011, MNRAS, 415, 1290
- Lira et al. (2015) Lira, P., Arévalo, P., Uttley, P., McHardy, I. M. M., & Videla, L. 2015, MNRAS, 454, 368
- Liu & Wang (2010) Liu, T., & Wang, J.-X. 2010, ApJ, 725, 2381
- Lyu et al. (2019) Lyu, J., Rieke, G. H., & Smith, P. S. 2019, arXiv e-prints, arXiv:1909.11101
- MacLeod et al. (2010) MacLeod, C. L., Ivezić, Ž., Kochanek, C. S., et al. 2010, ApJ, 721, 1014
- MacLeod et al. (2012) MacLeod, C. L., Ivezić, Ž., Sesar, B., et al. 2012, ApJ, 753, 106
- Maiolino et al. (2007) Maiolino, R., Shemmer, O., Imanishi, M., et al. 2007, A&A, 468, 979
- Mandal et al. (2018) Mandal, A. K., Rakshit, S., Kurian, K. S., et al. 2018, MNRAS, 475, 5330
- Markwardt (2009) Markwardt, C. B. 2009, in Astronomical Society of the Pacific Conference Series, Vol. 411, Astronomical Data Analysis Software and Systems XVIII, ed. D. A. Bohlender, D. Durand, & P. Dowler, 251
- McHardy et al. (1999) McHardy, I., Lawson, A., Newsam, A., et al. 1999, MNRAS, 310, 571
- McHardy et al. (2007) —. 2007, MNRAS, 375, 1521
- Meléndez et al. (2008) Meléndez, M., Kraemer, S. B., Armentrout, B. K., et al. 2008, ApJ, 682, 94
- Merloni et al. (2014) Merloni, A., Bongiorno, A., Brusa, M., et al. 2014, MNRAS, 437, 3550
- Minezaki & Matsushita (2015) Minezaki, T., & Matsushita, K. 2015, ApJ, 802, 98
- Minezaki et al. (2004) Minezaki, T., Yoshii, Y., Kobayashi, Y., et al. 2004, ApJ, 600, L35
- Minezaki et al. (2006) —. 2006, ApJ, 643, L5
- Nelson (1996) Nelson, B. O. 1996, ApJ, 465, L87
- Oknyanskii (1993) Oknyanskii, V. L. 1993, Astronomy Letters, 19, 416
- Oknyanskij (1999) Oknyanskij, V. L. 1999, Odessa Astronomical Publications, 12, 99
- Oknyanskij & Horne (2001) Oknyanskij, V. L., & Horne, K. 2001, in Astronomical Society of the Pacific Conference Series, Vol. 224, Probing the Physics of Active Galactic Nuclei, ed. B. M. Peterson, R. W. Pogge, & R. S. Polidan, 149
- Oknyanskij et al. (1999) Oknyanskij, V. L., Lyuty, V. M., Taranova, O. G., & Shenavrin, V. I. 1999, Astronomy Letters, 25, 483
- Oknyansky et al. (2015) Oknyansky, V. L., Gaskell, C. M., & Shimanovskaya, E. V. 2015, Odessa Astronomical Publications, 28, 175
- Oknyansky et al. (2014) Oknyansky, V. L., Metlova, N. V., Taranova, O. G., et al. 2014, Astronomy Letters, 40, 527
- Oknyansky et al. (2019) Oknyansky, V. L., Shenavrin, V. I., Metlova, N. V., & Gaskell, C. M. 2019, Astronomy Letters, 45, 197
- Oknyansky et al. (2017) Oknyansky, V. L., Gaskell, C. M., Huseynov, N. A., et al. 2017, MNRAS, 467, 1496
- Paltani et al. (1998) Paltani, S., Courvoisier, T. J. L., & Walter, R. 1998, A&A, 340, 47
- Peng et al. (2002) Peng, C. Y., Ho, L. C., Impey, C. D., & Rix, H.-W. 2002, AJ, 124, 266
- Penston et al. (1971) Penston, M. V., Penston, M. J., Neugebauer, G., et al. 1971, MNRAS, 153, 29
- Peterson et al. (1998) Peterson, B. M., Wanders, I., Horne, K., et al. 1998, PASP, 110, 660
- Polletta et al. (2007) Polletta, M., Tajer, M., Maraschi, L., et al. 2007, ApJ, 663, 81
- Pott et al. (2010) Pott, J.-U., Malkan, M. A., Elitzur, M., et al. 2010, ApJ, 715, 736
- Pozo Nuñez et al. (2014) Pozo Nuñez, F., Haas, M., Chini, R., et al. 2014, A&A, 561, L8
- Pozo Nuñez et al. (2015) Pozo Nuñez, F., Ramolla, M., Westhues, C., et al. 2015, A&A, 576, A73
- Press et al. (1992) Press, W. H., Teukolsky, S. A., Vetterling, W. T., & Flannery, B. P. 1992, Numerical Recipes in FORTRAN. The Art of Scientific Computing
- Ramolla et al. (2018) Ramolla, M., Haas, M., Westhues, C., et al. 2018, A&A, 620, A137
- Ricci et al. (2017) Ricci, C., Trakhtenbrot, B., Koss, M. J., et al. 2017, ApJS, 233, 17
- Sakata et al. (2010) Sakata, Y., Minezaki, T., Yoshii, Y., et al. 2010, ApJ, 711, 461
- Salpeter (1977) Salpeter, E. E. 1977, ARA&A, 15, 267
- Schlafly & Finkbeiner (2011) Schlafly, E. F., & Finkbeiner, D. P. 2011, ApJ, 737, 103
- Schmidt & Green (1983) Schmidt, M., & Green, R. F. 1983, ApJ, 269, 352
- Schnülle et al. (2013) Schnülle, K., Pott, J. U., Rix, H. W., et al. 2013, A&A, 557, L13
- Schnülle et al. (2015) —. 2015, A&A, 578, A57
- Shakura & Sunyaev (1973) Shakura, N. I., & Sunyaev, R. A. 1973, A&A, 500, 33
- Silva et al. (1998) Silva, L., Granato, G. L., Bressan, A., & Danese, L. 1998, ApJ, 509, 103
- Simpson (2005) Simpson, C. 2005, MNRAS, 360, 565
- Sitko et al. (1993) Sitko, M. L., Sitko, A. K., Siemiginowska, A., & Szczerba, R. 1993, ApJ, 409, 139
- Soldi et al. (2008) Soldi, S., Türler, M., Paltani, S., et al. 2008, A&A, 486, 411
- Spergel et al. (2007) Spergel, D. N., Bean, R., Doré, O., et al. 2007, ApJS, 170, 377
- Stoughton et al. (2002) Stoughton, C., Lupton, R. H., Bernardi, M., et al. 2002, AJ, 123, 485
- Suganuma et al. (2004) Suganuma, M., Yoshii, Y., Kobayashi, Y., et al. 2004, ApJ, 612, L113
- Suganuma et al. (2006) —. 2006, ApJ, 639, 46
- Sun et al. (2018) Sun, M., Xue, Y., Cai, Z., & Guo, H. 2018, ApJ, 857, 86
- Tashiro et al. (2018) Tashiro, M., Maejima, H., Toda, K., et al. 2018, in Society of Photo-Optical Instrumentation Engineers (SPIE) Conference Series, Vol. 10699, Proc. SPIE, 1069922
- Tomita (2005) Tomita, H. 2005, PhD thesis, The University of Tokyo
- Tomita et al. (2006) Tomita, H., Yoshii, Y., Kobayashi, Y., et al. 2006, ApJ, 652, L13
- Tommasin et al. (2010) Tommasin, S., Spinoglio, L., Malkan, M. A., & Fazio, G. 2010, ApJ, 709, 1257
- Tristram & Schartmann (2011) Tristram, K. R. W., & Schartmann, M. 2011, A&A, 531, A99
- Ueda et al. (2003) Ueda, Y., Akiyama, M., Ohta, K., & Miyaji, T. 2003, ApJ, 598, 886
- Vazquez et al. (2015) Vazquez, B., Galianni, P., Richmond, M., et al. 2015, ApJ, 801, 127
- Veron-Cetty & Veron (2000) Veron-Cetty, M. P., & Veron, P. 2000, A Catalogue of Quasars and Active Nuclei
- Weaver et al. (2010) Weaver, K. A., Meléndez, M., Mushotzky, R. F., et al. 2010, ApJ, 716, 1151
- Williams et al. (2010) Williams, M. J., Bureau, M., & Cappellari, M. 2010, MNRAS, 409, 1330
- Winkler (1997) Winkler, H. 1997, MNRAS, 292, 273
- Winkler et al. (1992) Winkler, H., Glass, I. S., van Wyk, F., et al. 1992, MNRAS, 257, 659
- Yoshii (2002) Yoshii, Y. 2002, in New Trends in Theoretical and Observational Cosmology, ed. K. Sato & T. Shiromizu, 235
- Yoshii et al. (2003) Yoshii, Y., Kobayashi, Y., & Minezaki, T. 2003, in American Astronomical Society Meeting Abstracts, Vol. 202, American Astronomical Society Meeting Abstracts #202, 38.03
- Yoshii et al. (2014) Yoshii, Y., Kobayashi, Y., Minezaki, T., Koshida, S., & Peterson, B. A. 2014, ApJ, 784, L11
- Yoshii et al. (2016) Yoshii, Y., Doi, M., Kohno, K., et al. 2016, in Society of Photo-Optical Instrumentation Engineers (SPIE) Conference Series, Vol. 9906, Proc. SPIE, id. 99060R
- Zu et al. (2016) Zu, Y., Kochanek, C. S., Kozłowski, S., & Peterson, B. M. 2016, ApJ, 819, 122
- Zu et al. (2013) Zu, Y., Kochanek, C. S., Kozłowski, S., & Udalski, A. 2013, ApJ, 765, 106
- Zu et al. (2011) Zu, Y., Kochanek, C. S., & Peterson, B. M. 2011, ApJ, 735, 80
| Name | R.A. | Decl. | RedshiftaaThe heliocentric redshift from the NED. | BandbbObserving photometric bands to measure the dust-reverberation lag, column 5 for optical and column 6 for near-infrared. | Observing Period | ccNumber of observations. | ddMedian monitoring interval in unit of days. | Full NameeeFull name for the Sloan Digital Sky Survey (SDSS), the 2dF QSO Redshift Survey (2QZ), and ROSAT X-Ray source (RX). | |
|---|---|---|---|---|---|---|---|---|---|
| SDSS J00070054 | 00 07 29.990 | 00 54 28.01 | 0.1452 | 2001.11.20–2007.08.18 | 131 | 6 | SDSS J000729.99005428.0 | ||
| LBQS 00230228 | 00 26 21.94 | 02 44 41.8 | 0.2360 | 2003.06.29–2007.08.02 | 56 | 12 | |||
| SDSS J02070048 | 02 07 24.177 | 00 48 41.41 | 0.3728 | 2001.11.24–2007.08.06 | 73 | 12 | SDSS J020724.17004841.4 | ||
| SDSS J03150012 | 03 15 42.642 | 00 12 28.75 | 0.2073 | 2001.11.13–2007.08.17 | 112 | 7 | SDSS J031542.64001228.7 | ||
| PG 0844349 | 08 47 42.465 | 34 45 04.40 | 0.0640 | 2003.02.23–2007.05.20 | 25 | 34 | |||
| SDSS J09430043 | 09 43 35.613 | 00 43 22.05 | 0.2714 | 2002.01.15–2007.05.30 | 67 | 14 | SDSS J094335.61004322.0 | ||
| PG 0953414 | 09 56 52.392 | 41 15 22.25 | 0.2341 | 2003.02.17–2007.06.19 | 12 | 112 | |||
| SDSS J09570023 | 09 57 58.449 | 00 23 54.03 | 0.5956 | 2002.01.11–2007.04.03 | 16 | 87 | SDSS J095758.44002354.0 | ||
| 2QZ J10130028 | 10 13 55.210 | 00 28 50.28 | 0.3305 | 2002.02.04–2007.05.31 | 52 | 18 | 2QZ J101355.1002849 | ||
| LBQS 10220005 | 10 24 50.521 | 00 21 02.41 | 0.3203 | 2003.10.29–2007.06.04 | 22 | 35 | |||
| LBQS 10260032 | 10 29 20.702 | 00 47 47.60 | 0.2592 | 2002.02.15–2007.06.01 | 33 | 33 | |||
| 2QZ J10320233 | 10 32 24.642 | 02 33 21.66 | 0.5670 | 2003.11.23–2007.05.22 | 12 | 88 | 2QZ J103224.6023322 | ||
| SDSS J10440003 | 10 44 49.281 | 00 03 01.22 | 0.4428 | 2002.01.09–2007.06.24 | 40 | 28 | SDSS J104449.28000301.2 | ||
| 2QZ J11380131 | 11 38 07.196 | 01 31 58.66 | 0.4780 | 2002.01.15–2007.06.19 | 47 | 24 | 2QZ J113807.1013159 | ||
| 2QZ J12200119 | 12 20 32.471 | 01 19 49.16 | 0.5130 | 2003.02.09–2007.06.01 | 26 | 31 | 2QZ J122032.4011950 | ||
| 2QZ J12250101 | 12 25 49.442 | 01 01 54.11 | 0.5750 | 2003.12.22–2007.07.15 | 21 | 38 | 2QZ J122549.4010155 | ||
| 2QZ J12470025 | 12 47 41.703 | 00 25 16.77 | 0.4110 | 2003.12.24–2007.07.13 | 32 | 25 | 2QZ J124741.6002515 | ||
| SDSS J13090015 | 13 09 16.672 | 00 15 50.15 | 0.4228 | 2004.02.02–2007.07.26 | 25 | 26 | SDSS J130916.67001550.1 | ||
| LBQS 13390210 | 13 42 16.177 | 01 55 18.67 | 0.2728 | 2003.02.16–2007.08.08 | 32 | 32 | |||
| 2QZ J13450231 | 13 45 12.443 | 02 31 46.18 | 0.5283 | 2003.02.11–2007.08.02 | 23 | 46 | 2QZ J134512.4023147 | ||
| 2QZ J14380116 | 14 38 22.920 | 01 16 36.05 | 0.3880 | 2003.02.11–2007.08.10 | 64 | 14 | 2QZ J143822.8011636 | ||
| PG 1613658 | 16 13 57.179 | 65 43 09.58 | 0.1290 | 2003.09.04–2007.08.08 | 27 | 39 | |||
| SDSS J17175932 | 17 17 47.566 | 59 32 58.08 | 0.2483 | 2003.02.28–2007.08.18 | 75 | 12 | SDSS J171747.55593258.0 | ||
| SDSS J17185313 | 17 18 32.858 | 53 13 04.67 | 0.1917 | 2003.02.26–2007.08.18 | 92 | 9 | SDSS J171832.85531304.7 | ||
| SDSS J17206128 | 17 20 59.476 | 61 28 11.79 | 0.2365 | 2003.02.08–2007.08.09 | 48 | 23 | SDSS J172059.45612811.7 | ||
| SDSS J17235400 | 17 23 00.547 | 54 00 55.84 | 0.4806 | 2002.08.23–2007.07.19 | 32 | 36 | SDSS J172300.53540055.7 | ||
| SDSS J17246036 | 17 24 46.401 | 60 36 19.63 | 0.3715 | 2003.02.17–2007.07.26 | 32 | 35 | SDSS J172446.40603619.6 | ||
| IRAS F212560219 | 21 28 12.32 | 02 32 31.9 | 0.2570 | 2001.10.11–2007.08.02 | 70 | 17 | |||
| RX J21380112 | 21 38 18.971 | 01 12 22.45 | 0.3441 | 2001.08.03–2007.08.18 | 67 | 16 | RX J2138.20112 | ||
| RX J21561426 | 21 56 42.61 | 14 26 34.4 | 0.3560 | 2001.07.27–2007.08.18 | 134 | 8 | RX J2156.71426 | ||
| SDSS J23260030 | 23 26 40.012 | 00 30 41.41 | 0.5820 | 2003.06.01–2007.07.22 | 22 | 41 | SDSS J232640.01003041.4 | ||
Note. —
| Object | Band | Observation Date | Flux | Flux Error |
|---|---|---|---|---|
| (MJD) | (Jy) | (Jy) | ||
| SDSS J00070054 | 52226.38 | 172.1 | 1.4 | |
| 52233.35 | 172.6 | 0.8 | ||
| SDSS J00070054 | 52233.35 | 703.9 | 5.2 | |
| 52237.34 | 703.9 | 4.5 | ||
| LBQS 00230228 | 52819.57 | 121.6 | 0.5 | |
| 52849.56 | 121.7 | 0.8 | ||
Note. — Galactic extinction has been corrected for, and the fluxes from the host galaxy have not been subtracted. (This table is available in its entirety in a machine-readable form.)
| Object | BandaaThe optical and near-infrared bands between which the dust-reverberation lag was obtained. | Lag TimebbThe observed dust-reverberation lag. | Lag TimeccThe dust-reverberation lag for the -band emission in the rest frame. | ||
|---|---|---|---|---|---|
| (days) | (days) | ||||
| ddThe power-law index assumed for the accretion-disk component between optical and near-infrared wavelengths. | ddThe power-law index assumed for the accretion-disk component between optical and near-infrared wavelengths. | ddThe power-law index assumed for the accretion-disk component between optical and near-infrared wavelengths. | ddThe power-law index assumed for the accretion-disk component between optical and near-infrared wavelengths. | ||
| SDSS J00070054 | , | ||||
| LBQS 00230228 | , | ||||
| SDSS J02070048 | , | ||||
| SDSS J03150012 | , | ||||
| PG 0844349eeThe observed dust-reverberation lags for the second CCF peak are , , days for , , respectively, and the rest-frame lag for that is days. | , | ||||
| SDSS J09430043 | , | ||||
| PG 0953414 | , | ||||
| SDSS J09570023 | , | ||||
| 2QZ J10130028ffThe observed dust-reverberation lags for the second CCF peak are , , days for , , respectively, and the rest-frame lag for that is days. | , | ||||
| LBQS 10220005 | , | ||||
| LBQS 10260032 | , | ||||
| 2QZ J10320233 | , | ||||
| SDSS J10440003 | , | ||||
| 2QZ J11380131 | , | ||||
| 2QZ J12200119 | , | ||||
| 2QZ J12250101 | , | ||||
| 2QZ J12470025 | , | ||||
| SDSS J13090015 | , | ||||
| LBQS 13390210 | , | ||||
| 2QZ J13450231 | , | ||||
| 2QZ J14380116 | , | ||||
| PG 1613658 | , | ||||
| SDSS J17175932 | , | ||||
| SDSS J17185313 | , | ||||
| SDSS J17206128 | , | ||||
| SDSS J17235400 | , | ||||
| SDSS J17246036 | , | ||||
| IRAS F212560219 | , | ||||
| RX J21380112 | , | ||||
| RX J21561426 | , | ||||
| SDSS J23260030 | , | ||||
Note. —
| Object | BandaaThe monitoring optical band for the dust reverberation, and the band for the host-galaxy fluxes presented here | (QSFit)bbThe host-galaxy flux estimated by the spectral decomposition method | Band2ccThe other optical band for the FVG analysis | (FVG)ddThe host-galaxy flux estimated by the FVG method | (HST)eeThe host-galaxy flux estimated by the image-decomposition method | ffThe host-galaxy flux adopted |
|---|---|---|---|---|---|---|
| (Jy) | (Jy) | (Jy) | (Jy) | |||
| SDSS J00070054 | ||||||
| LBQS 00230228 | ||||||
| SDSS J02070048 | ||||||
| SDSS J03150012 | ||||||
| PG 0844349 | ||||||
| SDSS J09430043 | ||||||
| PG 0953414 | ||||||
| SDSS J09570023 | ||||||
| 2QZ J10130028 | ||||||
| LBQS 10220005 | ||||||
| LBQS 10260032 | ||||||
| 2QZ J10320233 | ||||||
| SDSS J10440003 | ||||||
| 2QZ J11380131 | ||||||
| 2QZ J12200119 | ||||||
| 2QZ J12250101 | ||||||
| 2QZ J12470025 | ||||||
| SDSS J13090015 | ||||||
| LBQS 13390210 | ||||||
| 2QZ J13450231 | ||||||
| 2QZ J14380116 | ||||||
| PG 1613658 | ||||||
| SDSS J17175932 | ||||||
| SDSS J17185313 | ggThe best estimate of the host-galaxy flux exceeds the minimum flux during the monitoring observation. | |||||
| SDSS J17206128 | ggThe best estimate of the host-galaxy flux exceeds the minimum flux during the monitoring observation. | |||||
| SDSS J17235400 | ||||||
| SDSS J17246036 | ||||||
| IRAS F212560219 | ||||||
| RX J21380112 | ||||||
| RX J21561426 | ||||||
| SDSS J23260030 |
Note. —
| Object | BandaaThe optical band for the | bbThe optical flux of the AGN | ccThe -band luminosity of the AGN |
|---|---|---|---|
| (Jy) | |||
| SDSS J00070054 | |||
| LBQS 00230228 | |||
| SDSS J02070048 | |||
| SDSS J03150012 | |||
| PG 0844349 | |||
| SDSS J09430043 | |||
| PG 0953414 | |||
| SDSS J09570023 | |||
| 2QZ J10130028 | |||
| LBQS 10220005 | |||
| LBQS 10260032 | |||
| 2QZ J10320233 | |||
| SDSS J10440003 | |||
| 2QZ J11380131 | |||
| 2QZ J12200119 | |||
| 2QZ J12250101 | |||
| 2QZ J12470025 | |||
| SDSS J13090015 | |||
| LBQS 13390210 | |||
| 2QZ J13450231 | |||
| 2QZ J14380116 | |||
| PG 1613658 | |||
| SDSS J17175932 | |||
| SDSS J17185313 | |||
| SDSS J17206128 | |||
| SDSS J17235400 | |||
| SDSS J17246036 | |||
| IRAS F212560219 | |||
| RX J21380112 | |||
| RX J21561426 | |||
| SDSS J23260030 |
Note. —
| Object | RedshiftaaThe heliocentric redshift from the NED. | Redshiftbb The local flow-corrected redshift of the Virgo infall Great Attractor Shapley supercluster from the NED. | Lag TimeccThe observed dust-reverberation lag where was assumed for the near-infrared continuum emission of the accretion disk | Lag TimeddThe dust-reverberation lag for the -band emission in the rest frame. | Flux ()eeThe -band flux of the AGN; Galactic extinction has been corrected for and the flux from the host galaxy has been subtracted. | ffThe -band luminosity of the AGN |
|---|---|---|---|---|---|---|
| (km s-1) | (km s-1) | (days) | (days) | (mJy) | ||
| Mrk 335 | ||||||
| Mrk 590 | ||||||
| IRAS 034500055 | ||||||
| Akn 120 | ||||||
| MCG | ||||||
| Mrk 79 | ||||||
| Mrk 110 | ||||||
| NGC 3227 | ||||||
| NGC 3516 | ||||||
| Mrk 744 | ||||||
| NGC 4051 | ||||||
| NGC 4151 | ||||||
| NGC 4593 | ||||||
| NGC 5548 | ||||||
| Mrk 817 | ||||||
| Mrk 509 | ||||||
| NGC 7469 |
Note. —
| (erg s-1) | aaThe number of the data pair for the fitting. | bbThe parameter was fixed when . | Methodcc(1) Jefferys (1980, 1981), (2) Press et al. (1992), Williams et al. (2010), (3) Kelly (2007) | |||
|---|---|---|---|---|---|---|
| 43.7 | 36 | 0.5 | 0.14 | 1 | ||
| 0.12 | 1 | |||||
| 0.12 | 2 | |||||
| 0.13 | 3 | |||||
| 43.5 | 15 | 0.5 | 0.19 | 1 | ||
| 0.19 | 1 | |||||
| 0.19 | 2 | |||||
| 0.21 | 3 | |||||
| 41.0 | 15 | 0.5 | 0.23 | 1 | ||
| 0.24 | 1 | |||||
| 0.23 | 2 | |||||
| 0.27 | 3 | |||||
| 43.5 | 8 | 0.5 | 0.09 | 1 | ||
| 0.10 | 1 | |||||
| 0.10 | 2 | |||||
| 0.16 | 3 |
Note. — The fitted model is
| Object | aaThe hard X-ray luminosity at 14–195 keV | bbThe luminosity of [O ] 25.89 m emission lines | ReferencesccReferences for : 1– Liu & Wang (2010), in which many data come from Meléndez et al. (2008) and Diamond-Stanic et al. (2009), 2– Greene et al. (2010), 3– Tommasin et al. (2010), 4– Weaver et al. (2010), 5– Lakićević et al. (2018), 6– Deo et al. (2007) | ddThe nuclear luminosity of mid-infrared continuum at m |
|---|---|---|---|---|
| Mrk 335 | 1 | |||
| Mrk 590 | 2 | |||
| IRAS 034500055 | 3 | |||
| Akn 120 | 4 | |||
| MCG | ||||
| Mrk 79 | 1 | |||
| Mrk 110 | 5 | |||
| NGC 3227 | 1 | |||
| NGC 3516 | 1 | |||
| Mrk 744 | 1 | |||
| NGC 4051 | 1 | |||
| NGC 4151 | 1 | |||
| NGC 4593 | 1 | |||
| NGC 5548 | 1 | |||
| Mrk 817 | 6 | |||
| Mrk 509 | 1 | |||
| NGC 7469 | 1 | |||
| PG 0844349 | 2 | |||
| PG 0953414 | 2 | |||
| PG 1613658 | 2 |
Note. —