The MINERA Collaboration
Nucleon binding energy and transverse momentum imbalance in neutrino-nucleus reactions
Abstract
We have measured new observables based on the final state kinematic imbalances in the mesonless production of in the tracker. Components of the muon-proton momentum imbalances parallel () and perpendicular() to the momentum transfer in the transverse plane are found to be sensitive to the nuclear effects such as Fermi motion, binding energy and non-QE contributions. The QE peak location in is particularly sensitive to the binding energy. Differential cross sections are compared to predictions from different neutrino interaction models. The Fermi gas models presented in this study cannot simultaneously describe features such as QE peak location, width and the non-QE events contributing to the signal process. Correcting the genie’s binding energy implementation according to theory causes better agreement with data. Hints of proton left-right asymmetry are observed in . Better modeling of the binding energy can reduce bias in neutrino energy reconstruction and these observables can be applied in current and future experiments to better constrain nuclear effects.
pacs:
13.15.+g,25.70.Bc,21.10.DrI Introduction
Neutrino oscillation experiments measure the final state particles produced by neutrino-nucleus scattering processes. Models that accurately describe these interactions are crucial to reducing the uncertainties in the measurements of oscillation parameters.
Most neutrino-nucleus interactions are modeled through the impulse approximation (IA), where the probe sees the target nucleus as a collection of independent nucleons and the resulting particles then evolve independently. Important components of modeling in the IA picture include the initial state nucleon’s energy-momentum distributions, the nuclear potentials, and the final state interactions (FSIs) that modify the kinematics of the final-state particles as they propagate through the nucleus.
The leptonic system provides energy to the hadronic side of the reaction to bring a bound nucleon on-shell and separate it from the remnant nucleus. Such energy is often loosely referred to as “binding energy”, but Ref Bodek and Cai (2019) draws a distinction between the different energy parameters in neutrino models and how their effects depend on the implementation details.
In this paper we refer to the average energy transferred to the target nucleus to bring a bound nucleon inside the target onto the mass shell as the “removal energy”, represented in this paper by for the neutron (proton) initial state in neutrino (antineutrino) interactions. The energy associated with nuclear potentials is referred to as the nuclear potential energy. The combined effects of the “removal energy” and the nuclear potential energy is referred to as the “interaction energy”. The interaction energy implementation in the IA picture is discussed in detail in Sec. II.
For many neutrino experiments, particularly at low energies like T2K, MicroBooNE, and the second oscillation maximum in dune, incorrect treatment of the interaction energy may significantly bias the reconstructed neutrino energy and will alter the expected kinematics of final state nucleons. Such effects are already a significant systematic in the measurement of in the T2K experiment Bodek and Cai (2019); Abe et al. (2018a).
This paper will examine a set of new observable quantities that are sensitive to nuclear effects, and especially to the interaction energy implementation used in generators. The variables are extensions to the recent measurements of momentum imbalance in mesonless events with a muon and proton in the final state, here referred to as single transverse kinematic imbalance (single-TKI) Lu et al. (2016) by the Lu et al. (2018) and T2K Abe et al. (2018b) experiments.
The new observables are derived from the single-TKI observable . Specifically, we define to be the projection of along the transverse component of the leptonic momentum transfer, which is sensitive to the effects of the interaction energy. We also report on the cross section in , the projection normal to the neutrino-muon interaction plane. The single-TKI variables and their sensitivities to the interaction energy is discussed in greater details in Sec. III and Sec. IV respectively.
These quantities provide neutrino oscillation experiments with a method to evaluate the validity of the interaction energy implemented in the interaction models. The interaction energy affects the reconstructed energy scale in the simulated neutrino interaction. Evaluating the uncertainties in the neutrino energy scale based on an inaccurate implementation of the interaction energy will result in unnecessarily large systematics.
We measure and using -induced muon-proton mesonless interactions on hydrocarbon at ; this is the same data set as was studied previously in Ref Lu et al. (2018). The differential cross sections in these quantities are compared with genie Andreopoulos (2009), neut 5.40 Hayato (2009), nuwro Juszczak et al. (2006) and gibuu Buss et al. (2012); Gallmeister et al. (2016) event generator predictions. The methodology is detailed in Sec. V and the results are discussed in Sec. VI.
II Impulse Approximation
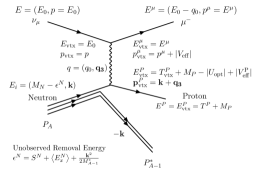
We illustrate the effects of interaction energy with the charged-current quasielastic (CCQE) interaction in the IA picture shown in Fig. 1. In this picture, only a single nucleon is involved in the hard scattering, .
The neutrino with energy made 4-momentum transfer, to a bound neutron of mass inside a target nucleus with nucleons, where and are the energy and momentum transfer respectively. The target nucleus was initially at rest with mass , the bound neutron has 4-momentum where is neutron’s Fermi momentum. The remnant nucleus with 4-momentum must have momentum for the target nucleus to be at rest. The energy of the initial state neutron can be written as:
| (1) |
where is the mass of the excited spectator nucleus. For the nuclear targets typically used in neutrino experiments (12C, 16O and 40Ar), we have . Then we can expand the initial state nucleon energy as:
| (2) |
The removal energy parameter
| (3) |
accounts for the neutron separation energy from the target nucleus ,
| (4) |
and the excitation energy of the final state nucleus, , when the initial state nucleon is a neutron,
| (5) |
The average kinetic energy of the excited remnant nucleus with A-1 nucleons affects the interaction only through its nuclear potentials. For neutrino QE interactions on 12C, , and Bodek and Cai (2019). The removal energy is the average energy needed to bring the neutron onto the mass-shell.
There are additional effects associated with the nuclear potentials that should be accounted for. For example, the nuclear optical potential describes the nucleus as a medium with complex refractive index: the real part of the potential affects the allowed kinematics of the initial state lepton-nucleon system in the IA while the imaginary part is related to inelastic scattering as the outgoing nucleon is making an exit from the nucleus Hodgson (1971). Reference Bodek and Cai (2019) fits inclusive electron scattering data to determine the real part of the optical potential which depends on the 3-momentum of the outgoing nucleon at the interaction vertex. This optical potential is denoted as in this work. The effect of the optical potential is largest at lower momentum. For carbon, the parameterization of Ref Bodek and Cai (2019) is
| (6) |
In this analysis we use this parameterization, and it is on average for our selected events.
Another potential, the Coulomb potential of the positively charged remnant nucleus will modify the momenta of the outgoing charged particles as they propagate through the nucleus. In Fig. 1, a distinction between the Coulomb potential experienced by muon () and proton () is made; however,for neutrino interactions both particles experience the same Coulomb potential as the proton number in the nucleus remains unchanged after the interaction.
For carbon, is Bodek and Cai (2019).
Figure 1 illustrates energy and momentum conservation between the initial and final state. The total energy of the final proton and muon is equal to the total of the initial neutron and lepton, less energy required to create the final state excited nucleon in the reaction. The Coulomb potential affects any charged final state particles, but the optical potential affects the final state nucleon only. For example, the muon with total energy begins inside the Coulomb potential, with kinetic energy and potential energy , and is decelerated during transport inside the nucleus medium so that its kinetic energy is outside the nucleus. The proton experiences both the Coulomb potential and the optical potential, which modify its kinetic energy and momentum but conserve the total energy. The full energy conservation equation on the hadronic side is as follows Bodek and Cai (2019):
| (7) |
Here, the final state proton is assumed to be on-shell with energy ,before and after exiting the nucleus. Its kinetic energy immediately after the 4-momentum transfer is
| (8) |
and is modified by the nuclear potentials so that outside the nucleus the kinetic energy becomes
| (9) |
The removal energy used by neutrino Monte Carlo (MC) generators, such as genie Andreopoulos (2009), neut Hayato (2009), and nuwro Juszczak et al. (2006), are discussed in detail in Ref Bodek and Cai (2019). These generators use variants of spectral functions, mostly the Fermi gas model in the IA picture with removal energy constrained by inclusive electron scattering data Smith and Moniz (1972). However, they have distinct implementations of the IA model which affects the energy terms going into the removal energy parameter. For example, in genie’s IA implementation, the off-shell bound initial nucleon is generated with Eq.(7), but with , , and set to 0. genie subtracts an additional “binding energy” parameter from the final state protons in QE processes to account for the removal energy. The implementation of this term is independent of the kinematics at the interaction vertex, which causes the energy of the final state nucleons to be biased. The values of were measured by Ref Smith and Moniz (1972) and referred to as the “Moniz interaction energy” in Ref Bodek and Cai (2019). The Moniz interaction energy is an empirical fit to the sum of the removal energy and the nuclear potentials, but for a non-relativistic on-shell formalism. For C scattering, Andreopoulos (2009).
| Correction | genie Baseline Shift | QE Baseline Shift | ||
| , | ||||
| 0: Default | 0 | 0 | 0,0 | 0 |
| (no corrections) | ||||
| 1: only | ||||
| (w/ ) | ||||
| 2: and | ||||
| (w/ ) |
In this paper, we refer to the collective energy shifts due to removal energy and the nuclear potentials as the “interaction energy”, in the spirit of the Moniz interaction energy of Ref Bodek and Cai (2019). This interaction energy is specific to the off-shell formalism described in Eq. 7.
We simulate the effects of the interaction energy implementations in genie by modifying the final state muon and proton energies after a sample is generated according to Table 1. The corrections outlined are motivated by the study in Ref Bodek and Cai (2019). Comparisons between the default genie implementation ( 0 in Table 1) and two different corrections (1 and 2) are made. For both sets of corrections, which are applied to QE events, we add back to the exiting proton to undo the bias, we then subtract from the muon to account for the shift in momentum transfer in the leptons (derived in Appendix A). In addition, the correction 1 applies an optical potential correction to both the muon and proton, while the correction 2 applies the Coulomb correction on top of correction 1. The average is for the proton and muon kinematics chosen.
The corrections are approximations which implement the leading effect of the nuclear potential. That potential will also cause changes, small for our events that have an energetic final state proton, in the four momentum transferred to the off-shell target nucleon. Appendix A provides the derivation of our corrections.
III The single-TKI variables
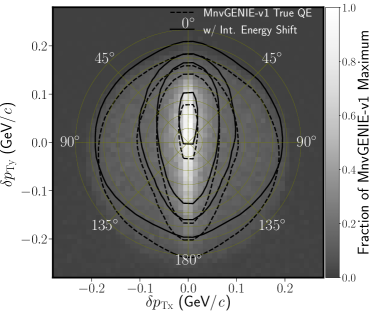
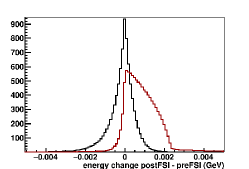
. The solid contour shows the shift in the distribution after correction is made to the interaction energy with correction 01 of Table 1. There is negligible deformation in the direction compared to the shift in .
The single-TKI measurements for CCQE-like events, which include a lepton, at least one proton and no mesons in the final state, are defined in Ref Lu et al. (2016):
| (10) | |||
| (11) |
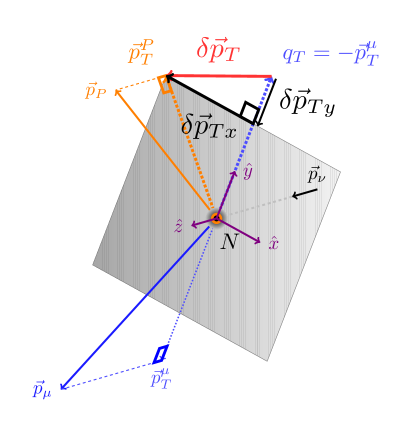
where and are the components of proton and muon momenta in the plane perpendicular to the neutrino direction. The single-TKI variable and its decompositions along the Cartesian coordinate system defined with respect to the neutrino and muon kinematics are illustrated in Fig. 2 and mathematically defined as
| (12) |
Here, is the neutrino direction, is anti-parallel to the muon transverse direction while is perpendicular to along the normal of neutrino-muon plane. The coordinate system describing and is relative to the neutrino and muon kinematics. Specifically is along the transverse component of 3-momentum transfer, is along the neutrino direction and there is no 3-momentum transfer in the direction. Both and can be measured from the final state particles. Any interaction energy effect will mostly affect the 4-momentum transfer and . For CCQE events, is expected to symmetrically distribute on both sides of the neutrino-muon interaction plane.
can be defined in terms of as:
| (13) |
Here is positive if the proton has gained momentum along . Figure 3 illustrates the relationship between and as the different projections of in the Cartesian and the polar coordinate systems respectively. The resulting distribution in the and residuals provides insights into other nuclear effects affecting the cross section, such as FSIs, the Fermi motion and two-particle-two-hole (2p2h) processesLu et al. (2018).
IV Sensitivities to interaction energy implementation
The shapes of and are affected by nuclear effects. The non-zero width of for the QE portion of the signal is largely due to the Fermi motion of the target nucleus. The average Fermi momentum in Carbon is approximately . In the absence of FSI effects, this is the only momentum available in the direction. FSIs could alter the outgoing protons’ directions, but in Carbon, an outgoing nucleon typically exits without interacting with the nucleus, or interacts with the nucleus elastically producing a small change in direction.
The momentum transferred to the hadronic system is confined in the plane. On an event by event basis, the nuclear potential may alter this momentum as well, and therefore the direction of the final state nucleon, but this effect averages to zero because the initial state nuclear momentum is on average zero. Therefore, changes to the interaction energy at the event vertex, on average, only alter . Mathematically, the effect of the interaction energy is as follows:
For an outgoing nucleon with energy before it has left the region of nuclear potentials, its momentum as a function of an energy shift due to the interaction energy is:
| (14) |
where and . In the limit
| (15) |
we can approximate by
| (16) |
Defining , we can write the 4-momentum conservation equation without FSI as:
| (17) |
where are components of the 3-momentum transfer , are components of Fermi motion . In this picture, is directly measurable as the transverse component of muon momentum, with magnitude , but cannot be directly measured and estimates depend on the model used to calculate neutrino energy.
The transverse components of the 3-momentum imbalance are
| (18) | ||||
| (19) |
where we have assumed and because the Fermi momentum is large compared to the interaction energy-induced change in momentum. In the limit , and are the transverse components of the Fermi momentum, . The effect of energy shift, , in each component of is then proportional to that component of . When , the shift in will be larger than the shift in . In both components, the interaction energy effects acting on the Fermi momentum will average to zero, whereas the effects on from will yield a net average shift in . For events in genie2.12.10, there is approximately offset in . The last column in Table 1 shows how applying energy corrections to the final state proton affects the average QE peak positions in .
V Apparatus and Methodology
The measurements of differential cross sections in and with the detector Aliaga et al. (2014) use the same sample and methodology of the measurements described in Ref Lu et al. (2018). The signal requires no pions, one muon, and at least one proton in the final state, satisfying
| (20) | ||||
| (21) |
where and ( and ) are the final-state muon (proton) momentum and opening angle with respect to the neutrino direction, respectively. The data set corresponds to 3.28 protons on target (POT) delivered between 2010 and 2012 by the NuMI beam line Adamson et al. (2016a) at Fermilab. For this beam, the integrated flux is predicted to be Aliaga et al. (2016).
Neutrino interactions are simulated with genie 2.8.4 Andreopoulos (2009) in both a nominal form, and also with a “tune” (mnvgenie-v1.0.1). The nominal genie generates initial states with a modified Fermi Gas model containing contributions from the Bodek-Ritchie tail Bodek and Ritchie (1981). The CCQE cross-section is produced by the Llewellyn Smith formalism Llewellyn Smith (1972), with a dipole axial form factor with axial mass . Resonant pion production is modeled by the Rein-Sehgal Rein and Sehgal (1981) model. Deep inelastic scattering is simulated with a Quark-Parton Model parameterized with the Bodek-Yang structure functions Bodek and Yang (2002). FSI is simulated with the genie hA model.
The tuning is based on mnvgenie-v1, which has been applied in previous publications Lu et al. (2018); Ruterbories et al. (2019); Patrick et al. (2018). mnvgenie-v1 includes the Valencia two-particle-two-holes (2p2h) model Nieves et al. (2013); Gran et al. (2013); Schwehr et al. (2016) for two-body current simulation. Furthermore, the interaction strength of this 2p2h model has been tuned to inclusive scattering data Rodrigues et al. (2016a), resulting in a significant enhancement relative to the Valencia model in a restricted region of energy-momentum transfer. mnvgenie-v1 also includes a non-resonant pion reduction to 43% of the nominal as constrained by comparisons with bubble chamber deuterium data Wilkinson et al. (2014); Rodrigues et al. (2016b). There is also a modification to the collective excitations of the nucleus for the CCQE channel, approximated as a superposition of 1p1h excitations and calculated with the Random Phase Approximation (RPA) in Ref Nieves et al. (2004) and uncertainties in Ref Gran (2017). The effects of non-resonant pion production and RPA in this analysis are negligible.
On top of the mnvgenie-v1 tuning, mnvgenie-v1.0.1 removes QE events with elastic nucleon-nucleus FSI, replacing them with events where there is no FSI, to remove the effect of a mistake in genieś implementation of the elastic nucleon-nucleus FSI. The primary effect in the final state is in the angular distribution of outgoing protons. A detailed discussion of this mistake can be found in Appendix B.
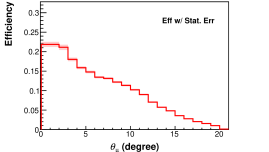
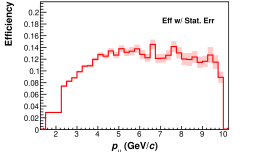
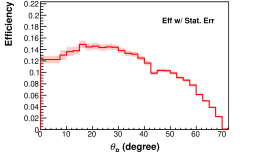
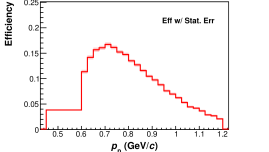
Reconstructed events with one muon and at least one proton in the tracker satisfying Eq.(20)-(21) are selected. Figure 4 shows the reconstruction efficiencies of the muons and the protons due to event selection and detector acceptance.
Only the muons which exit from the back of the detector and end up in the MINOS detector can be fully reconstructed. The muon momentum lost inside is measured by energy deposits. The momentum in MINOS is estimated by range or curvature, which depends on whether the muon is contained in the MINOS spectrometer.
Proton identification is done with a track-based algorithm which could reconstruct the proton energy (including rescattered protons) to energy resolutionWalton et al. (2015). An additional selection is applied on these protons to favor ones that interact elastically and contained (ESC) within the CH tracker, which improves the energy resolution to Lu et al. (2018); Lu and Betancourt (2017). The ESC requirement impacts the selection efficiencies for protons with higher momentum, which tend to rescatter inelastically more often.
The reconstructed proton energy and angular resolutions are and , while the reconstructed muon energy and angular resolutions are and . The resolutions of the composite variables and have been evaluated to be and respectively.
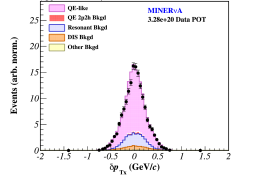
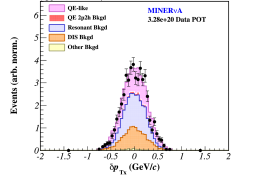
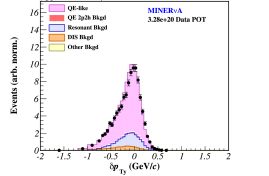
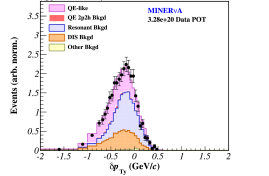
After the event selection, background contributions are estimated using predictions from genie 2.8.4. The predicted background consists of events with pions in the final states, which mostly comes from RES and DIS interaction channels. The background is then constrained with a data-driven method with sidebands described in Ref Walton (2014). The event rate in the signal region and in a representative sideband for and are shown in Fig. 5. In this figure, the sideband sample shown contains events with off-track visible recoil energy between and . Four sidebands with different visible recoil energy are used to constrain the backgrounds in bins of proton from to . Separate weights are used for inelastic events with a baryon resonance events and for other, higher , inelastic backgrounds.
After subtracting the fitted background, the signal fraction is treated with an iterative unfolding procedure D’Agostini (1995) to account for the detector resolution Lu et al. (2018). Four iterations are chosen Lu et al. (2018) to balance model bias and statistical uncertainties in the unfolded distribution. The stability of the unfolding with four iterations is studied by unfolding different pseudodata sets with model variations different from our assumed cross section model. As an extreme test, one of the variations we study for each of and puts in a large, non-physical, asymmetry in the relevant distribution. For each of these pseudodata studies, we compare the consistency of the unfolded pseudodata with the input model assumption as a function of number of iterations. For each pseudodata set, statistical uncertainties are added about the mean data prediction from the mode variation. One thousand pseudodata sets are created for each study. We find that four iterations of unfolding are sufficient to achieve good agreement, where the metric for agreement is the mean from the comparisons of unfolded pseudodata to its true distribution. We also verify that the mean fails to decrease significantly with additional iterations.
The unfolded data is corrected for the predicted efficiency calculated as ratio between the predicted and selected number of simulated events in each bin. The efficiencies for and in the QE region are constant at with relative variations and slowly falls by a factor of 2 over the regions . The flux-averaged differential cross sections are then obtained by normalizing the efficiency-corrected distribution with the number of target nucleons () and the predicted flux.
Uncertainties on () result from statistical fluctuations and uncertainties in the NuMI flux prediction, the genie modelling, and the detector response. The uncertainties are propagated throughout the cross section extraction procedure, and the results are summarized in Fig. 6.

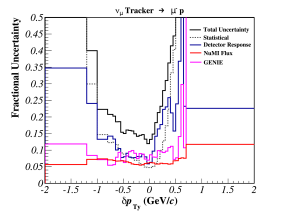
The final differential cross sections in and are reported over . Each broad category of systematic uncertainties, neutrino flux, detector response, and assumed interaction model (“genie”) ranges between to within this region. The largest contributing factor to uncertainty in the detector response is the tracking efficiency; the largest uncertainty in the neutrino interaction model is genie’s model of pion absorption in final state interactions.
VI Results and Discussions
Model comparison is facilitated with the nuisance Stowell et al. (2017) neutrino interaction cross section comparison package. For the primary comparison with data, we use genie 2.12.10 with the Valencia 2p2h model replacing the default empirical 2p2h model. nuisance is used to apply the mnvgenie-v1.0.1 tune that is described above. genie 2.12.10 and genie 2.8.4 have consistent model implementations. A careful internal study indicates the main difference for this analysis is an increase of by from changes to the nuclear masses in genie.
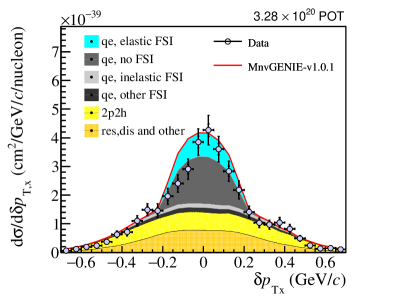
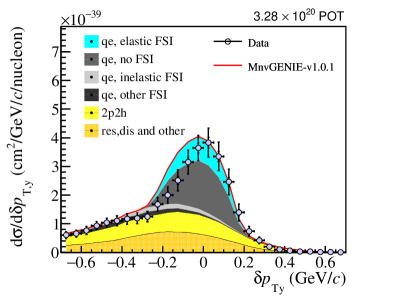
The unfolded cross section results are shown in Fig. 7. The and cross sections are in the top and bottom panels respectively. There are significant non-QE contributions for both distributions. Of these about half are due to the tuned 2p2h. For each cross section, the QE distribution is broken down into the generated FSI modes. Here, the genie no FSI means the final state nucleon exited the nucleus without interaction; elastic FSI refers to elastic nucleon-nucleon scattering which typically involves scattering angles less than ; and inelastic FSI refers to events with knockout of one or more additional nucleons. The other FSI category includes channels such as charge exchange multi-nucleon knockout, and pion production/absorption during nucleon transport. Appendix B describes an error in genie’s implementation of elastic FSI, the fix we implemented, and the effect of the fix on the predictions and the analysis.
VI.1 Distribution in
The measured differential cross-sections in and exhibit a QE peak near . If the interaction occurred on a free nucleon, then we would expect a delta function at because the muon and proton final states must balance. The width of the QE peak mostly results from Fermi motion.
The measured cross-section in in the peak region is wider in the data than in the reference model. While our correction to simulation of elastic FSI does not precisely reproduce a “fixed” elastic FSI, the width of the predicted no FSI contribution itself is larger than the data. If we assume no significant deviation in the non-QE distributions, then the discrepancy could imply an overestimation of the Carbon Fermi momentum, or a reduction in the total fraction of the no FSI contribution, or both.
Besides the width discrepancy, the data distribution in visually leans towards the positive side.
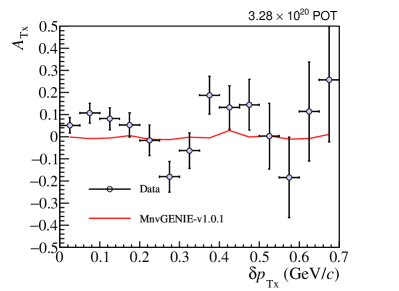
To measure the significance of the asymmetry, we define the bin-by-bin asymmetry between the positive and negative sides of the differential cross section in as:
| (22) |
where is the cross section at either bin. The resulting distribution is reported in Fig. 8, where observation of bin-by-bin asymmetries in the data and their significances in different ranges of are reported in Table 2. None of the generators used in this study reproduce the asymmetric feature, where mnvgenie-v1.0.1 is shown as an example.
| Range ( GeV) | /ndf |
|---|---|
The total asymmetry is defined as:
| (23) |
with being the integrated cross sections on the left/right side of the neutrino-muon plane. The result is
| (24) |
where the uncertainty is calculated from the covariance matrix in the Supplemental Material.
Such an asymmetry has been suggested to result from the pion absorption contributions to the signal Cai et al. (2019). Measurements of single-pion production at low energy in deuterium Radecky et al. (1982) and single- production by Altinok et al. (2017) have seen positive pion asymmetries about the neutrino-muon plane. The correlated proton angular distributions in this measurement, from baryon resonance production with an unobserved absorbed pion, could exhibit an opposite asymmetry.
VI.2 Distribution in
Unlike in the distribution, we observe a non-QE tail towards the negative values. Inelastic events such as 2p2h, resonance and DIS are inefficient at transferring the lepton momentum to the final state nucleons, since multiple initial states particles are often involved. Therefore the protons tagged in the non-QE events will in general have less momenta then the muons, and are shifted to the left.
The two sets of corrections proposed in Table 1 are made to the final states muons and protons in mnvgenie-v1.0.1’ CCQE contribution in the MC sample. The effect of correction 1, with only, and correction 2, with both and corrections, are shown in Fig. 9. The effects of is on the order of as it mainly affects nucleons at low kinetic energies.
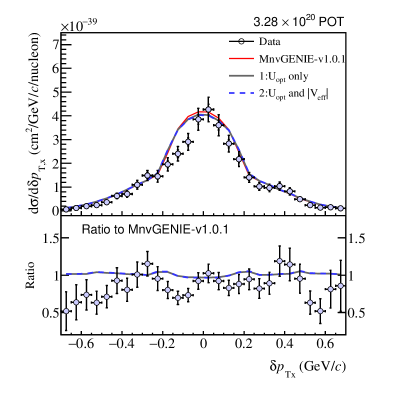
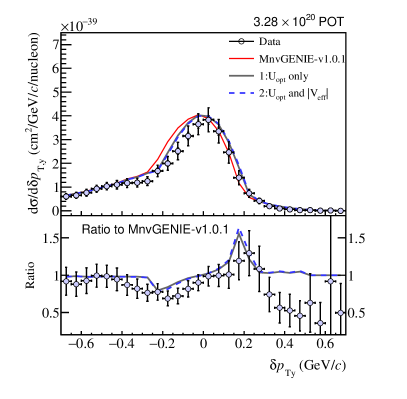
Almost all of the shift comes from adding the Moniz interaction energy for Carbon () back to the final state proton, and removing the average excitation energy () from the muon. These corrections alone shift the peak to the right. Application of the optical potential partly cancels the shift, resulting in a net shift of . However, the addition of the Coulomb effect shifts the peak back, nearly canceling the effect of the optical potential, for a net shift including both effects of .
The ratios, in the lower panels of Fig. 9, of the corrected models and the data to mnvgenie-v1.0.1 show the same upward-going trend in the QE peak region between . This trend is characteristic of a peak shift, and the similarities lend confidence to the validity of the theoretically motivated corrections.
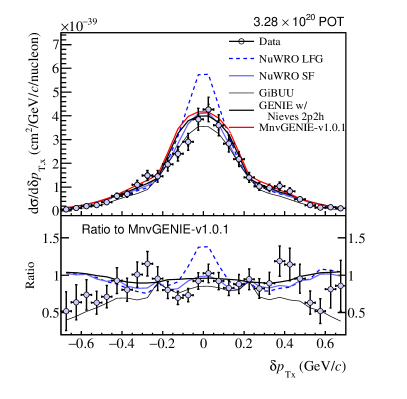
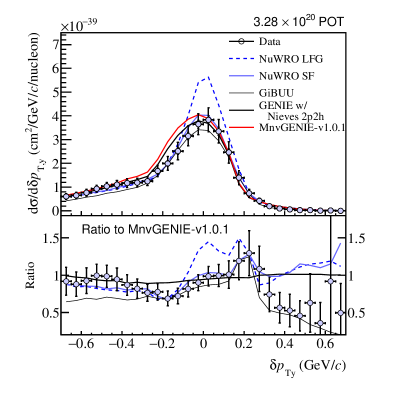
Figure 10 and Fig. 11 compares nuwro Local Fermi Gas (LFG), nuwro Spectral Function (SF), gibuu, the nominal genie, mnvgenie-v1.0.1, as well as neut SF and LFG, distributions normalized to data cross sections. In terms of , the nominal genie with Nieves 2p2h does not depart much from the overall peak offset seen in mnvgenie-v1.0.1, the ratio between which is nearly flat. The modifications to the 2p2h fraction, the non-resonant pion reweighting and RPA introduced by the tune have little effect on the position of the peak, since their effects are nearly constant at the QE peak. Data to mnvgenie-v1.0.1 ratio, and in fact the ratios of all other models to mnvgenie-v1.0.1, except nuwro LFG follow very similar trends. The nuwro SF and gibuu models both have better agreements with data while nuwro LFG has overall disagreement in cross section.
The nuwro models include nuclear effects such as Pauli blocking and the Coulomb potential. The nuwro SF model, in particular, includes an effective potential simulating the optical potential. The effective potential is validated against electron scattering data on targets including Ankowski and Sobczyk (2008), a nucleus similar to Bodek and Cai (2019). The nuwro LFG has larger disagreement with the data. However, the average Fermi motion of the typical LFG models produces a narrower width in the QE peak than that of the Fermi momentum in regular Fermi gas models. This produces a narrower peak more suggestive of the data.
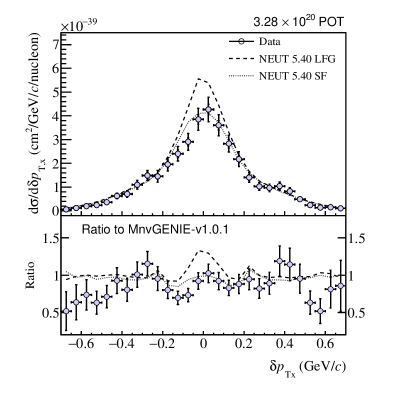
The neut SF describes the QE peak location well, while the LFG shifts the peak location by more than . In fact neut SF describes both and very well near the peak regions.Unlike the nuwro variant, neut LFG predicts wider QE width in while at the same time produces width in comparable to that of the data.
gibuu models the initial state nucleons with a local Thomas-Fermi approximation, and the nucleons are bound in a mean-field potential, where Pauli blocking is naturally simulated. The final state particles propagating through the nuclear medium are subject to a scalar potential that usually depend on both the nucleon momentum and nuclear density Leitner and Mosel (2010). These features of gibuu do not contribute to an especially superior description of the QE peak. Unrelated to the description of the peak, the tail distributions of the single-TKI quantities are sensitive especially to the 2p2h component and pion production followed by pion absorption with proton knockout. With a lower proton threshold than this analysis, it could include significant amounts of QE events followed by FSI. gibuu seems to be quite adept at predicting three of the four tails of these signal distributions, while the other generators systematically overestimate these regions.
We investigate the agreement of the measurement with model predictions using a weighted average, , defined as
| (25) | ||||
| (26) |
where and are the cross section and position in the -th bin, span over the summed range. The calculation of the variance takes into account the covariance matrix , which contains the correlated errors between the th and th bins. The covariance matrices for , and the variables reported in Ref Lu et al. (2018) are available as digital data release.
The computation of is sensitive to the range selected due to the underlying non-QE contribution. The momentum range is chosen because it is dominated by the QE events. The results are summarized in Fig. 12.
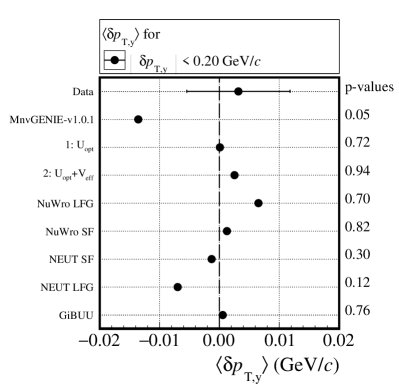
For each model, a p-value is calculated under the assumption of normally distributed uncertainties on the data. The average peak positions of mnvgenie-v1.0.1 lie outside uncertainty range of the data. Measurable shifts to larger are observed when interaction energy corrections are applied. The shifts are on the order of to , consistent with corrections made to the underlying model. The measurements disfavor the default genie removal energy implementation, but does not distinguish between the nuclear potential corrections. Among the models nuwro SF, neut SF and gibuu models are comparable to the data average, while nuwro and neut LFGs have larger disagreement with the data. Between them, neut LFG peaks outside the measurement uncertainties.
| POT Normalized | -0.2 -0.1 GeV | -0.1 0.0 GeV | 0.0 0.1 GeV | 0.1 0.2 GeV | -0.2 0.2 GeV | -0.7 0.7 |
| genie Nominal | 41.1/2 | 19.0/2 | 0.743/2 | 13.5/2 | 52.9/8 | 69.5/28 |
| mnvgenie-v1.0.1 | 89.0/2 | 38.9/2 | 0.184/2 | 13.7/2 | 100/8 | 72.5/28 |
| 1: only | 32.4/2 | 22.5/2 | 2.73/2 | 18.8/2 | 38.2/8 | 111/28 |
| 2: and | 27.7/2 | 19.6/2 | 3.71/2 | 30.2/2 | 45.6/8 | 111/28 |
| nuwro LFG | 25.1/2 | 159/2 | 130/2 | 15.5/2 | 50.7/8 | 131/28 |
| nuwro SF | 10.6/2 | 8.87/2 | 1.46/2 | 0.296/2 | 6.66/8 | 60.0/28 |
| neut 5.40 LFG | 43.6/2 | 113/2 | 82.6/2 | 0.842/2 | 52.6/8 | 75.9/28 |
| neut 5.40 SF | 7.31/2 | 9.03/2 | 0.397/2 | 0.302/2 | 4.41/8 | 54.3/28 |
| gibuu | 1.50/2 | 3.81/2 | 6.85/2 | 6.04/2 | 7.70/8 | 45.0/28 |
Next, we calculate distributions in four consecutive, disjoint ranges dominated by QE interactions to illustrate the mismodelling in the mnvgenie-v1.0.1 simulations. Table. 3 summarizes the results. The in for mnvgenie-v1.0.1 is not symmetric about 0, where the falling side , with , is in much better agreement with the data than the rising side with .
The corrections for mnvgenie-v1.0.1 reduce the model asymmetry, bringing the at the left edge from to the order of . The for the right edge increases from to and between corrections 1 and 2. The total between is reduced by more than after the corrections are applied. The overall s for mnvgenie-v1.0.1 is , while both its corrections are for 28 degrees of freedom.
Other Fermi gas-based models, such as nuwro LFG and neut LFG, in general have better than the genie variations. The nuwro LFG in the edges are more consistent with each other, at and respectively. The neut LFG, on the other hand, seems to suffer from model asymmetry similar to mnvgenie-v1.0.1, but the cause might be due to a systematic excess in cross section predicted in the negative tail of the distribution, as shown in Fig. 11. The tail is dominated by non-QE interactions. In contrast, spectral function models and gibuu predict very well.
| POT Normalized | -0.2 -0.1 GeV | -0.1 0.0 GeV | 0.0 0.1 GeV | 0.1 0.2 GeV | -0.2 0.2 GeV | -0.7 0.7 GeV |
| genie Nominal | 26.0/2 | 31.6/2 | 3.40/2 | 4.03/2 | 26.4/8 | 69.5/28 |
| mnvgenie-v1.0.1 | 38.6/2 | 40.4/2 | 4.00/2 | 9.11/2 | 34.5/8 | 67.2/28 |
| 01: only | 36.3/2 | 35.2/2 | 4.02/2 | 9.40/2 | 35.0/8 | 67.4/28 |
| 02: and | 36.2/2 | 34.4/2 | 4.03/2 | 9.55/2 | 35.2/8 | 67.8/28 |
| nuwro LFG | 22.2/2 | 85.5/2 | 31.4/2 | 4.72/2 | 58.7/8 | 132/28 |
| nuwro SF | 8.79/2 | 20.1/2 | 0.831/2 | 1.48/2 | 16.6/8 | 63/28 |
| neut 5.40 LFG | 21.4/2 | 73.3/2 | 19.0/2 | 5.82/2 | 43.5/8 | 85.2/28 |
| neut 5.40 SF | 10.2/2 | 24.8/2 | 1.36/2 | 0.632/2 | 17.5/8 | 58.3/28 |
| gibuu | 1.69/2 | 11.7/2 | 7.69/2 | 1.27/2 | 11.9/8 | 40.6/28 |
VII Summary and outlook
The variables and are measured on the CH target in . We expect to be sensitive to the Fermi momentum in QE and there is tension between data and MC. The data is narrower than the genie model, as is true of most models other than a simple Fermi gas. The measurement also shows a statistically marginal proton asymmetry in of . This asymmetry, if truly non-zero, might be attributed to pion absorption events included in the signal. No model in current event generators predicts an asymmetry. Future measurements could verify the presence of this asymmetry.
The observable shows sensitivity to the interaction energy implemented in nuclear models. In particular, the measurement, which is based on genie, disfavors the default genie implementation of the interaction energy on Carbon. This implementation lacks the excitation energy while subtracts an extra Moniz interaction energy from the final state proton. The average peak positions between genie and data differ by more than 1.5. Approximate corrections accounting for the excitation energy and Moniz interaction energy bring the average peak position within 1 of the data. This measurement is not precise enough to distinguish the more subtle nuclear effects such as the optical potential and the Coulomb potential. To first order more statistics could reduce the overall uncertainties in the distributions. Further improvements in the overall uncertainties need to come from better constrained flux, detector response and signal model, especially in the modelling of pion absorption in the nucleus.
We have compared different Monte Carlo models with respect to and . The measurements are based on the mnvgenie-v1.0.1 tune of genie, which removes the elastic FSI components in genie on top of the mnvgenie-v1 base tune. This modification subsequently impacts the single-TKI measurements performed in Ref Lu et al. (2018). The elastic FSI is discussed in Appendix B. The Supplemental Material to this paper contains an update to the single-TKI results presented in Ref Lu et al. (2018) based on this modification.
Future analysis using the medium energy Adamson et al. (2016b) dataset will benefit from higher statistics, which will enable examination of correlations between , and other variables. In particular, probing the correlation of the asymmetry in with other variables may shed light on its origin. Other targets in and future liquid argon experiments could make measurements of , and the single-TKI variables in general, to test models on other nuclei.
This work was supported by the Fermi National Accelerator Laboratory under US Department of Energy contract No. DE-AC02-07CH11359 which included the construction project. Construction support was also granted by the United States National Science Foundation under Award PHY-0619727 and by the University of Rochester. Support for participating scientists was provided by NSF and DOE (USA), by CAPES and CNPq (Brazil), by CoNaCyT (Mexico), by Proyecto Basal FB 0821, CONICYT PIA ACT1413, Fondecyt 3170845 and 11130133 (Chile), by DGI-PUCP and UDI/VRI-IGI-UNI (Peru), by the Latin American Center for Physics (CLAF), by Science and Technology Facilities Council (UK), and by NCN Opus Grant No. 2016/21/B/ST2/01092 (Poland). We thank the MINOS Collaboration for use of its near detector data. We acknowledge the dedicated work of the Fermilab staff responsible for the operation and maintenance of the beam line and detector and the Fermilab Computing Division for support of data processing.
References
- Bodek and Cai (2019) A. Bodek and T. Cai, Eur. Phys. J. C79, 293 (2019), arXiv:1801.07975 [nucl-th] .
- Abe et al. (2018a) K. Abe et al. (T2K), Phys. Rev. Lett. 121, 171802 (2018a), arXiv:1807.07891 [hep-ex] .
- Lu et al. (2016) X.-G. Lu, L. Pickering, S. Dolan, G. Barr, D. Coplowe, Y. Uchida, D. Wark, M. O. Wascko, A. Weber, and T. Yuan, Phys. Rev. C 94, 015503 (2016).
- Lu et al. (2018) X.-G. Lu et al. (MINERA Collaboration), Phys. Rev. Lett. 121, 022504 (2018), arXiv:1805.05486 [hep-ex] .
- Abe et al. (2018b) K. Abe et al. (T2K Collaboration), Phys. Rev. D 98, 032003 (2018b).
- Andreopoulos (2009) C. Andreopoulos (GENIE Collaboration), Neutrino interactions: From theory to Monte Carlo simulations. Proceedings, 45th Karpacz Winter School in Theoretical Physics, Ladek-Zdroj, Poland, February 2-11, 2009, Acta Phys. Polon. B40, 2461 (2009).
- Hayato (2009) Y. Hayato, Neutrino interactions: From theory to Monte Carlo simulations. Proceedings, 45th Karpacz Winter School in Theoretical Physics, Ladek-Zdroj, Poland, February 2-11, 2009, Acta Phys. Polon. B40, 2477 (2009).
- Juszczak et al. (2006) C. Juszczak, J. A. Nowak, and J. T. Sobczyk, Nuclear Physics B - Proceedings Supplements 159, 211 (2006), proceedings of the 4th International Workshop on Neutrino-Nucleus Interactions in the Few-GeV Region.
- Buss et al. (2012) O. Buss, T. Gaitanos, K. Gallmeister, H. van Hees, M. Kaskulov, O. Lalakulich, A. B. Larionov, T. Leitner, J. Weil, and U. Mosel, Phys. Rept. 512, 1 (2012), arXiv:1106.1344 [hep-ph] .
- Gallmeister et al. (2016) K. Gallmeister, U. Mosel, and J. Weil, Phys. Rev. C94, 035502 (2016), arXiv:1605.09391 [nucl-th] .
- Hodgson (1971) P. E. Hodgson, Reports on Progress in Physics 34, 765 (1971).
- Smith and Moniz (1972) R. A. Smith and E. J. Moniz, Nucl. Phys. B43, 605 (1972), [Erratum: Nucl. Phys.B101,547(1975)].
- Aliaga et al. (2014) L. Aliaga et al. (MINERA Collaboration), Nucl. Instrum. Meth. A743, 130 (2014), arXiv:1305.5199 [physics.ins-det] .
- Adamson et al. (2016a) P. Adamson et al., Nucl. Instrum. Meth. A806, 279 (2016a), arXiv:1507.06690 [physics.acc-ph] .
- Aliaga et al. (2016) L. Aliaga et al. (MINERA Collaboration), Phys. Rev. D94, 092005 (2016), [Addendum: Phys. Rev.D95,no.3,039903(2017)], arXiv:1607.00704 [hep-ex] .
- Bodek and Ritchie (1981) A. Bodek and J. L. Ritchie, Phys. Rev. D 23, 1070 (1981).
- Llewellyn Smith (1972) C. H. Llewellyn Smith, Gauge Theories and Neutrino Physics, Jacob, 1978:0175, Phys. Rept. 3, 261 (1972).
- Rein and Sehgal (1981) D. Rein and L. M. Sehgal, Annals of Physics 133, 79 (1981).
- Bodek and Yang (2002) A. Bodek and U. K. Yang, Proceedings, 1st International Workshop on Neutrino-nucleus interactions in the few GeV region (NuInt 01): Tsukuba, Japan, December 13-16, 2001, Nucl. Phys. Proc. Suppl. 112, 70 (2002), [,70(2002)], arXiv:hep-ex/0203009 [hep-ex] .
- Ruterbories et al. (2019) D. Ruterbories et al. (MINERvA), Phys. Rev. D99, 012004 (2019), arXiv:1811.02774 [hep-ex] .
- Patrick et al. (2018) C. E. Patrick et al. (MINERA Collaboration), Phys. Rev. D97, 052002 (2018), arXiv:1801.01197 [hep-ex] .
- Nieves et al. (2013) J. Nieves, R. Gran, F. Sanchez, and M. J. Vicente Vacas, in 15th International Workshop on Neutrino Factories, Super Beams and Beta Beams (NuFact2013) Beijing, China, August 19-24, 2013 (2013) arXiv:1310.7091 [hep-ph] .
- Gran et al. (2013) R. Gran, J. Nieves, F. Sanchez, and M. J. V. Vacas, Phys. Rev. D 88, 113007 (2013).
- Schwehr et al. (2016) J. Schwehr, D. Cherdack, and R. Gran, (2016), arXiv:1601.02038 [hep-ph] .
- Rodrigues et al. (2016a) P. A. Rodrigues, J. Demgen, E. Miltenberger, et al. (MINERA Collaboration), Phys. Rev. Lett. 116, 071802 (2016a).
- Wilkinson et al. (2014) C. Wilkinson, P. Rodrigues, S. Cartwright, L. Thompson, and K. McFarland, Phys. Rev. D90, 112017 (2014), arXiv:1411.4482 [hep-ex] .
- Rodrigues et al. (2016b) P. Rodrigues, C. Wilkinson, and K. McFarland, Eur. Phys. J. C76, 474 (2016b), arXiv:1601.01888 [hep-ex] .
- Nieves et al. (2004) J. Nieves, J. E. Amaro, and M. Valverde, Phys. Rev. C70, 055503 (2004), [Erratum: Phys. Rev.C72,019902(2005)], arXiv:nucl-th/0408005 [nucl-th] .
- Gran (2017) R. Gran, (2017), arXiv:1705.02932 [hep-ex] .
- Walton et al. (2015) T. Walton et al. (MINERA Collaboration), Phys. Rev. D91, 071301 (2015), arXiv:1409.4497 [hep-ex] .
- Lu and Betancourt (2017) X.-G. Lu and M. Betancourt (MINERA Collaboration), Proceedings, 27th International Conference on Neutrino Physics and Astrophysics (Neutrino 2016): London, United Kingdom, July 4-9, 2016, J. Phys. Conf. Ser. 888, 012120 (2017), arXiv:1608.04655 [hep-ex] .
- Walton (2014) T. Walton, A Measurement of the Muon Neutrino Charged Current Quasielastic-like Cross Section on a Hydrocarbon Target and Final State Interaction Effects, Ph.D. thesis, Hampton U. (2014).
- D’Agostini (1995) G. D’Agostini, Nucl. Instrum. Meth. A362, 487 (1995).
- Stowell et al. (2017) P. Stowell et al., JINST 12, P01016 (2017), arXiv:1612.07393 [hep-ex] .
- Cai et al. (2019) T. Cai, X.-G. Lu, and D. Ruterbories, (2019), arXiv:1907.11212 [hep-ex] .
- Radecky et al. (1982) G. M. Radecky, V. E. Barnes, D. D. Carmony, A. F. Garfinkel, M. Derrick, E. Fernandez, L. Hyman, G. Levman, D. Koetke, B. Musgrave, P. Schreiner, R. Singer, A. Snyder, S. Toaff, S. J. Barish, A. Engler, R. W. Kraemer, K. Miller, B. J. Stacey, R. Ammar, D. Coppage, D. Day, R. Davis, N. Kwak, and R. Stump, Phys. Rev. D 25, 1161 (1982).
- Altinok et al. (2017) O. Altinok et al. (MINERA Collaboration), Phys. Rev. D 96, 072003 (2017).
- Ankowski and Sobczyk (2008) A. M. Ankowski and J. T. Sobczyk, Phys. Rev. C77, 044311 (2008), arXiv:0711.2031 [nucl-th] .
- Leitner and Mosel (2010) T. Leitner and U. Mosel, Phys. Rev. C81, 064614 (2010), arXiv:1004.4433 [nucl-th] .
- Adamson et al. (2016b) P. Adamson et al., Nucl. Instrum. Meth. A806, 279 (2016b), arXiv:1507.06690 [physics.acc-ph] .
- Harewood and Gran (2019) L. Harewood and R. Gran, (2019), arXiv:1906.10576 [hep-ex] .
Appendix A Derivations of GENIE corrections
The purpose of this correction is to modify the prediction of the genieevent generator for a different value of . In general, this correction could modify both the energy and three-momentum transferred to the nucleus, but have the freedom to pick some quantity which should be conserved event-by-event in this correction. We choose the magnitude of the three momentum transfer, . Changes to , , and angles and energies of the final state muon and proton follow. Denote the change in to be
| (27) |
and let
| (28) |
Then the energy conservation at the vertex in genie is
| (29) |
comparing to Eq.(7), we obtain
| (30) |
The difference in energy transfer manifests on the outgoing muon energy:
| (31) |
we obtain the energy correction to the genie muon:
| (32) |
The outgoing proton energy in genie is
| (33) |
Comparing to the right hand side of Eq.(7), we obtain
| (34) |
As noted above, this correction conserves energy, and assumes is constant. The fractional change to the of the system is approximately . For our sample, , produces a shift in , which causes changes to the hard scattering cross-section .
We can also evaluate how changes in angle of the muon and the proton that are neglected in the genie correction would affect the prediction. The muon momentum before and after the correction are:
| (35) | ||||
| (36) |
Solving the equation for to first order in , we have:
| (37) |
Note that the effect on the angle could become significant at small , but in this region becomes small, and in this region the recoiling protons in quasielastic events are also soft that such they do not enter our sample. For our events, .
For an interaction, the and are balanced at the vertex. Changing the must elicit a compensating change in the proton angle to conserve the momentum. In our correction, we neglect the small changes of angles above. This introduces a very small error in the calculation of for events that pass our selections, particularly the proton momentum cut. This error decreases with and is at most for . Therefore the simplifying assumption in our modification of genie that the muon and proton angles do not change is justified.
Appendix B GENIE elastic FSI simulation
This section will discuss the elastic FSI prediction and the fixes to it in more detail.

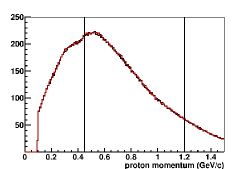
The prediction from mnvgenie-v1 in has three distinct regions shown in Fig. 13: a non-CCQE tail beyond , a no FSI CCQE dominated region in , which reflects the Fermi momentum, and an elastic FSI peak at . The genie elastic FSI is sharply peaked and much narrower than the underlying Fermi gas distribution. Since the protons in the elastic FSI peak follow the no FSI distribution before the FSI simulation, we expect the width of the elastic FSI distribution to be at least as large as that of the no FSI distribution.
Hints of the unphysical nature of the angular distribution already appeared in the original single-TKI analysis reported in Ref Lu et al. (2018). uses the default genie configuration of version 2.12 which uses the “hA” model for FSI. In this model, every nucleon experiences exactly one of the following fates: 1) no FSI, 2) charge exchange with single nucleon knockout, 3) elastic hadron+nucleus scattering, 4) inelastic single nucleon knockout, 5) multi-nucleon knockout (including pion absorption) and 8) pion production. An advantage of this model is that a reweighting technique can be used to modify the relative mix of fates without fully regenerating the Monte Carlo samples. This is convenient for studying FSI systematic effects with an analysis, similar to the existing FSI uncertainties available with the genie hA model.
The routine used to calculate all FSI reactions involving a two body scatter contains (in genie versions 2.6 to version 3.0.6) a mistake that affects hA fates “2” and “4” (nucleon knockout, with and without charge exchange) and fate “3” (elastic hadron nucleus scattering) for both protons and pions. Fate “3”, combined with quasielastic events and single-TKI variables, create the largest in observable distributionsHarewood and Gran (2019).
The primary effect is on the angular distribution of the scattered hadrons. In the QE case the original code causes too few of the most highly-transverse protons, which have low efficiency to be tracked in the planar design. It also produces a population, especially of QE events, with a very narrow angle distribution, and in quantities derived from those angular distributions, like many of the single-TKI observables. The angular distribution relative to the lepton and other hadrons are separately affected. This combination affects the predicted distributions presented in Ref Lu et al. (2018) in multiple ways. In addition, the resulting hadrons pick up an acceleration of up to . This is smaller than most hadronic energy uncertainties and has negligible role in selection or calorimetry. Instead it appears as an unphysical population in all single-TKI populations in Ref Lu et al. (2018). The largest effects of the distorted input model, after performing the iterative unfolding procedure, are on the acceleration angle and the coplanarity angle.
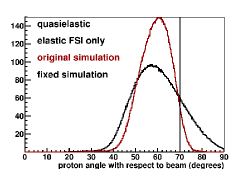
The study reported in Ref Harewood and Gran (2019) suggests reweighting up the no FSI fate and removing the elastic fate contributions will sufficiently mimic the proton distributions in a fixed code without having to regenerate all MC. Figure 14 shows the effect of fixing the genie code and comparing key QE proton distributions. The reason is that the intended elastic scattering angle for protons and neutrons is always small: 90% would be less than . For this analysis, the weights are only applied to genie quasielastic events; the distortion of angles for non-quasielastic events with multiple hadrons has a small effect on these distributions.
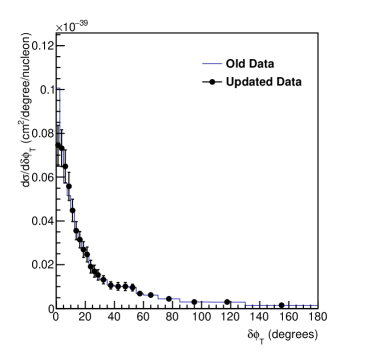
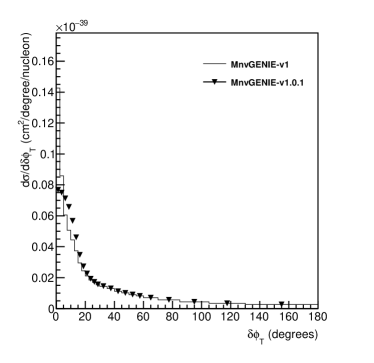
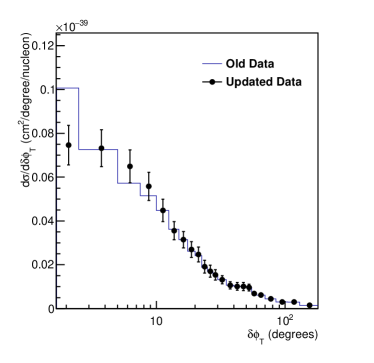
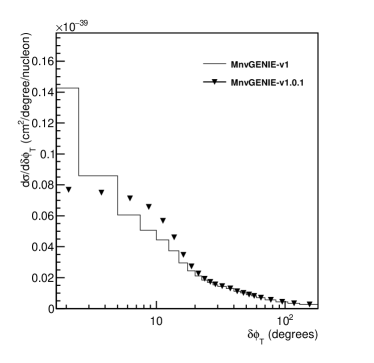
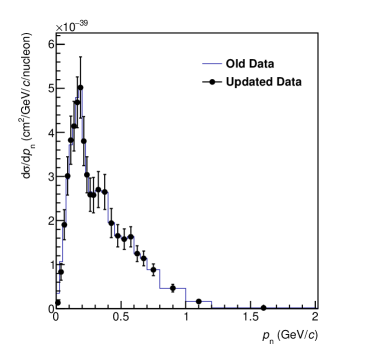
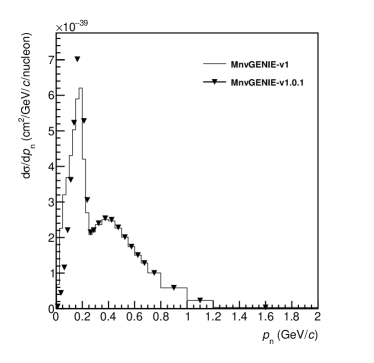
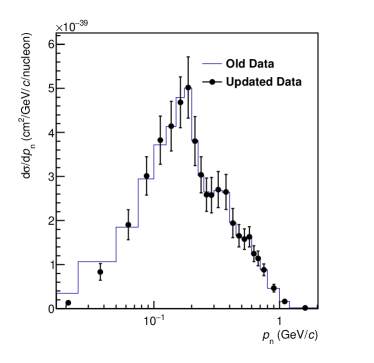
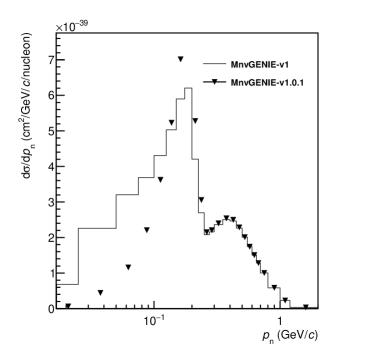
Figure 15 and 16 shows and respectively. The left plot shows the comparison between data extracted using the mnvgenie-v1 (Old Data) and the mnvgenie-v1.0.1 (Updated Data). The right plot compares the two MC models. All model distributions are modified significantly, but the extracted cross section shifts are only significant in the first bins of and .
Table 5 compares the old and updated data to the mnvgenie-v1.0.1 model. The two data extractions are consistent within 1 unit of reduced . The two data for and differ significantly only in the first bin, but the effect on is small.
| Variables | Old Data | Updated Data | DOF | in Reduced |
|---|---|---|---|---|
| 103 | 96.8 | 26 | 0.24 | |
| 25.6 | 26.4 | 13 | -0.062 | |
| 100 | 77.1 | 24 | 0.95 | |
| 48.1 | 30.0 | 26 | 0.70 |
The Supplemental Material to this paper contains an update to the single-TKI results presented in Ref Lu et al. (2018) based on this modification.
Citation of the new cross sections should include this paper and the original paper Lu et al. (2018) describing the full method.