MiSTree: a Python package for constructing and analysing Minimum Spanning Trees
††margin: DOI: \IfBeginWithhttps://doi.org/10.21105/joss.01721https://doi.org\Url@FormatString10.21105/joss.01721 Software • \IfBeginWith https://github.com/openjournals/joss-reviews/issues/1721https://doi.org\Url@FormatStringReview • \IfBeginWith https://github.com/knaidoo29/mistreehttps://doi.org\Url@FormatStringRepository • \IfBeginWith http://doi.org/10.5281/zenodo.3495008https://doi.org\Url@FormatStringArchive Submitted: 27 August 2019Published: 17 October 2019 License
Authors of papers retain copyright and release the work under a Creative Commons Attribution 4.0 International License (\IfBeginWithhttps://creativecommons.org/licenses/by/4.0/https://doi.org\Url@FormatStringCC-BY).
Summary
The minimum spanning tree (MST), a graph constructed from a distribution of points, draws lines between pairs of points so that all points are linked in a single skeletal structure that contains no loops and has minimal total edge length. The MST has been used in a broad range of scientific fields such as particle physics (to distinguish classes of events in collider collisions, see Rainbolt and Schmitt (2017)), in astronomy (to detect mass segregation in star clusters, see Allison et al. (2009)) and cosmology (to search for filaments in the cosmic web, see Alpaslan et al. (2014)). Its success in these fields has been driven by its sensitivity to the spatial distribution of points and the patterns within. MiSTree, a public Python package, allows a user to construct the MST in a variety of coordinates systems, including Celestial coordinates used in astronomy. The package enables the MST to be constructed quickly by initially using a -nearest neighbour graph (NN, rather than a matrix of pairwise distances) which is then fed to Kruskal’s algorithm (Kruskal 1956) to construct the MST. MiSTree enables a user to measure the statistics of the MST and provides classes for binning the MST statistics (into histograms) and plotting the distributions. Applying the MST will enable the inclusion of high-order statistics information from the cosmic web which can provide additional information to improve cosmological parameter constraints (Naidoo et al. 2019). This information has not been fully exploited due to the computational cost of calculating -point statistics. MiSTree was designed to be used in cosmology but could be used in any field which requires extracting non-Gaussian information from point distributions.
Motivation
Studies of point distributions often measure their 2-point statistics (i.e. the distribution of distances between pairs of points) which are then compared to theoretical models. This is a powerful technique and has been used very successfully in the field of cosmology to study the early Universe and the large scale distribution of galaxies. Unfortunately this statistic can only fully describe a distribution that is Gaussian, if it is non-Gaussian then the 2-point is no longer sufficient. The conventional method to incorporate non-Gaussian information is to look at the distribution’s -point statistic (if we look at the distribution of triangles, if we look at the distribution of quadrilaterals and so on). This method is well motivated as in principle all the information that can describe a distribution of points is contained within its -point statistics (see Szapudi and Szalay (1998)). However, calculating -point statistics even for becomes quickly intractable for large data sets.
The MST offers an alternative approach; the MST graph draws lines between pairs of points so that all points are linked in a single skeletal structure that contains no loops and has minimal total edge length. Unlike -point statistics, that typically scale by for points, the MST (computed using the Kruskal algorithm (Kruskal 1956) which sequentially adds edges, from shortest to longest, with the condition that the added edge does not form a loop) can be constructed much faster (at best ). While the MST does not contain all the information present in -point statistics, it enables some of this information to be captured and allows the identification of skeletal patterns, as such it has found a broad range of applications in physics: such as finding filaments in the distribution of galaxies (Alpaslan et al. 2014), classifying particle physics collisions (Rainbolt and Schmitt 2017) and mass segregation in star clusters (Allison et al. 2009). The MST has also been used in a number of other scientific field such as computer science, sociology and epidemiology.
While algorithms to construct the minimum spanning tree are well known (e.g. Prim (1957) and Kruskal (1956)) implementations of these often require the input of a matrix of pairwise distances. For a large data set the creation of this matrix (with elements) can be a significant strain on memory while also making the construction of the MST slower ().
MiSTree
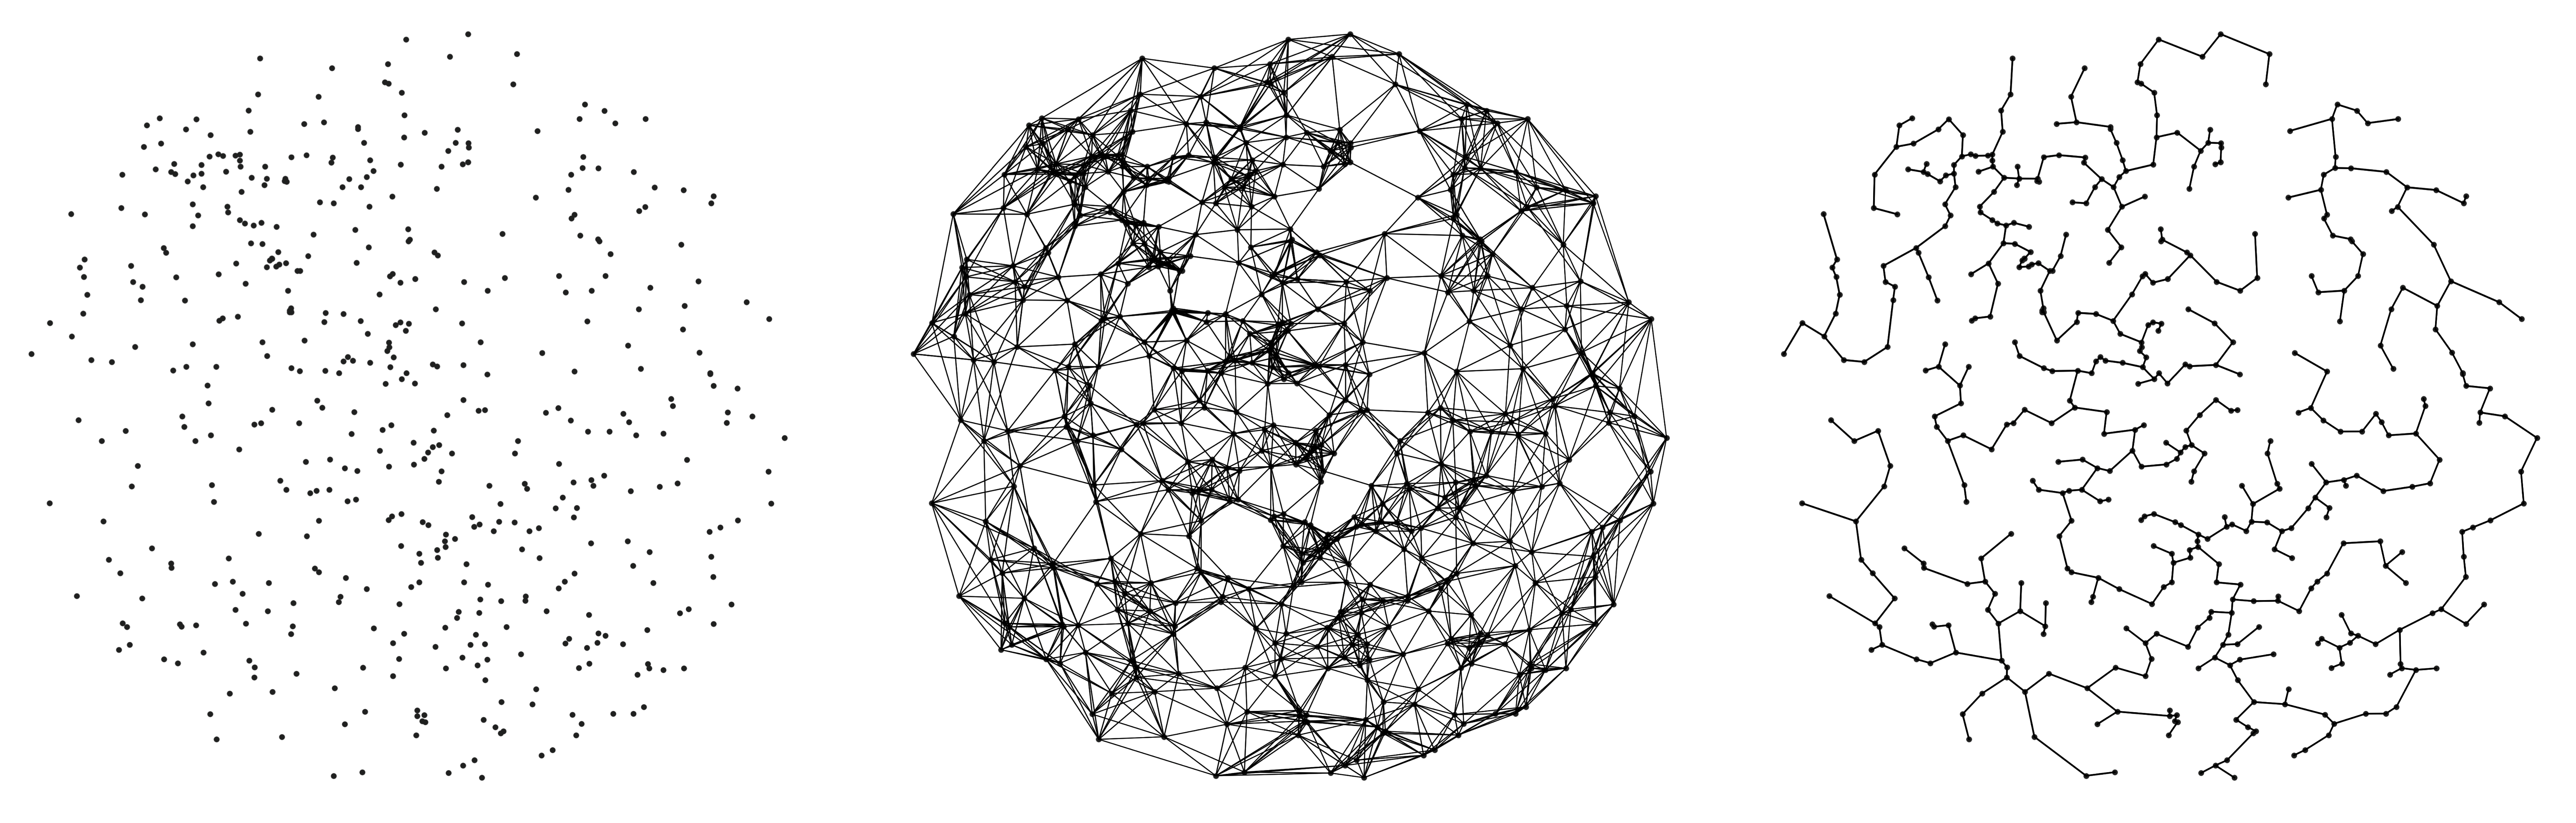
MiSTree is a public Python package for the construction and analysis of the MST. The package initially creates a -nearest neighbour graph (NN, a graph that links each point to the nearest neighbours, using scikit-learn’s \seqsplitkneighbours_graph function) which improves speed by limiting the number of considered edges from to (where ) and then runs the Kruskal algorithm (Kruskal 1956) (using scipy’s \seqsplitminimum_spanning_tree function). The stages of the MST construction are shown in Figure 1.
The MST can be constructed from data provided in 2/3 dimensions and in tomographic (on a unit sphere) or spherical polar coordinates. The weights of the edges are assumed to be the distances between points; i.e. the Euclidean distance for 2/3 dimension and spherical polar coordinates, and angular distances for tomographic coordinates. Furthermore, the package can very quickly measure the standard statistics:
-
•
degree () – the number of edges attached to each node.
-
•
edge length () – the length of edges in the MST.
While also being able to measure the statistics of branches, which are defined as chains of edges connected with degree :
-
•
branch length () – the sum of the lengths of member edges.
-
•
branch shape () – the straight line distance between the tips of branches divided by the branch length.
The statistics calculated by MiSTree are extensively explored in Naidoo et al. (2019) and found to significantly improve constraints on cosmological parameters when tested on simulations.
Basic Usage
To construct the MST using MiSTree from a distribution of points in 2 dimensions you would use the following commands:
import mistree as mist

# initialise MiSTree Minimum Spanning Tree class
mst = mist.GetMST(x=x, y=y)
mst.construct_mst()
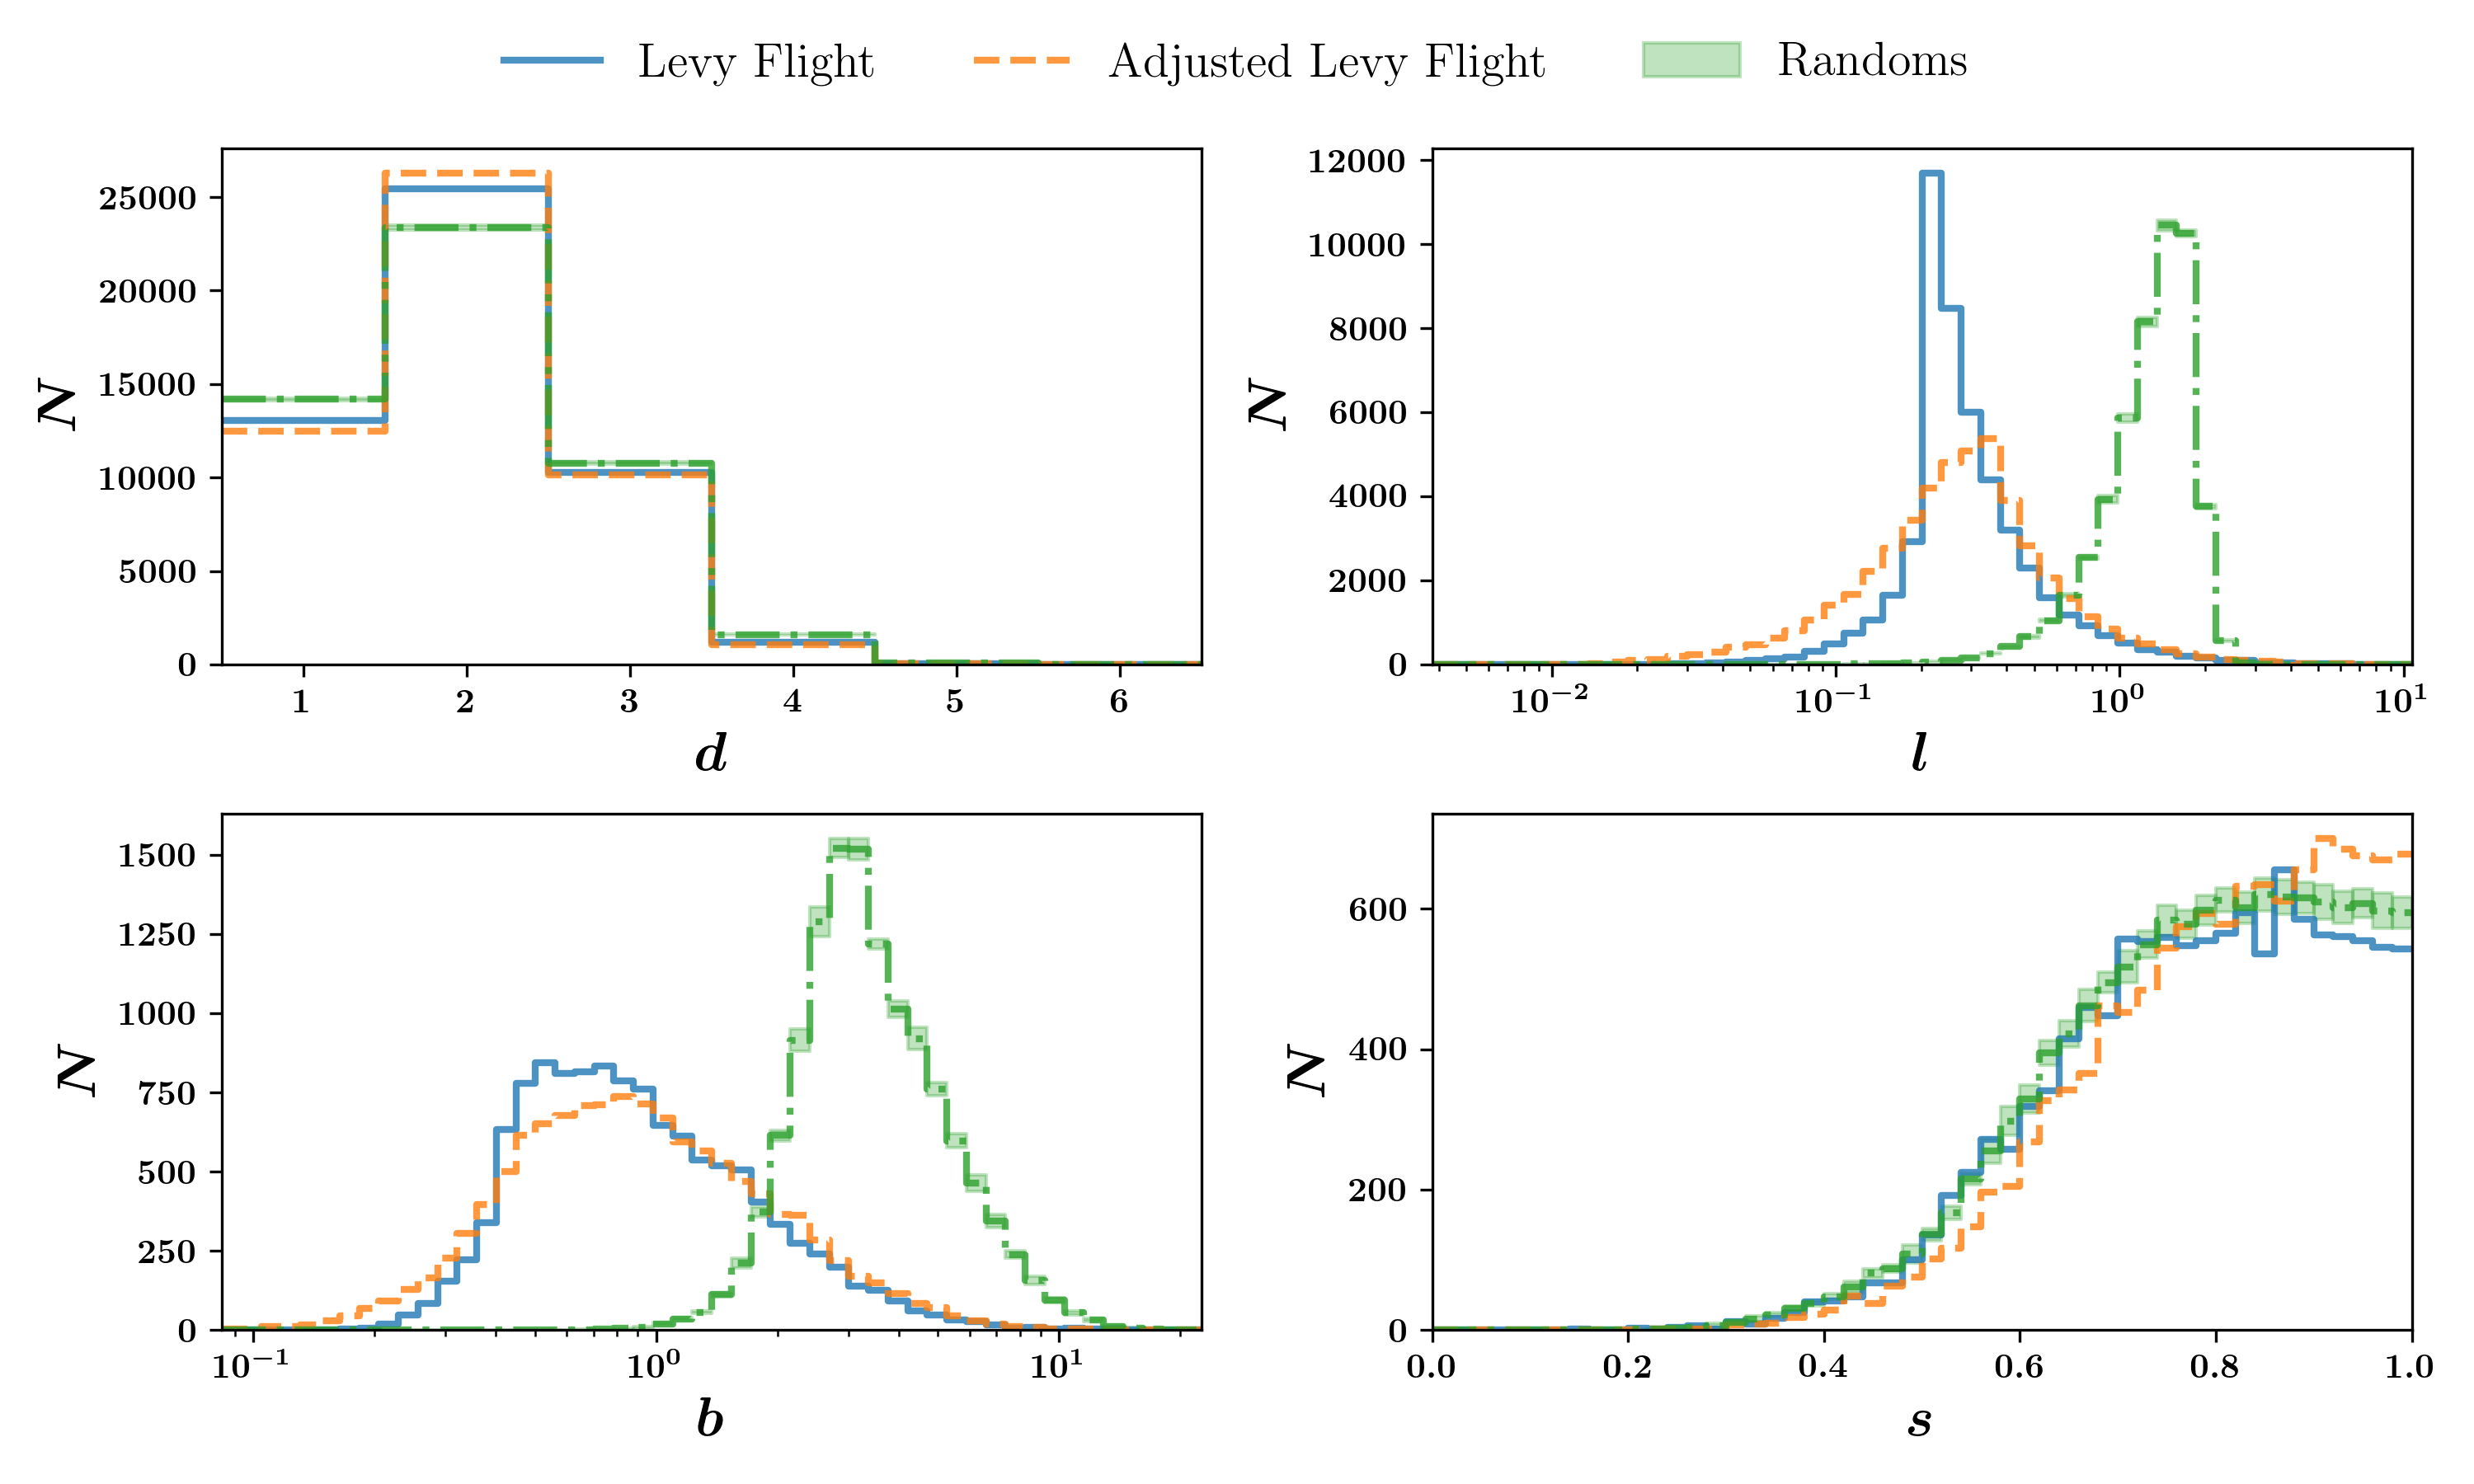
Once the MST is constructed it can either be used to look for features in the distribution or to measure statistics of the graph which in turn tell us about how points have been distributed. MiSTree can measure four statistics by default, which can be calculated directly after initialising the \seqsplitGetMST class (an example of the distribution of these statistics is shown in Figure 2):
d, l, b, s = mst.get_stats()
The source code can be found on \IfBeginWithhttps://github.com/knaidoo29/mistreehttps://doi.org\Url@FormatStringgithub while documentation and more complicated tutorials are provided \IfBeginWithhttps://knaidoo29.github.io/mistreedoc/https://doi.org\Url@FormatStringhere.
Dependencies
Dependencies for MiSTree include the Python modules numpy (Oliphant 2006), matplotlib (Hunter 2007), scipy (Jones et al. 2001), scikit-learn (Pedregosa et al. 2011) and f2py (Peterson 2009) (the latter of which is used to compile \seqsplitFortran subroutines).
Acknowledgement
I thank Ofer Lahav and Lorne Whiteway for their guidance and suggestions in developing this package and acknowledge support from the Science and Technology Facilities Council grant ST/N50449X.
References
Allison, R. J., S. P. Goodwin, R. J. Parker, S. F. Portegies Zwart, R. de Grijs, and M. B. N. Kouwenhoven. 2009. “Using the minimum spanning tree to trace mass segregation” 395 (May): 1449–54. doi:\IfBeginWithhttps://doi.org/10.1111/j.1365-2966.2009.14508.xhttps://doi.org\Url@FormatString10.1111/j.1365-2966.2009.14508.x.
Alpaslan, M., A. S. G. Robotham, S. Driver, P. Norberg, I. Baldry, A. E. Bauer, J. Bland-Hawthorn, et al. 2014. “Galaxy And Mass Assembly (GAMA): the large-scale structure of galaxies and comparison to mock universes” 438 (February): 177–94. doi:\IfBeginWithhttps://doi.org/10.1093/mnras/stt2136https://doi.org\Url@FormatString10.1093/mnras/stt2136.
Hunter, J. D. 2007. “Matplotlib: A 2d Graphics Environment.” Computing in Science & Engineering 9 (3). IEEE COMPUTER SOC: 90–95. doi:\IfBeginWithhttps://doi.org/10.1109/MCSE.2007.55https://doi.org\Url@FormatString10.1109/MCSE.2007.55.
Jones, Eric, Travis Oliphant, Pearu Peterson, and others. 2001. “SciPy: Open Source Scientific Tools for Python.” http://www.scipy.org/.
Kruskal, Joseph B. 1956. “On the Shortest Spanning Subtree of a Graph and the Traveling Salesman Problem.” Proceedings of the American Mathematical Society 7 (1). JSTOR: 48–50. doi:\IfBeginWithhttps://doi.org/10.2307/2033241https://doi.org\Url@FormatString10.2307/2033241.
Naidoo, Krishna, Lorne Whiteway, Elena Massara, Davide Gualdi, Ofer Lahav, Matteo Viel, Héctor Gil-Marín, and Andreu Font-Ribera. 2019. “Beyond two-point statistics: using the Minimum Spanning Tree as a tool for cosmology.” arXiv E-Prints, July, arXiv:1907.00989.
Oliphant, Travis. 2006. “NumPy: A Guide to NumPy.” USA: Trelgol Publishing. http://www.numpy.org/.
Pedregosa, F., G. Varoquaux, A. Gramfort, V. Michel, B. Thirion, O. Grisel, M. Blondel, et al. 2011. “Scikit-Learn: Machine Learning in Python.” Journal of Machine Learning Research 12: 2825–30.
Peterson, Pearu. 2009. “F2PY; a Tool for Connecting Fortran and Python Programs.” Int. J. Comput. Sci. Eng. 4 (4). Inderscience Publishers, Geneva, SWITZERLAND: Inderscience Publishers: 296–305. doi:\IfBeginWithhttps://doi.org/10.1504/IJCSE.2009.029165https://doi.org\Url@FormatString10.1504/IJCSE.2009.029165.
Prim, R. C. 1957. “Shortest Connection Networks and Some Generalizations.” The Bell System Technical Journal. doi:\IfBeginWithhttps://doi.org/10.1002/j.1538-7305.1957.tb01515.xhttps://doi.org\Url@FormatString10.1002/j.1538-7305.1957.tb01515.x.
Rainbolt, Jessica Lovelace, and Michael Schmitt. 2017. “The Use of Minimal Spanning Trees in Particle Physics.” JINST 12 (02): P02009. doi:\IfBeginWithhttps://doi.org/10.1088/1748-0221/12/02/P02009https://doi.org\Url@FormatString10.1088/1748-0221/12/02/P02009.
Szapudi, István, and Alexander S. Szalay. 1998. “A New Class of Estimators for the N-Point Correlations” 494 (1): L41–L44. doi:\IfBeginWithhttps://doi.org/10.1086/311146https://doi.org\Url@FormatString10.1086/311146.