Insight-HXMT observation on 4U 1608–52: evolving spectral properties of a bright type-I X-ray burst
Abstract
The evidences for the influence of thermonuclear (type-I) X-ray bursts upon the surrounding environments in neutron star low-mass X-ray binaries (LMXB) were detected previously via spectral and timing analyses. Benefitting from a broad energy coverage of Insight-HXMT, we analyze one photospheric radius expansion (PRE) burst, and find an emission excess at soft X-rays. Our spectral analysis shows that, such an excess is not likely relevant to the disk reflection induced by the burst emission and can be attributed to an enhanced pre-burst/persistent emission. We find that the burst and enhanced persistent emissions sum up to exceed Eddington luminosity by 40 percentages. We speculate that the enhanced emission is from a region beyond the PRE radius, or through the Comptonization of the corona.
1 Introduction
A low-mass X-ray binary (LMXB) hosting a neutron star (NS) occasionally undergoes outbursts with a series of thermonuclear (type-I) X-ray bursts accompanied. A type-I X-ray burst is caused by unstable thermonuclear burning of the accreted matter (hydrogen/helium) on the surface of a neutron star and manifests itself as a sudden increase in the X-ray luminosity followed by an exponential decay (for reviews, see Lewin et al., 1993; Cumming, 2004; Strohmayer & Bildsten, 2006; Galloway et al., 2008). The typical duration is about tens seconds. The most luminous bursts are the photospheric radius expansion (PRE) events, for which the peak flux is comparable to the Eddington luminosity.
The observations on bursts by RXTE (in’t Zand et al., 2013; Worpel et al., 2013; Ballantyne & Strohmayer, 2004; Keek et al., 2014), NICER (Keek et al., 2018, 2018a), AstroSat (Bhattacharyya et al., 2018) and Insight-HXMT (Chen et al., 2018), revealed interactions between the burst emission and the accretion environment: The continuum spectrum was observed to have an enhancement at soft X-ray and/or a shortage at hard X-rays (Worpel et al., 2013, 2015; Chen et al., 2012; Ji et al., 2013). Such spectral deviations are considered as burst induced, and may be relevant to disk reflection and corona cooling (Ballantyne & Strohmayer, 2004; Keek et al., 2014; Degenaar et al., 2018).
The reflection spectrum, consisting of discrete lines and a hump peaking at 20–40 keV, is interpreted as disk refection of the illuminant from the corona or the boundary-layer. The burst emission could also serve as an illuminant to the disk. However, so far only iron line is fairly detected during bursts, specifically during the superbursts.
4U 1608–52 is a Galactic transient LMXB located at Galactic plane (). It shows outbursts at a typical frequency of once per 1–2 years. Since its discovery by the two Vela-5 satellites (Belian et al., 1976), more than 100 type-I X-ray bursts were regularly observed and the distance was estimated as 2.9–4.5 kpc (e.g. Galloway et al., 2008; Poutanen et al., 2014).
Moreover, some bursts from 4U 1608–52 turn out to be the brightest ones ever seen by RXTE. They reached to a flux peak of 1.2–1.5 , with a burst oscillation revealed at frequency around =619 Hz (Muno et al., 2001; Galloway et al., 2008). However, no pulsation is visible in the continuum emission during the outbursts.
In this study, we analyze Insight-HXMT observations of 4U 1608–52 during a soft state of its 2018 outburst by focusing on one PRE burst. The paper is structured as that we show firstly the observations and data analysis, and then give the results derived during the burst. At last, we discuss the findings in the current burst-environment interaction scenario.
2 Observations and Data analysis
2.1 Swifit/XRT
Within the same day when Insight-HXMT detected a burst from 4U 1608–52, Swifit/XRT observed the same source. The XRT observation was performed 2 hours after the burst, from MJD 58304.644 to 58304.656. The OBSID is 00010741002, with an exposure time 1 ks and a count rate cts/s. The standard data process procedure of the timing mode is carried out (xrtpipeline), the spectra of source and background are extracted with grades 0-2. For the spectral fitting, the source spectrum is rebinned with at least 100 cts per channel.
2.2 Insight-HXMT
Hard X-ray Modulation Telescope (HXMT, also dubbed as Insight-HXMT, Zhang et al., 2014) excels in its broad energy band (1–250 keV) and a large effective area in hard X-rays energy band. It consists of three slat-collimated instruments: the High Energy X-ray Telescope (HE, 5000 , 20–250 keV), the Medium Energy X-ray Telescope (ME, 900 , 5–30 keV), and the Low Energy X-ray Telescope (LE, 400 , 1–10 keV).
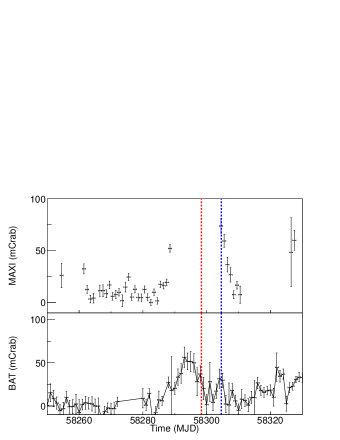
Two bursts are detected by Insight-HXMT from 4U 1608–52, as shown in Table 1. For the first burst, LE do not have good exposure, we take the second burst occurred at MJD 58304.549226. As shown in Fig. 1, the contemporary count rates of MAXI and BAT are 75 mCrab and 25 mCrab respectively, suggesting that the burst is located at the soft state of the outburst. By virtue of the quick read-out system of Insight-HXMT detectors, there is litter pile-up effect event at the PRE burst peak. HEASOFT version 6.22.1 and Insight-HXMT Data Analysis software (HXMTDAS) v2.01 are used to analyze the data. Only the small field of view (FoV) mode of LE and ME is used, for preventing from the contamination of near-by sources and the bright earth. Based on Swift/BAT source catalogue111https://swift.gsfc.nasa.gov/results/transients/ and MAXI source list222http://maxi.riken.jp/top/slist_ra.html, no bright source or active transient source is in the FoV of the three telescopes, as shown in the website of Insight-HXMT Bright Source Warning Tool333http://proposal.ihep.ac.cn/soft/soft2.jspx.
The good time interval is filtered with the following criteria: (1) pointing offset angles 0.05 degree; (2) elevation angles 6 degree; (3) the value of the geomagnetic cutoff rigidity 6 degree.
3 Results
3.1 pre-burst emission detected by Swifit/XRT and Insight-HXMT
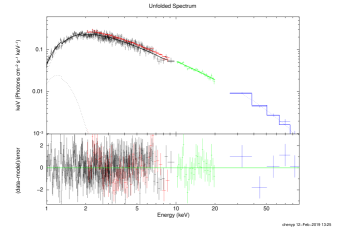
The non-burst/persistent emission is stable in our observations. We jointly fitted the persistent spectra observed with XRT and HMXT, as show in Fig. 2. During fittings, the LE and ME spectra are rebinned into channels having at least 100 cts, while the HE spectra are rebinned into 4 channels in 25–100 keV because of the poor statistics. The joint fit of the spectra covers an energy band of 1–10 keV for XRT and 2–10 keV, 10–20 keV and 25–100 keV for LE, ME and HE, respectively.
We fit the Swift/XRT and Insight-HXMT(LE, ME and HE) spectra with an absorbed thermal Comptonization model, available as nthcomp (ycki et al., 1999) in XSPEC. The hydrogen column (wabs in xspec) is fixed at 1.510 (Penninx et al., 1989), to account for both the line of sight column density and as well any intrinsic absorption near the source. In addition, a blackbody component is include corresponding to the emission from the region of the NS surface, the disk or boundary layer. Normalization constants are included during fittings to take into account the inter-calibrations of the instruments. We kept the normalization factor of the Swift/XRT data with respect to the Insight/HXMT data to unity. During the spectral analysis, a 3% systematic error is added to account for the uncertainties of the background model and calibration.
Using the model above, we find a acceptable fit:=1.08(dof 432; Fig. 2). The bolometric flux in 1–100 keV is , and with and keV. The constant of LE, ME and HE is 1.140.02, 1.170.02 and 1.170.07 respectively.
The self-consistent reflection model relxilllp (García et al., 2014), which calculates disc reflection features due to an illuminating power-law source, is also tried to fit the spectra, in a way to substitute the power-law (nthcomp) emission. The parameters of relxilllp are frozen to those in Degenaar et al. (2015), except for the normalization , the index and cut-off energy of the power law. This results in an acceptable fit as well with a reduced: =1.10(=433), although with the parameters (Degenaar et al., 2015) derived from the hard state of 4U 1608–52.
We explore a number of different fits, e.g., absorbed diskbb+powerlaw or diskbb+nthcompt, and find that these models can also give acceptable fit to the joint XRT and Insight-HXMT data.
3.2 burst lightcurves by Insight-HXMT
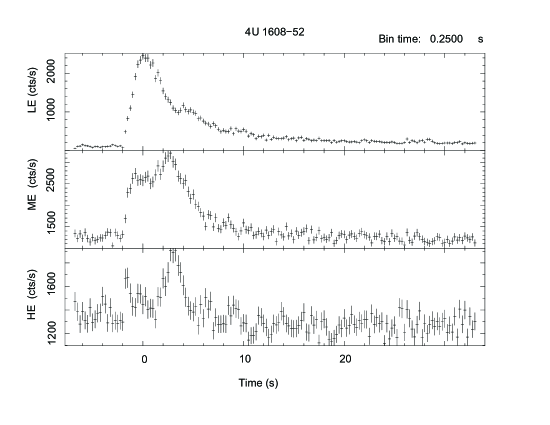
We show the LE/ME/HE lightcurves in Fig. 3 with a time resolution of 0.25 s, as shown in Fig. 3. The burst profiles exhibit a typically fast rise and slow (exponential) decay in the soft X-ray band, and manifest flat-topped peak (ME) and two peaks (HE) in hard X-ray band, which are typical characteristics of a PRE burst.
3.3 broad-band spectra of burst emission by Insight-HXMT
When we fitted the burst spectra, we estimated the background by using the emission before the burst, i.e ., assuming the persistent emission is unchanged during the burst. We perform the time-resolved spectroscopy with a time resolution of 0.25 s, and define the time of the bolometric flux peak as a time reference (0 point in Fig. 4). A blackbody model (bbodyrad in Xspec) with a fixed absorption (wabs in XSPEC), as used in pre-burst fitting, is used to fit the burst spectra. To compromise the effective area calibration deviation, a constant is added to the model. At first attempt, for LE, the constant is fixed to 1, the others are alterable during spectra fitting. The fits indicate that most of the constant of HE are not convergent, owing to the low-significance of the HE detection. Under this situation, the constant of HE is fixed at 1 for the combined-spectra fitting.
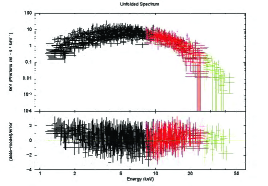
Following the classical approach to X-ray burst spectroscopy by subtracting the persistent spectrum and fitting the net spectrum with an absorbed blackbody. Such a spectral model generally results in an acceptable goodness-of-fit, with a mean reduced 1.1. However, we note that a significant residual is shown below 3 keV, as shown in the left panel of Fig. 5. Also the burst spectral fitting results are consistent with having a detection of a PRE from the lightcurve of Insight-HXMT.
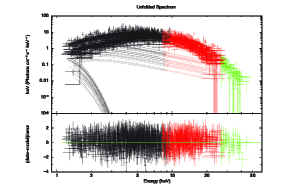
Following Worpel et al. (2013) we then include an addition component for fitting the variable persistent emission. We assumed that during the burst the spectral shape of the persistent emission is unchanged, and only its normalization (known as a factor) is changeable. As reported earlier by RXTE and NICER, the model provides a better fit than the conventional one (absorbed blackbody), We compare the above two models by using the F-test. As shown in Table 2, in some cases, the model could significantly improve the fits with a p-value .
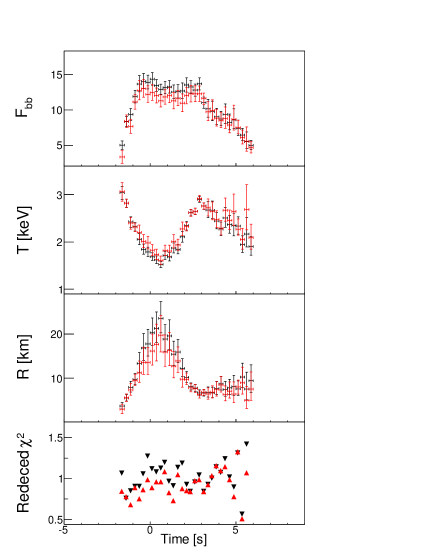
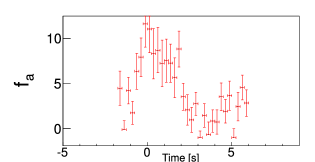
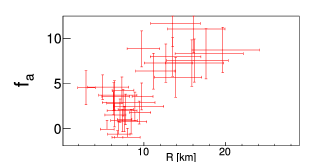
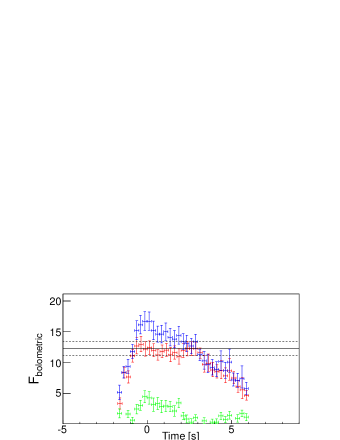
As shown in Fig. 6, the spectral fitting results from these two models have differences mainly around the burst peak. By considering an additional factor , the burst blackbody flux tends to slightly decrease, and the temperature become higher but the radius shrinks. The factor reaches a maximum of , which indicates that the enhancement of the pre-burst emission is up to 40%. is adopted from the flux at touch-down time (at the end of PRE phase when the radius has declined to the asymptotic value in the burst tail) during the burst. During the PRE phase, the radius is up to km, which is three times larger than the radius measured at touch-down time km (assuming a distance of 5 kpc).
The soft access may be caused by the reflection from the accretion-disk illuminated by the blackbody emission from the NS surface/photosphere during the burst. We employ rdblur*bbrefl_2xsolar_0-5r.fits or relconv*bbrefl_2xsolar_0-5r.fits to replace the model, in which bbrefl_2xsolar_0-5r.fits and rdblur/relconv is corresponding to the reflection emission and relativistic doppler broadening of the reflection component, respectively.
In such an attempt, the fit parameters are fixed at the dimensionless spin = 0.29, the disk inclination i = 38.8 degree, the inner and outer disc radii =6 and =400 in unit of , which are adapted from Degenaar et al. (2015). Since there are no hints of the iron emission line or the reflection-bump in 20–40 keV, the ionization parameter is pegged at the tabular boundary of log = 3.75. However, the additional reflection component can not alleviate the residuals at soft X-rays.
4 Discussion
In this study, we have analyzed one PRE burst from 4U 1608–52 in the soft state of an outburst observed by Insight-HXMT. We find a significant spectral deviation from an absorpted blackbody during the burst. Such a deviation can be properly accounted for by introducing an additional component denoted as that describes the possible enhancement of the pre-burst continuum emission. The observed enhancement evolves with the burst flux and reaches to a peak during the expansion phase of the burst.
The enhanced continuum emission during bursts is generally thought to be relevant to Poynting-Robertson drag effect, with which the momentum of the accretion matter can be taken away and hence enlarge the local accretion rate. Such an effect becomes even stronger for PRE. Stahl et al. (2013) thought that by considering the radiation drag, the particles at the inner radius of accretion disk can move to the NS surface within s.
Assuming the persistent emission is proportional to the accretion rate onto the neutron star, an increase in persistent emission suggests that an additional accretion can be induced by burst. The increment of accretion matter induced by the burst emission, can be estimated as the t, where is the pre-burst accretion rate. This value turns out to be tiny compared with those accreted within hours or even longer before burst.
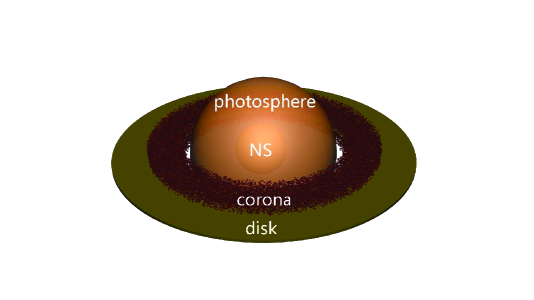
As shown in Fig. 6, the value is around 10 during the radius expansion phase. This enhancement corresponds to roughly 40%. Obviously, a sum up of the emission from the burst and the enhanced part from the pre-burst gives an overall emission level of round 140% , as is shown in Fig. 7. We hence speculate that the enhanced persistent emission is from a region outside the burst photon spheric radius, as illuminated in Fig. 8. If this is the case, the inner-most disk radius can be constrained to larger than 16 km.
Similar results were also reported in PRE burst of 4U 1820–30: NICER observations show a photon spheric radius of 200 km and an enhanced persistent emission which accounts for 71% of the overall flux and hence overwhelms the burst emission during the PRE phase (Keek et al., 2018a). The summed emission from the burst and the pre-burst for the enhanced part also exceeds . A similar speculation is that the enhanced persistent emissions could come from a region with a radius of 200 km.
If there is obscuration of the disk by the NS expanding atmosphere in the PRE phase, a decrease of should be detected. However, in this work, though the burst flux flatten during the PRE phase, and burst radius still increase and decrease simultaneously. Worpel et al. (2013) also found only a slight positive correlation between the degree of radius expansion and the increase in persistent emission in a sample of PRE bursts by RXTE. This suggest that the disk is so far from the NS that the expanding atmosphere does not significantly obscure accretion emission; or are likely to depend more on the burst expanding radius, because of more irradiated area of the disk by the burst.
The interaction between the burst and inhabited persistent emission was firstly studied from the brightest and most vigorous PRE bursts with moderate/super expansions (a factor of 10-104 increases in emission area). During these PRE events, the continuum emissions were missing probably due to the obscuration or hold-up for the accretion by the pulled-up photosphere (Muno et al., 2000 and reference therein).
The enhancement of persistent emission during burst was firstly reported by in’t Zand et al. (2013), using the jointed Chandra and RXTE/PCA observations on a PRE burst of SAX J1808.4–3658 in 0.5–30 keV. They found that the pre-burst emission increased by a factor of twenty. More results were reported by Worpel et al. (2013, 2015) with RXTE/PCA observations in 2.5–20 keV, both for PRE and non-PRE bursts. There they found that the enhanced pre-burst emission enhanced both during the photon spheric expansion phase of the burst (up to a factor of eighty) and in the cooling tail. With a larger effective area in soft X-ray band, the persistent emission change was also detected by NICER from a single non-PRE burst of Aql X–1 and a PRE burst of 4U 1820–30, with measured up to 2.5 (Keek et al., 2018) and 10 (Keek et al., 2018a), respectively. Spectral residual was also reported by AstroSAT during a burst of 4U 1728–34, and was understood partially as reprocessed burst emission by the corona but not for the enhancement of the persistent emission (Bhattacharyya et al., 2018).
Here, a similar enhancement pre-burst/continuum emission is detected by Insight-HXMT during a PRE burst of 4U 1608–52, with measured up to . This is consistent with RXTE/PCA results on the bursts of 4U 1608–52 reported by Ji et al. (2014), but the broad energy coverage of Insight-HXMT allows for probing the burst induced modification of the persistent emission in more details.
Another interpretation of the enhanced pre-burst emission is the Comptonization of the burst photon by the corona. In principle, the burst spectrum may be influenced due to the Comptonization of the burst photons by the surrounding corona. As a result, the burst spectrum may become harder or the continuum spectrum may become softer. Both can result in spectral deviation once modelling the burst with a pure blackbody. Actually the latter was observed as a hard X-ray deficit during burst in the low hard state of the outburst (Chen et al., 2012 and reference therein). To study the former, a refined burst spectrum is highly solicited which in turn requires larger detection area and broad band energy coverage which may be satisfied by the next generation of Chinese mission of so-called eXTP (enhanced X-ray Timing and Polarimetry mission) (Zhang et al., 2019). Also a contemporary joint observation of the burst by NICER and Insight-HXMT is greatly in our understanding of the burst influence upon the accretion environment.
References
- Ballantyne & Strohmayer [2004] Ballantyne, D. R., & Strohmayer, T. E. 2004, ApJL, 602, L105
- Bhattacharyya et al. [2018] Bhattacharyya, S. Yadav, J. S., Sridhar, Navin, et al. 2018, ApJ, 860, 88
- Belian et al. [1976] Belian, R. D., Conner, J. P., & Evans, W. D. 1976, ApJ, 206, L135
- Chen et al. [2012] Chen, Y. P., Zhang, S., Zhang, S. N., et al. 2012, ApJL, 752, 34
- Chen et al. [2018] Chen, Y. P., Zhang, S., Qu, J. L., Zhang, S. N., et al. 2018, ApJL, 864, 30
- Cumming [2004] Cumming, A. 2004, Nucl. Phys. B Proc. Suppl., 132, 435
- Degenaar et al. [2015] Degenaar, N., Miller, J. M., Chakrabarty, D., et al., 2015, MNRAS, 451, L85
- Degenaar et al. [2018] Degenaar, N., Ballantyne, D. R., Belloni, T., et al. 2018, SSRv, 214, 15
- Galloway et al. [2008] Galloway, D. K., Muno, M. P., Hartman, J. M., et al. 2008, ApJS, 179, 360
- García et al. [2014] García, J., Dauser, T., Lohfink, A., et al. 2014, ApJ, 782, 76
- in’t Zand et al. [2013] in’t Zand, J. J. M., Galloway, D. K., Marshall, H. L., et al. 2013, A&A,553, A83
- Ji et al. [2013] Ji, L., Zhang, S., Chen, Y. P., et al. 2013, MNRAS, 432, 2773
- Ji et al. [2014] Ji, L., Zhang, S., Chen, Y. P., et al. 2014, ApJL, 791, L39
- Keek et al. [2014] Keek, L., Ballantyne, D. R., Kuulkers, E., & Strohmayer, T. E. 2014b, ApJL, 797, L23
- Keek et al. [2018] Keek L., Arzoumanian Z., Bult P., et al. 2018, ApJL, 855,4
- Keek et al. [2018a] Keek L., Arzoumanian Z., Chakrabarty, D., et al. 2018, ApJL, 856,37
- Lamb & Miller [1995] Lamb, F. K., & Miller, M. C. 1995, ApJ, 439, 828
- Lewin et al. [1993] Lewin, W. H. G., van Paradijs, J., & Taam, R. E. 1993, Space Sci. Rev., 62, 223
- Miller & Lamb [1993] Miller, M. C., & Lamb, F. K. 1993, ApJL, 413, L43
- Muno et al. [2000] Muno, M. P., Fox, D. W., Morgan, E. H., & Bildsten, L. 2000, ApJ, 542, 1016
- Muno et al. [2001] Muno, M. P., Chakrabarty, D., Galloway, D. K., & Savov, P. 2001, ApJ, 553, L157
- Penninx et al. [1989] Penninx W., Damen E., Tan J., Lewin W. H. G., van Paradijs J., 1989, A&A, 208, 146
- Poutanen et al. [2014] Poutanen J., Nttil J., Kajava J. J. E. et al. 2014, MNRAS, 442, 3777
- Stahl et al. [2013] Stahl, A., Kluniak, W., Wielgus, M., & Abramowicz, M. 2013, A&A, 555, A114
- Strohmayer & Bildsten [2006] Strohmayer, T., & Bildsten, L. 2006, New views of thermonuclear bursts (Compact stellar X-ray sources), 113, 156
- Walker [19922] Walker, M. A. 1992, ApJ, 385, 642
- Watts [2012] Watts, A. L. 2012, ARA&A, 50, 609
- Worpel et al. [2013] Worpel, H., Galloway, D. K., & Price, D. J. 2013, ApJ, 772, 94
- Worpel et al. [2015] Worpel, H., Galloway, D. K., & Price, D. J. 2015, ApJ, 801, 60
- Zhang et al. [2014] Zhang S., Lu F. J., Zhang S. N. et al. in Space Telescopes and Instrumentation 2014: Ultraviolet to Gamma Ray, Proc. SPIE, Vol. 9144 (2014) p. 914421
- Zhang et al. [2019] Zhang, S. N., Santangelo, A., Feroci, M., et al. 2019, Science China Physics, Mechanics & Astronomy, Volume 62, Issue 2, article id. 29502, 25
- ycki et al. [1999] ycki, P. T., Done, Chris, Smith, D. A. 1999, MNRAS, 309, 561
| No | obsid | Time (MJD) |
|---|---|---|
| 1 | P011476400701-20180629-01-01 | 58298.318890 |
| 2 | P011476401301-20180705-01-01 | 58304.549226 |
-
This work
| BB | |||||||||||
|---|---|---|---|---|---|---|---|---|---|---|---|
| No | Time (s) | () | (keV) | (km) | aF() | (keV) | (km) | F-test value | |||
| 1 | -1.62 | 1.06(21) | 0.83(20) | 1.7 | |||||||
| 2 | -1.38 | 0.75(37) | 0.77(36) | 0.90 | |||||||
| 3 | -1.12 | 0.85(44) | 0.68(43) | 1.1 | |||||||
| 4 | -0.88 | 0.90(55) | 0.89(54) | 0.15 | |||||||
| 5 | -0.62 | 0.90(60) | 0.74(59) | 5.2 | |||||||
| 6 | -0.38 | 1.05(66) | 0.86(65) | 1.9 | |||||||
| 7 | -0.12 | 1.26(69) | 0.98(68) | 2.4 | |||||||
| 8 | 0.12 | 1.12(70) | 0.88(69) | 2.9 | |||||||
| 9 | 0.38 | 1.08(66) | 0.96(65) | 3.6 | |||||||
| 10 | 0.62 | 1.12(69) | 0.95(68) | 5.2 | |||||||
| 11 | 0.88 | 1.19(63) | 1.08(62) | 8.7 | |||||||
| 12 | 1.12 | 0.96(64) | 0.82(63) | 9.3 | |||||||
| 13 | 1.38 | 0.90(60) | 0.72(59) | 1.8 | |||||||
| 14 | 1.62 | 1.13(62) | 1.04(61) | 1.5 | |||||||
| 15 | 1.88 | 1.19(57) | 0.87(56) | 1.8 | |||||||
| 16 | 2.12 | 0.92(62) | 0.84(61) | 1.2 | |||||||
| 17 | 2.38 | 0.84(59) | 0.83(58) | 0.18 | |||||||
| 18 | 2.62 | 0.96(58) | 0.97(57) | 0.48 | |||||||
| 19 | 2.88 | 1.04(61) | 0.98(60) | 3.4 | |||||||
| 20 | 3.12 | 0.84(54) | 0.83(53) | 0.17 | |||||||
| 21 | 3.38 | 0.93(45) | 0.92(44) | 0.25 | |||||||
| 22 | 3.62 | 1.00(39) | 1.02(38) | 0.66 | |||||||
| 23 | 3.88 | 1.14(40) | 1.16(39) | 0.53 | |||||||
| 24 | 4.12 | 1.07(39) | 1.09(38) | 0.62 | |||||||
| 25 | 4.38 | 1.24(39) | 1.14(38) | 3.9 | |||||||
| 26 | 4.62 | 1.01(33) | 0.98(32) | 0.14 | |||||||
| 27 | 4.88 | 0.89(32) | 0.76(31) | 1.7 | |||||||
| 28 | 5.12 | 1.31(30) | 1.32(29) | 0.39 | |||||||
| 29 | 5.38 | 0.56(29) | 0.50(28) | 3.8 | |||||||
| 30 | 5.62 | 1.42(26) | 1.06(25) | 4.4 | |||||||
| 31 | 5.88 | 1.17(25) | 1.07(24) | 8.0 | |||||||
-
: The bolometric flux of the blackbody is in unit of .