Two-colour QCD phases and the topology at low temperature and high density
Abstract
We delineate equilibrium phase structure and topological charge distribution of dense two-colour QCD at low temperature by using a lattice simulation with two-flavour Wilson fermions that has a chemical potential and a diquark source incorporated. We systematically measure the diquark condensate, the Polyakov loop, the quark number density and the chiral condensate with improved accuracy and extrapolation over earlier publications; the known qualitative features of the low temperature phase diagram, which is composed of the hadronic, Bose-Einstein condensed (BEC) and BCS phases, are reproduced. In addition, we newly find that around the boundary between the hadronic and BEC phases, nonzero quark number density occurs even in the hadronic phase in contrast to the prediction of the chiral perturbation theory (ChPT), while the diquark condensate approaches zero in a manner that is consistent with the ChPT prediction. At the highest , which is of order the inverse of the lattice spacing, all the above observables change drastically, which implies a lattice artifact. Finally, at temperature of order , where is the chiral transition temperature at zero chemical potential, the topological susceptibility is calculated from a gradient-flow method and found to be almost constant for all the values of ranging from the hadronic to BCS phase. This is a contrast to the case of in which the topological susceptibility becomes small as the hadronic phase changes into the quark-gluon plasma phase.
1 Introduction and summary
It is of great importance to probe properties of matter in extreme conditions as encountered in neutron stars and relativistic heavy ion collisions. In fact, recent observations of the gravitational waves from a double neutron star merger event TheLIGOScientific:2017qsa , as well as heavy-ion collision experiments performed at the highest energies that can be achieved at present Andronic:2017pug , provide empirical information about the equation of state (EOS) of matter that occurs in such systems and its evolution. Since the constituents of such matter are strongly coupled, however, one has difficulty in accurately evaluating the EOS and transport coefficients from QCD.
Theoretically, all one knows at relatively low temperature are the equilibrium properties of matter near zero baryon chemical potential and of matter at sufficiently high baryon chemical potential for weak coupling calculations to work. At zero baryon chemical potential, the chiral condensate and the Polyakov loop are known to gradually change with increasing temperature from lattice QCD simulations at physical pion mass Aoki:2009sc ; Bazavov:2011nk . The system undergoes a gradual crossover from a hadronic to a quark-gluon plasma (QGP) phase around a temperature at which the chiral susceptibility is peaked. The topological susceptibility is also measured on a lattice, which indicates that the density of instantons decreases from the value at zero temperature to a vanishingly small one Schafer:1996wv . At nonzero baryon chemical potential, several works based on the multi-parameter reweighting Fodor:2001pe ; Fodor:2004nz and the Taylor expansion Borsanyi:2012cr searched for a critical end point, but unfortunately it remains to be determined. Thanks to a sign problem inherent to finite density lattice QCD, however, the regime in which one can predict from finite density QCD is restricted all the way to a regime of such high densities as to make perturbative, weak coupling calculations reliable. In this regime, a deconfined superfluid BCS state is predicted to occur at sufficiently low temperatures for Cooper pairs of diquarks to be formed via one-gluon exchange in the colour antisymmetric channel Alford:2007xm .
In this work, we examine the temperature and density dependence of the phase and topological structure of dense two-colour QCD by using a lattice simulation with two-flavour Wilson fermions 111Some very preliminary results have been shown in ref. Itou:2018vxf . . In this case, the sign problem can be avoided as follows: The fundamental representation (=quark) of the SU() gauge group takes a (pseudo)real representation, so that the determinant of the Dirac operator even at finite quark chemical potential is a positive-real or negative-real Muroya:2000qp ; Muroya:2002ry ; Muroya:2003jp . Then, the SU(2) gauge theory coupled to the even number of flavours does not suffer from the sign problem.
Even so, there is another problem: A numerical instability occurs in the low temperature and high density regime. This problem comes from a dynamical pair-creation and/or pair-annihilation of the lightest hadrons, so that it is theoretically expected that the instability appears when is satisfied at temperatures close to zero Muroya:2000qp ; Muroya:2002ry ; Muroya:2003jp . Here, and denote the quark chemical potential and the pseudoscalar meson mass at zero chemical potential. One can see how this kind of instability occurs and can be avoided by introducing a diquark source in terms of the eigenvalue distribution of the Dirac matrix Fukushima:2008su . In this work, we thus introduce the diquark source term in the action to solve the second problem following refs. Kogut:2001na ; Kogut:2002cm ; Hands:2006ve ; Hands:2007uc ; Alles:2006ea ; Hands:2011hd ; Cotter:2012mb ; Boz:2013rca ; Boz:2015ppa ; Braguta:2016cpw (see section 2) and attempt to find out the phase structure in the vanishing limit of the source term.
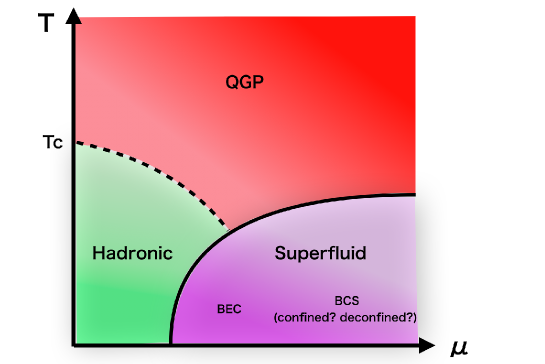
As for the phase structure of dense two-colour QCD with , earlier lattice simulations Hands:2006ve ; Hands:2011hd ; Cotter:2012mb ; Hands:2007uc ; Boz:2013rca ; Boz:2015ppa ; Braguta:2016cpw including the diquark source parameter in the action provided low temperature data for the diquark condensate, the Polyakov loop, the quark number density and the chiral condensate as a function of quark chemical potential . By taking the limit of , a hadronic phase with vanishing diquark condensate was found to change into a superfluid phase with nonzero diquark condensate around . The phase diagram predicted from the earlier analyses can be schematically illustrated in figure 1.
We remark in passing that the two-colour system has baryons as bosons that are degenerate with mesons in vacuum, a feature clearly different from the usual three-colour system Kogut:1999iv ; Kogut:2000ek ; Splittorff:2000mm .
Consistency of the and dependence of various quantities with the mean-field prediction by the chiral perturbation theory (ChPT) Kogut:1999iv ; Kogut:2000ek ; Kogut:2001na ; Adhikari:2018kzh was examined in detail. Since the ChPT is applicable at sufficiently small , it can at most predict the appearance of a diquark Bose-Einstein condensed (BEC) phase around and the dependence of the diquark and chiral condensates. At still higher densities, it was found that the BCS phase, which is characterized by the presence of the Fermi sphere in the underlying normal phase, takes over from the diquark BEC phase. However, it is still controversial whether or not one could see deconfinement at sufficiently low temperature.
It is well-known that the two-colour system at the finite density has a similar property to three-colour QCD with isospin chemical potential Rischke:2000cn . In the three-colour QCD, it is expected that the first order confinement-deconfinement transition occurs at nonzero temperature even at asymptotically high densities Rischke:2000cn ; Son:2000by ; Sannino:2002re . The intuitive picture of the first order phase transition is as follows: In the intermediate temperature and high density regime, a typical momentum of quarks is higher than the size of the Fermi surface () or zero-temperature diquark gap () and hence the quarks behave like free particles, while at extremely low temperature the typical momentum of quarks is smaller than or and hence the quarks are quenched. As is well-known, the quenched QCD at low temperature exhibits the confinement, so that the low temperature and high density regime must be described by the confining theory. By analogy, there could be a similar phase transition by changing temperature in a high density regime Schafer:2002yy . Since two-colour QCD at finite temperature exhibits the second order confinement-deconfinement phase transition, the transition might be weaker than the three-colour case.
An important and nonperturbative quantity related to the phase structure is the topology. At low temperatures and intermediate densities, theoretical works are based mostly on low energy effective theories Fukushima:2010bq . Some of the low energy effective theories focus on instantons since such topological objects are closely related to the vacuum structure. In fact, the instanton-induced interaction among quarks can promote the chiral phase transition as well as the superfluid phase transition Rapp:1997zu , just like the one-gluon exchange interactions at extremely high densities. The key question here is how the density of instantons depends on the baryon chemical potential. To answer this question, however, nonperturbative calculations are indispensable. According to the BCS theory, the zero-temperature diquark gap () is related to the critical temperature () for the transition from the superfluid to QGP phase at given chemical potential as
| (1) |
where denotes Euler’s constant Rapp:1997zu . If there are some topological objects in the superfluid phase and they increase the diquark gap at zero temperature 222It is notable that the diquark gap from the Dirac operator has been also discussed in refs. Kanazawa:2011tt ; Kanazawa:2012zr ., therefore, the phase diagram is expected to be changed from the perturbative prediction at intermediate densities.
As for lattice approach to the topological properties of dense two-colour QCD, the earliest work was done for and Alles:2006ea ; Hands:2011hd , which shows that the topological susceptibility decreases with in the high density regime, while the result of is available only on a rather coarse lattice Hands:2011hd , which suggests that it might be almost constant in the high density regime 333In the case of three-colour QCD with isospin chemical potential, -independece of the eigenvalue for the overlap Dirac operator has been reported in ref. Bali:2016nqn .. However, the temperature and phase dependences of the topological susceptibility were not considered. Since it is well-known that the property of the topological distribution depends strongly on the temperature at Schafer:1996wv , it is important to study the topology at different temperatures with fixed. In this work, therefore, we will investigate the phase structure at two relatively low temperatures, (section 3) and (section 4), where denotes the chiral transition temperature at . After that, we will study the density dependence of the topological susceptibility (see section 5).
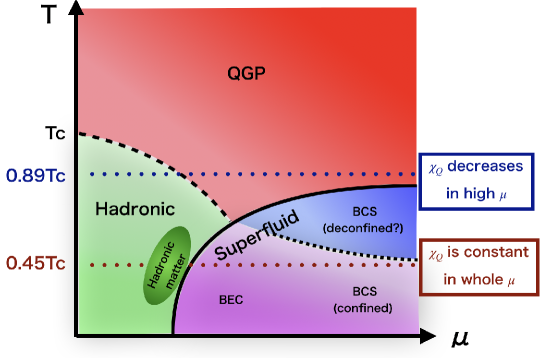
We summarize the main conclusions of this paper, which are schematically displayed in figure 2. By systematically measuring the diquark condensate, the Polyakov loop, the quark number density and the chiral condensate with improved accuracy and extrapolation over earlier investigations Hands:2006ve ; Cotter:2012mb ; Braguta:2016cpw , the known qualitative features of the low temperature phase diagram are reproduced at . In improving the extrapolation, we have developed a new reweighting method. In addition, we newly find that around the boundary between the hadronic and BEC phases, so-called the hadronic matter regime444We dare to refer to a hadronic phase with nonzero quark number density as “hadronic matter” because this phase is reminiscent of a nuclear medium in real QCD., nonzero quark number density occurs even in the hadronic phase in contrast to the ChPT prediction, while the diquark condensate approaches zero in a manner that is consistent with the ChPT prediction. At the highest , which is of order the inverse of the lattice spacing, all the above observables suffer from a strong lattice artifact and change drastically. There is no clear evidence for deconfinement at densities below the regime where a lattice artifact takes effect; this is consistent with the analysis with staggered fermions Braguta:2016cpw , but at odds with that with Wilson fermions Cotter:2012mb . Finally, at temperature of , the topological susceptibility is calculated from a gradient-flow method Luscher:2010iy and found to be almost constant for all the values of ranging from the hadronic to BCS (confined) phase. This is a contrast to the case of in which the topological susceptibility becomes small as the hadronic phase changes into the QGP phase.
2 Simulation detail
In this section we start with the lattice action. We then define the physical quantities to be measured and show how to determine the phases from the behaviour of the quantities. We finally set the simulation parameters.
2.1 Lattice action
In this work, as a lattice gauge action, we utilize the Iwasaki gauge action, which is composed of the plaquette term with and the rectangular term with ,
| (2) |
where in the two-colour theory, and denotes the bare gauge coupling constant. The coefficients and are set to and .
As a lattice fermion action, we use the two-flavour Wilson fermion action including the quark number operator and the diquark source term, which is given by
| (3) |
Here, the indices denote the flavour label, and is the quark chemical potential. The additional parameters and correspond to the anti-diquark and diquark source parameters, respectively. For simplicity, we put and assume that it takes a real value. Note that , where is a source parameter in the corresponding continuum theory. The factor comes from the rescaling of the Wilson fermion on the lattice as will be specified below. The in the last two terms is the charge conjugation operator, and acts on the colour index. Finally, is the Wilson-Dirac operator including the number operator, which is explicitly given by
| (5) | |||||
where is the hopping parameter.
Now, the action (3) contains three types of fermion bilinears: , and . To build a single kernel matrix from the fermion action, we introduce an extended fermion matrix () as
| (10) |
where The square of the extended matrix can be diagonal because is real. We thus obtain
| (11) |
Note that corresponds to the fermion action for the four-flavour theory, since a single in eq. (10) represents the fermion kernel of the two-flavour theory. To reduce the number of fermions, we take the square root of the extended matrix in the action and utilize the Rational Hybrid Montecarlo (RHMC) algorithm in our numerical simulations.
2.2 Observables and definition of phases
Now, we turn to the notation of the phases as described in figure 1. Following earlier investigations Braguta:2016cpw , we use the name of each phase as shown in table 1.
| Hadronic | QGP | Superfluid | |||
| Hadronic matter | BEC | BCS | |||
| zero | zero | non-zero | |||
| zero | zero | zero | non-zero | ||
| non-zero | |||||
Here, is the magnitude of the Polyakov loop,
| (12) |
which plays the role of an approximate order parameter for confinement. denotes the diquark condensate,
| (13) |
where . This is nothing but the order parameter for superfluidity. denotes the quark number density,
which is the time-like component of a conserved current. Note that this quantity does not require a renormalization and goes to in the high limit on the lattice. Incidentally, is the quark number density defined by the free field on a finite lattice Hands:2006ve :
| (15) |
where
| (16) |
In the continuum limit, .
Note that we use the definition in table 1 no matter whether the system is at zero temperature or not. In fact, some “non-zero” quantities could come from thermal effects. For instance, the finiteness of in the “hadronic matter” phase is expected to be one of them as will be discussed later. Although this hadronic matter is just a part of the ordinary hadronic phase, we use this terminology to distinguish between the hadronic state with and the hadronic vacuum.
The nonzero value of the diquark condensate indicates that the system is in a superfluid state. We expect that a low density regime in the superfluid phase could be described in terms of a diquark BEC picture. In this picture, the diquark (–) pairs behave as bosons that form a condensate when a typical correlation length of the system, namely, the coherence length of the pair, is sufficiently shorter than the inter-quark spacing . This is the case with a rarefied system. With increasing density, however, the inter-quark spacing becomes shorter and shorter. If the spacing is much shorter than the typical correlation length, then, the number of the pairs significantly decreases since only quarks near the Fermi surface that would occur in the absence of attraction between quarks can undergo Cooper pairing. At the same time, the Cooper pairs spatially overlap with each other, which gives rise to a coherent state. It is nevertheless noteworthy that most of the quarks behave like free particles. For this phase, generally referred to as the BCS phase, the quark number density can thus be estimated from the free particle propagator including the chemical potential . We thus expect that even on a lattice, the quark number density can be approximated by in the BCS phase. Furthermore, we expect that is proportional to , which corresponds to the area of the Fermi surface.
It might be also tempting to consider the chiral condensate, for one flavour, as an order parameter of chiral symmetry breaking. In our numerical calculations, however, we utilize the massive Wilson fermions, which explicitly break the chirality. Although we will discuss numerical results for the chiral condensate in each phase, we will not use the quantity for the definition of the phase.
We conclude this subsection by mentioning that a lattice artifact can induce a peculiar phase in the high density regime. There are two possible origins that can result in such a phase in the numerical simulations. The first one can be found by observing the behaviour of the diquark condensate. In fact, when the value of approaches in lattice unit, the propagation of the quarks is quenched, leading to a significant decrease in the amplitude of with increasing . This kind of behaviour was reported in refs. Kogut:2002cm ; Braguta:2016cpw in the simulations using the staggered fermions.
The second origin is the finite volume effect, which manifests itself when all the lattice site are occupied by the quarks. The signal of a peculiar phase coming from the finite volume effect can be found by observing the saturation of in lattice unit, which corresponds to in our notation. In the actual simulation of this work, the maximal value of is 0.707(2), which is significantly smaller than . We can thus safely avoid such an artifact.
2.3 Simulation parameters
We perform the simulations with () () and (). According to preliminary results in ref. Lee , () () gives and , where is the vector meson mass in vacuum. Furthermore, the chiral phase transition at occurs at ) () with the simulations performed at fixed . Eventually, the scale setting utilizing Borsanyi:2012zs in the gradient flow method Luscher:2010iy leads to and , respectively, for the former and latter simulations.
3 Simulation results: Phase diagram at
Let us proceed to show the finite density phase diagram at fixed temperature () by analysing the dependence of the observables described in subsection 2.2.
3.1 Polyakov loop
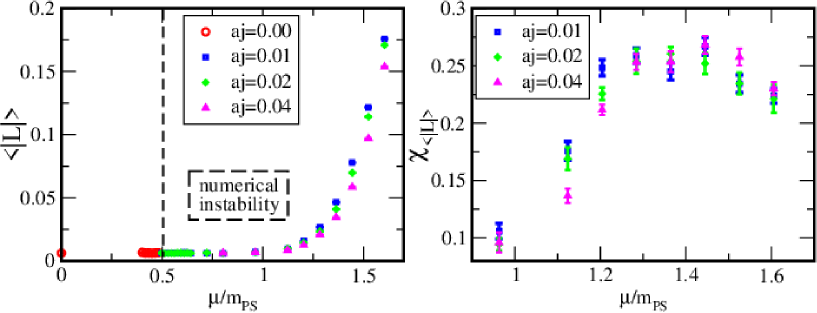
We start with the Polyakov loop, whose -dependence is depicted in figure 3. The symbols (colours) denote the different values of the diquark source () in lattice unit; the data with circle (red), square (blue), diamond (green) and triangle (magenta) are generated by the and simulations, respectively. Note that the theoretical threshold value of the numerical instability is , beyond which the lightest hadrons are frequently created and annihilated. In fact, we can implement the HMC simulation without the diquark source for , while the Metropolis test in the HMC simulation is not accepted even within a tiny Montecarlo step () for . In the latter regime, we thus have to utilize the RHMC algorithm including the diquark source in the action.
As can be seen from the left panel of figure 3, the Polyakov loop takes on a nonzero value for . Normally, it is a signal of the transition or crossover from the confined to deconfined phase. The right panel of figure 3 shows the susceptibility of the Polyakov loop obtained for –. The susceptibility is marginally peaked at with . A clear -dependence of the peak position is not observed in our calculation. Since is close to unity (), the obtained structure of the Polyakov loop might be associated with a lattice artifact as we shall see.
3.2 Diquark condensate
The other quantity that helps determine the phase diagram is the expectation value of the diquark condensate, which have been measured by utilizing the noise method for each configuration. It is however difficult to evaluate this expectation value from the extrapolation of limit, as is the case with earlier investigations Hands:2006ve ; Cotter:2012mb ; Braguta:2016cpw . Let us then propose a reweighting method with respect to at fixed 555A similar reweighting method was discussed in the context of QCD with nonzero isospin chemical potential Brandt:2017oyy .. In this method, the reweighting factor from the original lattice parameters () to the measured parameters () is given by
| (17) |
In our simulation, the value of alone is changed between the configuration generation and the measurement of the observables. Thus, the reweighting factor explicitly reads
In our calculations, the value of is typically in lattice unit, so that the Taylor expansion, , is valid. In fact, for (), the data for are obtained by the reweighting from the configurations generated with . On the other hand, for (), the data for are measured by using the reweighting method from the configurations with . It is numerically confirmed that the leading correction of the reweighting factor () is less than in our calculations.
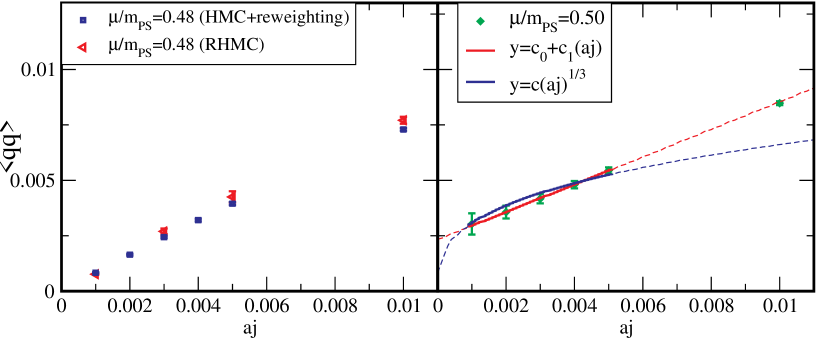
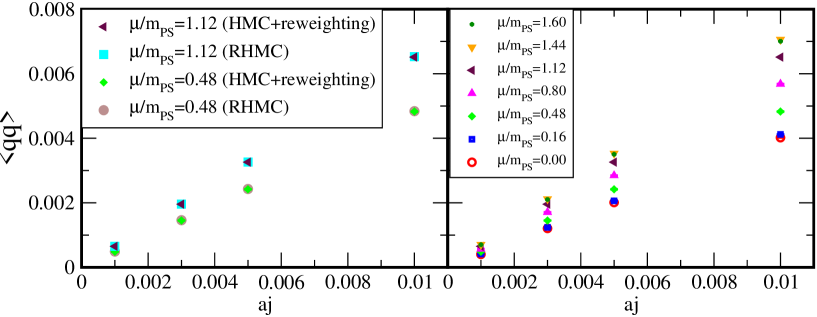
We firstly investigate the consistency of the data obtained by the different methods around . In the left panel of figure 4, the square (blue) data for are generated by the HMC algorithm without the term in the action and are measured by using the reweighting method from the configurations with , while the triangle (red) data for the same are obtained by the configurations generated by using the RHMC algorithm for each value of and are also measured using the same value of . Both data for each are consistent, and furthermore both extrapolated values of in the limit vanish. We also show the data for () in the right panel, where the data are generated by the RHMC algorithm with , since as explained, at this it is very hard to generate the configurations utilizing the HMC without the term. The diquark condensate for are measured by the reweighting method from . At this critical , the ChPT predicts that the diquark condensate behaves like , and in the case of the study with staggered fermions, the numerical evidence was obtained Braguta:2016cpw . In this work, however, the linear extrapolation in rather than the scaling can reproduce the data beyond the fitting range of with a reasonable chi-square, and hence there seems no clear evidence for the scaling in our simulation.
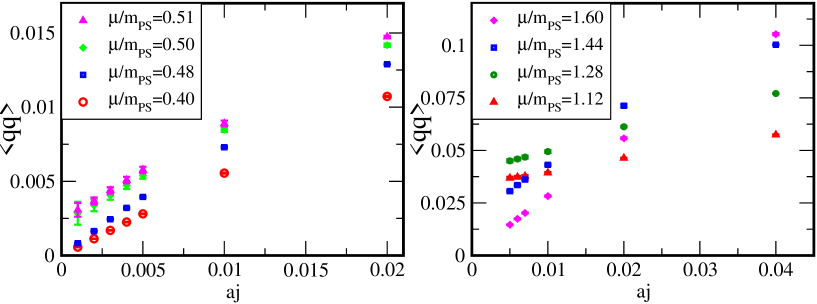
The left and right panels of figure 5 present how the diquark condensate depends on in the low and high regimes, respectively. In the limit, the left panel shows that the data go to zero for , as denoted by circle (red) and square (blue) symbols, while having a nonzero expectation value for , as denoted by diamond (green) and triangle (magenta) symbols. The critical value, , corresponds to the onset of the numerical instability, at which superfluidity is known to occur Fukushima:2008su .
In the high regime, as can be seen from the right panel in figure 5, the diquark condensate has a larger dependence for higher . Normally, the extrapolated value of the diquark condensate increases with , namely , in the BCS phase, but it starts to decrease around , which corresponds to . This behaviour might be a signal of the strong lattice artifact, as discussed in subsection 2.2. It might be notable that the similar behaviour occurs at high in refs. Kogut:2002cm ; Braguta:2016cpw , though the lattice fermion in both works is the staggered one.
Now, let us exhibit, in figure 6, the phase diagram at by using the data of the Polyakov loop and the diquark condensate.
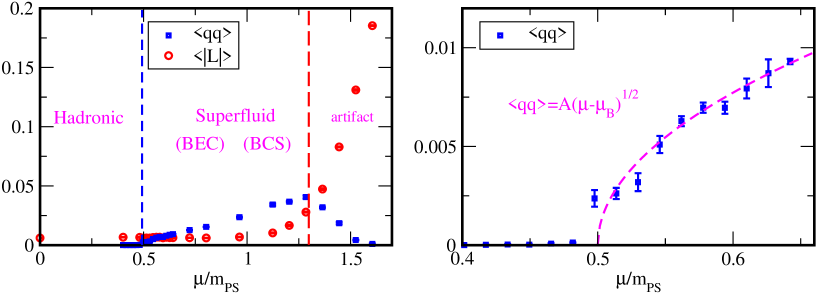
According to the definition of the phases given in table 1, the hadronic and superfluid phases appear at . Although it remains to be determined whether or not the superfluid phase is composed of the BEC and BCS phases, it will be addressed in the next subsection. Thanks to the effectiveness of the reweighting method concerning , we can precisely find the location of the transition between the hadronic and superfluid phases as . This result is consistent with the ChPT prediction that for the lightest hadrons are frequently created. As shown in the right panel in figure 6, the value of is appreciably non-zero at . This behaviour may be due to a finite size effect, which is expected to appear when the effective diquark mass is smaller than .
The scaling law around the critical point,
| (19) |
can be investigated. Here, we have taken and , which are the mean-field predictions by ChPT Kogut:2000ek , since the determination of and from the numerical data was very hard. The chi-square over d.o.f. of the fitting for the data points in is reasonable (), and we find that the theoretical curve based on the scaling law is consistent with the data as shown in the right panel in figure 6.
3.3 Quark number density and chiral condensate
We turn to the quark number density and chiral condensate, which have been measured by utilizing the noise method. The result for the quark number density is shown in figure 7.
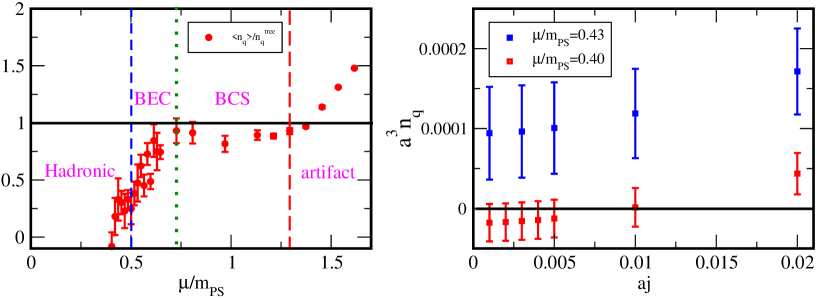
We can observe from the left panel a regime where the lattice data for the quark number density are almost consistent with the free field behaviour (). This regime, which ranges , may well be identified as the weakly coupled BCS phase, rather than the strongly coupled BEC phase, which ranges . Some works based on the Nambu-Jona-Lasinio model have also found a roughly consistent crossover point – in refs. Sun:2007fc ; He:2010nb .
It is interesting to note that even in the hadronic phase, the quark number density in the limit takes on a nonzero value in a narrow regime just below , as can be clearly seen from the right panel in figure 7. In fact, such a regime ranges . Here, this regime is referred to as “hadronic matter”. The presence of the hadronic matter is consistent with a recent Schwinger-Dyson analysis Contant:2019lwf . This is apparently at odds with the ChPT prediction that becomes nonzero when reaches . Note, however, that the ChPT prediction holds for sufficiently low temperature and that the lattice data have been obtained at . Since the ChPT predicts that the diquark (antidiquark) mass in the medium is , the fact that holds at implies that diquarks are thermally excited666Note that finite size effects are expected to come in when , i.e., . The value of in the immediate vicinity of may thus suffer from such effects.. It is thus reasonable for the quark number density to start increasing from nearly zero at . This implication could be confirmed by measuring the diquark mass in the medium as in refs. Muroya:2002ry ; Hands:2007uc ; Wilhelm:2019fvp , which will be addressed in the future.
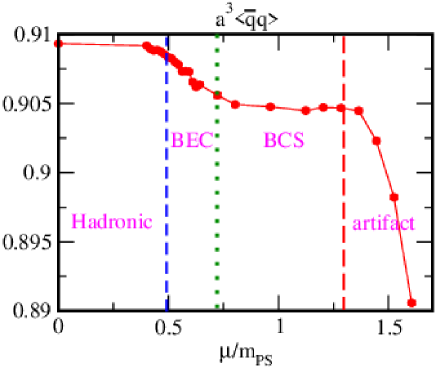
Finally, for completeness, we show the chiral condensate in the left panel of figure 8. Note that here the additive renormalization is not performed. Interestingly, a plateau appears in the BCS phase ().
4 Simulation results: Phase diagram at
Next, we investigate the phase diagram at . This temperature is significantly higher than as depicted in section 3 but still below , the chiral transition temperature at zero chemical potential. It is noteworthy that we can carry out the HMC simulation without the diquark source term even in the high chemical potential regime, . This suggests that at , superfluidity does not appear at any density.
To clarify the absence of superfluidity, we have performed the RHMC simulation with the diquark source term ( and ) at and . In the left panel of figure 9, there are two types of data for each : The one is obtained by the reweighting method for nonzero where the configurations are generated by the HMC algorithm without the term. The other one is generated by the RHMC algorithm for each value of . These data are consistent within the statistical error bars. In the right panel of figure 9, we show the data obtained in the former way for several values of satisfying . By carrying out a linear extrapolation in terms of , we confirm that the diquark condensates at are consistent with zero. Thus, the superfluidity does not appear at this temperature.
By using the configurations obtained from the HMC simulation without the diquark source term in the lattice action, we have also measured the Polyakov loop, the chiral condensate, and the quark number density as shown in figure 10.
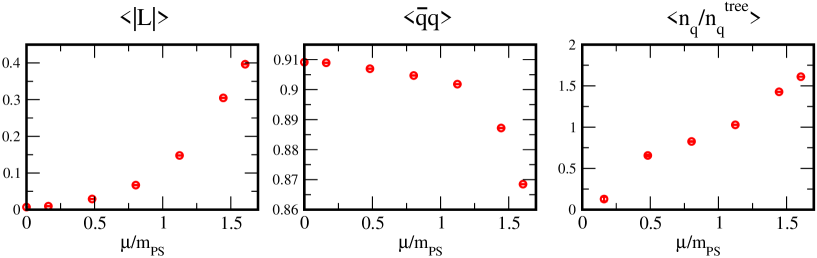
The result for the Polyakov loop suggests that as increases, the system tends to be deconfined, while simultaneously the chiral symmetry tends to be restored. Furthermore, the quark number density has a small but nonzero value already around , which is significantly smaller than the critical value of , which is given by the ChPT and the lattice study at . Note that as long as , nonzero can occur via thermal excitations. We can thus conclude that at , there is only a transition or crossover from the hadronic to the QGP phase at nonzero that is closer to rather than , while the superfluid phase does not appear even in the high density regime below .
5 Simulation results: The topology at finite density
We are now in a position to examine the topological charge (or instanton number) in each of the phases as elucidated in sections 3 and 4. The topological charge can be measured by incorporating the gluonic definition,
| (20) |
into the gradient flow method. In the gradient flow process, we utilize the Wilson-plaquette action as a kernel of the flow equation. The field strength is calculated by using the clover-leaf operator Luscher:2010iy . The number of configurations measured for each set of the lattice parameters has been set to -, while the flow time of the gradient flow has been fixed at .
Figure 11 depicts the histogram of the topological charge obtained at for , and (, and ), respectively. Note that these three cases are typical of the hadronic, BEC and BCS phases, respectively.
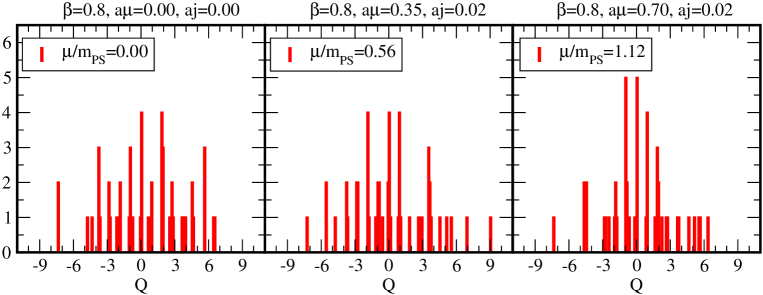
Remarkably, no clear difference can be seen among them. This result could have consequence to the diquark gap because the instanton density is expected to control the strength of the attraction between quarks Rapp:1997zu .
This result is qualitatively different from what earlier investigations found for the SU(2) theory on lattice Hands:2011hd and SU() theory on lattice Alles:2006ea . In such investigations, the topological susceptibility was found to decrease in the high chemical potential regime. To understand such a qualitative difference, we also investigate the temperature and the phase dependences of the topological susceptibility.
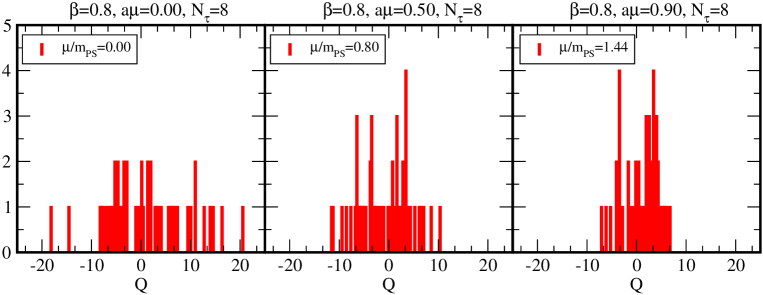
Figure 12 shows the histogram of obtained at , where the phase changes from the hadronic to QGP one with increasing . At zero , there is still a broad distribution of , while in the high chemical potential regime (), the distribution of becomes narrow. Consequently, the topological susceptibility decreases with .
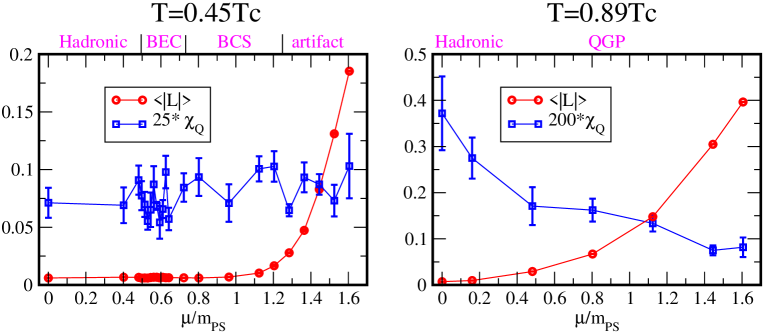
We conclude this section by showing, in figure 13, how the topological susceptibility and the Polyakov loop depend on at and . Here, to make it easy to see, multiplied by a constant and are shown in the left and right panels, respectively. As can be already seen from figures 11 and 12, there is a crucial difference between these two cases: At the topological susceptibility decreases with , which seems just opposite to the behaviour of the Polyakov loop, whereas at the topological susceptibility is almost independent of even in the regime where the Polyakov loop significantly increases. The qualitative difference comes from the underlying phase structure.
6 Outlook
In this paper we have laid out the phase and topological structure of dense two-colour QCD on lattice. In addition to accuracy improvement, however, many questions remain. First, scale setting Lee has to be finalized for a continuum extrapolation to remove lattice artifacts. Second, it would be significant to find the critical temperature at which the diquark condensate disappears in high density regime. Especially in the BCS phase, such critical temperature would lead to estimates of the zero-temperature diquark gap given in eq. (1). Finally, it would be interesting to extend the present work to the cases of lower temperature and larger lattice. These lattice studies would help us study the hadron masses Muroya:2002ry ; Hands:2007uc ; Wilhelm:2019fvp and the hadron-hadron interactions Ishii:2006ec ; Aoki:2009ji ; Takahashi:2009ef ; Ikeda:2011bs ; Amato:2015gea .
Acknowledgements.
We are grateful to S. Aoki, P. de Forcrand, K. Fukushima, K. Ishiguro, K. Nagata, A. Nakamura, A. Ohnishi and N. Yamamoto for useful comments. Discussions during the Yukawa Institute for Theoretical Physics (YITP) long-term international workshop on ”New Frontiers in QCD 2018” were useful to initiate this work. The numerical simulations were carried out on SX-ACE and OCTOPUS at Cybermedia Center (CMC) and Research Center for Nuclear Physics (RCNP), Osaka University, together with XC40 at YITP and Institute for Information Management and Communication (IIMC), Kyoto University. We also acknowledge the help of CMC in tuning the gradient-flow code. T.-G. L. acknowledges the support of the Seiwa Memorial Foundation. This work partially used computational resources of HPCI-JHPCN System Research Project (Project ID: jh180042 and jh190029) in Japan. This work was supported in part by Grants-in-Aid for Scientific Research through Grant Nos. 15H05855,18H01217, 18H05406, 18H01211 and 19K03875, which were provided by the Japan Society for the Promotion of Science (JSPS), and in part by the Program for the Strategic Research Foundation at Private Universities “Topological Science” through Grant No. S1511006, which was supported by the Ministry of Education, Culture, Sports, Science and Technology (MEXT) of Japan.References
- (1) B. P. Abbott et al. [LIGO Scientific and Virgo Collaborations], GW170817: Observation of Gravitational Waves from a Binary Neutron Star Inspiral, Phys. Rev. Lett. 119 (2017) 161101 [arXiv:1710.05832 [gr-qc]].
- (2) A. Andronic, P. Braun-Munzinger, K. Redlich and J. Stachel, Decoding the phase structure of QCD via particle production at high energy, Nature 561 (2018) 321 [arXiv:1710.09425 [nucl-th]].
- (3) Y. Aoki, S. Borsanyi, S. Durr, Z. Fodor, S. D. Katz, S. Krieg and K. K. Szabo, The QCD Transition Temperature: Results with Physical Masses in the Continuum Limit II., JHEP 0906 (2009) 088 [arXiv:0903.4155 [hep-lat]].
- (4) A. Bazavov et al., The Chiral and Deconfinement Aspects of the QCD Transition, Phys. Rev. D 85 (2012) 054503 [arXiv:1111.1710 [hep-lat]].
- (5) T. Schäfer and E. V. Shuryak, Instantons in QCD, Rev. Mod. Phys. 70 (1998) 323 [hep-ph/9610451].
- (6) Z. Fodor and S. D. Katz, Lattice Determination of the Critical Point of QCD at Finite T and , JHEP 0203 (2002) 014 [hep-lat/0106002].
- (7) Z. Fodor and S. D. Katz, Critical Point of QCD at Finite T and , Lattice Results for Physical Quark Masses, JHEP 0404 (2004) 050 [hep-lat/0402006].
- (8) S. Borsanyi, G. Endrodi, Z. Fodor, S. D. Katz, S. Krieg, C. Ratti and K. K. Szabo, QCD Equation of State at Nonzero Chemical Potential: Continuum Results with Physical Quark Masses at Order , JHEP 1208 (2012) 053 [arXiv:1204.6710 [hep-lat]].
- (9) M. G. Alford, A. Schmitt, K. Rajagopal and T. Schäfer, Color Superconductivity in Dense Quark Matter, Rev. Mod. Phys. 80 (2008) 1455 [arXiv:0709.4635 [hep-ph]].
- (10) E. Itou, K. Iida and T.-G. Lee, Topology of two-color QCD at low temperature and high density, PoS LATTICE 2018 (2018) 168 [arXiv:1810.12477 [hep-lat]].
- (11) S. Muroya, A. Nakamura and C. Nonaka, Monte Carlo study of two color QCD with finite chemical potential: Status report of Wilson fermion simulation, Nucl. Phys. Proc. Suppl. 94 (2001) 469 [hep-lat/0010073].
- (12) S. Muroya, A. Nakamura and C. Nonaka, Behavior of hadrons at finite density: Lattice study of color SU(2) QCD, Phys. Lett. B 551 (2003) 305 [hep-lat/0211010].
- (13) S. Muroya, A. Nakamura and C. Nonaka, Lattice study of QCD vacuum at finite baryon number density, Prog. Theor. Phys. Suppl. 149 (2003) 247.
- (14) K. Fukushima, Characteristics of the Eigenvalue Distribution of the Dirac Operator in Dense Two-Color QCD, JHEP 0807 (2008) 083 [arXiv:0806.1104 [hep-ph]].
- (15) J. B. Kogut, D. K. Sinclair, S. J. Hands and S. E. Morrison, Two color QCD at nonzero quark number density, Phys. Rev. D 64 (2001) 094505 [hep-lat/0105026].
- (16) J. B. Kogut, D. Toublan and D. K. Sinclair, The phase diagram of four flavor SU(2) lattice gauge theory at nonzero chemical potential and temperature, Nucl. Phys. B 642 (2002) 181 [hep-lat/0205019].
- (17) B. Allés, M. D’Elia and M. P. Lombardo, Behaviour of the topological susceptibility in two colour QCD across the finite density transition, Nucl. Phys. B 752 (2006) 124 [hep-lat/0602022].
- (18) S. Hands, S. Kim and J. I. Skullerud, Deconfinement in dense 2-color QCD, Eur. Phys. J. C 48 (2006) 193 [hep-lat/0604004].
- (19) S. Hands, P. Sitch and J. I. Skullerud, Hadron Spectrum in a Two-Colour Baryon-Rich Medium, Phys. Lett. B 662 (2008) 405 [arXiv:0710.1966 [hep-lat]].
- (20) S. Hands and P. Kenny, Topological fluctuations in dense matter with two colors, Phys. Lett. B 701 (2011) 373 [arXiv:1104.0522 [hep-lat]].
- (21) S. Cotter, P. Giudice, S. Hands and J. I. Skullerud, Towards the phase diagram of dense two-color matter, Phys. Rev. D 87 (2013) 034507 [arXiv:1210.4496 [hep-lat]].
- (22) T. Boz, S. Cotter, L. Fister, D. Mehta and J. I. Skullerud, Phase transitions and gluodynamics in 2-colour matter at high density, Eur. Phys. J. A 49 (2013) 87 [arXiv:1303.3223 [hep-lat]].
- (23) T. Boz, P. Giudice, S. Hands, J. I. Skullerud and A. G. Williams, Two-color QCD at high density, AIP Conf. Proc. 1701 (2016) 060019 [arXiv:1502.01219 [hep-lat]].
- (24) V. V. Braguta, E.-M. Ilgenfritz, A. Y. Kotov, A. V. Molochkov and A. A. Nikolaev, Study of the phase diagram of dense two-color QCD within lattice simulation, Phys. Rev. D 94 (2016) 114510 [arXiv:1605.04090 [hep-lat]].
- (25) J. B. Kogut, M. A. Stephanov and D. Toublan, On two color QCD with baryon chemical potential, Phys. Lett. B 464 (1999) 183 [hep-ph/9906346].
- (26) J. B. Kogut, M. A. Stephanov, D. Toublan, J. J. M. Verbaarschot and A. Zhitnitsky, QCD-like theories at finite baryon density, Nucl. Phys. B 582 (2000) 477 [hep-ph/0001171].
- (27) K. Splittorff, D. T. Son and M. A. Stephanov, QCD-Like Theories at Finite Baryon and Isospin Density, Phys. Rev. D 64 (2001) 016003 [hep-ph/0012274].
- (28) P. Adhikari, S. B. Beleznay and M. Mannarelli, Finite Density Two Color Chiral Perturbation Theory Revisited, Eur. Phys. J. C 78 (2018) 441 [arXiv:1803.00490 [hep-th]].
- (29) D. H. Rischke, D. T. Son and M. A. Stephanov, Asymptotic Deconfinement in High Density QCD, Phys. Rev. Lett. 87 (2001) 062001 [hep-ph/0011379].
- (30) D. T. Son and M. A. Stephanov, QCD at Finite Isospin Density: from Pion to Quark - Anti-Quark Condensation, Phys. Atom. Nucl. 64 (2001) 834 [Yad. Fiz. 64 (2001) 899] [hep-ph/0011365].
- (31) F. Sannino, N. Marchal and W. Schafer, Partial Deconfinement in Color Superconductivity, Phys. Rev. D 66 (2002) 016007 [hep-ph/0202248].
- (32) T. Schäfer, QCD and the Eta-Prime Mass: Instantons Or Confinement?, Phys. Rev. D 67 (2003) 074502 [hep-lat/0211035].
- (33) K. Fukushima and T. Hatsuda, The phase diagram of dense QCD, Rept. Prog. Phys. 74 (2011) 014001 [arXiv:1005.4814 [hep-ph]].
- (34) R. Rapp, T. Schäfer, E. V. Shuryak and M. Velkovsky, Diquark Bose condensates in high density matter and instantons, Phys. Rev. Lett. 81 (1998) 53 [hep-ph/9711396].
- (35) T. Kanazawa, T. Wettig and N. Yamamoto, Singular Values of the Dirac Operator in Dense QCD-Like Theories, JHEP 1112 (2011) 007 [arXiv:1110.5858 [hep-ph]].
- (36) T. Kanazawa, T. Wettig and N. Yamamoto, Banks-Casher-Type Relation for the Bcs Gap at High Density, Eur. Phys. J. A 49 (2013) 88 [arXiv:1211.5332 [hep-lat]].
- (37) G. S. Bali, G. Endrodi, R. V. Gavai and N. Mathur, Probing the Nature of Phases Across the Phase Transition at Finite Isospin Chemical Potential, Acta Phys. Polon. Supp. 10 (2017) 461 [arXiv:1610.00233 [hep-lat]].
- (38) M. Lüscher, Properties and uses of the Wilson flow in lattice QCD, JHEP 1008 (2010) 071 Erratum: [JHEP 1403 (2014) 092] [arXiv:1006.4518 [hep-lat]].
- (39) K. Iida, E. Itou and T.-G. Lee, in preparation.
- (40) S. Borsanyi et al., High-Precision Scale Setting in Lattice QCD, JHEP 1209 (2012) 010 [arXiv:1203.4469 [hep-lat]].
- (41) B. B. Brandt, G. Endrodi and S. Schmalzbauer, QCD phase diagram for nonzero isospin-asymmetry, Phys. Rev. D 97 (2018) 054514 [arXiv:1712.08190 [hep-lat]].
- (42) G. f. Sun, L. He and P. Zhuang, BEC-BCS crossover in the Nambu-Jona-Lasinio model of QCD, Phys. Rev. D 75, 096004 (2007) [hep-ph/0703159].
- (43) L. He, Nambu-Jona-Lasinio model description of weakly interacting Bose condensate and BEC-BCS crossover in dense QCD-like theories, Phys. Rev. D 82, 096003 (2010) [arXiv:1007.1920 [hep-ph]].
- (44) R. Contant and M. Q. Huber, Dense Two-Color QCD from Dyson-Schwinger Equations, arXiv:1909.12796 [hep-ph].
- (45) J. Wilhelm, L. Holicki, D. Smith, B. Wellegehausen and L. von Smekal, Continuum Goldstone spectrum of two-color QCD at finite density with staggered quarks, arXiv:1910.04495 [hep-lat].
- (46) N. Ishii, S. Aoki and T. Hatsuda, The Nuclear Force from Lattice QCD, Phys. Rev. Lett. 99 (2007) 022001 [nucl-th/0611096].
- (47) S. Aoki, T. Hatsuda and N. Ishii, Theoretical Foundation of the Nuclear Force in QCD and Its Applications to Central and Tensor Forces in Quenched Lattice QCD Simulations, Prog. Theor. Phys. 123 (2010) 89 [arXiv:0909.5585 [hep-lat]].
- (48) T. T. Takahashi and Y. Kanada-En’yo, Hadron-Hadron Interaction from Lattice QCD, Phys. Rev. D 82 (2010) 094506 [arXiv:0912.0691 [hep-lat]].
- (49) Y. Ikeda and H. Iida, Quark-Anti-Quark Potentials from Nambu-Bethe-Salpeter Amplitudes on Lattice, Prog. Theor. Phys. 128 (2012) 941 [arXiv:1102.2097 [hep-lat]].
- (50) A. Amato, P. Giudice and S. Hands, Hadron Wave Functions as a Probe of a Two-Color Baryonic Medium, Eur. Phys. J. A 51 (2015) 39 [arXiv:1501.03004 [hep-lat]].