Near-InfraredImagingofaSpiralintheCQTauDisk
Abstract
We present -band Keck/NIRC2 imaging and -band Subaru/AO188+HiCIAO polarimetric observations of CQ Tau disk with a new spiral arm. Apart from the spiral feature our observations could not detect any companion candidates. We traced the spiral feature from the -scaled HiCIAO polarimetric intensity image and the fitted result is used for forward modeling to reproduce the ADI-reduced NIRC2 image. We estimated the original surface brightness after throughput correction in -band to be mJy/arcsec2 at most. We suggest that the grain temperature of the spiral may be heated up to 200 K in order to explain both of the - and -bands results. The -band emission at the location of the spiral originates from the scattering from the disk surface while both scattering and thermal emission may contribute to the -band emission. If the central star is only the light source of scattered light, the spiral emission at -band should be thermal emission. If an inner disk also acts as the light source, the scattered light and the thermal emission may equally contribute to the -band spiral structure.
1. Introduction
Protoplanetary disks are good laboratories for understanding the relationship between planet formation and disk evolution mechanisms. Previous photometric/spectroscopic studies of young stellar objects (YSOs) with infrared (IR) excesses predicted gaps in their disks (transitional disk; Strom et al., 1989). As instruments have developed, high-spatial resolution observations with near-IR polarimetric imaging or (sub-)mm interferometry revealed more asymmetric disks with gaps (e.g., Hashimoto et al., 2012), rings (e.g., ALMA Partnership et al., 2015; Andrews et al., 2018), spirals (e.g., Muto et al., 2012; Benisty et al., 2015; Pérez et al., 2016; Uyama et al., 2018; Huang et al., 2018), dust traps (e.g., van der Marel et al., 2013), asymmetric blob in the disk midplane (e.g., Tsukagoshi et al., 2019), and velocity kink in gas kinematics (e.g., Pinte et al., 2018). In particular, spiral arms are one of the most intriguing signposts of planet formation in the disk because a protoplanet behaves as a perturber of the disk, which can lead to spiral formation (Zhu et al., 2015; Dong et al., 2018a), but yet no confirmed connection between an observed spiral arm and a planetary mass companion has been made observationally (but see Wagner et al., 2019). Gravitational instability in the disk can produce spirals (Dong et al., 2015a).
Radio continuum observations measure thermal emission of dust grains in the disk midplane and those at different excitations of gas such as CO(2-1) and CO(3-2) can probe the distribution of different layers of molecular gas species. Performing interferometric observation in radio wavelength enables to achieve sufficient spatial resolution to resolve detailed asymmetric structure. High-contrast broad-band imaging with a variety of differential imaging methods can sometimes detect intriguing disk features. Polarization differential imaging (PDI; Kuhn et al., 2001) provide polarimetric intensity (PI), which traces scattered starlight from the disk surface. Those explorations with angular differential imaging (ADI; Marois et al., 2008) for young planets, in parallel to disk studies, have not successfully detected the most convincing protoplanets within such disks until PDS 70b was reported recently (Keppler et al., 2018). The results of that paper support the theory that planets really form in protoplanetary disks. Interestingly, several -band observations successfully detected asymmetric disk features with ADI (e.g. HD 142527, HD 100546, and MWC 758; Rameau et al., 2012; Currie et al., 2015; Reggiani et al., 2018; Wagner et al., 2019). As Lyra et al. (2016) performed a 3D simulation and predicted that a high-mass planet can induce shocks and heats the spiral to a few hundred Kelvin (see Figure 4 in the paper), the -band observation has capability to detect thermal emission from the disk. In the near future one can expect to discover more planets undergoing formation and further searches for asymmetric disk features as well as for protoplanets will help to understand the links between planet formation and disk evolution.
CQ Tau (RA = 05:35:58.47, Dec = +24:44:54.1) is a YSO in the Taurus star forming region (F2-type, , 10 Myr, 162 pc; Natta et al., 2001; Gaia Collaboration et al., 2018; Ubeira Gabellini et al., 2019). observations by APEX and comparison with chemical models suggested that CQ Tau likely has a transitional disk (Chapillon et al., 2010). An ALMA observation reported a large gap in the 1.3-mm continuum, 13CO, and 18CO (Ubeira Gabellini et al., 2019). The gap sizes in the dust and gas are estimated at 56 au and 20 au in radius, respectively. Ubeira Gabellini et al. (2019) also performed a 3D numerical simulations and suggested an unseen protoplanet in the disk. To further search for protoplanets as well as asymmetric features in the CQ Tau disk, we used two high-contrast imaging observations with Keck/NIRC2 and Subaru/AO188+HiCIAO. Although we did not detect any companion candidates, we detected a spiral feature in the disk. In this study, we analyze the detected spiral feature and investigate the possible links to ongoing planet formation.
2. Observations and Results
We used two infrared data sets taken from Keck/NIRC2 and Subaru/AO188+HiCIAO. We also used an ALMA archival image, observed in Cycle 5 (ID: 2017.1.01404.S, PI: L. Testi), which achieved a noise level of 23 Jy/beam and a beam size of 69 mas and 51 mas for major-axis and minor-axis, respectively, for comparison with the infrared data. Details of this data set as well as other ALMA data of CQ Tau are described in Ubeira Gabellini et al. (2019). Table 1 summarizes observing logs for both observations. Sections 2.1 and 2.2 describe each observation and its result. Section 2.3 compares both results.
| Instrument | Date (UT) | Observing Mode | Band | Total Exposure Time [sec] |
|---|---|---|---|---|
| Keck/NIRC2 | 2018 December 24 | ADI | 1800 | |
| Subaru/HiCIAO | 2015 December 31 | PDI111Infrared Processing and Analysis Center, California Institute of Technology, 1200 E. California Blvd., Pasadena, CA 91125, USA | 540 |
2.1. Keck/NIRC2
CQ Tau was observed on UT 2018 Dec 24 (PI: D. Mawet) using the Keck/NIRC2 vortex coronagraph (Mawet et al., 2017; Serabyn et al., 2017; Xuan et al., 2018) combined with ADI. The observation achieved angular rotation of 111∘. No standard stars were taken in the same epoch and we did not conduct PSF subtraction by reference differential imaging (RDI; Ruane et al., 2019) in this study. We measured the off-axis PSF and determined that the full width at half maximum (FWHM) was 9.2 pix (00915 with a pixel scale of 9.972 mas/pix). After a first reduction including flat fielding, bad-pixel correction, sky-subtraction, and image registration, the data set was processed via the vortex image processing (VIP; Gomez Gonzalez et al., 2017)111https://github.com/vortex-exoplanet package that applies principal component analysis (PCA) for the ADI reduction (Amara & Quanz, 2012; Soummer et al., 2012).
|
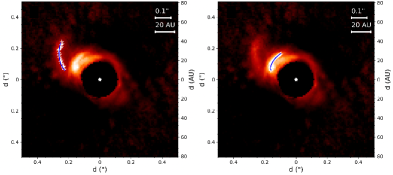
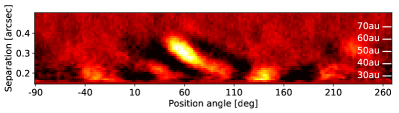
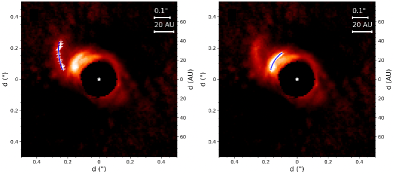
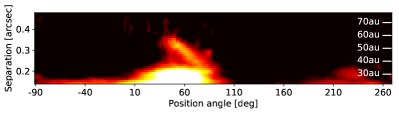
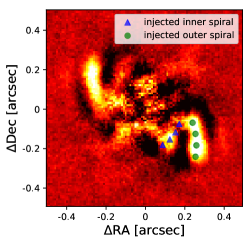
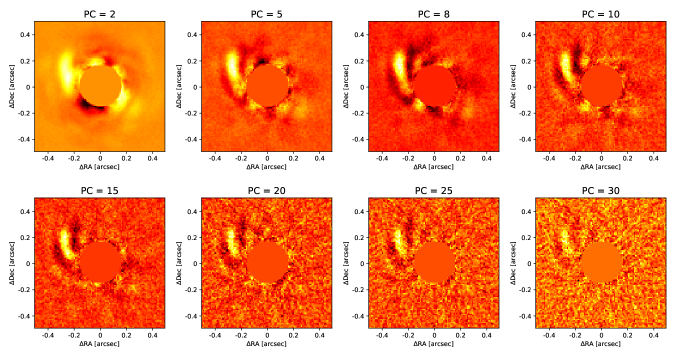
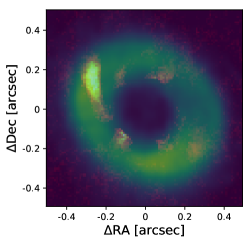
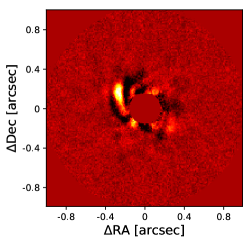
Figure 1 shows the Keck/NIRC2 ADI-reduced image of CQ Tau overlaid with the ALMA continuum (left) and Subaru/HiCIAO PI (right; see Section 2.2 for the data). VIP produces a set of different principal components (PCs), results of which are shown in Appendix A. We adopted principal component (PC)=8 among these PCs for presenting our result because this image shows an extended object at separations between and , and position angles (PAs) between and with signal-to-noise ratio (SNR) 7–8. The feature appears robust because it survives for a wide range of PC values (see Figure 7). We marginally found some other sources (see Figure 7) in a set of ADI-reduced images, whose SNRs fall less than 5 at a certain PC and do not discuss other companion candidates. We converted ADU into the surface brightness using a previous -band photometry (2.4 Jy for CQ Tau; McDonald et al., 2017) and the brightest region in this feature has 688.5 mJy/arcsec2. The VIP package enables to set different fields of view (FoV) and inner working angle (IWA). We adopted IWA=16 pix so that the asymmetric feature is reproduced with a higher SNR. We reran VIP by setting a smaller IWA to check whether other companion candidates appear at separations smaller than 16 pix and confirmed that there showed only residuals of speckles that vary among different PCs. We first attempted to fit this extended object with a point-source Gaussian, which provided a poor match and thus we concluded that it corresponds to an asymmetric structure in the CQ Tau disk. Figure 2 shows a polar-projected image suggesting that this feature likely corresponds to a spiral. CQ Tau is one of only a few systems that have a spiral detected in -band (see Section 1 for the L’-band disks).
We then compared our results with the ALMA archival data. The spiral overlaps with the ring of dust continuum, but the ADI-reduced signal experiences self-subtraction by the reduction algorithm as negative regions shown at both sides of the spiral. Centrosymmetric features in the CQ Tau disk are also removed by self-subtraction and thus cannot be seen in the ADI-reduced image (Milli et al., 2012).
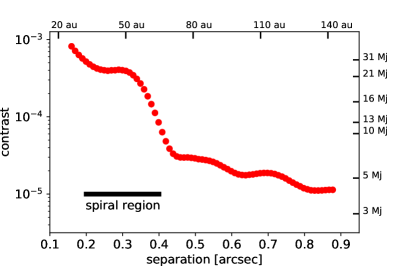
Apart from the spiral feature, we did not detect any companion candidates within from the central star. The NIRC2 figure with a larger field of view (FoV) is shown in Appendix A. We then calculated noise profiles as a function of separation relative to the signal from the central star. Figure 3 shows a 5 detection limit of the NIRC2 data. Although the spiral feature affects the detection limit between , we achieved 2.9 at 0. Compared with an evolutionary model (COND03; Baraffe et al., 2003) assuming 10 Myr, our contrast limit could constrain down to 5 outside the spiral.
2.2. Subaru/HiCIAO
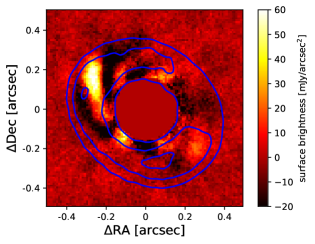
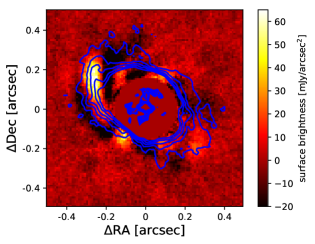
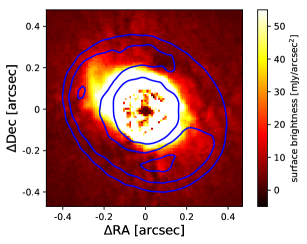
Subaru/AO188+HiCIAO observed CQ Tau in a combination of PDI and ADI as part of the SEEDS project (Tamura, 2009). No coronagraph was used in this observation. The total exposure time of the HiCIAO data is only 9 min with FWHM=5.3 pix (50 mas with a pixel scale of 9.5 mas/pix), which achieved an inner working angle of after the ADI reduction and is insufficient for searching planets embedded in the CQ Tau disk (for the ADI result at separations , see Uyama et al., 2017). In this study, we focus only on the PDI reduction. SEEDS adopted standard PDI (sPDI) and quad PDI (qPDI), where a different number of Wollaston prisms was used, and sPDI was applied to CQ Tau’s observation (for detailed information see Uyama et al., 2017). After the first reduction of destriping the HiCIAO pattern, flat fielding, distortion correction, and image registration, we reduced the polarimetric data sets by means of an IRAF pipeline222IRAF is distributed by National Optical Astronomy Observatory, which is operated by the Association of Universities for Research in Astronomy, Inc., under cooperative agreement with the National Science Foundation., which was used in previous HiCIAO PDI studies (e.g., Hashimoto et al., 2011, 2012). Figure 4 shows the PI image of CQ Tau overlaid with ALMA continuum. The whole disk cannot be investigated since there are residual speckles that cannot be removed through post-processing due to short exposure time. We did not detect a gap in the surface of CQ Tau’s disk. The PI image shows the spiral feature at the same location as shown in the NIRC2 image. In order to investigate the SNR of the spiral, we used perpendicular regions to the spiral whose PAs range 125∘-165∘, 305∘-345∘ for calculating a noise (defined as standard deviation in the specified area) radial profile. We finally confirmed that the spiral has an SNR5–6 in the PI image. There may be other disk features shown in the PDI-reduced image but below 5 significance due to speckles in the inner region. An -scaled PI image (see Figure 5 for a polar-projected image) clearly shows the spiral feature. There is another extended region at PAs between 10∘ and 90∘, which is perhaps another asymmetric feature and possibly detected in the NIRC2 data with PC=5, 8, and 10 in Figure 7 with insufficient significance. We discuss this inner feature in Section 2.3. We note that a gap-like feature close to the central star may be affected by -scaling because the original HiCIAO data set does not show such a feature (see the left image in Figure 4 for the PI signal and the right image in Figure 1 for the contour).
|
2.3. Comparison of the Two Data Sets
In both observations we clearly detected the spiral feature, which overlaps with the ring structure in the millimeter continuum detected by ALMA. The presence of the spiral is consistent with a prediction of 6–9 planet at 20 au (Ubeira Gabellini et al., 2019). However, our observation could not achieve a sufficient contrast limit to detect/constrain such a faint protoplanet. We checked whether a counterpart of the spiral is shown in the ALMA gas data. Tang et al. (2017) reported a pair of spirals for AB Aur at 12CO emission that correspond to the PI signal (Hashimoto et al., 2011). However, Ubeira Gabellini et al. (2019) did not show any clear spiral features in the 12CO data.
The right image in Figure 1 compares the NIRC2 and HiCIAO results and these shapes show a good agreement with each other. Polar-projected images (Figures 2 and 5) also clearly show that the spiral feature increases in distance from the central star. We note that the surface brightness in each band shows a different parameter. The NIRC2 and HiCIAO results correspond to total intensity and polarimetric intensity, respectively. We discuss the difference between these results in Section 3.2. We measured the pitch angle based on the best-fit logarithmic spiral to the trace of the spiral. The trace was identified as radial maxima in azimuthal bins of in the image obtained after deprojection using inclination and position angle of the major axis derived by Ubeira Gabellini et al. (2019): and PA. Since the spiral feature in the NIRC2 image experiences self-subtraction and is distorted by the reduction algorithm, we used only the HiCIAO data to measure the pitch angle. The PI data corresponds to scattering profiles from the disk surface and does not experience self-subtraction. The fitted result for the spiral (the central image in Figure 4) is . We also attempted to fit the extended inner region at PAs between 10∘ and 90∘. The result is shown in the right image of Figure 4 and the pitch angle is measured at deg. In addition to fits to the logarithmic spiral equation, we also fitted the spiral trace to the general Archimedean equation. The result is shown in Appendix A. We note that because scattered light originate from a cone-shape surface instead of a flat plane, when viewed at a finite inclination, different regions in the disk are compressed differently (e.g., Figure 4, Ginski et al. 2016). Because of this, a disk structure in surface density traced by mm continuum emission can be projected to a different location in scattered light (e.g., the southern spiral arm in MWC 758, Dong et al. 2018b). Simple deprojection by linearly expanding the disk along the minor axis by a factor of generally does not perfectly restore the face-on view of the disk (Dong et al., 2016). Therefore, our measurements of the arm pitch angles are approximations only. Future modeling work is needed to simultaneously determine the shapes of the disk surface and the spiral arms.
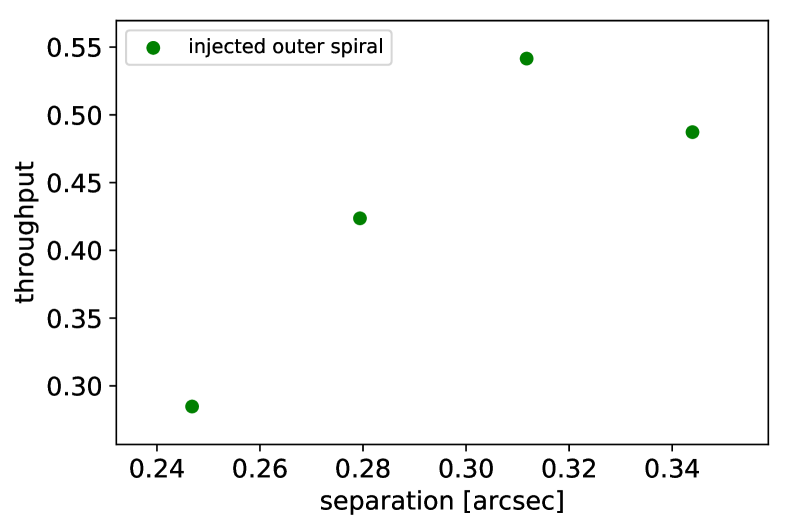
We used both fit results to infer input parameters for the forward modeling of the -band feature (for the detailed method for the forward modeling, see Christiaens et al., 2019) to measure a throughput (signal loss due to the ADI reduction); Figure 6 shows our result with injected spirals. We used the off-axis PSF of CQ Tau and injected fake PSFs at several separations and position angles to produce fake spiral features (injected positions shown in Figure 6). We then measured the ratio between input flux and output flux at the injected locations, which is shown in the right image of Figure 6. Our forward modeling reproduced the outer spiral with a flux recovered by a throughput of 0.54 at 50 au, which corresponds to 126 mJy/arcsec2 at the brightest region in the spiral. On the other hand, however, the injected inner spiral is largely affected (a throughput less than 0.3) by not only self-subtraction at small separations but also negative regions produced by the existence of the outer spiral. As the SNRs of this feature in the practical NIRC2 and HiCIAO data are less than 5, we do not conclude that this inner feature is a spiral.
The CQ Tau disk has a striking similarity with the disk around V1247 — both of which show one prominent arm in scattered light and a ringed disk in mm continuum emission (Ohta et al., 2016; Kraus et al., 2017). In addition, they share a similar inclination of , and the major spiral arm seen is in the direction of the major axis. Simulations have shown that while a massive companion may induce a pair of nearly symmetric spiral arms, when viewed at a modest inclination one of the arms may be compressed more than the other in scattered light, thus falling inside the inner working angle (Dong et al., 2016). Future observations may push for inner separations to look for possible additional arms hidden under the current image mask.
|
3. Discussion
The spiral feature in -band may be reproduced by two scenarios; 1) the spiral is heated and self-luminous or 2) the surface of the spiral scatters the stellar light as shown in the Subaru/HiCIAO image. Hereafter we use the peak values at the spiral region as a representative surface brightness. The spiral features extends over -scale, which is only a factor of larger than the angular resolution of the NIRC2 result. This prevents us to discuss discuss the detailed spiral profiles of the surface brightness distribution.
3.1. Disk Temperature
We first investigate whether the L′-band emission can be reproduced by thermal emission from small grains. We assume that the disk is optically thick at L′-band. If the observed emission of 126 mJy/arcsec2 is entirely due to thermal emission from optically thick dust, the temperature of the grains is expected to be 202.5K.
Provided that small grains at the spiral absorb shorter wavelengths of stellar light and emit their heat at 3–4 m, the grain temperature is given by the following equation
| (1) |
where is the absorption efficiency at and is the size of the grain. With this equation, we can derive a set of dust size () and albedo ( that can reproduce K. Here we assume for simplicity. This relation is compared with the model of astronomical silicate (Draine & Lee, 1984). We find a set of m and albedo0.2 can reproduce K and is consistent with the astronomical silicate model. The dust opacity () per unit dust mass (assuming gas-to-dust ratio is 100) is also estimated to be 3.4 cm2/g and 1.1 cm2/g at - and -bands, respectively. With the small grain surface density of 0.0375 g/cm2 of CQ Tau’s disk (Ubeira Gabellini et al., 2019), is assessed at larger than 30, which corresponds to the optically-thick disk. We note that current ALMA observations reported lower per unit dust mass (100 cm2/g at near IR; Birnstiel et al., 2018). With this value is estimated 3.75 and enough for the optically-thick disk.
With the temperature of 202.5 K, the disk aspect ratio () at the location of the spiral structure is estimated to be 0.15. Here, is the disk scale height, where and are the sound speed and the Keplerian angular velocity, respectively.
3.2. Scattering
We then investigate whether both of the results taken by Subaru/HiCIAO and Keck/NIRC2 can be reproduced by only scattering. As a rough estimate of the surface brightness of the scattered light, we use Equation (9) in Inoue et al. (2008), which is an approximate analytic expression of the scattered light (D’Alessio et al., 1999, 2006). With the modification for inclined disks (see also Jang-Condell & Turner, 2013), the observable intensity is given by the following equation
| (2) |
where , , , and are a grazing angle, albedo, a solid angle of the stellar photosphere from the spiral, and effective temperature of CQ Tau, respectively. is defined as the sum of inclination and . represents the law of diffuse reflection (Chandrasekhar, 1960) and is Planck’s law. Here, we assume (single scattering) for simplicity.333For a multi-scattering case, see also Equation (9) in Jang-Condell & Turner (2013).
To estimate the surface brightness of the scattered light from the spiral region, we used the disk and dust parameters estimated in Section 3.1. With this dust model, the albedo is about 0.4 at -band. The grazing angle (, where is a flaring index defined by ) is assumed to be (). was derived from Stefan-Boltzmann law with =6900 K and (Testi et al., 2001; Ubeira Gabellini et al., 2019). We used 50 au as a typical value for and for the disk’s inclination (Ubeira Gabellini et al., 2019). We finally assessed the expected scattered brightness as 62 and 8.5 mJy/arcsec2 at - and -band, respectively. Note that we do not take into account of polarization degree in the -band calculation. In the HiCIAO result, the spiral has surface brightness of 30–40 mJy/arcsec2 and does not show a large disagreement with the estimate. The NIRC2 result, however, is much brighter than the expected brightness in -band.
We note that CQ Tau has IR excess in its SED (Ubeira Gabellini et al., 2019). The inner disk with effective temperature of 1000 K may behave as another source of heating and scattering mechanisms at -band. Assuming that the inner disk contributes as the light source of the scattering more than the central star by an order of magnitude, the expected -band brightness of the spiral is mJy/arcsec2 and is comparable to the NIRC2 result. Therefore, both thermal emission and scattering may equally contribute to the spiral feature at -band, if the disk is heated up to 200 K at 50 au and the inner part of the disk contributes as a light source of scattering. Detailed discussions using radiative transfer modeling will help to have better understandings of the spiral feature.
3.3. Formation Scenario of the Spiral
We have seen that the disk temperature at 50 au can be 200 K, indicating that the disk aspect ratio is 0.15. The pitch angle of the spiral feature (in radian) is comparable with the disk aspect ratio if the spiral feature is due to spiral density wave in a differentially rotating disk (e.g., Rafikov, 2002; Bae & Zhu, 2018). However, the fitted pitch angle of the spiral from the -scaled HiCIAO image () is much larger than the expected . Tang et al. (2017) reported a large pitch angle in the AB Aur disk, which is similar to the CQ Tau case, and they predicted an unseen gaseous planet that coincides with the large pitch angle. As mentioned in Section 1, a high-mass planet can induce shocks and heats the spiral enough to be detected in -band (Lyra et al., 2016). The heating of the spiral arms driven by a massive companion may occur due to shock heating (15-20 deg; Zhu et al., 2015; Dong et al., 2015b). In this sense the prediction of Ubeira Gabellini et al. (2019) of an unseen protoplanet is consistent with a heated spiral scenario.
Several other mechanisms can induce a large pitch angle: gravitational instability (15–20 deg; Dong et al., 2015a) or shadow casting (20–25 deg; Montesinos et al., 2016; Montesinos & Cuello, 2018) Note that these studies, in many cases, assume vertically isothermal disk temperature profile. Juhász & Rosotti (2018) performed another simulation by assuming the disk surface is hotter than the midplane and showed that the spiral pitch angle near the surface can be more open compared to that at disk midplane. As we mentioned in Section 2.2, our fitted result of the pitch angle can be distorted by the inclination effect and we do not identify the mechanism to make a wide-open spiral. Combining gas observations of different emission lines enables to estimate the vertical temperature profile of the disk (Akiyama et al., 2011, 2013) and such future observations will help to understand the thermal structure of the spiral. Since the NIRC2 observation did not detect any companion candidates, follow-up observations to search for planets within 30 AU are required to further investigate this scenario.
4. Conclusion
We have newly detected a spiral in the CQ Tau disk using the Keck/NIRC2 -band imaging and Subaru/AO188+HiCIAO -band polarimetric imaging observations. The spiral feature overlaps with the ring structure in the ALMA continuum and is consistent with a prediction of jovian protoplanet at 20 au (Ubeira Gabellini et al., 2019). However, our observations did not confirm the presence of the gap reported by the ALMA observations. We did not detect any companion candidates within from the central star either. The 5 contrast limit could constrain down to 5 though it is affected by the spiral structures at separations of . We traced peaks of the spiral in the -scaled HiCIAO image to derive a pitch angle of the spiral (). This fitted result is also used for forward modeling to reproduce the ADI-reduced NIRC2 image and we estimated the original surface brightness in -band to be 126 mJy/arcsec2 at most.
We have investigated whether the -band emission can be reproduced by thermal emission. The observed emission of 126 mJy/arcsec2 corresponds to the brightness temperature temperature of 202.5 K. The temperature of dust grainds at the spiral location can be K if the grain size is 0.8 m and the albedo is 0.2 for an astronomical silicate model (Draine & Lee, 1984). The -band emission originates from the scattering from the disk surface while both scattering and thermal emission may contribute to the -band emission, depending on the condition of the inner disk.
Follow-up observations for the disk exploration as well as the companion search will help to understand this bright spiral feature. The -band profile for the spiral feature may be improved by high-contrast imaging with RDI. PDI observations with an updated AO instrument such as Subaru/SCExAO, Gemini/GPI, or VLT/SPHERE will also be able to provide clearer images of the disk, which helps to understand the disk characteristics by spatially resolving the spiral. Combining gas observations of different emission lines enables to estimate the vertical temperature profile of the disk.
References
- Akiyama et al. (2011) Akiyama, E., Momose, M., Hayashi, H., & Kitamura, Y. 2011, PASJ, 63, 1059, doi: 10.1093/pasj/63.5.1059
- Akiyama et al. (2013) Akiyama, E., Momose, M., Kitamura, Y., et al. 2013, PASJ, 65, 123, doi: 10.1093/pasj/65.6.123
- ALMA Partnership et al. (2015) ALMA Partnership, Brogan, C. L., Pérez, L. M., et al. 2015, ApJ, 808, L3, doi: 10.1088/2041-8205/808/1/L3
- Amara & Quanz (2012) Amara, A., & Quanz, S. P. 2012, Monthly Notices of the Royal Astronomical Society, 427, 948, doi: 10.1111/j.1365-2966.2012.21918.x
- Andrews et al. (2018) Andrews, S. M., Huang, J., Pérez, L. M., et al. 2018, ApJ, 869, L41, doi: 10.3847/2041-8213/aaf741
- Bae & Zhu (2018) Bae, J., & Zhu, Z. 2018, ApJ, 859, 119, doi: 10.3847/1538-4357/aabf93
- Baraffe et al. (2003) Baraffe, I., Chabrier, G., Barman, T. S., Allard, F., & Hauschildt, P. H. 2003, A&A, 402, 701, doi: 10.1051/0004-6361:20030252
- Benisty et al. (2015) Benisty, M., Juhasz, A., Boccaletti, A., et al. 2015, A&A, 578, L6, doi: 10.1051/0004-6361/201526011
- Birnstiel et al. (2018) Birnstiel, T., Dullemond, C. P., Zhu, Z., et al. 2018, ApJ, 869, L45, doi: 10.3847/2041-8213/aaf743
- Chandrasekhar (1960) Chandrasekhar, S. 1960, Radiative transfer
- Chapillon et al. (2010) Chapillon, E., Parise, B., Guilloteau, S., Dutrey, A., & Wakelam, V. 2010, A&A, 520, A61, doi: 10.1051/0004-6361/201014841
- Christiaens et al. (2019) Christiaens, V., Casassus, S., Absil, O., et al. 2019, MNRAS, 486, 5819, doi: 10.1093/mnras/stz1232
- Currie et al. (2015) Currie, T., Cloutier, R., Brittain, S., et al. 2015, ApJ, 814, L27, doi: 10.1088/2041-8205/814/2/L27
- D’Alessio et al. (2006) D’Alessio, P., Calvet, N., Hartmann, L., Franco-Hernández, R., & Servín, H. 2006, ApJ, 638, 314, doi: 10.1086/498861
- D’Alessio et al. (1999) D’Alessio, P., Calvet, N., Hartmann, L., Lizano, S., & Cantó, J. 1999, ApJ, 527, 893, doi: 10.1086/308103
- Dong et al. (2016) Dong, R., Fung, J., & Chiang, E. 2016, ApJ, 826, 75, doi: 10.3847/0004-637X/826/1/75
- Dong et al. (2015a) Dong, R., Hall, C., Rice, K., & Chiang, E. 2015a, ApJ, 812, L32, doi: 10.1088/2041-8205/812/2/L32
- Dong et al. (2018a) Dong, R., Najita, J. R., & Brittain, S. 2018a, ApJ, 862, 103, doi: 10.3847/1538-4357/aaccfc
- Dong et al. (2015b) Dong, R., Zhu, Z., Rafikov, R. R., & Stone, J. M. 2015b, ApJ, 809, L5, doi: 10.1088/2041-8205/809/1/L5
- Dong et al. (2018b) Dong, R., Liu, S.-y., Eisner, J., et al. 2018b, ApJ, 860, 124, doi: 10.3847/1538-4357/aac6cb
- Draine & Lee (1984) Draine, B. T., & Lee, H. M. 1984, ApJ, 285, 89, doi: 10.1086/162480
- Gaia Collaboration et al. (2018) Gaia Collaboration, Brown, A. G. A., Vallenari, A., et al. 2018, A&A, 616, A1, doi: 10.1051/0004-6361/201833051
- Ginski et al. (2016) Ginski, C., Stolker, T., Pinilla, P., et al. 2016, A&A, 595, A112, doi: 10.1051/0004-6361/201629265
- Gomez Gonzalez et al. (2017) Gomez Gonzalez, C. A., Wertz, O., Absil, O., et al. 2017, AJ, 154, 7, doi: 10.3847/1538-3881/aa73d7
- Hashimoto et al. (2011) Hashimoto, J., Tamura, M., Muto, T., et al. 2011, ApJ, 729, L17, doi: 10.1088/2041-8205/729/2/L17
- Hashimoto et al. (2012) Hashimoto, J., Dong, R., Kudo, T., et al. 2012, ApJ, 758, L19, doi: 10.1088/2041-8205/758/1/L19
- Huang et al. (2018) Huang, J., Andrews, S. M., Pérez, L. M., et al. 2018, ApJ, 869, L43, doi: 10.3847/2041-8213/aaf7a0
- Inoue et al. (2008) Inoue, A. K., Honda, M., Nakamoto, T., & Oka, A. 2008, PASJ, 60, 557, doi: 10.1093/pasj/60.3.557
- Jang-Condell & Turner (2013) Jang-Condell, H., & Turner, N. J. 2013, ApJ, 772, 34, doi: 10.1088/0004-637X/772/1/34
- Juhász & Rosotti (2018) Juhász, A., & Rosotti, G. P. 2018, MNRAS, 474, L32, doi: 10.1093/mnrasl/slx182
- Keppler et al. (2018) Keppler, M., Benisty, M., Müller, A., et al. 2018, A&A, 617, A44, doi: 10.1051/0004-6361/201832957
- Kraus et al. (2017) Kraus, S., Kreplin, A., Fukugawa, M., et al. 2017, ApJ, 848, L11, doi: 10.3847/2041-8213/aa8edc
- Kuhn et al. (2001) Kuhn, J. R., Potter, D., & Parise, B. 2001, ApJ, 553, L189, doi: 10.1086/320686
- Lyra et al. (2016) Lyra, W., Richert, A. J. W., Boley, A., et al. 2016, ApJ, 817, 102, doi: 10.3847/0004-637X/817/2/102
- Marois et al. (2008) Marois, C., Macintosh, B., Barman, T., et al. 2008, Science, 322, 1348, doi: 10.1126/science.1166585
- Mawet et al. (2017) Mawet, D., Choquet, É., Absil, O., et al. 2017, AJ, 153, 44, doi: 10.3847/1538-3881/153/1/44
- McDonald et al. (2017) McDonald, I., Zijlstra, A. A., & Watson, R. A. 2017, Monthly Notices of the Royal Astronomical Society, 471, 770, doi: 10.1093/mnras/stx1433
- Milli et al. (2012) Milli, J., Mouillet, D., Lagrange, A. M., et al. 2012, A&A, 545, A111, doi: 10.1051/0004-6361/201219687
- Montesinos & Cuello (2018) Montesinos, M., & Cuello, N. 2018, MNRAS, 475, L35, doi: 10.1093/mnrasl/sly001
- Montesinos et al. (2016) Montesinos, M., Perez, S., Casassus, S., et al. 2016, ApJ, 823, L8, doi: 10.3847/2041-8205/823/1/L8
- Muto et al. (2012) Muto, T., Grady, C. A., Hashimoto, J., et al. 2012, ApJ, 748, L22, doi: 10.1088/2041-8205/748/2/L22
- Natta et al. (2001) Natta, A., Prusti, T., Neri, R., et al. 2001, A&A, 371, 186, doi: 10.1051/0004-6361:20010334
- Ohta et al. (2016) Ohta, Y., Fukagawa, M., Sitko, M. L., et al. 2016, PASJ, 68, 53, doi: 10.1093/pasj/psw051
- Pérez et al. (2016) Pérez, L. M., Carpenter, J. M., Andrews, S. M., et al. 2016, Science, 353, 1519, doi: 10.1126/science.aaf8296
- Pinte et al. (2018) Pinte, C., Price, D. J., Ménard, F., et al. 2018, ApJ, 860, L13, doi: 10.3847/2041-8213/aac6dc
- Rafikov (2002) Rafikov, R. R. 2002, ApJ, 569, 997, doi: 10.1086/339399
- Rameau et al. (2012) Rameau, J., Chauvin, G., Lagrange, A. M., et al. 2012, A&A, 546, A24, doi: 10.1051/0004-6361/201219736
- Reggiani et al. (2018) Reggiani, M., Christiaens, V., Absil, O., et al. 2018, A&A, 611, A74, doi: 10.1051/0004-6361/201732016
- Ruane et al. (2019) Ruane, G., Ngo, H., Mawet, D., et al. 2019, AJ, 157, 118, doi: 10.3847/1538-3881/aafee2
- Serabyn et al. (2017) Serabyn, E., Huby, E., Matthews, K., et al. 2017, AJ, 153, 43, doi: 10.3847/1538-3881/153/1/43
- Soummer et al. (2012) Soummer, R., Pueyo, L., & Larkin, J. 2012, The Astrophysical Journal, 755, L28, doi: 10.1088/2041-8205/755/2/L28
- Strom et al. (1989) Strom, K. M., Strom, S. E., Edwards, S., Cabrit, S., & Skrutskie, M. F. 1989, AJ, 97, 1451, doi: 10.1086/115085
- Tamura (2009) Tamura, M. 2009, in American Institute of Physics Conference Series, ed. T. Usuda, M. Tamura, & M. Ishii, Vol. 1158, 11–16, doi: 10.1063/1.3215811
- Tang et al. (2017) Tang, Y.-W., Guilloteau, S., Dutrey, A., et al. 2017, ApJ, 840, 32, doi: 10.3847/1538-4357/aa6af7
- Testi et al. (2001) Testi, L., Natta, A., Shepherd, D. S., & Wilner, D. J. 2001, ApJ, 554, 1087, doi: 10.1086/321406
- Tsukagoshi et al. (2019) Tsukagoshi, T., Muto, T., Nomura, H., et al. 2019, ApJ, 878, L8, doi: 10.3847/2041-8213/ab224c
- Ubeira Gabellini et al. (2019) Ubeira Gabellini, M. G., Miotello, A., Facchini, S., et al. 2019, MNRAS, 486, 4638, doi: 10.1093/mnras/stz1138
- Uyama et al. (2017) Uyama, T., Hashimoto, J., Kuzuhara, M., et al. 2017, AJ, 153, 106, doi: 10.3847/1538-3881/153/3/106
- Uyama et al. (2018) Uyama, T., Hashimoto, J., Muto, T., et al. 2018, AJ, 156, 63, doi: 10.3847/1538-3881/aacbd1
- van der Marel et al. (2013) van der Marel, N., van Dishoeck, E. F., Bruderer, S., et al. 2013, Science, 340, 1199, doi: 10.1126/science.1236770
- Wagner et al. (2019) Wagner, K., Stone, J. M., Spalding, E., et al. 2019, ApJ, 882, 20, doi: 10.3847/1538-4357/ab32ea
- Xuan et al. (2018) Xuan, W. J., Mawet, D., Ngo, H., et al. 2018, AJ, 156, 156, doi: 10.3847/1538-3881/aadae6
- Zhu et al. (2015) Zhu, Z., Dong, R., Stone, J. M., & Rafikov, R. R. 2015, ApJ, 813, 88, doi: 10.1088/0004-637X/813/2/88
Appendix A Supplementary Keck/NIRC2 Images
We present supplementary images to clearly show our Keck/NIRC2 result. Figure 7 presents a set of different PCs. Figure 8 shows the NIRC2 results superimposed with the ALMA continuum (left) and a full FoV version of the VIP-ADI reduction (right). Figure 9 shows the best-fit Archimedean spirals () that reproduce well the observed features (left for the outer spiral: and right for the inner feature: ).
|