Dirac electron behavior and NMR evidence for topological band inversion in ZrTe5
Abstract
We report 125Te NMR measurements of the topological quantum material ZrTe5. Spin-lattice relaxation results, well-explained by a theoretical model of Dirac electron systems, reveal that the topological characteristic of ZrTe5 is -dependent, changing from weak topological insulator to strong topological insulator as temperature increases. Electronic structure calculations confirm this ordering, the reverse of what has been proposed. NMR results demonstrate a gapless Dirac semimetal state occurring at a Lifshitz transition temperature, K in our crystals. We demonstrate that the changes in NMR shift at also provide direct evidence of band inversion when the topological phase transition occurs.
ZrTe5 has attracted great interest as an exotic quantum material due to observations such as the chiral magnetic effect Li et al. (2016a) and 3D quantum Hall effect Tang et al. (2019). Initially, monolayer ZrTe5 was predicted to be a 2D topological insulator (TI) Weng et al. (2014), with bulk ZrTe5 argued to be either a weak TI (WTI) or strong TI (STI) Weng et al. (2014), where the latter implies a more robust protection of topological surface states from disorder, along with presence of a bulk gap. It was further predicted that a topological phase transition separates these TI states Manzoni et al. (2016); Fan et al. (2017) with a temperature-driven valence and conduction band inversion associated with the topological phase transition Manzoni et al. (2016). The tunable nature of these phases may be important in for example generating quantum surface states as the basis for quantum computation Lee et al. (2018).
Since these predictions were made, the topological nature of ZrTe5 has remained controversial. Angle-resolved photoemission spectroscopy (ARPES) studies Li et al. (2016a); Shen et al. (2017) and the observed chiral magnetic effect Li et al. (2016a) indicate a 3D Dirac semimetal state, also suggested by infrared Chen et al. (2015a), magneto-optical Chen et al. (2015b), and transport Zheng et al. (2016) measurements. Based on high-resolution ARPES, however, it was concluded that ZrTe5 should be a 3D WTI at low temperatures Moreschini et al. (2016). Scanning tunneling microscopy Li et al. (2016b); Wu et al. (2016) and Shubnikov-de Haas results Lv et al. (2018) also support a WTI interpretation, while other probes of the metallic surface states argued that ZrTe5 is a low- STI Manzoni et al. (2016, 2017). Regarding the topological phase transition, a recent infrared Xu et al. (2018) study suggested that ZrTe5 transits from WTI to STI with temperature decreasing, with the Dirac semimetal state appearing at the transition, while ARPES results Zhang et al. (2017) have shown the gap remaining open and the sample a WTI over the measured temperature range.
As a powerful technique, NMR has the capability of probing both Dirac electrons and orbital symmetry changes. Here, we describe 125Te NMR measurements supported by electronic structure calculations, characterizing the 3D Dirac topological nature of ZrTe5. The phase transition is shown to proceed from WTI to STI with increasing temperature associated with the bulk gap closing and reopening, while direct evidence of band inversion at the topological phase transition is established based on NMR shift measurements, demonstrating a significant capability for probing quantum materials.
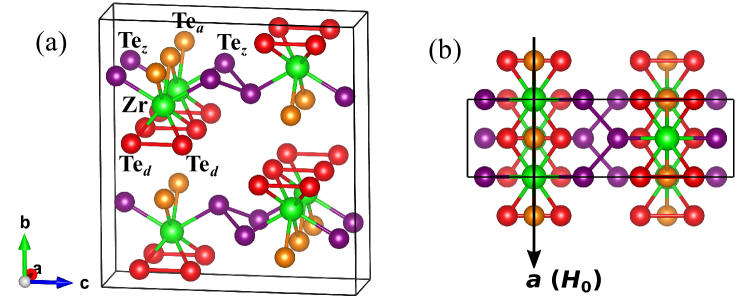
Figs. 1(a)-(b) show the ZrTe5 crystal structure, which can be treated as ZrTe3 chains connected by Te2 bridging atoms. ZrTe5 single crystals were prepared by chemical vapor transport (CVT). A ZrTe5 precursor was prepared by reacting stoichiometric amounts of Zr (99.9%) and Te (99.999%) in evacuated ampules at , then mixed with 5 mg/cm3 iodine and sealed in a quartz ampule under vacuum. The ampule was held in a 530 to gradient for one week, yielding needlelike single crystals.
Cameca SXFive microprobe measurements indicated a uniform phase ZrTe5.02±0.02, equivalent within resolution to the stoichiometric composition, and larger Te content than in some other reports Shahi et al. (2018); Li et al. (2018). No I or Hf was detected. Transport measurement showed a resistance anomaly at 125 K, typical for CVT samples. NMR experiments utilized a custom-built spectrometer at a fixed field T, aligning many crystals with parallel to . Note that minimizes magnetic quantum effects Shahi et al. (2018), providing a probe of an essentially unperturbed electronic structure. 125Te shifts were calibrated by aqueous Te(OH)6 and adjusted for its ppm paramagnetic shift to the dimethyltelluride standard Inamo (1996). Density functional theory (DFT) calculations were performed with WIEN2k Blaha et al. (2001) using Perdew, Burke, and Ernzerhof (PBE) exchange-correlation potential, with spin-orbit coupling, a -point grid of , and atom positions from experiment Fjellvåg and Kjekshus (1986). Calibration of calculated 125Te chemical shifts was based on the computed ZnTe shift Sirusi et al. (2016).
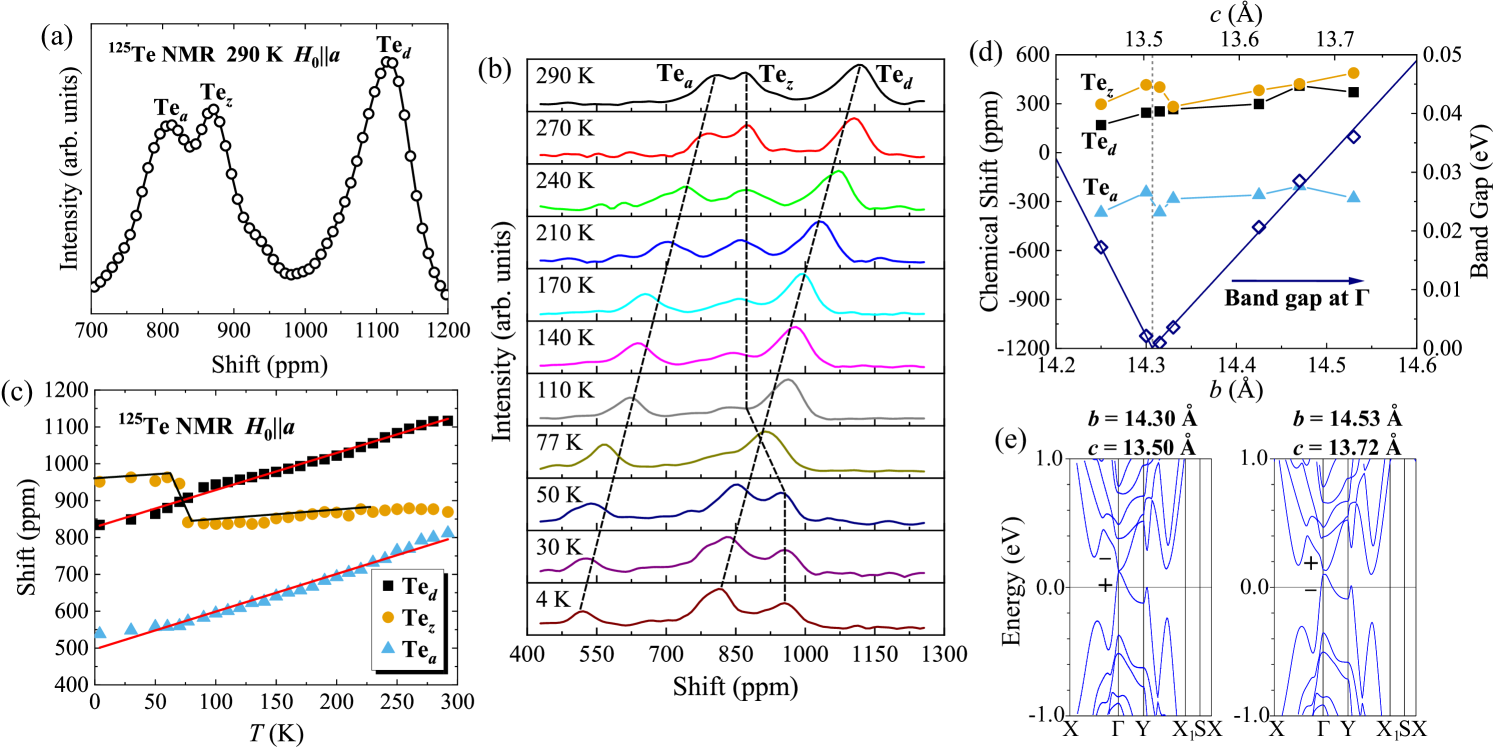
Fig. 2(a) shows a room-temperature 125Te NMR spectrum (), with peaks labeled corresponding to the three Te sites: apical (Tea), dimer (Ted), and zigzag (Tez) [Fig. 1]. Fig. 2(b) displays spectra vs temperature. Note that the number of nuclei in the expected topological edge states is negligible compared with that of the bulk so that the spectra represent the bulk. Fig. 2(c) shows shifts obtained by fitting to three Gaussian peaks. Site assignments aided by DFT will be discussed below.
While the Ted and Tea sites show similar behavior, steadily decreasing with temperature, Tez behaves somewhat differently, with a consistently larger line width, and about 25% smaller spectral area than expected. With the ZrTe3 chain believed to act as a rigid frame Fjellvåg and Kjekshus (1986), small separations and distortions of the layers apparently affect most strongly the zigzag sites causing the enhanced broadening.
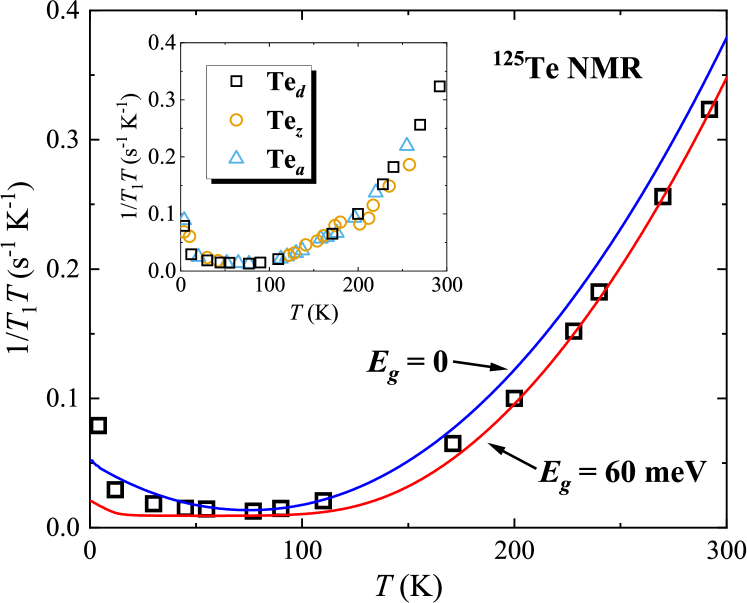
Spin-lattice relaxation, measured by inversion recovery, could be well fitted to a single exponential , giving values shown in Fig. 3. The observed minimum can be regarded as indicating a density of states minimum at for this temperature. In metals, is often dominated by -electron Fermi contact and proportional to . However, with Dirac and band-edge states in ZrTe5 dominated by Te states Weng et al. (2014), core polarization and dipolar hyperfine coupling would be expected to play more important roles. In most cases, these terms cause significant site dependence. Instead, the behavior shown in Fig. 3 is independent of site near the minimum.
A recent model of spin-orbit-based NMR relaxation in 3D Dirac and Weyl systems accounts for this behavior very well. In this theory Okvátovity et al. (2016); Maebashi et al. (2018), fluctuations in Dirac-type orbital currents are responsible for the relaxation. The orbital hyperfine interaction introduces a contribution to the momentum sum determining Okvátovity et al. (2016, 2019), thus connecting to fluctuations that are more extended in space than the typical local contributions, explaining the site-independence. The result is a quadratic minimum vs chemical potential () in the zero- limit as the Dirac point is traversed. This model was also applied to TaP Okvátovity et al. (2019), where pinned to a Weyl point leads to behavior. Here we show that this applies to the analogous case of Dirac electrons with a small gap, with steadily advancing through the Dirac point.
For massive Dirac fermions, the orbital contribution is Maebashi et al. (2018)
| (1) |
with . In addition, is the Fermi function, and is the Dirac electron density of states,
| (2) |
with a step function enforcing no states in the gap. The result is
| (3) |
where is an overall scale factor Okvátovity et al. (2019) accounting for details of the Bloch wavefunctions.
In fitting , we assumed is positioned in the conduction band at low temperature, and advances through the Dirac point as increases, consistent with the observed - to -type change Shahi et al. (2018); Miller et al. (2018) as well as ARPES measurements Zhang et al. (2017). By numerically integrating Eq. (3), we found that a linear decrease in vs gives results that agree with the higher-temperature data, but only with the gap set to meV. However, close to the minimum, the smaller curvature indicates a gap approaching zero. This is illustrated in Fig. 3 for the Ted site with gapless and gapped ( meV) cases shown by the labeled curves, with a very small s-1 K-1 term added to account for other relaxation contributions. In the calculation, we replaced by the product of the three experimental Fermi velocities reported by Tang et al. Tang et al. (2019), leading to m/s. The fitting at high temperatures gives , which can be compared to reported for the Weyl case for TaP Okvátovity et al. (2019). and appear only in the prefactor of Eq. (3); their variation leads to a small scaling of the overall results without affecting the final results in a significant way.
Within this model, we set and fitted vs . This yielded , K, and vs temperature shown in Fig. 4(a), clearly indicating a gap closing and opening. The closing point occurs at or very near , where crosses between bands. Results for Ted and Tea sites are quite similar as shown in the plot. The Tez shift crossover prevented measurement in the immediate vicinity of , although its behavior away from is similar to that of the other sites. These results agree well with those of Xu et al. Xu et al. (2018), although we find a larger high- gap. Also note that the fit shows that is positioned in the Dirac bands, rather than in the gap both above and below .
There have been several recent reports Yuan et al. (2016); Moreschini et al. (2016); Li et al. (2016b); Zhang et al. (2017); Lv et al. (2018); Tang et al. (2019) from Berry phase and surface imaging showing that the low- phase is a weak, rather than strong, TI. Based on these results, we can infer that the Lifshitz transition observed here corresponds to a change from WTI to STI as temperature increases. This is the reverse of what was initially proposed Manzoni et al. (2016); Fan et al. (2017), and provides a clearer picture of the topological phase transition.
DFT calculations confirm that the inversion proceeds from WTI to STI as increases. We initially scaled only , and obtained DFT results equivalent to those of Ref. Manzoni et al. (2016), with a gap closing at , and reopening with reversed parity at . It was shown Manzoni et al. (2016) that this corresponds to a change from STI to WTI with increasing . Similar results were obtained in Ref. Fan et al. (2017). However, we note that the experimental thermal expansion Fjellvåg and Kjekshus (1986) for and are essentially equal and much smaller for . Thus, we examined the case of and scaled equally with held constant. The result, shown in Fig. 2(d), is that the gap closes at , , for smaller instead of larger . Fig. 4(d) shows schematically an inferred phase boundary connecting the two inversion points identified this way. The parity of the band edges at is reversed at both inversion points. With the STI to WTI transition already demonstrated for the horizontal path in Fig. 4(d), the second inversion at also requires a change of the strong index and thus transition between STI and WTI Fu et al. (2007).
Between 293 and 10 K, changes from 14.53 to 14.47 Fjellvåg and Kjekshus (1986), with a corresponding reduction of . This range does not include the predicted crossing, however use of other exchange potentials may lead to adjustment of the predicted crossing point Weng et al. (2014). In addition strongly -type CVT crystals are reported to have smaller lattice constants Shahi et al. (2018) making it appear likely that thermal expansion indeed drives the topological transition illustrated in Fig. 4(d). This explains why the topological transition appears at higher temperatures in -type materials with reduced lattice parameters. It also suggests that -type crystals, reported to be semiconducting at all temperatures Chi et al. (2017); Shahi et al. (2018), are also STI down to zero temperature.
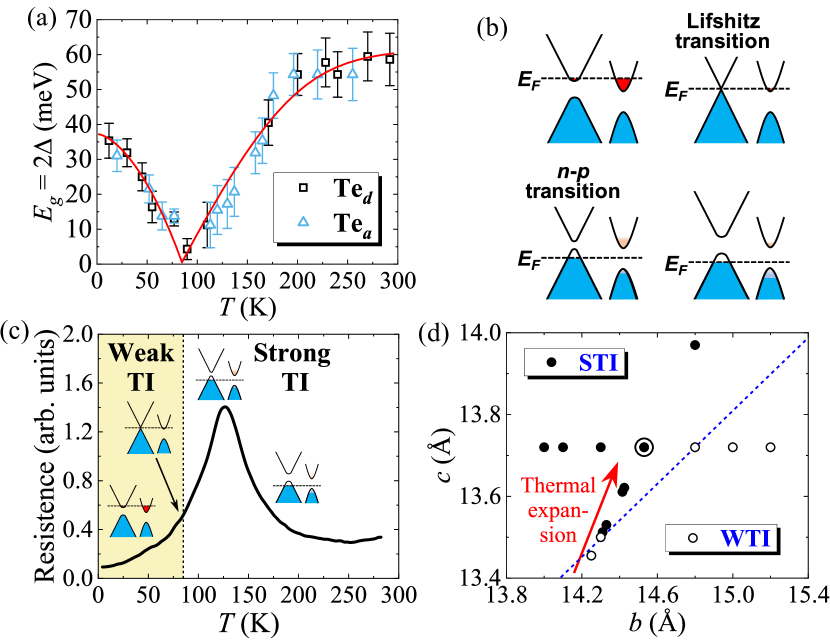
The difference between the Lifshitz transition temperature and - transition temperature can be well explained by a two-band model Chi et al. (2017); Shahi et al. (2018) as shown in Fig. 4(b). While the Lifshitz transition occurs when passes through the Dirac point, carriers are also transferred to other minima, especially the one between and , which is nearly degenerate with the Dirac point [Fig. 2(e)]. This is illustrated in Fig. 4(c) along with the measured resistance anomaly: (i) Below , there is -type metallic behavior with in the Dirac and secondary conduction bands. (ii) At , is at the Dirac point, which transits to a gapless semimetal state. With also crossing the secondary band edge, the carriers remain -type due to states at the parabolic minimum. (iii) moves away from the secondary conduction band edge, giving the - transition and the resistance anomaly. (iv) Increasing temperature produces metallic -type behavior.
The carriers in the secondary minima will induce NMR Knight shifts () through their on-site spin interactions. However, based on the observed resistivity maximum, it can be estimated Shahi et al. (2018) that our crystals have cm-3. For such carrier densities we estimate a contribution to which is negligible compared to the observed -dependent shifts; see for example computed Te shifts for Bi2Te3 in Ref. Boutin et al. (2016). Thus, the observed -dependence must be caused by Knight shifts associated with Dirac electron spins, and/or on-site chemical shifts () due to the induced paramagnetic response of the valence band.
For Dirac electrons, it was recently shown Okvátovity et al. (2016) that a significant dipole-generated could be expected. The limiting contribution is proportional to away from the Dirac point, thus linear in for the present case, with sign changing as the Dirac point is traversed. The dipole hyperfine field includes an angle-dependence which can lead to different magnitudes on each site, however, it seems likely that the nearly equivalent linear- behavior for the Ted and Tea shifts is due to the Dirac electrons, with a smaller contribution for Tez. Since these contributions vanish at where goes through zero, the underlying chemical shifts can be identified from the shifts at this point.
DFT calculations of are shown in Fig. 2(d), vs changes in and . The shifts for Ted and Tez are nearly identical, while for Tea the result is about 500 ppm more negative. This agrees with the observed shifts at , except for an overall negative shift. Although exchange potentials such as mBJ are expected to better reproduce the experimental shifts as opposed to PBE Sirusi et al. (2016), the relative positions are thus rather close to what is observed. The calculated change in vs lattice expansion is relatively small, indicating that Dirac electrons are the dominant source for the observed linear dependence. However, the step-like change in Tez shift at the inversion point is reproduced in the calculation of , which helps to confirm the site identification of NMR lines.
With associated with a local Van Vleck-type susceptibility due to partially filled Te states Slichter (1990), the step-like change in also indicates a rearrangement of filled orbitals at . The proposed band inversion was originally explained Weng et al. (2014) in terms of a change in stabilization of orbitals on Tez and Ted sites. An associated change in orbital occupation thus will modify , and this demonstrates that the NMR shifts in this case provide a direct measurement of the topological inversion, and thus further confirmation of the orbital interchange involved in the ZrTe5 transformation. There are few techniques providing a local measurement of atomic symmetry; thus this can be a significant capability for probing quantum materials.
In summary, we explored the electronic structure and topological nature of ZrTe5 using NMR techniques combined with DFT calculations. Results show that the Dirac band gap closes and reopens at a Lifshitz transition with temperature increasing, which corresponds to a topological phase transition from weak to strong topological insulator. We also show that the NMR results provide a very sensitive measure of the Dirac electrons involved in this transition. DFT calculations give further details about this band inversion, providing a better understanding of the topological phase transition. The observed shift change of Tez site at give direct evidence of the band inversion of symmetry occuring at the topological phase transition point.
Acknowledgements.
The authors acknowledge helpful discussions with Balázs Dóra. This work was supported by the Robert A. Welch Foundation, Grant No. A-1526.References
- Li et al. (2016a) Q. Li, D. E. Kharzeev, C. Zhang, Y. Huang, I. Pletikosić, A. V. Fedorov, R. D. Zhong, J. A. Schneeloch, G. D. Gu, and T. Valla, Nat. Phys. 12, 550 (2016a).
- Tang et al. (2019) F. Tang, Y. Ren, P. Wang, R. Zhong, J. Schneeloch, S. A. Yang, K. Yang, P. A. Lee, G. Gu, Z. Qiao, et al., Nature 569, 537 (2019).
- Weng et al. (2014) H. Weng, X. Dai, and Z. Fang, Phys. Rev. X 4, 011002 (2014).
- Manzoni et al. (2016) G. Manzoni, L. Gragnaniello, G. Autès, T. Kuhn, A. Sterzi, F. Cilento, M. Zacchigna, V. Enenkel, I. Vobornik, L. Barba, et al., Phys. Rev. Lett. 117, 237601 (2016).
- Fan et al. (2017) Z. Fan, Q.-F. Liang, Y. B. Chen, S.-H. Yao, and J. Zhou, Sci. Rep. 7, 45667 (2017).
- Lee et al. (2018) S. R. Lee, P. A. Sharma, A. L. Lima-Sharma, W. Pan, and T. M. Nenoff, Chem. Mater. 31, 26 (2018).
- Shen et al. (2017) L. Shen, M. X. Wang, S. C. Sun, J. Jiang, X. Xu, T. Zhang, Q. H. Zhang, Y. Y. Lv, S. H. Yao, Y. B. Chen, et al., J. Electron Spectrosc. Relat. Phenom. 219, 45 (2017).
- Chen et al. (2015a) R. Y. Chen, S. J. Zhang, J. A. Schneeloch, C. Zhang, Q. Li, G. D. Gu, and N. L. Wang, Phys. Rev. B 92, 075107 (2015a).
- Chen et al. (2015b) R. Y. Chen, Z. G. Chen, X.-Y. Song, J. A. Schneeloch, G. D. Gu, F. Wang, and N. L. Wang, Phys. Rev. Lett. 115, 176404 (2015b).
- Zheng et al. (2016) G. Zheng, J. Lu, X. Zhu, W. Ning, Y. Han, H. Zhang, J. Zhang, C. Xi, J. Yang, H. Du, et al., Phys. Rev. B 93, 115414 (2016).
- Moreschini et al. (2016) L. Moreschini, J. C. Johannsen, H. Berger, J. Denlinger, C. Jozwiak, E. Rotenberg, K. S. Kim, A. Bostwick, and M. Grioni, Phys. Rev. B 94, 081101(R) (2016).
- Li et al. (2016b) X.-B. Li, W.-K. Huang, Y.-Y. Lv, K.-W. Zhang, C.-L. Yang, B.-B. Zhang, Y. B. Chen, S.-H. Yao, J. Zhou, M.-H. Lu, et al., Phys. Rev. Lett. 116, 176803 (2016b).
- Wu et al. (2016) R. Wu, J.-Z. Ma, S.-M. Nie, L.-X. Zhao, X. Huang, J.-X. Yin, B.-B. Fu, P. Richard, G.-F. Chen, Z. Fang, et al., Phys. Rev. X 6, 021017 (2016).
- Lv et al. (2018) Y.-Y. Lv, B.-B. Zhang, X. Li, K.-W. Zhang, X.-B. Li, S.-H. Yao, Y. B. Chen, J. Zhou, S.-T. Zhang, M.-H. Lu, et al., Phys. Rev. B 97, 115137 (2018).
- Manzoni et al. (2017) G. Manzoni, A. Crepaldi, G. Autès, A. Sterzi, F. Cilento, A. Akrap, I. Vobornik, L. Gragnaniello, P. Bugnon, M. Fonin, et al., J. Electron Spectrosc. Relat. Phenom. 219, 9 (2017).
- Xu et al. (2018) B. Xu, L. X. Zhao, P. Marsik, E. Sheveleva, F. Lyzwa, Y. M. Dai, G. F. Chen, X. G. Qiu, and C. Bernhard, Phys. Rev. Lett. 121, 187401 (2018).
- Zhang et al. (2017) Y. Zhang, C. Wang, L. Yu, G. Liu, A. Liang, J. Huang, S. Nie, X. Sun, Y. Zhang, B. Shen, et al., Nat. Commun. 8, 15512 (2017).
- Shahi et al. (2018) P. Shahi, D. J. Singh, J. P. Sun, L. X. Zhao, G. F. Chen, Y. Y. Lv, J. Li, J.-Q. Yan, D. G. Mandrus, and J.-G. Cheng, Phys. Rev. X 8, 021055 (2018).
- Li et al. (2018) P. Li, C. H. Zhang, J. W. Zhang, Y. Wen, and X. X. Zhang, Phys. Rev. B 98, 121108(R) (2018).
- Inamo (1996) M. Inamo, Chem. Lett. 25, 17 (1996).
- Blaha et al. (2001) P. Blaha, K. Schwarz, G. K. H. Madsen, D. Kvasnicka, and J. Luitz, An Augmented Plane WaveLocal Orbitals Program for Calculating Crystal Properties (Karlheinz Schwarz, Technische Universität Wien, Austria, 2001).
- Fjellvåg and Kjekshus (1986) H. Fjellvåg and A. Kjekshus, Solid State Commun. 60, 91 (1986).
- Sirusi et al. (2016) A. A. Sirusi, S. Ballikaya, J.-H. Chen, C. Uher, and J. H. Ross Jr., J. Phys. Chem. C 120, 14549 (2016).
- Okvátovity et al. (2016) Z. Okvátovity, F. Simon, and B. Dóra, Phys. Rev. B 94, 245141 (2016).
- Maebashi et al. (2018) H. Maebashi, T. Hirosawa, M. Ogata, and H. Fukuyama, J. Phys. Chem. Solids 128, 138 (2018).
- Okvátovity et al. (2019) Z. Okvátovity, H. Yasuoka, M. Baenitz, F. Simon, and B. Dóra, Phys. Rev. B 99, 115107 (2019).
- Miller et al. (2018) S. A. Miller, I. Witting, U. Aydemir, L. Peng, A. J. E. Rettie, P. Gorai, D. Y. Chung, M. G. Kanatzidis, M. Grayson, V. Stevanović, et al., Phys. Rev. Appl. 9, 014025 (2018).
- Yuan et al. (2016) X. Yuan, C. Zhang, Y. Liu, A. Narayan, C. Song, S. Shen, X. Sui, J. Xu, H. Yu, Z. An, et al., NPG Asia Mater. 8, e325 (2016).
- Fu et al. (2007) L. Fu, C. L. Kane, and E. J. Mele, Phys. Rev. Lett. 98, 106803 (2007).
- Chi et al. (2017) H. Chi, C. Zhang, G. Gu, D. E. Kharzeev, X. Dai, and Q. Li, New J. Phys. 19, 015005 (2017).
- Boutin et al. (2016) S. Boutin, J. Ramírez-Ruiz, and I. Garate, Phys. Rev. B 94, 115204 (2016).
- Slichter (1990) C. P. Slichter, Principles of Magnetic Resonance (Springer, New York, 1990).